1589 YGG Eng 2015 May (F)
20
品質 Quality 速度 Speed 團隊 Team Work 卓越 Excellence May 2015 YG Group 1589TT 2 Disclaimer The information contained in this document was verified by an independent third party. YG does is not responsible for the accuracy, fairness, and completeness of any information contained in this document. You should not assume any information in this document to be accurate, fair, nor complete. The information or opinions contained in this document is provided on a specified date, which YG reserves all right to update. YG has no obligation to notify you of any updates after a specific date or any development of information in the documents. YG will not accept any liability for any loss resulting from the use of this document or its contents or for other reasons related to this document. This document does not constitute an offer or solicitation of an offer of purchase or acquisition to sell or issue shares of YG or any of its subsidiaries or related parties in any jurisdictions, does not serve as a part an offer or incentive, nor should be interpreted as such. Any part thereof or distribute the facts does not constitute the basis of any contract or commitment, and should not be relied upon in respect of any contract or commitment. Your acceptance of this document constitutes your agreement that the information contained in the document is kept strictly confidential, securities researchers should have eligibility of the securities research and follow any relevant securities laws and regulations and restrictions of the appropriate jurisdiction before publishing research results on YG. This document is provided for the securities researchers for use as their research reference only. Any part of the document cannot be photocopied, copied, forwarded, or in any manner, directly or indirectly transferred to any other person or for public announcement and for any other purpose.
Transcript of 1589 YGG Eng 2015 May (F)

品質 Quality 速度 Speed
團隊 Team Work 卓越 Excellence
May 2015
YG Group1589TT
2
Disclaimer The information contained in this document was verified by an independent third party. YG does is not responsible for the accuracy, fairness, and completeness of any information contained in this document. You should not assume any information in this document to be accurate, fair, nor complete. The information or opinions contained in this document is provided on a specified date, which YG reserves all right to update. YG has no obligation to notify you of any updates after a specific date or any development of information in the documents. YG will not accept any liability for any loss resulting from the use of this document or its contents or for other reasons related to this document.
This document does not constitute an offer or solicitation of an offer of purchase or acquisition to sell or issue shares of YG or any of its subsidiaries or related parties in any jurisdictions, does not serve as a part an offer or incentive, nor should be interpreted as such. Any part thereof or distribute the facts does not constitute the basis of any contract or commitment, and should not be relied upon in respect of any contract or commitment.
Your acceptance of this document constitutes your agreement that the information contained in the document is kept strictly confidential, securities researchers should have eligibility of the securities research and follow any relevant securities laws and regulations and restrictions of the appropriate jurisdiction before publishing research results on YG.
This document is provided for the securities researchers for use as their research reference only. Any part of the document cannot be photocopied, copied, forwarded, or in any manner, directly or indirectly transferred to any other person or for public announcement and for any other purpose.
3
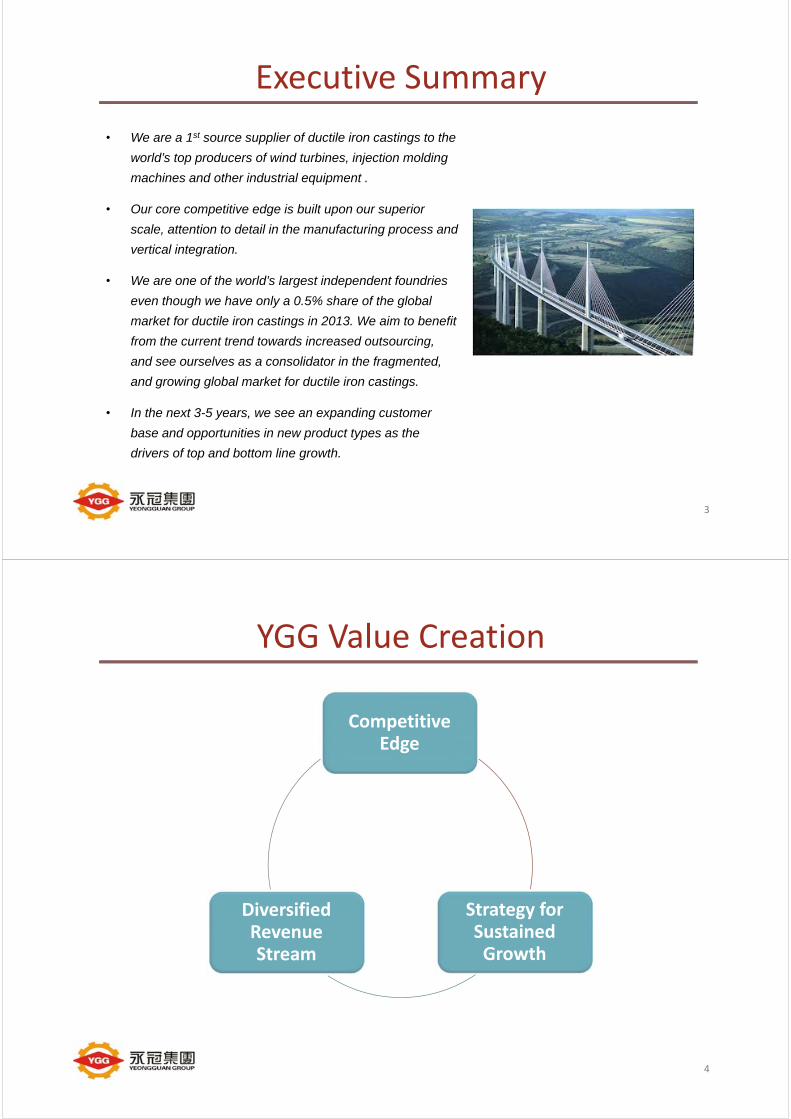
Executive Summary
• We are a 1st source supplier of ductile iron castings to the
world’s top producers of wind turbines, injection molding
machines and other industrial equipment .
• Our core competitive edge is built upon our superior
scale, attention to detail in the manufacturing process and
vertical integration.
• We are one of the world’s largest independent foundries
even though we have only a 0.5% share of the global
market for ductile iron castings in 2013. We aim to benefit
from the current trend towards increased outsourcing,
and see ourselves as a consolidator in the fragmented,
and growing global market for ductile iron castings.
• In the next 3-5 years, we see an expanding customer
base and opportunities in new product types as the
drivers of top and bottom line growth.
4
Competitive Edge
Strategy for Sustained Growth
Diversified Revenue Stream
YGG Value Creation

5
Competitive Edge
Strategy for Sustained Growth
Diversified Revenue Stream
YGG Value Creation
6
YGG’s Competitive Edge
Attention to Detail in the Casting Process
Scale Advantage
One‐Stop Shopping (Vertical
Integration)
Cost Advantage
Experienced Management
Team

7
Attention to Detail in the Casting ProcessMaterials Science Know-How
The purity and concentration of 26 chemical elements is monitored at all stages of the production process.
Spheroidal graphite nodules enhance the strength of ductile iron. The highest recorded concentration is 300/mm2. YGG can achieve 280/mm2. Over the past ten years, YGG has helped one client reduce cycle times for their injection molding equipment to 4 seconds from 10 seconds by steadily improving nodule count.
Advanced Process Controls
SOLIDCast software simulates thermal changes in the casting during the solidification process to show potential defects, greatly reducing failure rates.
YGG’s process control know-how allows us to produce Ductile Cast Iron with high yield strength and high toughness at low temperature.
Investment in Superior Plant Equipment and Design
Proprietary Design: YGG stipulates its own specifications for key pieces of casting equipment, subcontracting production to an overseas supplier.
Allowance for Extra-Large Castings: Casting facilities can accomodate larger castings than those of YGG‘s peers, and overhead cranes are rated for heavier loads.
Advanced Inspection Equipment: YGG has invested in advanced testing equipment and performs precision testing services for customers with tight tolerance specifications.
Geothermal heating facilities maintain a stable temperature in the machine shop in both summer and winter to ensure precision in the machining process.
Attention to Detail
8
Not Your Average Foundry
* Based on 2013 output 112,339 tonnes per foundry.Source:Modern Casting Magazine, December 2014
Scale Advantage
22,468
8,659
6,122 4,085 3,417 2,815 2,656 2,272 2,133 1,813 1,483
-
5,000
10,000
15,000
20,000
25,000
Average Output Per Foundry*Tonnes per annum

9
Casting Capacity
FoundryDesign Capacity
Max. SingleWeight*
1986 YGA Taipei 8,400 T/Yr 8 Tons
1995 YGD Dongguan 18,000 T/Yr 12 Tons
2002 YGS Ningbo 36,000 T/Yr 45 Tons
2002 YGL Ningbo 36,000 T/Yr 25 Tons
2008 YGB Liyang 60,000 T/Yr 60 Tons
subtotal 158,400 T/Yr
New Capacity
4Q16 YG‐Thailand 48,000 T/Yr Non‐Energy Application
4Q16 YG‐Taichung 48,000 T/yr Energy Application
*The maximum size of casting that can be produced at each respective foundry.
Scale Advantage
10
One Stop Shopping
Vertical and horizontal process integration.
We provide end-to-end satisfaction of customer needs from pattern design, casting, welding, painting, machining and assembly – all at YGG.
Total Solution
Casting
Machining
Painting
Design
Welding
Assembly
Casting Machining Inspection Welding Assembly
One Stop Shopping

11
Cost Advantage
YGG’s cost competitiveness stems from:
Low RM cost: Cash purchases and pro-active inventory management
Economies of scale in production
Attention to detail: low defect rate of 0-3% reduces waste.
Vertical integration: Yeo-Tian, a 100%-owned steel scrap merchant, helps YGG lower scrap steel acquisition costs.
Cost Advantage
2,000
2,500
3,000
3,500
4,000
4,500
5,000
5,500
6,000
Jan-08 Dec-08 Nov-09 Oct-10 Sep-11 Aug-12 Jul-13 Jun-14
RMB/kgPig Iron Price
Market Price
2000
2500
3000
3500
4000
4500
5000
5500
6000
Jan-08 Dec-08 Nov-09 Oct-10 Sep-11 Aug-12 Jul-13 Jun-14
Market PriceYGG Class-A Scrap…
Scrap Steel PriceRMB/kg
12
Experienced and Stable Management Team
Hsien-Ming ChangFounder and ChairmanOver 35-yrs experienceChairman of YGG Co.
Andy Tsai Vice Chairman37-yrs experience General Manager of Shieh-Yih Machinery Co.Metal Industries R&D Centre
Fred KongVice President, Sales Director8-yrs experience General Manager of Suzhou Liang-Chi Motor Vice President of Suzhou TECO Co.
Wen-Lung ChangExecutive Vice PresidentChairman of YGA Co.23-yrs experience General Manager of YGG Co.
Rui GuoVice President, R&D Director18-yrs experience Engineer of Jiang-Dong Machinery Co.
Ching-Hsiung Hsu Vice PresidentGeneral Manager of Ning-Po YGS Co.40-yrs experience Vice President of Chen-Hsing Industrial Co.
Wu-Chi Chen Executive Vice PresidentGeneral Manager of Dong-Guan YGD Co.44-yrs experience Vice President of YGG Co.
Vicky LinVice President, Finance Director10-yrs experience Deloitte Taiwan
Tai-Fon Lin Vice PresidentGeneral Manager of Ning-Po YGL Co.10-yrs experience Vice President of GS Machinery Co.
Manage‐mentTeam

13
Competitive Edge
Strategy for Sustained Growth
Diversified Revenue Stream
YGG Value Creation
14
1st Source Supplier to Global Leaders

15
Revenue by Application
41%
26% 27%
6%
48%
25%22%
5%
0%
10%
20%
30%
40%
50%
60%
70%
Wind Power InjectionMolding
IndustrialMachinery
MedicalEquipment
2014/2013 Sales Breakdown by
Application
2013 2014
37%
26%28%
8%
60%
20%
14%
6%
0%
10%
20%
30%
40%
50%
60%
70%
Wind Power InjectionMolding
IndustrialMachinery
MedicalEquipment
15Q1/14Q1 Sales Breakdown by
Application
14Q1 15Q1
16
S group, 19.4%
GE energy, 12.4%Nordex, 7.8%
Gamesa, 7.5%
Elekta, 5.7%
Engel, 3.5%
Milacron, 3.5%
Envision, 3.2%
K, 3.0% Sumitomo DEMAG, 2.8%
15Q1 Revenue by Customer15Q1 Main Customers 15Q1 Top 5 Wind Power customers
15Q1 Top 5 Injection Molding Machine Customers 15Q1 Top 5 Industrial Machinery Customers
Main customer chart is % of YGG total sales. All other charts are percent of sales for that segment.
33%
21%
13% 12%
5%
0%
5%
10%
15%
20%
25%
30%
35%
S group GE energy Nordex Gamesa Envision
17% 17%
15%14%
7%
0%
5%
10%
15%
20%
Engel Milacron K SumitomoDEMAG
Nissei
14%
9%
5% 4% 4%
0%
2%
4%
6%
8%
10%
12%
14%
16%
Atlas Bobst Zitai Wartsila Yamada

17
S Group, 12.2%
GE Energy, 11.4%
Nordex, 7.9%Elekta, 6.0%
Engel, 5.6%
Milacron, 4.6%
Gamesa, 3.7%
Sumitomo DEMAG, 3.4%
K, 3.4%H, 3.4%
2014/2013 Revenue by Customer
2013 Main Customers
Main customer chart is % of YGG total sales. All other charts are percent of sales for that segment.
S Group, 15.8%
GE Energey, 11.0%
Nordex, 6.4%Engel, 5.2%
Elekta, 5.1%
Milacron, 4.7%
Gamesa, 4.6%
K, 3.3%
SACMI, 2.9%
Sumitomo DEMAG, 2.9%
2014 Main Customers
18
Competitive Edge
Strategy for Sustained Growth
Diversified Revenue Stream
YGG Value Creation

19
YGG 5‐Year Goals
New Products, New Customers
Establish New Production Base
(Thailand, Taichung)
Increase Total Capacity by 75%
To be One of The World’s Leading Manufacturer of Ductile Casting Iron
20
New Products, New Customers
Product Customer
Wind Power* Worldwide Windmill Producers
Earth-Moving and Agricultural Equipment
Automotive Stamping Molds
Overhead Cranes, Infrastructure
US Multinationals
Major Global Automaker
Manufacturers, Municipalities
*Existing application
We are receiving enthusiastic interest from new and existing customers. This should increasingly allow YGG to pick and choose our products, leading to a higher end product mix and enhanced profitability.
Note: These are product areas and customers that we are targeting to drive growth. In most cases, there are no commitments from customers to do business with YGG at this time, though in most cases target customers have expressed interest in YGG or have approached us.

21
Consolidating Share in a Fragmented, Growing Market
Market GrowthMarket Growth
YGG as ConsolidatorYGG as Consolidator
Industry Trends Favor YGG
Industry Trends Favor YGG
Modern Casting Magazine estimates that global shipments of ductile iron reach a total of 25.06mn tonnes in 2013. Worldwide top 5 countries is Chinese, Germany, Japan, India and South Korea.
YGG’s share of the global ductile cast iron market is only 0.5% and our output represents only 1% of the total output of Chinese foundries.
Given the high number of small and inefficient players in the market (30K foundries in China alone), we believe that we can steadily increase our share.
One of the ductile iron industry’s most pronounced trends is the migration of production capacity to Asia, in particular China, India and South Korea. While production output in these countries has risen rapidly, there has been a steady decline in production in Europe, Japan and Russia.
YGG is one of a handful independent foundries that can meet the quality and quantity demands for large modern castings. YGG has been upgrading its facilities while competitors in mature markets have been scaling down their output. For example, from 2007‐2013, average annual output per foundry in Japan declined from 4,089 tonnes to 2,656 tonnes.
22
• Shipments: We target 2015 shipments of 150,000 tonnes, +10% YoY growth.
• Product Mix:
• Capex:We plan to spend a total of NT$2.5bn on facility investment in 2015‐2017. 2014 total capex spending was NT$548mn.
2015 Outlook
(% of total revenue) 2013 2014E 2015F
Energy 41 48 55‐60
Plastic Injection Molding 26 25 40‐45Industrial Machinery &
Others33 27

23
Our Commitment to Shareholders
• We pledge that our primary focus will be the maximization of returns to our shareholders via the profitable long‐term growth of our ductile iron casting business
• We aim to sustain revenue and earnings growth superior to that of our peers and the overall industry
• We intend to maintain a cash dividend payout in excess of 50%
24
Financial Results

25
4,031
3,179
4,425
5,261 5,261 5,899
7,206
2008 2009 2010 2011 2012 2013 2014
467 387
572
402
547
861
1,349
2008 2009 2010 2011 2012 2013 2014
11.6% 12.2%12.9%
7.6%
10.4%
14.6%
18.7%
25.7% 25.9% 25.0%
20.0%
23.1%
28.6%31.5%
Revenues NTD$ million
Gross Margin %
Operating Profit NTD$ million
Operating Margin %
2008‐2014 Revenues and Operating Profit
26
367 267
466
298 370
541
1,002
2008 2009 2010 2011 2012 2013 2014
6.46
4.05
5.83
3.72 3.795.36
9.78
EPS NTD Net Income NTD$ million
14.1
7.8
10.8
6.3 6.9
9.0
14.1
5.7
6.0
7.0
3.8 4.4
6.8
9.9
2008 2009 2010 2011 2012 2013 2014
ROE % ROA %
2008‐2014 Financial Highlights

27
Five‐year P&L (Consolidated)
NTD$ million
2009 2010 2011 2012 2013 2014
SalesRevenue
3,179 4,425 5,261 5,261 5,899 7,206
Gross Profit 825 1,108 1,052 1,215 1,687 2,258
OP Profit 387 572 402 547 861 1,349
Incomebefore tax
319 573 368 464 730 1,321
Net Income 267 466 298 370 541 1,002
EPS (NTD$) 4.05 5.83 3.72 3.79 5.36 9.78
YOY (%)
2010 2011 2012 2013 2014
39.2 18.9 0.0 12.1 22.2
34.3 (5.1) 15.5 38.8 33.8
47.9 (29.8) 36.1 57.4 56.5
79.7 (35.9) 26.2 57.3 81.1
74.5 (36.2) 24.5 46.2 85.1
44.0 (36.2) 1.9 41.4 82.5
28
NT$ million 2009 2010 2011 2012 2013 2014 YOY (%)
2010 2011 2012 2013 2014
TOTAL ASSETS 6,366 6,999 8,627 8,365 9,506 11,678 9.9 23.3 (3.0) 13.6 22.9
Cash 503 688 944 1,430 1,557 2,942 36.7 37.2 51.5 8.9 89.0
NR & AR 841 1,255 1,654 1,403 1,938 1,994 49.3 31.7 (15.1) 38.1 2.9
Inventory 775 661 992 941 1,106 1,411 (14.8) 50.2 (5.2) 17.5 27.6
Fixed Asset 3,112 3,826 4,338 3,997 4,021 4,310 23.0 13.4 (7.9) 0.6 7.2
TOTAL LIABILITIES 2,126 2,541 3,544 2,664 3,207 3,621 19.5 39.5 (24.8) 20.4 12.9
Bank Loans 1,334 1,883 2,649 1,856 1,789 412 41.2 40.7 (29.9) (3.6) (77.0)
NP & AP 343 403 553 478 977 1,200 17.4 37.4 (13.5) 104.4 22.8
Accrued Expenses 99 125 162 175 274 405 26.1 30.1 7.7 56.6 48.0
TOTAL EQUITY 4,240 4,458 5,083 5,702 6,299 8,057 5.1 14.0 12.2 10.5 27.9
Capital 32 800 800 1,009 1,009 1,049 2,376 0.0 26.1 0.0 4.0
Additional Paid‐in Capital
3,934 3,166 3,166 3,548 3,548 4,046 (19.5) 0.0 12.1 0.0 14.0
Retained Earnings 345 811 1,109 1,316 1,666 2,315 135.0 36.7 18.7 26.6 38.9
A/R Turnover Days 111 89 102 107 106 102
Inventory Turnover Days
125 81 75 91 92 96
A/P Turnover Days 71 41 41 47 63 80
Five‐year Balance Sheet (Consolidated)

29
Dividend Payout
( NTD Million ) 2011 2012 2013 2014
Net income 298 370 541 1,002
Cash dividend 13 262 353 667
Dividend p/s (NT$) 0.15 2.6 3.5 6.36
Cash yield (%) 0.5*1 5.2*2 2.4 *3 3.8 *4
Payout ratio (%) 5% 71% 65% 65%
Notes:
1. 2011 yield is based on YGG’s closing share price on Oct 15, 2012; the day before ex-dividend day.
2. 2012 yield is based on YGG’s closing share price on August 8, 2013; the day before ex-dividend day.
3. 2013 yield is based on YGG’s closing share price on June 23, 2014; the day before ex-dividend day.
4. 2014 yield is based on YGG’s closing share price on March 13, 2015.
30
Quarterly P&L (Consolidated)
NTD$ million 1Q13 2Q13 3Q13 4Q13 1Q14 2Q14 3Q14 4Q14
Sales Revenue
1,169 1,415 1,631 1,684 1,636 1,949 1,787 1,834
Gross Profit 296 367 484 540 491 641 562 564
OP Profit 135 166 260 300 294 404 313 338
Income before tax
113 162 249 206 267 398 297 359
Net Income 85 124 187 145 208 300 226 268
EPS (NTD$) 0.84 1.23 1.85 1.44 2.06 2.97 2.19 2.56

31
Appendix
32
The Casting Process

33
Casting Applications
34
Welding Service

35
Assembly Service
36
Applications I
37
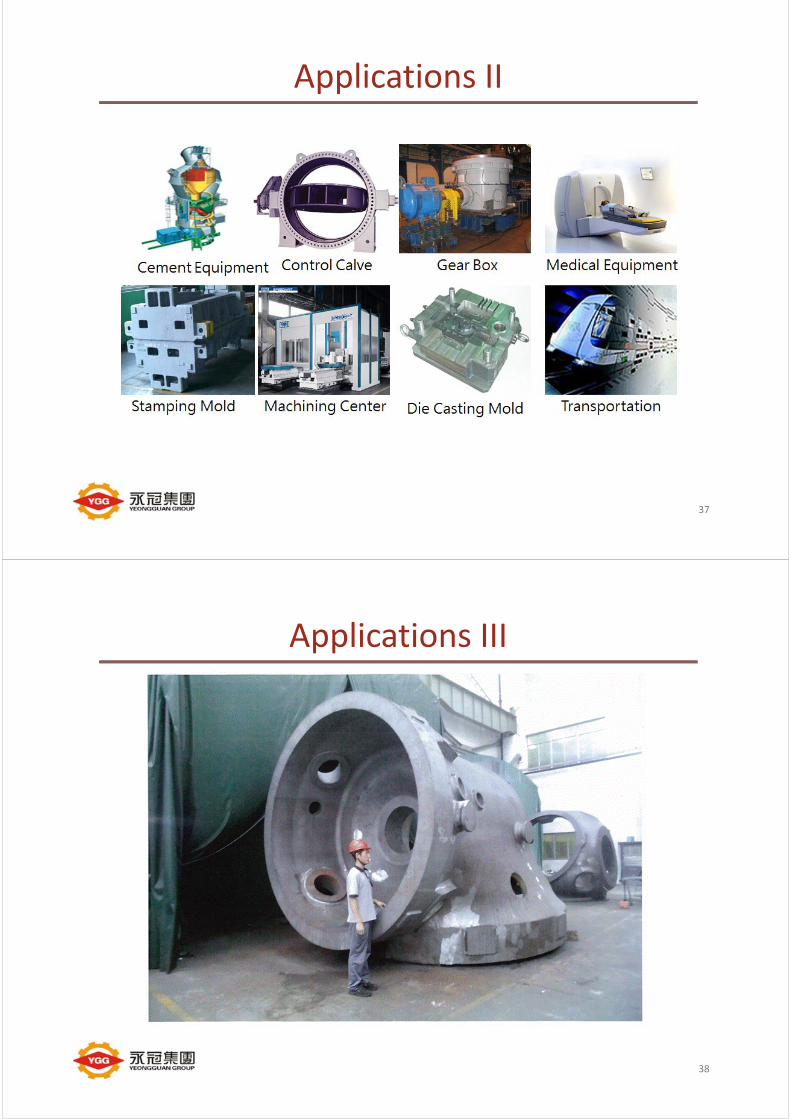
Applications II
38
Applications III
39
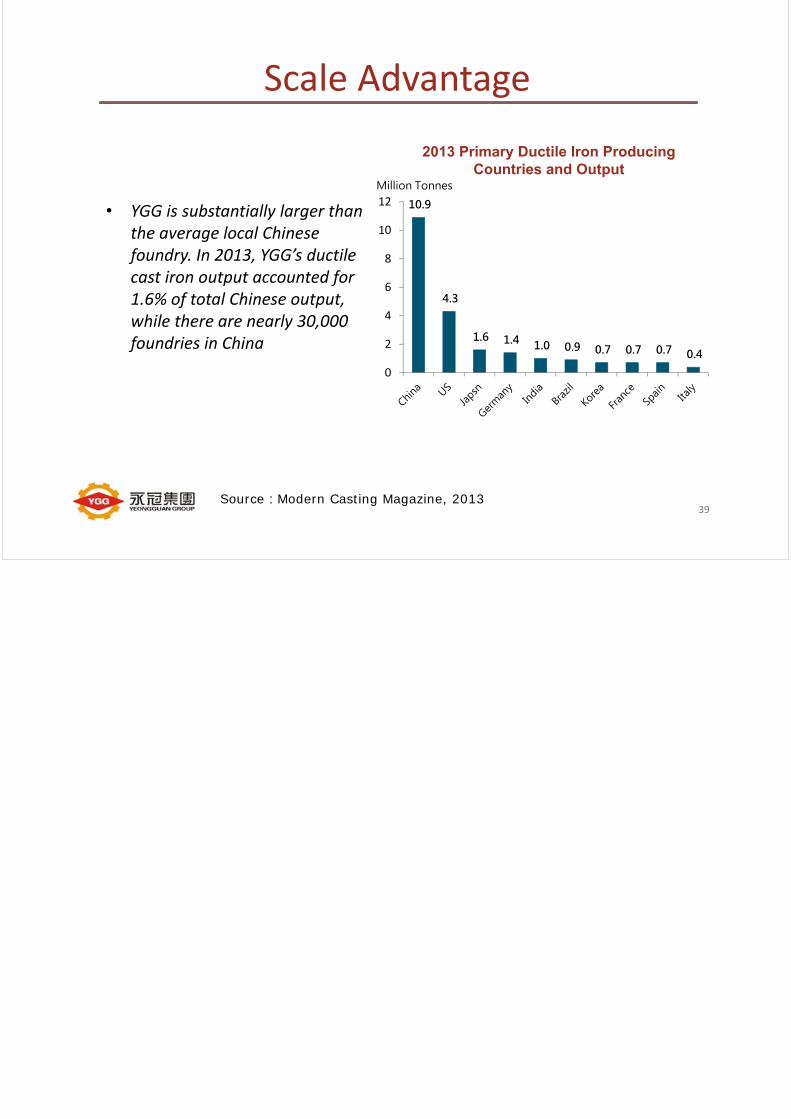
Scale Advantage
• YGG is substantially larger than the average local Chinese foundry. In 2013, YGG’s ductile cast iron output accounted for 1.6% of total Chinese output, while there are nearly 30,000 foundries in China
Source:Modern Casting Magazine, 2013
2013 Primary Ductile Iron Producing Countries and Output
10.9
4.3
1.6 1.4 1.0 0.9 0.7 0.7 0.7 0.4
0
2
4
6
8
10
12
Million Tonnes