14.471: Public Economics Tax Enforcement - Thomas...
45
14.471: Public Economics Tax Enforcement Emmanuel Saez MIT: Fall 2009 1
Transcript of 14.471: Public Economics Tax Enforcement - Thomas...
14.471: Public Economics
Tax Enforcement
Emmanuel Saez
MIT: Fall 2009
1

Tax Enforcement Problem
Most models of optimal taxation (income or commodity) as-sume away enforcement issues. In practice:
1) Enforcement is costly (eats up around 10% of taxes col-lected in the US) both for government (tax administration)and private agents (tax compliance costs)
2) Substantial tax evasion (15% of under-reported income inthe US federal taxes). Tax evasion much worse in developingcountries
Two Recent surveys:
Andreoni, Erard, Feinstein JEL 1998
Slemrod and Yitzhaki Handbook of PE, 20022

ALLINGHAM-SANDMO JPUBE’72 MODEL
Seminal in the theoretical tax evasion literature. Uses theBecker crime model
Individual taxpayer problem:
maxw̄
(1− p)u(w − � ⋅ w̄) + pu(w − � ⋅ w̄ − �(w − w̄)(1 + �)),
where w is true income, w̄ reported income, � tax rate, p auditprobability, � fine factor, u(.) concave.
Let cNo Audit = w− � ⋅ w̄ and cAudit = w− � ⋅ w̄− �(w− w̄)(1 + �)
FOC in w̄: −�(1− p)u′(cNo Audit) + p��u′(cAudit) = 0⇒
u′(cAudit)
u′(cNo Audit)=
1− pp�
SOC ⇒ �2(1− p)u′′(cNo Audit) + p�2�2u′′(cAudit) < 0
3
ALLINGHAM-SANDMO JPUBE’72 MODEL
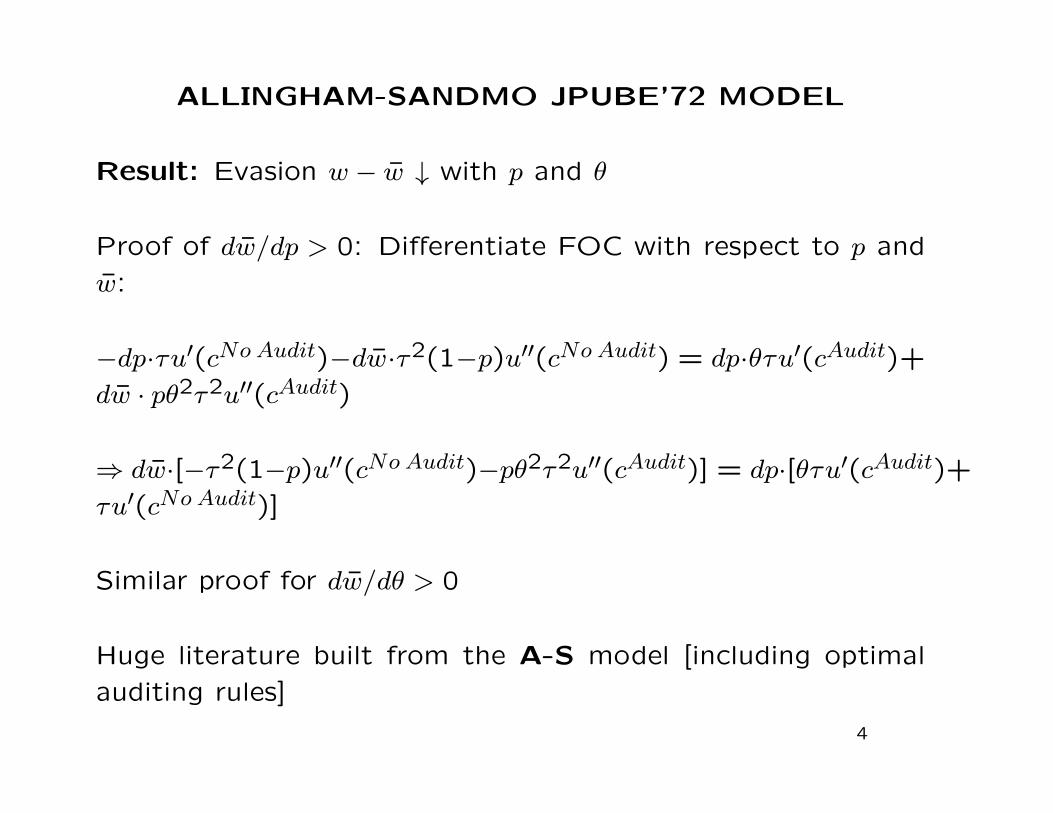
Result: Evasion w − w̄ ↓ with p and �
Proof of dw̄/dp > 0: Differentiate FOC with respect to p and
w̄:
−dp⋅�u′(cNo Audit)−dw̄⋅�2(1−p)u′′(cNo Audit) = dp⋅��u′(cAudit)+
dw̄ ⋅ p�2�2u′′(cAudit)
⇒ dw̄⋅[−�2(1−p)u′′(cNo Audit)−p�2�2u′′(cAudit)] = dp⋅[��u′(cAudit)+
�u′(cNo Audit)]
Similar proof for dw̄/d� > 0
Huge literature built from the A-S model [including optimal
auditing rules]
4

Why is tax evasion so low in OECD countries?
Key puzzle: US has low audit rates (p = .025) and low fines(� = .2). With reasonable risk aversion (say CRRA = 1),tax evasion should be much higher than observed empirically
Two types of explanations for puzzle
1) Unwilling to Cheat: Social norms and morality [peopledislike being dishonest and hence voluntarily pay taxes]
2) Unable to Cheat: Probability of being caught is muchhigher than observed audit rate because of 3rd party report-
ing:
Employers double report wages to govt (W2 forms), com-panies and financial institutions double report capital incomepaid out to govt (US 1099 forms)
5

DETERMINANTS OF TAX EVASION
Large empirical literature studies tax evasion levels and the linkbetween tax evasion and (a) tax rates, (b) penalties, (c) auditprobabilities, (d) prior audit experiences, (e) socio-economiccharacteristics
Early literature relies on observational [ie non-experimental]data which creates serious identification and measurement is-sues:
(1) Evasion is difficult to measure
(2) Most independent variables [audits, penalties, etc.] areendogenous responses to evasion and also difficult to measure
⇒ Requires to use experimental data or to find good in-struments: (a) IRS Tax Compliance Measurement Studies(TCMP), (b) lab experiments, (c) field experiments
6
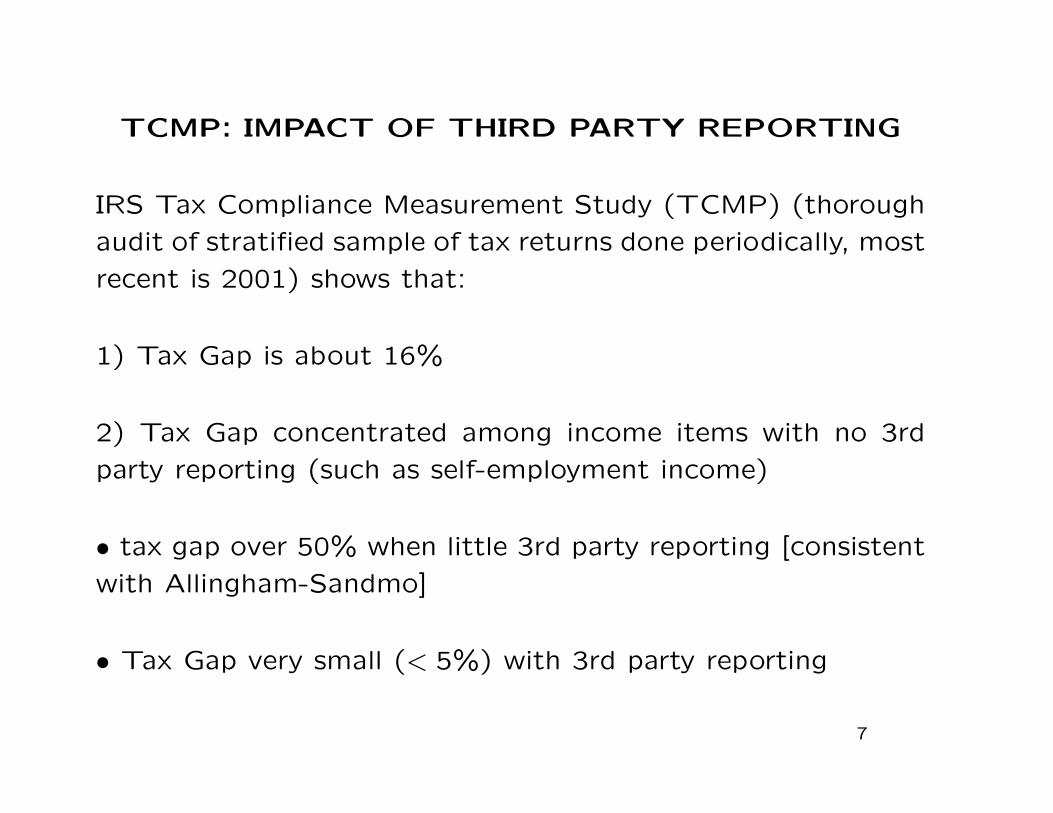
TCMP: IMPACT OF THIRD PARTY REPORTING
IRS Tax Compliance Measurement Study (TCMP) (thorough
audit of stratified sample of tax returns done periodically, most
recent is 2001) shows that:
1) Tax Gap is about 16%
2) Tax Gap concentrated among income items with no 3rd
party reporting (such as self-employment income)
∙ tax gap over 50% when little 3rd party reporting [consistent
with Allingham-Sandmo]
∙ Tax Gap very small (< 5%) with 3rd party reporting
7
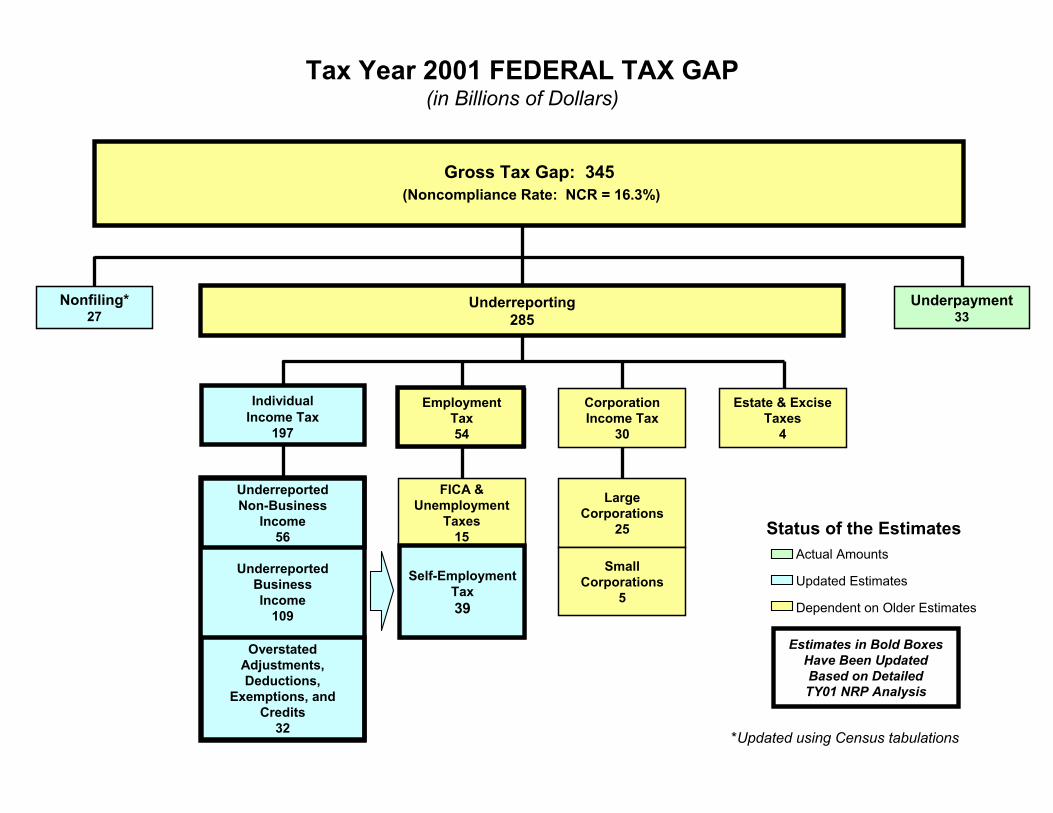
Tax Year 2001 FEDERAL TAX GAP(in Billions of Dollars)
Actual Amounts
Updated Estimates
Dependent on Older Estimates
Status of the Estimates
Estimates in Bold Boxes Have Been Updated Based on DetailedTY01 NRP Analysis
Nonfiling*27
Underpayment33
Gross Tax Gap: 345(Noncompliance Rate: NCR = 16.3%)
Underreporting285
IndividualIncome Tax
197
Non-BusinessIncome$30.6
UnderreportedBusinessIncome
109
UnderreportedNon-Business
Income56
OverstatedAdjustments,Deductions,
Exemptions, and Credits
32
EmploymentTax54
FICA & Unemployment
Taxes15
Self-EmploymentTax39
Large Corporations
25
Estate & ExciseTaxes
4
CorporationIncome Tax
30
Small Corporations
5
*Updated using Census tabulations

Individual Income Tax Underreporting Gap
Underreporting Tax Gap Net Misreporting Percentage
Little or noinformation reporting
Someinformation reporting
Substantialinformation reporting
Substantialinformation reporting
and withholding
20 10
10 5
0 0
30 15
40 20
50 25
60 30
70 35
80 40
90 45
100 50
110 55
120 60$110 B 53.9%
$51 B
8.6%
$9 B 4.5%$11 B
1.2%

TCMP: IMPACT OF TAX WITHHOLDING
3) Tax Withholding further reduces tax gap: liquidity con-
straint effect is most likely explanation: some taxpayers can
never produce the tax due unless it is withheld at source
⇒ wage income withholding is critical for enforcement of broad
based income tax and payroll taxes
Numbers from TCMP are rough estimates because audits can-
not uncover all evasion [IRS blows up uncovered evasion by
factor 3-4] ⇒ Thorough audits detect only about 4% evasion
TCMP cannot be used to study convincingly causal impact of
audits or fines on evasion
9

LAB EXPERIMENTS
Multi-period reporting games involving participants (mostlystudents) who receive and report income, pay taxes, and facerisks of being audited and penalized
1) Lab experiments have consistently shown that penalties,audit probabilities, and prior audits increase compliance (e.g.,Alm, Jackson, and McKee, 1992)
2) But when penalties and audit probabilities are set at realisticlevels, their deterrent effect is quite small [Alm, Jackson, andMcKee 1992]⇒ Laboratory experiments tends to predict moreevasion than we observe in practice
Issues: Lab environment is artificial, and therefore likely tomiss important aspects of the real-world reporting environ-ment [3rd party information and social norms]
10
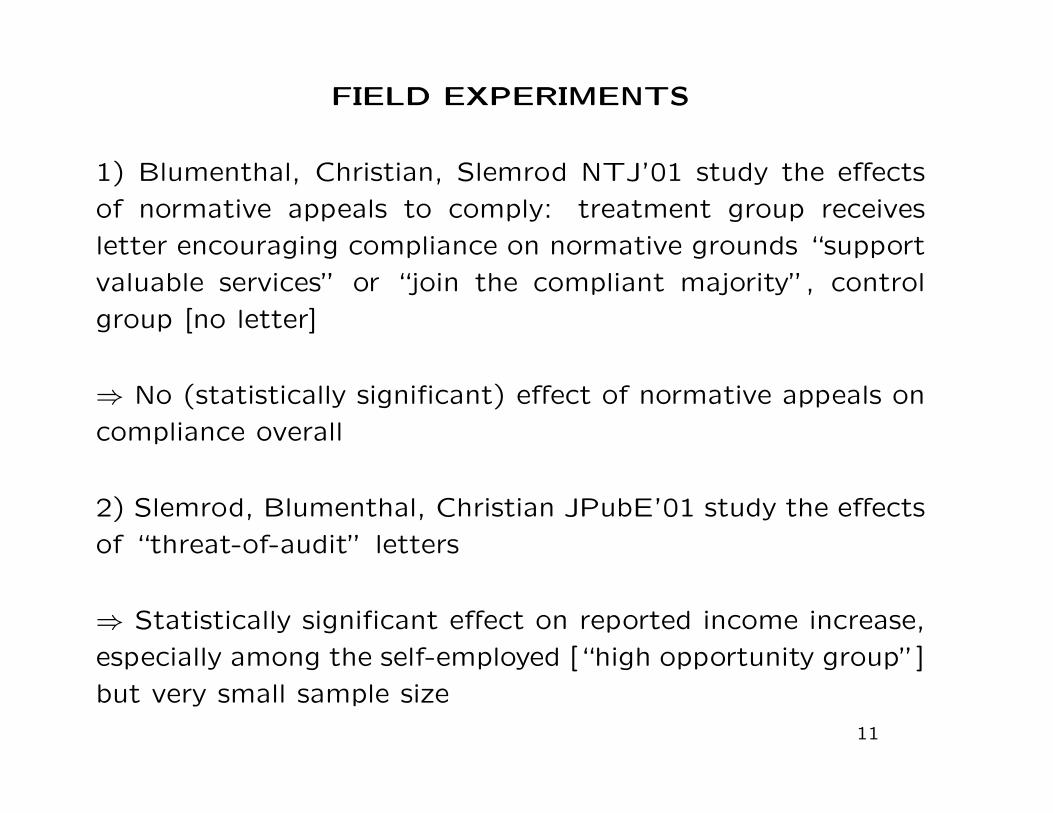
FIELD EXPERIMENTS
1) Blumenthal, Christian, Slemrod NTJ’01 study the effects
of normative appeals to comply: treatment group receives
letter encouraging compliance on normative grounds “support
valuable services” or “join the compliant majority”, control
group [no letter]
⇒ No (statistically significant) effect of normative appeals on
compliance overall
2) Slemrod, Blumenthal, Christian JPubE’01 study the effects
of “threat-of-audit” letters
⇒ Statistically significant effect on reported income increase,
especially among the self-employed [“high opportunity group”]
but very small sample size
11

Do Normative Appeals Affect Tax Compliance?
TABLE 2CHANGE IN REPORTED EEDERAL TAXABLE INCOME AND MINNESOTA TAX LIABILITY
IN TREATMENT AND CONTROL GROUPS
199419931994-1993% with 94-93
increase
n
199419931994-1993% with 94-93
increase
n
199419931994-1993% with 94-93
increase
n
Treated
$26,947$26,236
$711
54.1
15,613
Treated
$26,906$26,457
$449
54.6
15,536
Treated
$26,927$26,346
$580
54.3
31,149
Letter 1
Federal Taxable Income
Control
$26,940$26,449
$491
53.9
15,624
Treated-Control
$7$-.213
$220(352)
0.2
Letter 2
Federal Taxable Income
Control
$26,940$26,449
$491
53.9
15,624
Treated-Control
$-34$8
$-42(299)
0.7
Either Letter
Federal Taxable Income
Control
$26,940$26,449
$491
53.9
15,624
Treated-Control
$-14$-103
$89(270)
0.4
Treated
$1,943$1,907
$35
52.6
15,613
Treated
$1,949$1,930
$19
53.1
15,536
Treated
$1,946$1,919
$27
52.8
31,149
MN Tax Liability
Control
$1,954$1,934
$20
52.3
15,624
Treated-Control
$-11$-26
$15(29)
0.3
MN Tax Liability
Control
$1,954$1,934
$20
52.3
15,624
Treated-Control
$-4$-3
$-1(25)
0.8
MN Tax Liability
Control
$1,954$1,934
$20
52.3
15,624
Treated-Control
$-8$-15$7(22)
0.5
Notes:Number in parentheses is the standard error.The mean of "Treated-Control" may differ from the mean of "Treated" minus the mean of "Control" due torounding error.
ceived either letter, and for those whoserved as controls.'^ Consistent with therandom assignment of cases to experi-mental groups and a lack of attrition bias,the 1993 treated and control means are notsignificantly different. For Letterl (Sup-port Valuable Services), the mean differ-
ence-in-difference for FTP^ was $220, orthose receiving the letter increased theirreport, on average, by $220 more than didthe controls. While the result suggests asuccessful moral persuasion, equal toabout 0.8 percent of average income, it isnot statistically significant. For Minnesota
' We have excluded two Letterl recipients whose reported income and taxes over the period were inconsistent:one reported 73 percent less FTI but only 35 percent less MnTx while the other reported 1.4 percent less FTIbut 25 percent less MnTx. The preliminary analysis which included them yielded regression coefficients forthe MnTx and FTI equations which were of widely varying proportions (i.e., the MnTx coefficients rangedfrom -10 to 134 percent of the FTI coefficients, while the state marginal tax rate varied only between 6 and 8.5percent). Excluding these two treated recipients, the two sets of coefficients are more uniformly proportional.The data contain two sources of FTI observations, one from the Minnesota return and, in 1993 and 1994, onefrom the federal return. In the analyses which follow, we use the Minnesota FTI data, except for those cases inwhich it is missing on the state return but available from the federal return.
131

466J.
Slemrod
etal.
/Journal
ofP
ublicE
conomics
79(2001)
455–483
Table 4Average reported federal taxable income: differences in differences for the whole sample and income and opportunity groups
Whole sample (weighted)
Treatment Control Difference
1994 23,781 23,202 579
1993 23,342 22,484 858
94293 439 717 2278
S.E. 464
%w/increase 54.4% 51.9% 2.5%***
n 1537 20,831
Low income
High opportunity Low opportunity
Treatment Control Difference Treatment Control Difference
1994 7473 3992 3481 2397 2432 235
1993 971 787 183 788 942 2154**
94293 6502 3204 3298 1609 1490 119
S.E. 2718 189
%w/increase 65.4% 51.2% 14.2%* 52.2% 50.2% 2.0%
n 52 123 381 4829
TAX AUDIT EXPERIMENT FROM DENMARK
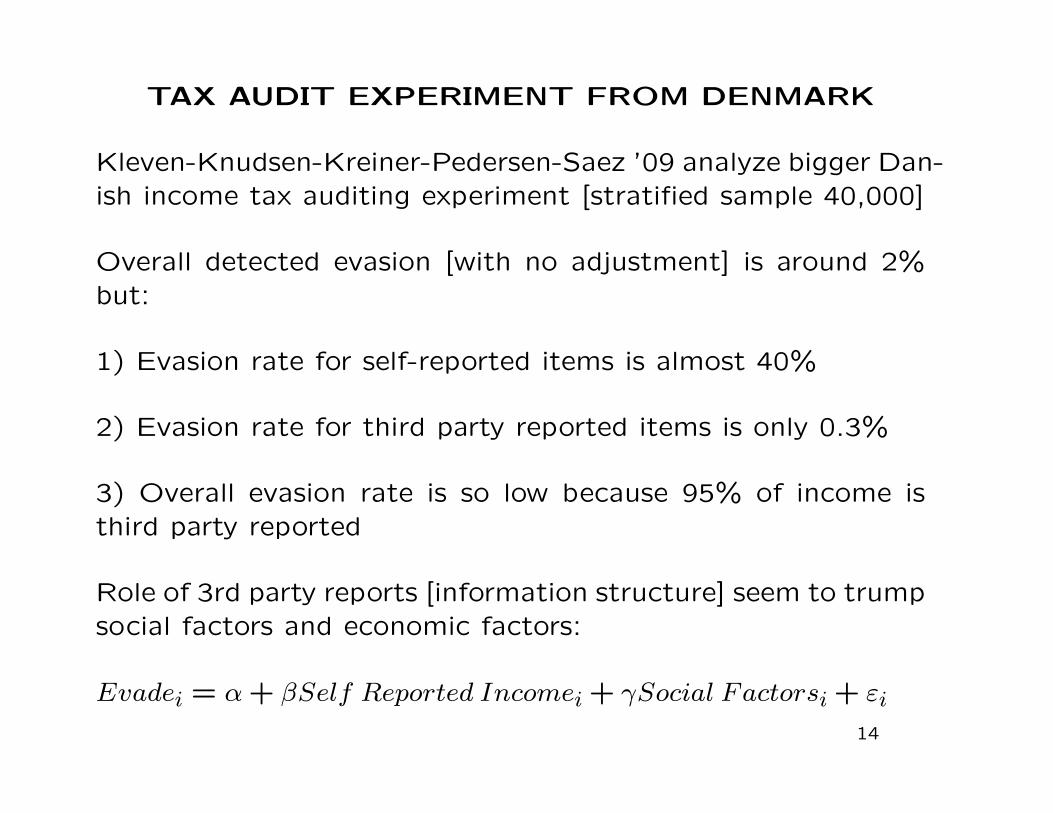
Kleven-Knudsen-Kreiner-Pedersen-Saez ’09 analyze bigger Dan-ish income tax auditing experiment [stratified sample 40,000]
Overall detected evasion [with no adjustment] is around 2%but:
1) Evasion rate for self-reported items is almost 40%
2) Evasion rate for third party reported items is only 0.3%
3) Overall evasion rate is so low because 95% of income isthird party reported
Role of 3rd party reports [information structure] seem to trumpsocial factors and economic factors:
Evadei = �+ �Self Reported Incomei + Social Factorsi + "i
14
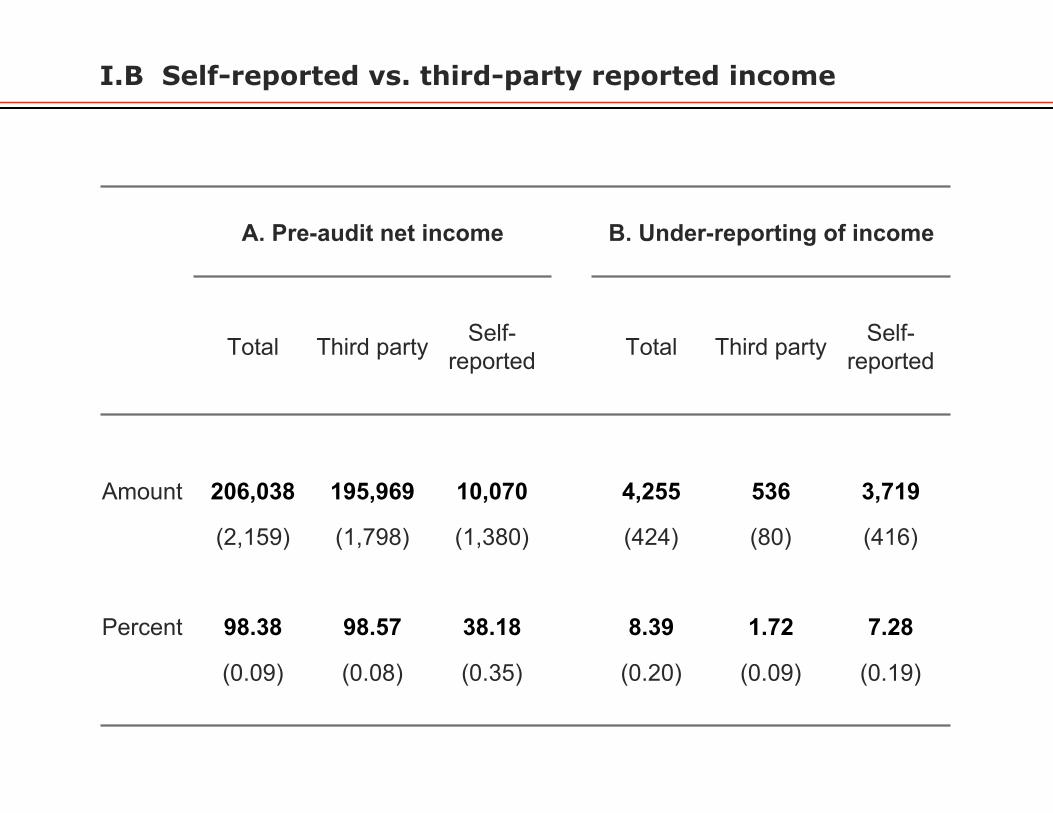
I.B Self-reported vs. third-party reported income
A. Pre-audit net income B. Under-reporting of income
Total Third party Self-reported Total Third party Self-
reported
Amount 206,038 195,969 10,070 4,255 536 3,719
(2,159) (1,798) (1,380) (424) (80) (416)
Percent 98.38 98.57 38.18 8.39 1.72 7.28
(0.09) (0.08) (0.35) (0.20) (0.09) (0.19)

I.C Socio-economic vs. tax return factors
Probability of audit adjustment
Social factors Socio-
economic factors
Tax return factors All factors
Constant 12.81 (0.42) 11.74 (0.44) 2.49 (0.26) 3.71 (0.44)Female dummy -5.83 (0.43) -5.29 (0.44) -2.40 (0.42)Married dummy 1.56 (0.46) 1.52 (0.46) -1.65 (0.43)Copenhagen dummy 0.08 (0.66) 0.50 (0.66) 2.00 (0.61)Age > 45 dummy -0.46 (0.45) -0.19 (0.45) 0.56 (0.43)Firm size < 10 dummy 4.34 (0.82) 3.49 (0.77)Informal sector dummy 3.80 (0.86) -0.91 (0.81)Self-reported income dummy 11.26 (0.53) 11.40 (0.54)Self-reported income>20,000DKK 20.68 (0.92) 20.02 (0.93)Self-reported income<-10,000DKK 17.08 (0.73) 17.00 (0.73)
R-square 1.01% 1.31% 14.26% 14.61%Adjusted R-square 0.99% 1.28% 14.25% 14.57%

TAX AUDIT EXPERIMENT FROM DENMARK
Kleven et al. ’09 also provide experimental causal effects of:
1) Prior-audit effects: compare next year outcomes of 100%
audit group and a 0% audit group [as audited tax filers may
update upward beliefs on p]
⇒ Find significant effects on reported income increases, con-
centrated among self-reported items [nothing on 3rd party
income]:
Extra tax collected through this indirect effect is about 50%
of extra taxes collected due to base year audits
2) Threat-of-audit letters: Find significant effects on self-
reported income increases [as in Slemrod et al.]
16

II.A Effects of prior audits on future reporting
Amount of income change from 2006 to 2007
Baseline Total income
Self-reported income
Third-party reported income
Audit adjustment in 100% audit
group
Difference 100% audit vs. 0% audit
Difference 100% audit vs. 0% audit
Difference 100% audit vs. 0% audit
Net income 5261 2826 2409 417
(503) (784) (663) (694)
Total tax 2367 1368
(158) (470)
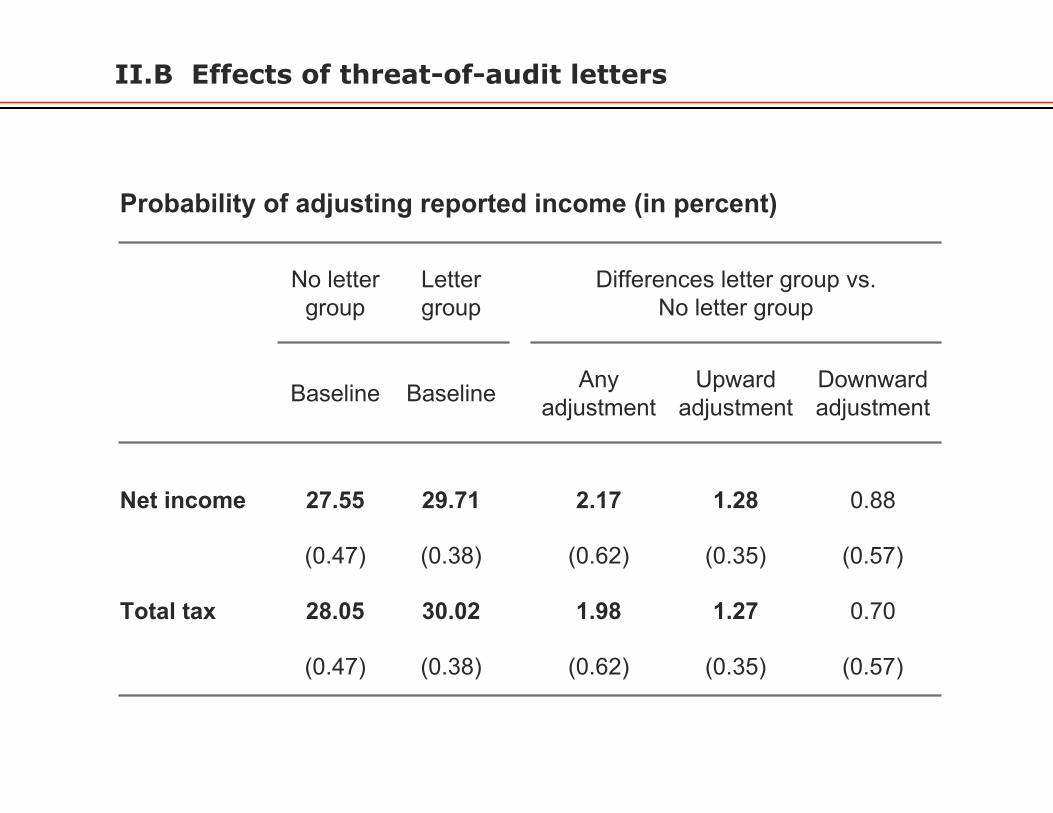
II.B Effects of threat-of-audit letters
Probability of adjusting reported income (in percent)
No letter group
Letter group
Differences letter group vs.No letter group
Baseline Baseline Any adjustment
Upward adjustment
Downward adjustment
Net income 27.55 29.71 2.17 1.28 0.88
(0.47) (0.38) (0.62) (0.35) (0.57)
Total tax 28.05 30.02 1.98 1.27 0.70
(0.47) (0.38) (0.62) (0.35) (0.57)

ADDING THIRD PARTY REPORTING IN A-SMODEL: KLEVEN-KREINER-SAEZ ’09
Income w = wt+ws where wt is third party reported (observedby govt at no cost) and ws is self-reported (as in standardAllingham-Sandmo model). Individual reports w̄t and w̄s
1) w̄t = wt because audit rate is 100% for this income category
2) Government audits w̄s with probability p < 1 (costly):
maxw̄s
(1−p)u(w−�wt−�w̄s)+pu(w−�wt−�w̄s−�(ws−w̄s)(1+�))
⇔ maxw̄=wt+w̄s
(1− p)u(w − �w̄) + pu(w − �w̄ − �(w − w̄)(1 + �))
⇒ 3rd Party Irrelevance: If no constraints on w̄s, 3rd partyreporting does not help enforcement
Note: irrelevance result remains true if p(w̄)
18

BREAKING THE IRRELEVANCE RESULT
Irrelevance result depends on 2 strong assumptions:
(1) Self-reported losses are allowed
(2) Audit rate does not depend on (sign of) w̄s
More realistic models where irrelevance breaks down:
(1) Disallow self-reported losses [or schedular tax]
(2) Audit rate p depends (negatively) on w̄s
⇒ 3rd party reporting helps government enforce taxes
19

EXPLAINING ACTUAL TAX POLICIES
Incorporating 3rd party in Allingham-Sandmo model solves
puzzles:
1) Evasion rates are high in s sector (consistent with AS) and
low in t sector
2) p higher when w̄s < 0 (small business losses, undocumented
deductions, etc.)
3) w̄s losses not allowed against wt (example: US limits capital
gain losses and passive business losses)
4) Use of schedular (instead of general) income tax: Earliest
income taxes (1800-1900) are schedular
20
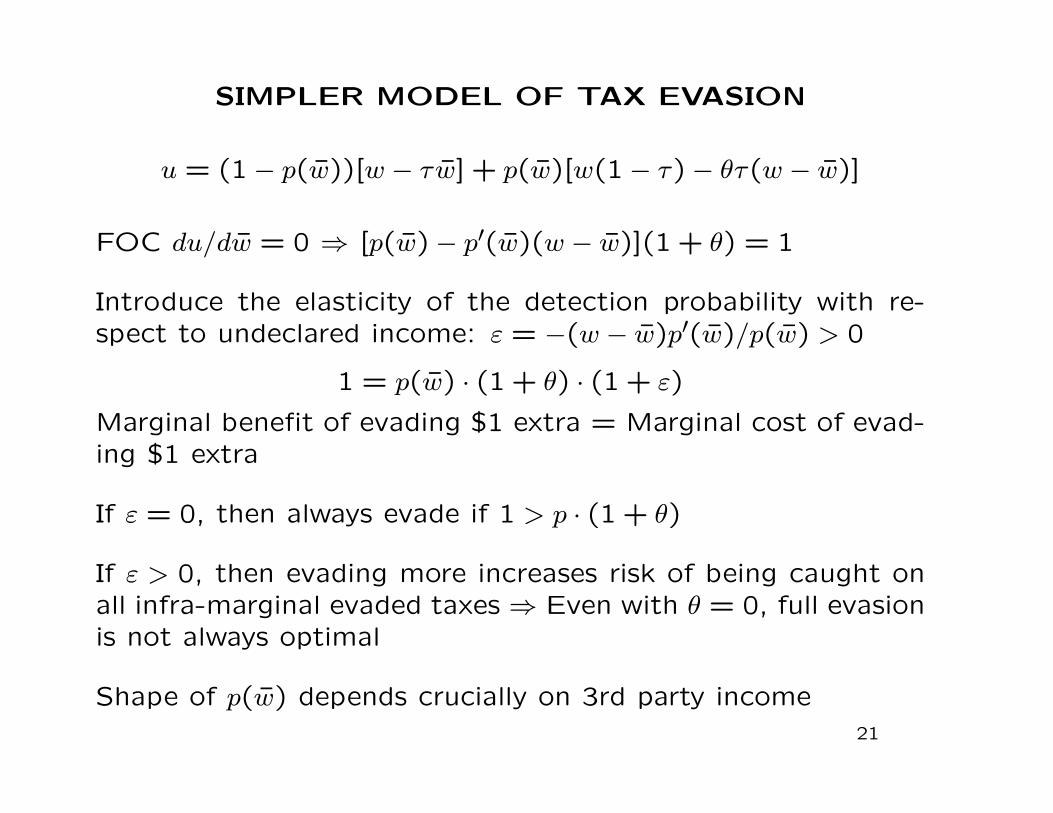
SIMPLER MODEL OF TAX EVASION
u = (1− p(w̄))[w − �w̄] + p(w̄)[w(1− �)− ��(w − w̄)]
FOC du/dw̄ = 0 ⇒ [p(w̄)− p′(w̄)(w − w̄)](1 + �) = 1
Introduce the elasticity of the detection probability with re-spect to undeclared income: " = −(w − w̄)p′(w̄)/p(w̄) > 0
1 = p(w̄) ⋅ (1 + �) ⋅ (1 + ")
Marginal benefit of evading $1 extra = Marginal cost of evad-ing $1 extra
If " = 0, then always evade if 1 > p ⋅ (1 + �)
If " > 0, then evading more increases risk of being caught onall infra-marginal evaded taxes ⇒ Even with � = 0, full evasionis not always optimal
Shape of p(w̄) depends crucially on 3rd party income21

detection probability (p)
reportedincome (w)
3rd-party reportedincome wt
optimum
1/(1+θ)
w
self-reportedIncome ws
Figure 1: Probability of Detection under Third-Party Reporting
wt
1
1/[(1+θ)(1+ε)]

WHY DOES THIRD PARTY REPORTING WORK?
In theory, employer and employee could collude to evade taxes⇒ third-party does not help (Yaniv 1992)
In practice, such collusion is fragile in modern companies be-cause of combination of:
1) Accounting and payroll records that are widely used withinthe firm [which need to report true wages in order to be usefulto run a complex business]
2) A single employee can denounce collusion between employerand employees by showing true records to government. Likelyto happen in a large business [disgruntled employee, honestnewly hired employee, mistake, whistle blower seeking govtreward]
⇒ Taxes can be enforced even with low penalties and low auditrates [Kleven-Kreiner-Saez, 2009]
23
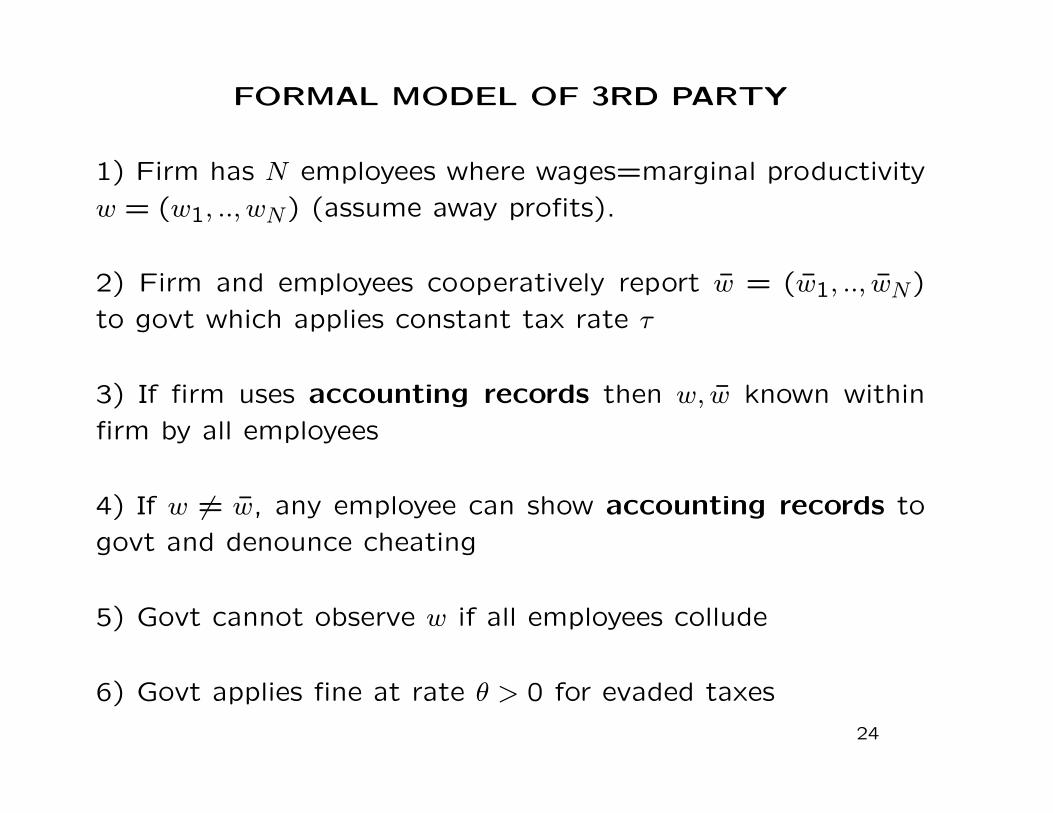
FORMAL MODEL OF 3RD PARTY
1) Firm has N employees where wages=marginal productivity
w = (w1, .., wN) (assume away profits).
2) Firm and employees cooperatively report w̄ = (w̄1, .., w̄N)
to govt which applies constant tax rate �
3) If firm uses accounting records then w, w̄ known within
firm by all employees
4) If w ∕= w̄, any employee can show accounting records to
govt and denounce cheating
5) Govt cannot observe w if all employees collude
6) Govt applies fine at rate � > 0 for evaded taxes
24

FORMAL MODEL OF 3RD PARTY
Firm and all employees can collude to report w̄ = (0, ..,0) and
evade taxes entirely
But collusive equilibrium is fragile as a single employee can
reveal cheating. Can happen because of:
1) Random Shocks: Work conflict, Moral Concerns, Mistake
2) Whistle blowing reward: Govt offers fraction � of unpaid
taxes to whistle blowers
⇒ Collusive equilibrium harder to sustain in large firms
25

FORMAL MODEL OF 3RD PARTY: RANDOM
SHOCKS
If w ∕= w̄, each employee denounces firm with probability "
(iid) ⇒ Firm successfully evades with prob. (1− ")N
Firm/workers set w̄ to maximize ex-ante expected surplus (as-
suming risk neutrality):
S =∑n
[wn − � ⋅ w̄n − (1− (1− ")N) ⋅ � ⋅ (1 + �) ⋅ (wn − w̄n)]
∂S/∂w̄n = � ⋅ [−1 + (1 + �)(1− (1− ")N)]
Firm/workers evade (fully) iff (1− ")N > �/(1 + �)
Large firms do not evade even for small " and �
26
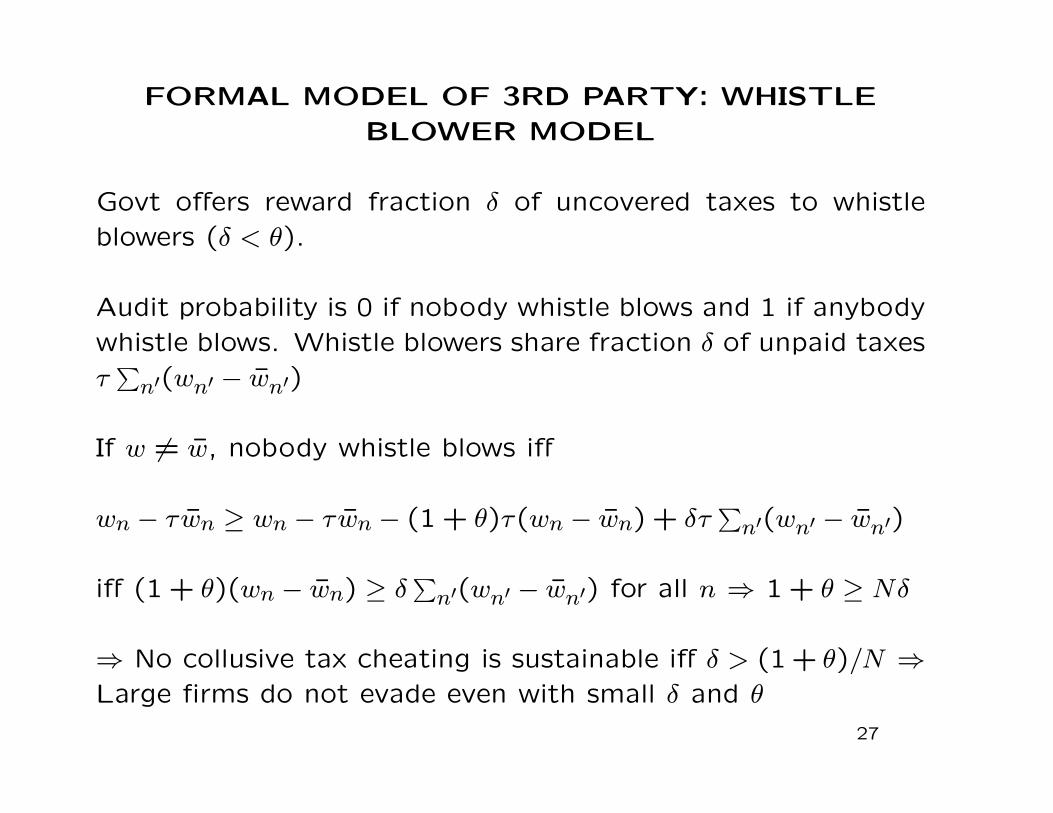
FORMAL MODEL OF 3RD PARTY: WHISTLE
BLOWER MODEL
Govt offers reward fraction � of uncovered taxes to whistleblowers (� < �).
Audit probability is 0 if nobody whistle blows and 1 if anybodywhistle blows. Whistle blowers share fraction � of unpaid taxes�∑n′(wn′ − w̄n′)
If w ∕= w̄, nobody whistle blows iff
wn − �w̄n ≥ wn − �w̄n − (1 + �)�(wn − w̄n) + ��∑n′(wn′ − w̄n′)
iff (1 + �)(wn − w̄n) ≥ �∑n′(wn′ − w̄n′) for all n ⇒ 1 + � ≥ N�
⇒ No collusive tax cheating is sustainable iff � > (1 + �)/N ⇒Large firms do not evade even with small � and �
27

HISTORY OF TAX COLLECTION
Most interesting to understand why taxes develop the way they
do [Webber-Wildavsky ’86 book, Ardant ’68 book in French]
During most of history, governments were under the tax en-
forcement constraint: they were collecting as much taxes as
possible given the economic / informational conditions
Many developing countries today still face such tax enforce-
ment constraints
Earliest taxes are tributes: conquerors / rulers realize that it is
more lucrative to raise periodic tributes than outright stealing
28

ARCHAIC TAXES
Governments try to extract revenue through rules without de-
stroying economic activity and without generating tax revolts
Colbert (17th century France) famous expression: “plucking
the goose while minimizing hissing”
Direct taxes: taxes on property, businesses, or people
Indirect taxes: taxes on transactions and exchanges
Classification is no longer very meaningful: [estate tax is di-
rect, inheritance tax is indirect but economically equivalent]
29
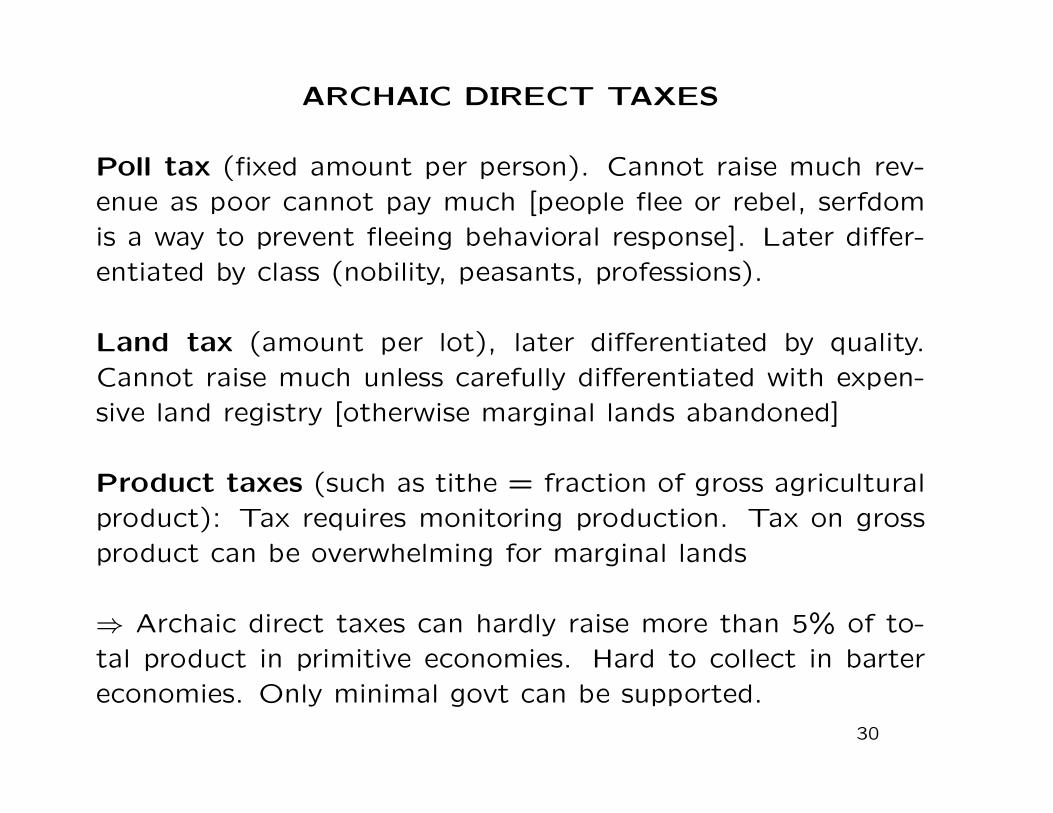
ARCHAIC DIRECT TAXES
Poll tax (fixed amount per person). Cannot raise much rev-enue as poor cannot pay much [people flee or rebel, serfdomis a way to prevent fleeing behavioral response]. Later differ-entiated by class (nobility, peasants, professions).
Land tax (amount per lot), later differentiated by quality.Cannot raise much unless carefully differentiated with expen-sive land registry [otherwise marginal lands abandoned]
Product taxes (such as tithe = fraction of gross agriculturalproduct): Tax requires monitoring production. Tax on grossproduct can be overwhelming for marginal lands
⇒ Archaic direct taxes can hardly raise more than 5% of to-tal product in primitive economies. Hard to collect in bartereconomies. Only minimal govt can be supported.
30

ARCHAIC INDIRECT TAXES
Indirect taxes require exchange economies
Tolls for use of roads, rivers, entering towns, crossing borders,harbors, mountain pass. Initially based on people, later basedon goods transported [overused when no coordination acrossjurisdictions]
Excise and Sales Taxes on exchanged goods. In early economies,only few goods are traded: salt, metal, alcohol beverages.Fairs where exchanges are concentrated also allow govern-ments to impose sales taxes
Govt Monopoly Some economic activities require use of heavyequipment (grinding wheat, pressing grapes) ⇒ Can be con-trolled/monitored by govt
⇒ Archaic indirect taxes can raise substantial additional rev-enue in jurisdictions with substantial trading activity
31
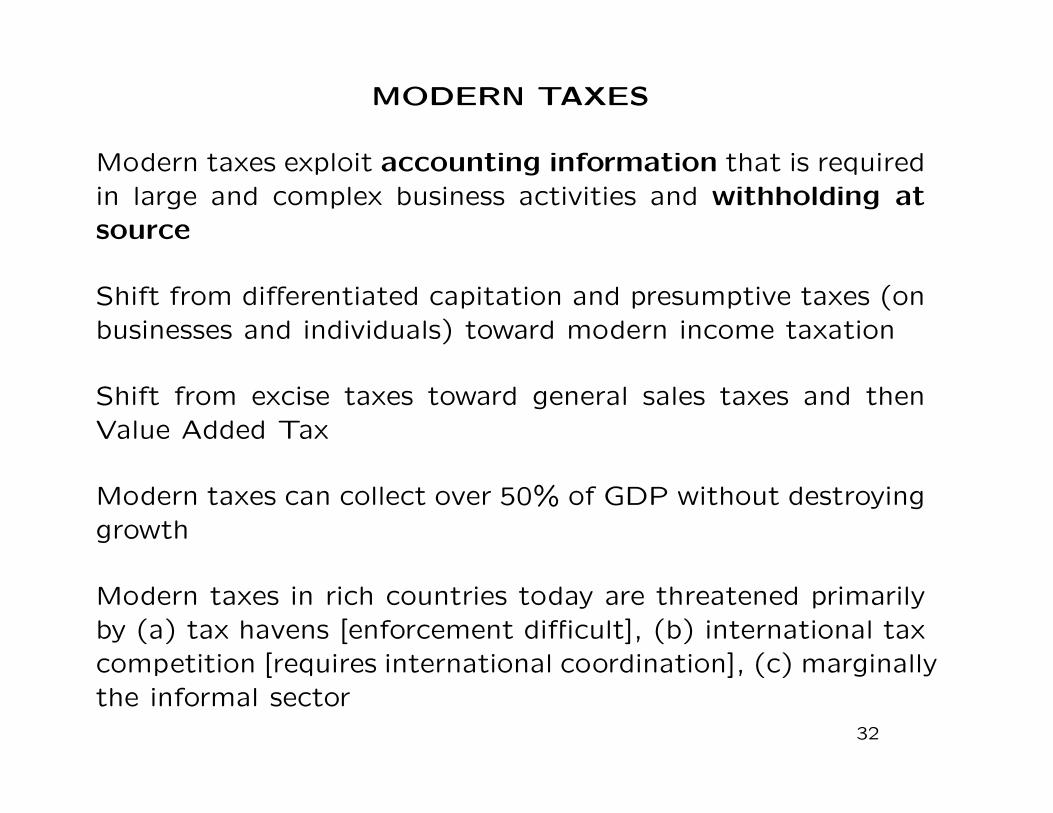
MODERN TAXES
Modern taxes exploit accounting information that is requiredin large and complex business activities and withholding atsource
Shift from differentiated capitation and presumptive taxes (onbusinesses and individuals) toward modern income taxation
Shift from excise taxes toward general sales taxes and thenValue Added Tax
Modern taxes can collect over 50% of GDP without destroyinggrowth
Modern taxes in rich countries today are threatened primarilyby (a) tax havens [enforcement difficult], (b) international taxcompetition [requires international coordination], (c) marginallythe informal sector
32

EMPIRICAL PATH OF GOVERNMENT GROWTH
1) Govt size is small (typically < 10% of GDP) in Western
countries before industrialization (Flora ’83). Use archaic
taxes: [poll taxes, land-property taxes, product taxes, excise
taxes, tolls, tariffs]
2) Govt size increases sharply in all advanced economies during
20th century. Increase corresponds to the development of
modern taxes enforced using business records [income taxes,
payroll taxes, value added taxes]
3) Govt growth has slowed or stopped in most advanced economies
over last 3 decades
This general historical pattern applies to almost all rich coun-
tries although timing and final govt size varies across countries
33

2A. Tax revenue/GDP in the US, UK, and Sweden
0%
10%
20%
30%
40%
50%
60%18
68
1878
1888
1898
1908
1918
1928
1938
1948
1958
1968
1978
1988
1998
2008
Tota
l Tax
Rev
enue
/GD
P
United States
United Kingdom
Sweden

2B. US Tax Composition, 1902-2008
0%
5%
10%
15%
20%
25%
30%
35%19
0219
0719
1219
1719
2219
2719
3219
3719
4219
4719
5219
5719
6219
6719
7219
7719
8219
8719
9219
9720
0220
07
Tax
Rev
enue
/GD
P
Income Taxes
Other Taxes

EXPLAINING PATTERN OF GOVT GROWTH WITH
TAX ENFORCEMENT
Kleven-Kreiner-Saez NBER’09
1) Early development: economy is rudimentary and businessare small / do not need business records: government cannotuse modern taxes and is constrained by limited fiscal capacity⇒ Government size is too small relative to tastes of citizens
2) Middle development: businesses grow in size and start us-ing records ⇒ Government can start using modern taxes andgrows (still constrained by fiscal capacity as too high taxeswould make businesses go back to informality)
3) Late development: economy is largely formal ⇒ Govern-ment no longer constrained, govt size is optimal given tastesof citizens ⇒ Government size (as a fraction of GDP) is stable
35

ALTERNATIVE THEORIES OF GOVT GROWTH
1) Demand elasticity for public goods has income elasticityabove one [Wagner’s law ∼ 1900]
2) Supply side: Stagnating productivity in the governmentsector [Baumol’s ’67 Cost Disease Theory]
3) Ratchet effect theory: temporary shocks (e.g., wars)raise government expenditures, which do not fall back afterthe shock because of changed social norms [Peacock-Wiseman’61, Besley-Persson ’08] (can’t explain Sweden and pre-20thcentury wars)
4) Political economy theories based on voting, democratiza-tion, lobbying, corruption, inequality, etc.
5) Leviathan theory Bureaucrats maximize govt size subjectto fiscal capacity and political constitution constraints
36

VARIOUS SALES TAXES
Turnover taxes used to tax all sales: business to consumer(B-C) and business to business (B-B):
Creates multiple layers of taxes along a production chain ⇒Higher total tax when B-B-C than B-C
Retail Sales Tax is imposed on B-C sales only [B-B exempt]:difficult to distinguish B-B and B-C (shifting), strong evasionincentive for B-C
Value-Added-Tax (VAT) taxes only value added [sales-purchases]in all transactions (B-B and B-C): equivalent to retail saleseconomically but easier to enforce
VAT invented in France in 1950s, has spread to most countriessince [US is only rich country without VAT]
37

NO EVASION: VAT ⇔ RETAIL SALES TAX
(1) Supplier S produces material using only labor inputs and
sells it for s, pays VAT � ⋅ s
(2) Manufacturer M buys material for s and sells product for
m, pays VAT � ⋅ (m− s)
(3) Retailer R buys product for m and sells good to consumers
for r, pays VAT � ⋅ (r −m)
Total VAT is � ⋅ r
Retail sales tax paid only by R: � ⋅ r
VAT ⇔ Retail sales tax
38

INTRODUCING EVASION
Government matches the purchases and sales VAT reports:need to be consistent: s̄, m̄, r̄
If M and R truthfully report m̄ = m, r̄ = r: if S decides toevade s̄ < s, M has to pay � ⋅ (m− s̄), M will only purchase atlower price ⇒ No gain for S to evade
Similarly, if R truthfully reports r̄ = r, then M (and hence S)cannot evade
VAT compliance down the chain forces compliance upstream[even if upstream businesses are informal]
If R is big and uses business records (Walmart) then R cannotmisreport r̄ ⇒ VAT will work well [but retail sales tax wouldalso work]
39

WHY VAT WORKS BETTER?
If R is small / informal, it can evade but needs to report atleast r̄ = m̄ [otherwise VAT credit would attract tax audit]
If M is small / informal and if R evades and sets r̄ = m̄, thenM can evade VAT by colluding with R: both R and M candecide to lower both r̄ and m̄ equally
... S can also evade if M and R evade
If all firms are small / informal, VAT enforcement is impossible
If bottom firm R is small / informal ⇒ Retail sales tax breaksdown entirely but VAT does not:
If bottom firm R is small / informal but M is large / formal,VAT enforcement will work from M and upstream
40

PREDICTIONS ON VAT VS RETAIL SALES TAX
1) Large retail chains are critical for successful implementa-tion of a retail sales tax, and useful for VAT enforcement ⇒The government prefers to favor large retail chains over momand pop retail stores.
2) Presence of a large / formal firm in the chain is necessaryfor (partial) successful VAT enforcement. Imports often playthis role as they are easy to observe and tax [Keen ’07]
3) Small retailers prefer sales taxes (that they can evade) toVAT (that they can only partially evade) ⇒ large retail chains(which cannot evade either) like VAT better than sales taxes
4) VAT Issues: (a) VAT evasion easier with international trans-actions [carousel fraud], (b) VAT cannot tax easily financialservices.
41