14 simulation and new processes - Moldex3D ITALIA and new... · Simulation and new processes...
34
Simulation and new processes Moldex3D John LIN 2016 Users’ Meeting Italia 14
Transcript of 14 simulation and new processes - Moldex3D ITALIA and new... · Simulation and new processes...

Simulation and new processes
Moldex3DJohn LIN
2016 Users’ Meeting Italia14
2
Outline
> Hot Runner Steady
> RTM

3
Hot Runner Steady
4
Situation and Challenge
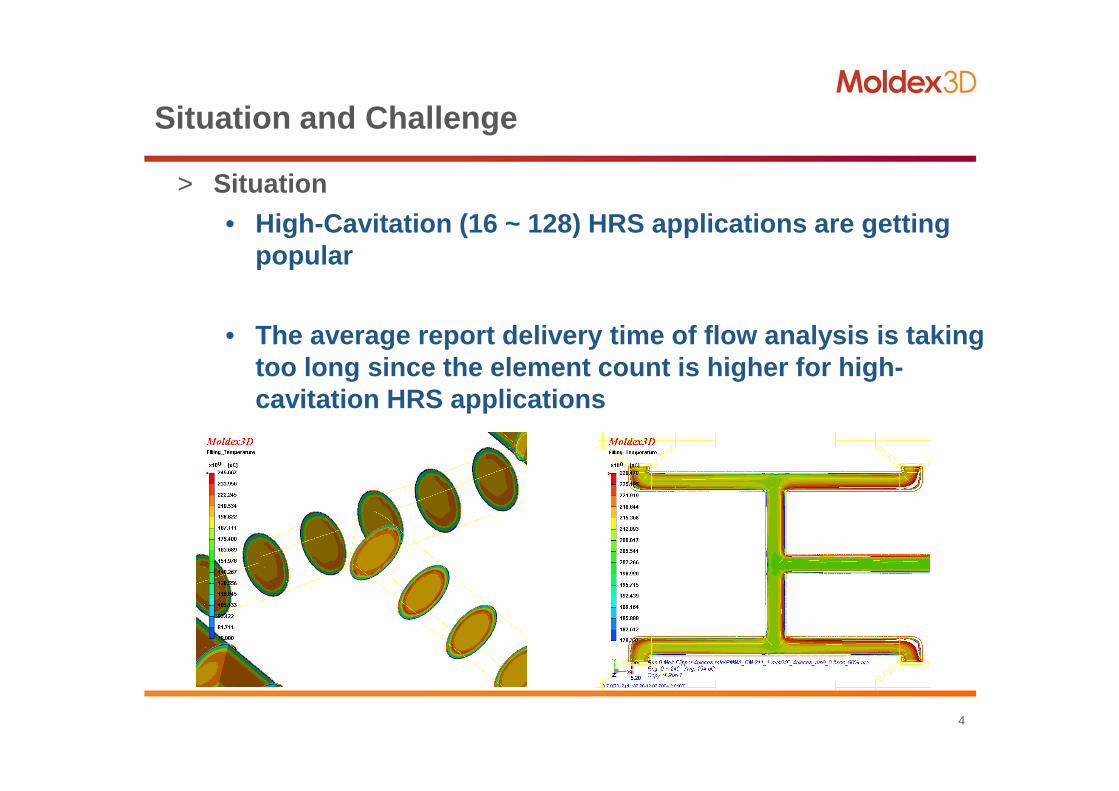
> Situation
• High-Cavitation (16 ~ 128) HRS applications are gett ing popular
• The average report delivery time of flow analysis i s taking too long since the element count is higher for high -cavitation HRS applications

5
Concept
> 3D Hot Runner Steady Analysis• Supports the quick steady analysis of complex hot r unner
layout design, including the support for advanced hot runner module from cooling analysis
> Benefit• Balance ratio study for the design of hot runner la yout
• Enhanced cycle to cycle prediction for viscous heat ing
• Save the analysis time for hot runner layout design er
• AHR license is required• Support MFE mesh type
New Analysis Item in R14.0

6
Application Sample
Hot Runner Design
• 16-drop system
• 2,601,248 elements
Filling Analysis HRS Analysis
CPU Time (by 8 CPUs) 62.2 min 4.2 min
Pressure Drop
in Hot Runner
16.925 MPa
(23.983 – 7.058 MPa)
17.346 MPa
(24.404 – 7.058 MPa)
15 times
faster
15 times
faster

7
High Cavitation Hot Runner System
> Inherit Hot Runner Temperature from Previous Cycles
• HRS volume >> Cavity volume
• For high cavitation (16+) hot runner case, usually t he volume ratio between cavity and HRS is huge.
• Steady Melt Temperature in HRS
• Upstream (inlet) has higher shear rate than downstream (drop) due to flow front area difference
• It usually takes several cycles to accumulate the s hear heating effect, and then induce non-symmetry temperature distribution between different drops.
Particle tracer
(flow length for single shot)High cavitation sample case Volume ratio: 4 times

8
Hottest
Coldest
Cycle by Cycle
Hot Runner Temperature between Cycles

9
Conventional Multi-Cavity Flow Analysis
> Initial Melt Temperature in HRS• Ideal situation: Uniform melt temperature distribut ion
• The initial melt temperature is considered as unifo rm distribution and is equivalent to the setting in pr ocess condition
Uniform initial melt
temperature distribution at
beginning of filling analysis
(filling process at 0 sec)
Uniform Temperature in HRS

10
Multi-Cavity Flow Analysis New Approach
> Initial Melt Temperature in HRS• Actual situation: Non-uniform & Non-symmetry distri bution
due shear heating effect
Residual shear heated melt from
previous cycles (influence factor comes from inside of hot
runner channel)
Non-uniform Temperature in HRS

11
Data Exchange to Filling Analysis
FHRS(Only hot runner)
F P
Hot runner melt temp.
Flow solver uses HRS analysis result as initial hot runner melt temperature
Information in filling log file

12
Data Exchange Between Different Analyses
Ct(AHR)
FHRS(Only hot runner)
F
P
Ct(AHR)
Hot runner boundary temp.
Remark: Hot runner steady and filling analyses will take the hot runner result from cooling analysis when only it is AHR Cooling , but not cycle-average and general transient cool.
Hot runner melt temp.
Both hot runner boundary temp. and melt temp.
(multi-time steps)Update hot runner melt temperature by flow solver in case the melt temperature is improperly
Information in filling log file
Flow solver uses AHR Ct analysis result as initial hot runner melt temperature

13
Hot Runner Temperature Comparison
Conventional Flow Analysis
Temperature at 0% of filling
Temperature at end of filling
New Approach Flow Analysis New approach provides more realistic initial hot
runner melt temperature for better prediction
Temperature at 0% of filling
Temperature at end of filling

14
Melt Front Time Animation
Filling pattern between
cavities is quite balanced
Proper initial hot runner temperature is a key factor for predicting accurate filling pattern
Imbalanced filling
pattern between
cavities
Conventional Flow Analysis New Approach Flow Analysis
15
Summary
> Hot runner steady analysis can • support symmetry boundary condition setting as usua l
• cut down element count in high-cavitation cases for hot runner pressure drop predilection by using dummy ca vities
• save the analysis time significantly to predict pre ssure drop and help to optimize hot runner layout design effici ently
• accurately detect potential flow balance issues to help making appropriate design changes, resulting in bet ter hot runner design

16
RTM

17
Composite Products
> Goal: Reduce vehicle weight, Improve mechanical str ength of the product Hybrid
Short fiber Injection MoldingLong fiber Injection MoldingMulti-component Molding
Resin Transfer Molding(RTM)CRTM
Injection Molding
High!strength of the product
source: M. Schemme, FH Rosenheim
© Kunststoffe

18
Liquid Composite Molding (LCM) Processes
> For manufacturing of composite parts with a high co ntent of oriented reinforcement
• The impregnation of a dry preform with a liquid mat rix by liquid composite molding processes
• Very high potential for economical manufacturing of high performance composite components
> Types of processes covered
• Hand layup, spray up
• RTM, VARTM, RFI, CRTM

19
BMW i3
4m
http://www.bmw.com.cn/cn/zh/newvehicles/i/i3/2013/showroom/

20
40m
Yacht
http://horizonyacht.com/tw/News.aspx?Cond=7bf10f7c-4f4c-4a94-b285-e6dc4f13bdb8&Pindex=14&Year=All&Month=All

21
Wind Turbine Blades
http://www.moneydj.com/KMDJ/News/
60m

22
Fiber Reinforced Plastic Application
Automobile
Aircraft
Yacht Wind turbine
Source787: http://goo.gl/1aZ2qMAirbus380: http://goo.gl/bbD98xLuggage: http://goo.gl/HbrVKoCar parts: http://goo.gl/QVoK5dCar: http://goo.gl/hh6D3cMBT: http://goo.gl/cgbJMKYacht: http://goo.gl/EVb6P4Wind turbine (up): http://goo.gl/WUYMtsWind turbine (down): http://goo.gl/0WNFfC

23
Benefit of RTM
> Resin transfer molding (RTM)
• Mass production
• Same quality
• Parts can be manufactured with an A-class finish on both sides
Source: http://goo.gl/p1gD3w Source: http://goo.gl/pz65E2

24
Manufacturing Process
> FRP manufacturing process
• RTM
• VARTM (Vacuum Assisted)
• RTM Light (LRTM)
• CRTM
Pavel Simacek , SureshG. Advani, “Modeling resin flow and fiber tow saturation induced by distribution media collapse in VARTM”, Composites Science and Technology, Volume 67, Issue 13, October 2007, Pages 2757–2769
Source: http://goo.gl/i35Z8c
Twill weavePlain weave
http://goo.gl/S4A9wz
25
Problems and Challenges
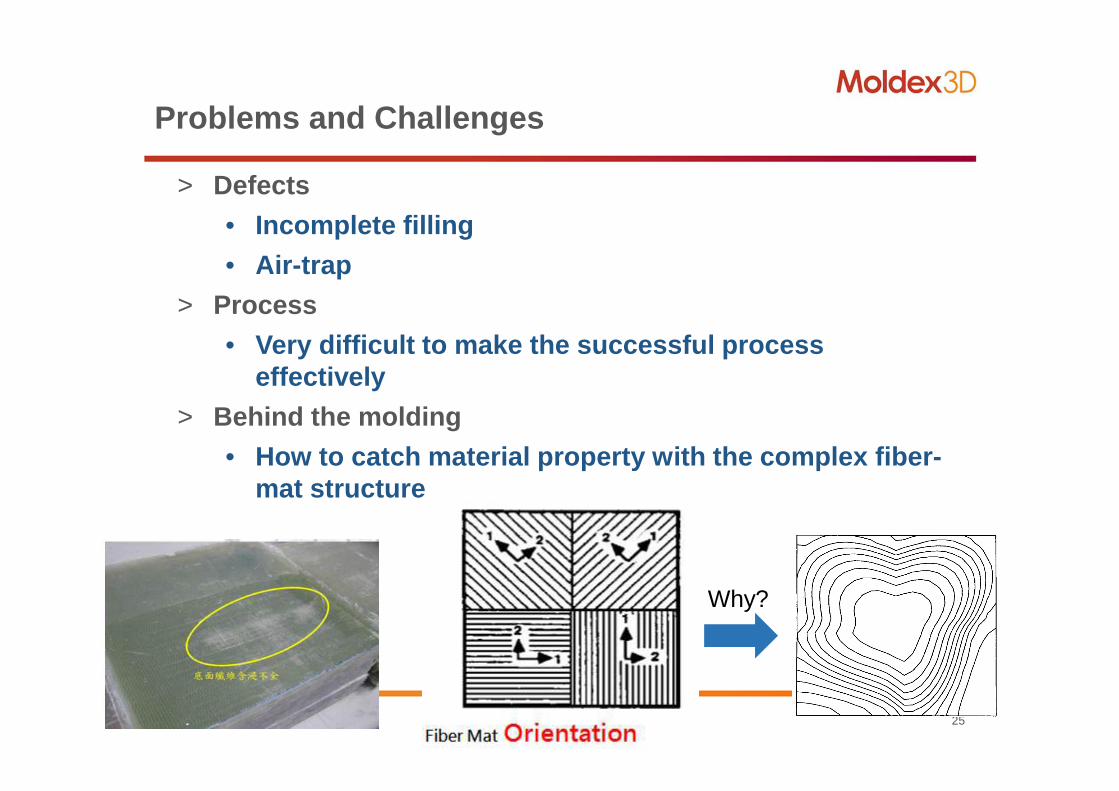
> Defects
• Incomplete filling
• Air-trap
> Process
• Very difficult to make the successful process effectively
> Behind the molding
• How to catch material property with the complex fib er-mat structure
Why?

26
Filling - Darcy’s law
• Permeability K (m 2 or cm 2) is used to describe the easiness of filling in different direction. The lar ger the K is, the faster the filling under the same pressur e difference.
=
zzzyzx
yzyyyx
xzxyxx
KKK
KKK
KKK
K
[ ] PK ∇−=µ1
vr
K33Transverse Direction
K11In-Plane Direction
K22 In-Plane Direction

27
Overcome the Challenges
> Developed Moldex3D Resin Transfer Molding (RTM) module
• Through dynamic features to understand process inside mechanism
• Help integrate for design, process, and material
• For quality retain and defects solving
• Using virtual system to make validation
• Allow us to make qualitative and quantitative prediction

28
Melt Front in RTM Module
> Distribution medium effect in thickness direction for 3D simulation
R. Mathur, D. Heider, C. Hoffmann, J.W. Gillespie JR., S. G. Advani, and B. K. Fink. “Flow Front Measurement and Model Validation in the Vacuum Assisted Resin Transfer Molding Process” Polymer Composite, August 2001, Vol. 22,
This work Reference
Geometry
Resin Inlet Distribution medium
CavityCavity

29
Case verification for 1kw wind blade
> Resin:
• SWANCOR 2502 A/B
> Pressure Control
• 1 atm
> PermeabilityCarbon fabric Distribution Media
Thickness[mm] 0.9653 0.9263
K11[m2] 8.387E-12 1.071E-9
K22[m2] 8.387E-12 1.071E-9
K33[m2] 8.400E-13 1.071E-9
0.399 0.491
E1E2E3E4

30
Geometry and Layup
Distribution media
模擬波前動畫
Distribution media
`Fiber MatDistribution Media
Fiber Mat `̀
E2E3E4 E1
E2E3E4 E1
Thickness Distribution

31
Flow Front Result
Inlet #2 Open
Inlet #3 Open
Inlet #4 Open
32
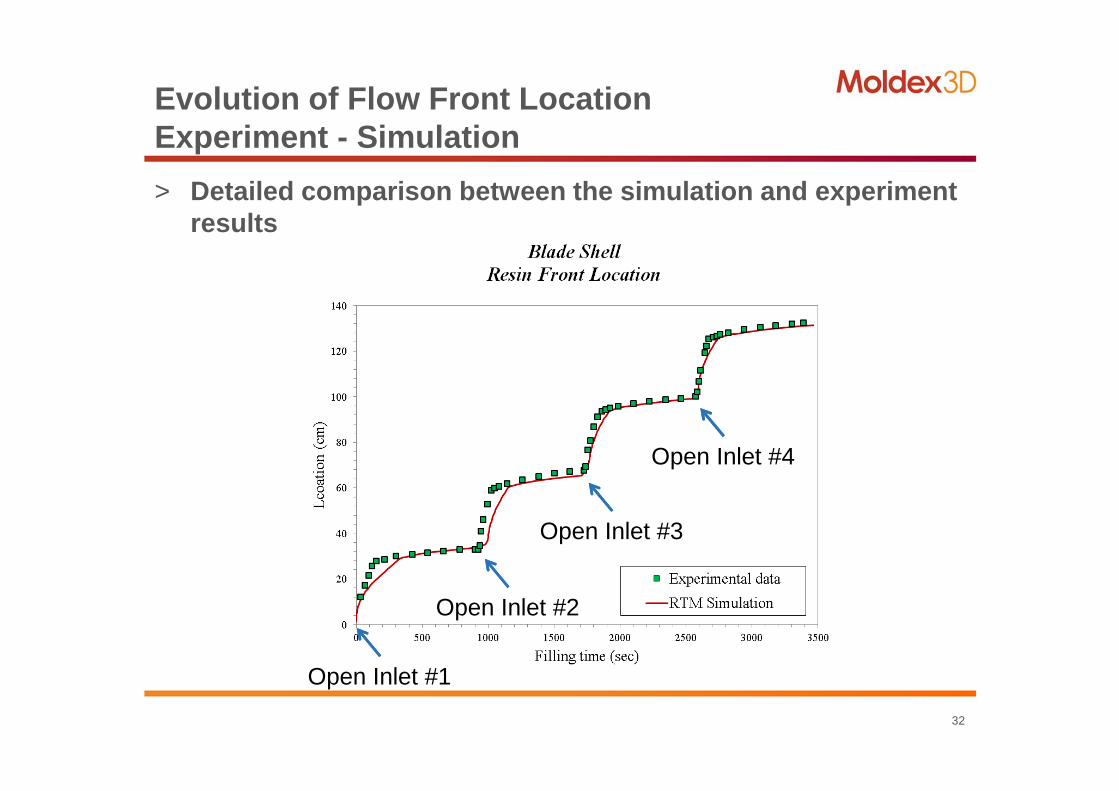
Evolution of Flow Front Location Experiment - Simulation
> Detailed comparison between the simulation and expe riment results
Open Inlet #2
Open Inlet #1
Open Inlet #3
Open Inlet #4
33
Moldex3D RTM
> Supports pressure/flow rate control, multi-inlet o pen/close control. The simulation result can reflect the infl uence of changing fiber mat type and orientation
> With true 3D simulation solver, Moldex3D can predic t the filling behavior in thickness direction and the ven ting region effect of the RTM process

34
Thank You