136-144 Parramatta Road Homebush - strathfield.nsw.gov.au · 17 TRAFFIC SIGNALS in Parramatta Road...
58
Suite 6, 20 Young Street, Neutral Bay NSW 2089 - PO Box 1868, Neutral Bay NSW 2089 Ph: 9904 3224 Proposed Mixed-Use Development 136-144 Parramatta Road Homebush TRAFFIC AND PARKING ASSESSMENT REPORT 4 April 2019 Ref 19072
Transcript of 136-144 Parramatta Road Homebush - strathfield.nsw.gov.au · 17 TRAFFIC SIGNALS in Parramatta Road...
Suite 6, 20 Young Street, Neutral Bay NSW 2089 - PO Box 1868, Neutral Bay NSW 2089
Ph: 9904 3224
Proposed Mixed-Use Development
136-144 Parramatta Road
Homebush
TRAFFIC AND PARKING ASSESSMENT REPORT
4 April 2019
Ref 19072
VARGA TRAFFIC PLANNING PTY LTD
TABLE OF CONTENTS
1. INTRODUCTION .............................................................................................. 1
2. PROPOSED DEVELOPMENT ........................................................................ 4
3. TRAFFIC ASSESSMENT ................................................................................. 14
4. PARKING ASSESSMENT ................................................................................ 24
APPENDIX A TRAFFIC SURVEY DATA
APPENDIX B SIDRA MOVEMENT SUMMARIES
LIST OF ILLUSTRATIONS
Figure 1 Location
Figure 2 Site
Figure 3 Road Hierarchy
Figure 4 Existing Traffic Controls
Figure 5 Existing Public Transport
Figure 6 Existing Parking Restrictions

VARGA TRAFFIC PLANNING PTY LTD
1
1. INTRODUCTION
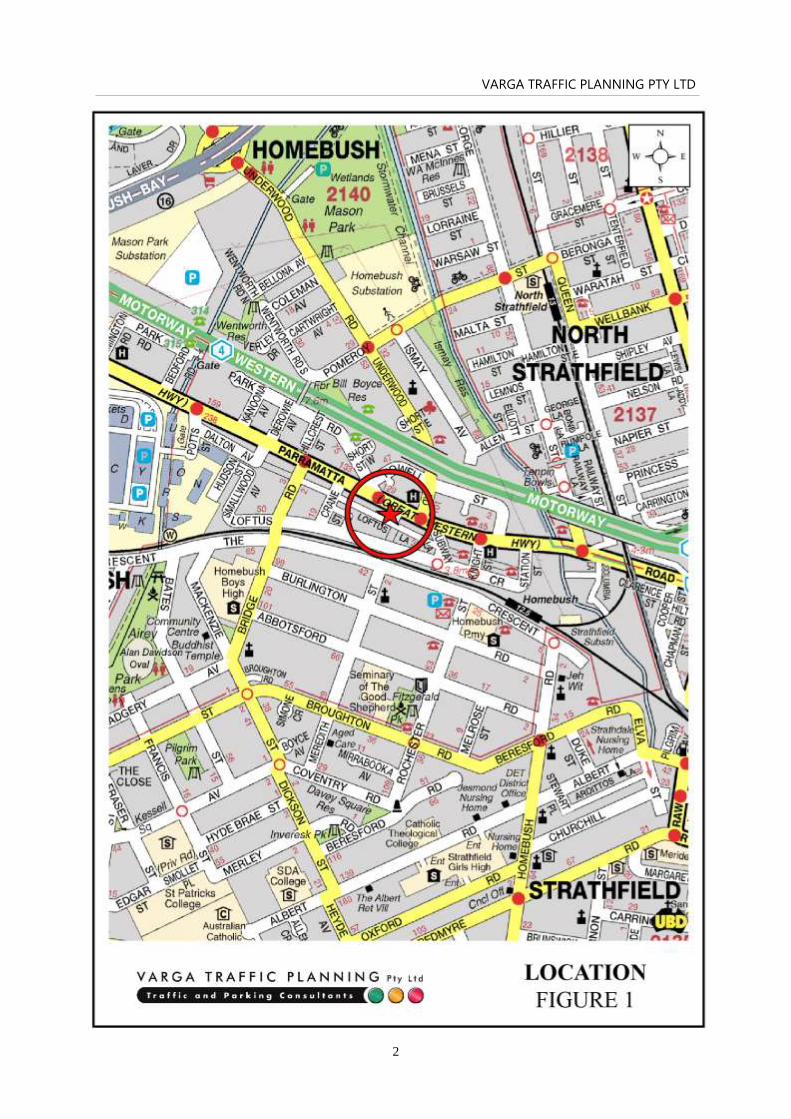
This report has been prepared to accompany a development application to Strathfield Council
for a mixed-use development to be located at 136-144 Parramatta Road, Homebush (Figures
1 and 2).
The proposed development involves the demolition of the existing buildings on the site to
facilitate the construction of a mixed-use building comprising a pub at ground floor level with
serviced apartments on the levels above.
Off-street parking is to be provided in a multi-level basement car parking area in accordance
with Council requirements.
The purpose of this report is to assess the traffic and parking implications of the development
proposal and to that end this report:
• describes the site and provides details of the development proposal
• reviews the road network in the vicinity of the site
• reviews the public transport facilities in the vicinity of the site
• estimates the traffic generation potential of the development proposal
• assesses the traffic implications of the development proposal in terms of road network
capacity
• reviews the geometric design features of the proposed car parking and loading facilities
for compliance with the relevant codes and standards
• assesses the adequacy and suitability of the quantum of off-street car parking and
loading provided on the site.
VARGA TRAFFIC PLANNING PTY LTD
2

VARGA TRAFFIC PLANNING PTY LTD
3

VARGA TRAFFIC PLANNING PTY LTD
4
2. PROPOSED DEVELOPMENT
Site
The site is located on the southern side of Parramatta Road in the local government area of
Strathfield Council and is formally known as Lots 4, 5 & 6 DP9154. The site is
approximately 1,600m2, rectangular in shape and bordered by roads on three sides
(Parramatta Road to the north and Loftus Lane to the south and east).
The existing development on Nos 136-140 Parramatta Road includes a single storey bulky
goods store/showroom (approximately 400m2 floor area) at the front of the site and 2-storey
auto workshop (approximately 250m2 floor area) at the rear. There is at grade car parking for
approximately 4 cars in the rear yard. The site is partly fenced and comprises 100%
hardstand area. The existing buildings are currently vacant and were most recently tenanted
by Autopro.
No. 144 Parramatta Road is occupied by a single storey retail premises currently tenanted by
Scooterino with a rear parking hardstand.
The locality surrounding the site is generally characterised by a mix of large sites used as
sales yards and showrooms, mixed use developments along Parramatta Road and walk-up
flats.
Homebush Rail Station is located within 500m walking distance to the east of the site.
The site is located approximately 13.6km from the Sydney CBD, 2km from the Homebush
Sports and Events Precinct of Sydney Olympic Park, 530m from North Strathfield Centre and
1.34km from Strathfield Town Centre. Sydney’s Flemington Markets are 800m to the west
of the site.
Augustus Loftus Reserve is located opposite the site on the southern side of Loftus Lane.
VARGA TRAFFIC PLANNING PTY LTD
5
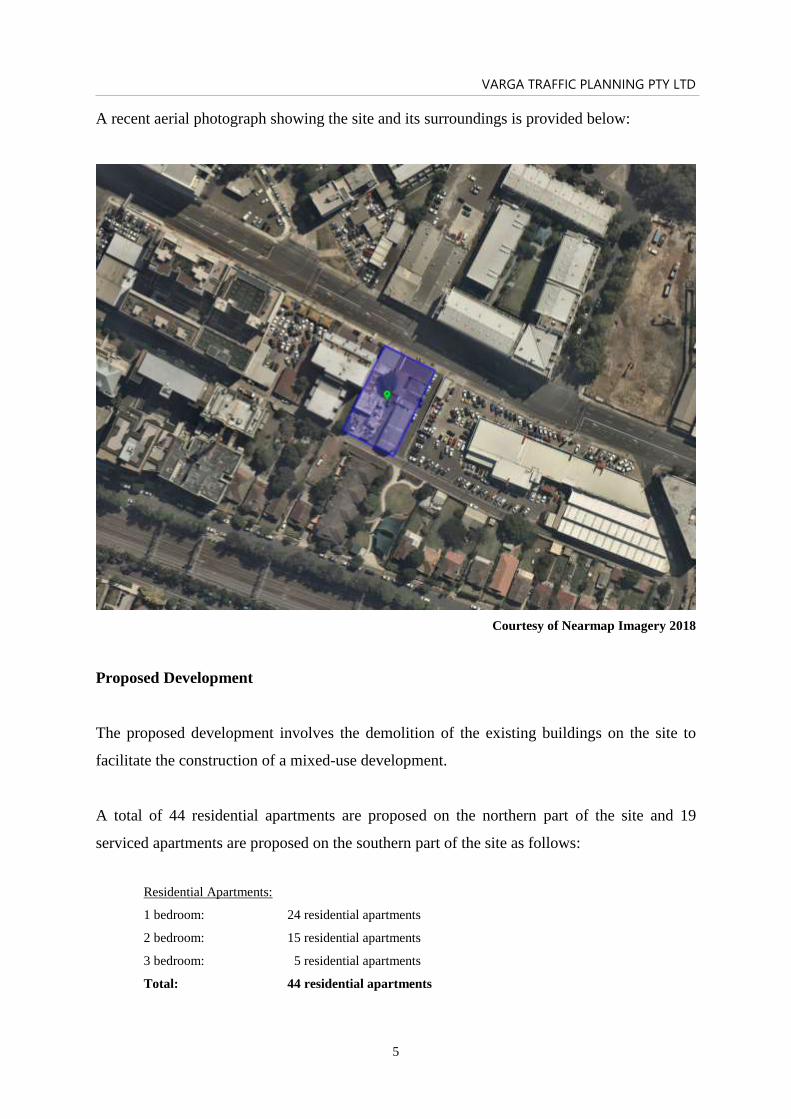
A recent aerial photograph showing the site and its surroundings is provided below:
Courtesy of Nearmap Imagery 2018
Proposed Development
The proposed development involves the demolition of the existing buildings on the site to
facilitate the construction of a mixed-use development.
A total of 44 residential apartments are proposed on the northern part of the site and 19
serviced apartments are proposed on the southern part of the site as follows:
Residential Apartments:
1 bedroom: 24 residential apartments
2 bedroom: 15 residential apartments
3 bedroom: 5 residential apartments
Total: 44 residential apartments
VARGA TRAFFIC PLANNING PTY LTD
6
Serviced Apartments:
2 bedroom: 16 residential apartments
3 bedroom: 3 residential apartments
Total: 19 serviced apartments
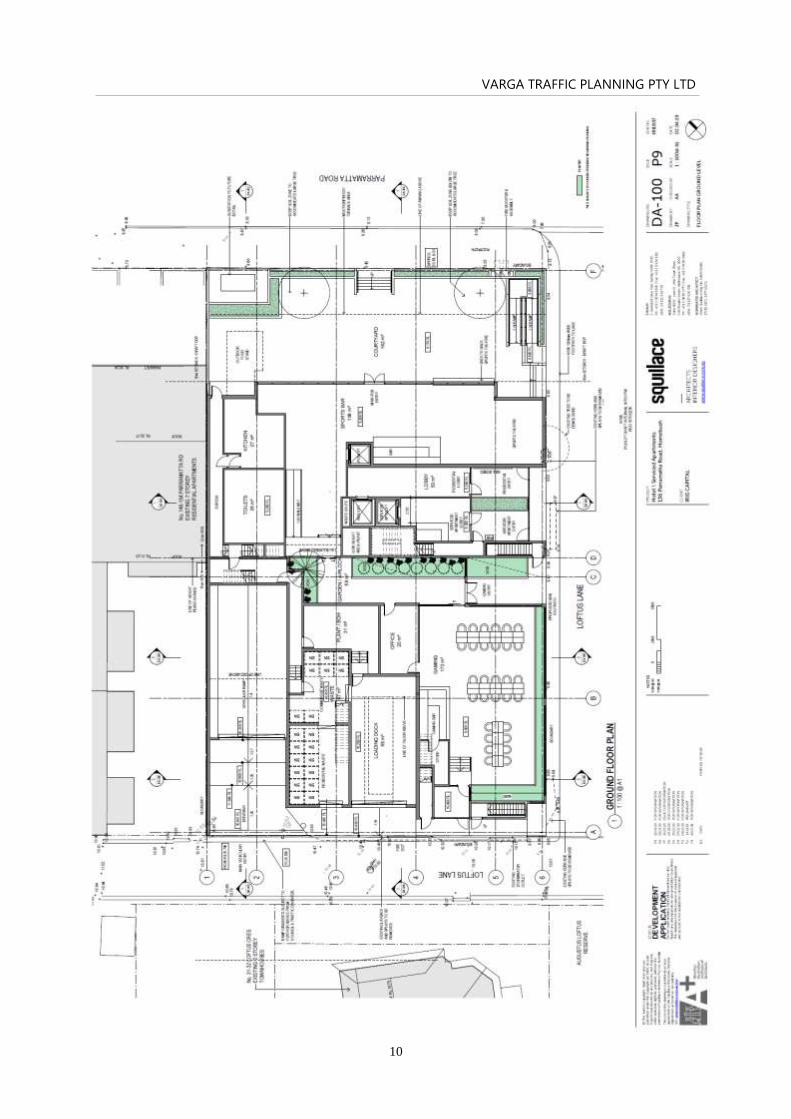
A pub is also proposed on the ground floor level of the building comprising a floor area of
532m2.
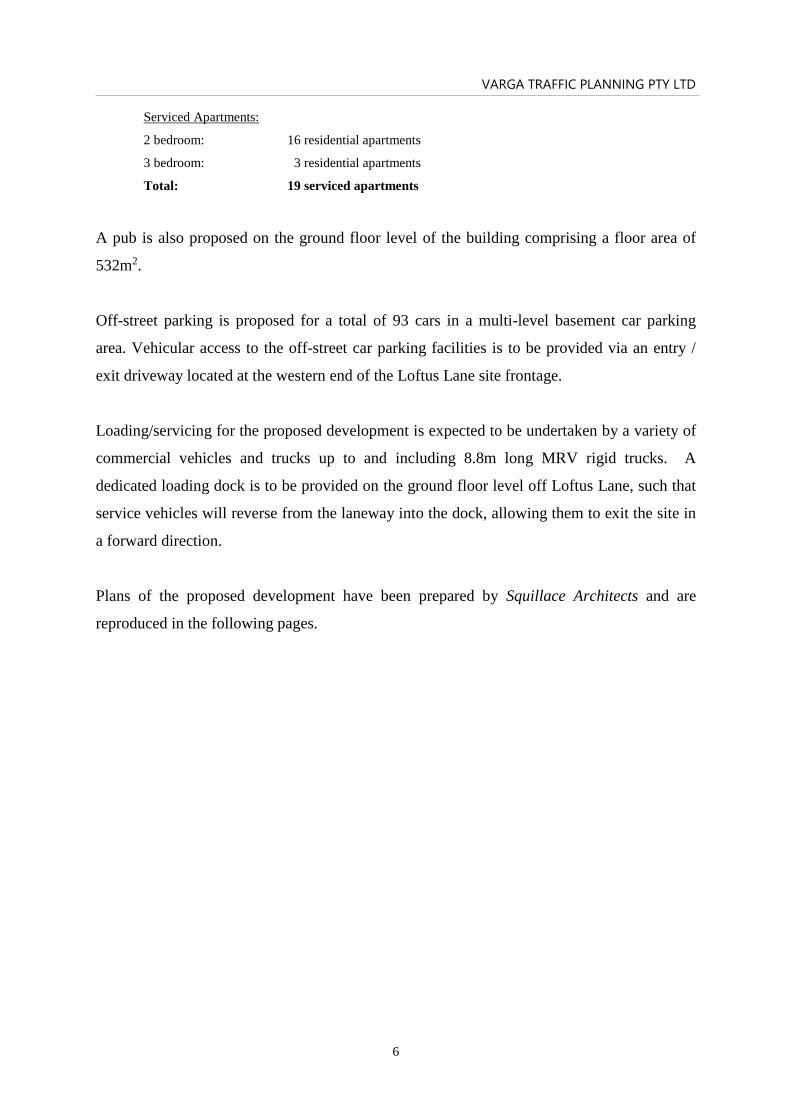
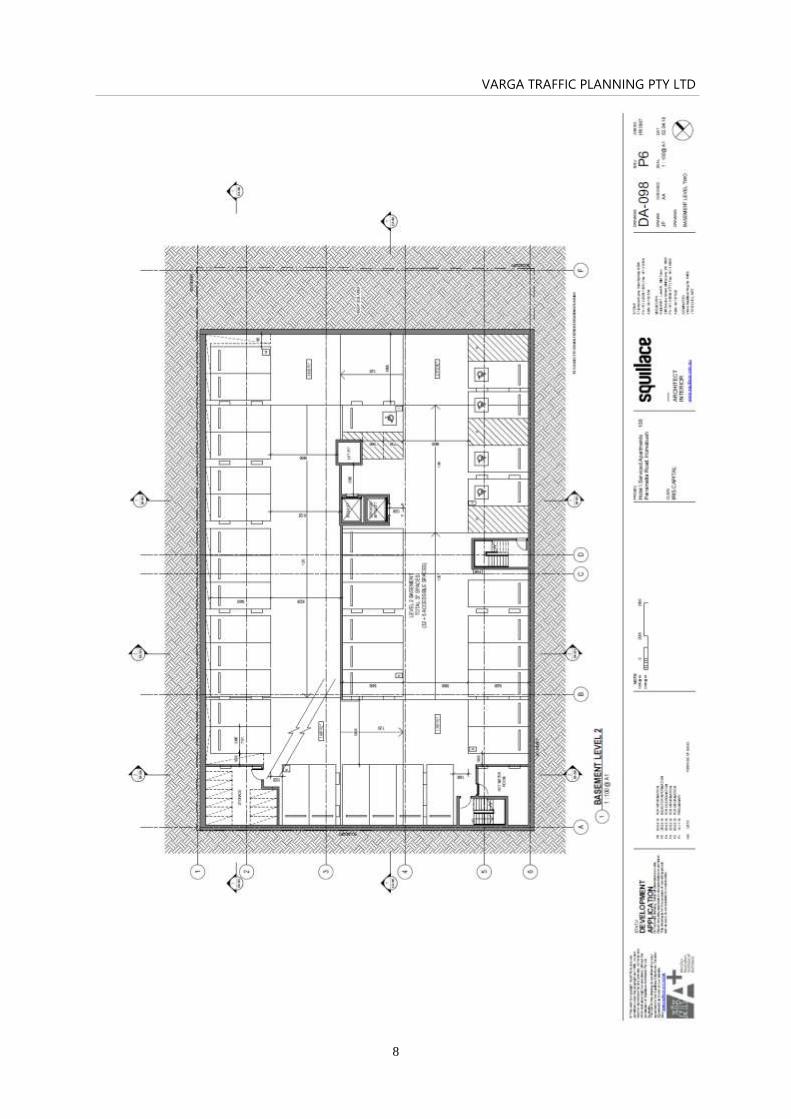
Off-street parking is proposed for a total of 93 cars in a multi-level basement car parking
area. Vehicular access to the off-street car parking facilities is to be provided via an entry /
exit driveway located at the western end of the Loftus Lane site frontage.
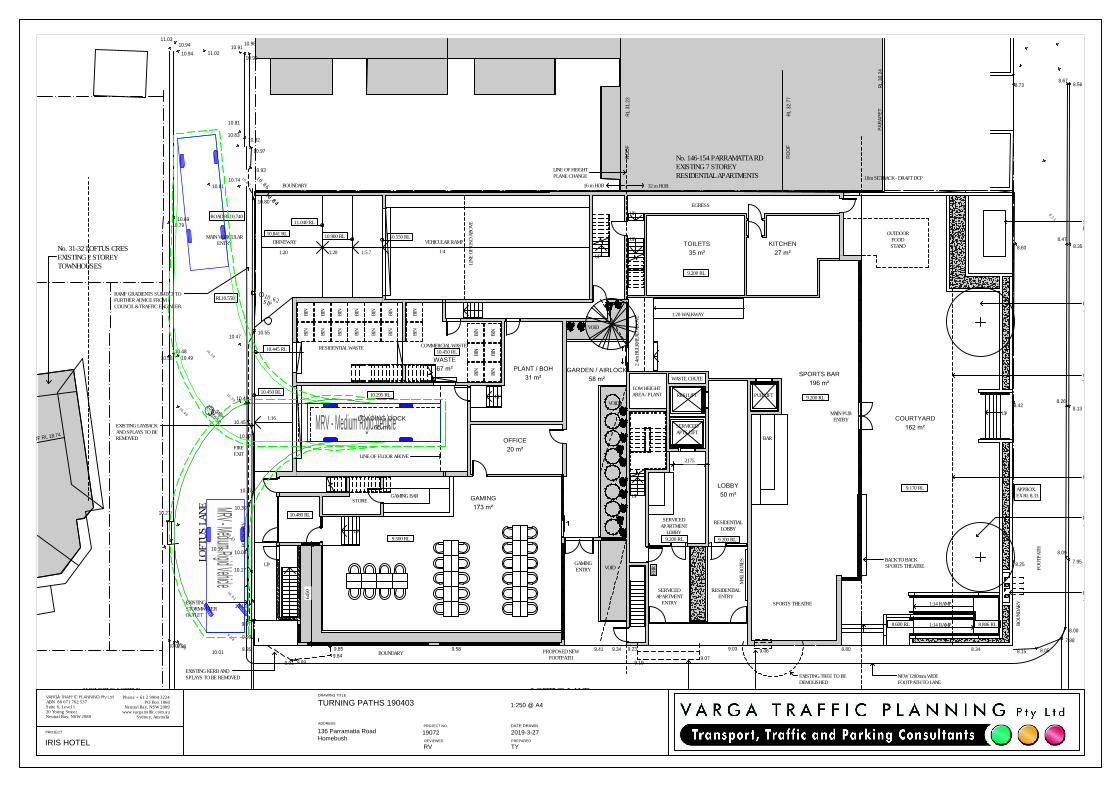
Loading/servicing for the proposed development is expected to be undertaken by a variety of
commercial vehicles and trucks up to and including 8.8m long MRV rigid trucks. A
dedicated loading dock is to be provided on the ground floor level off Loftus Lane, such that
service vehicles will reverse from the laneway into the dock, allowing them to exit the site in
a forward direction.
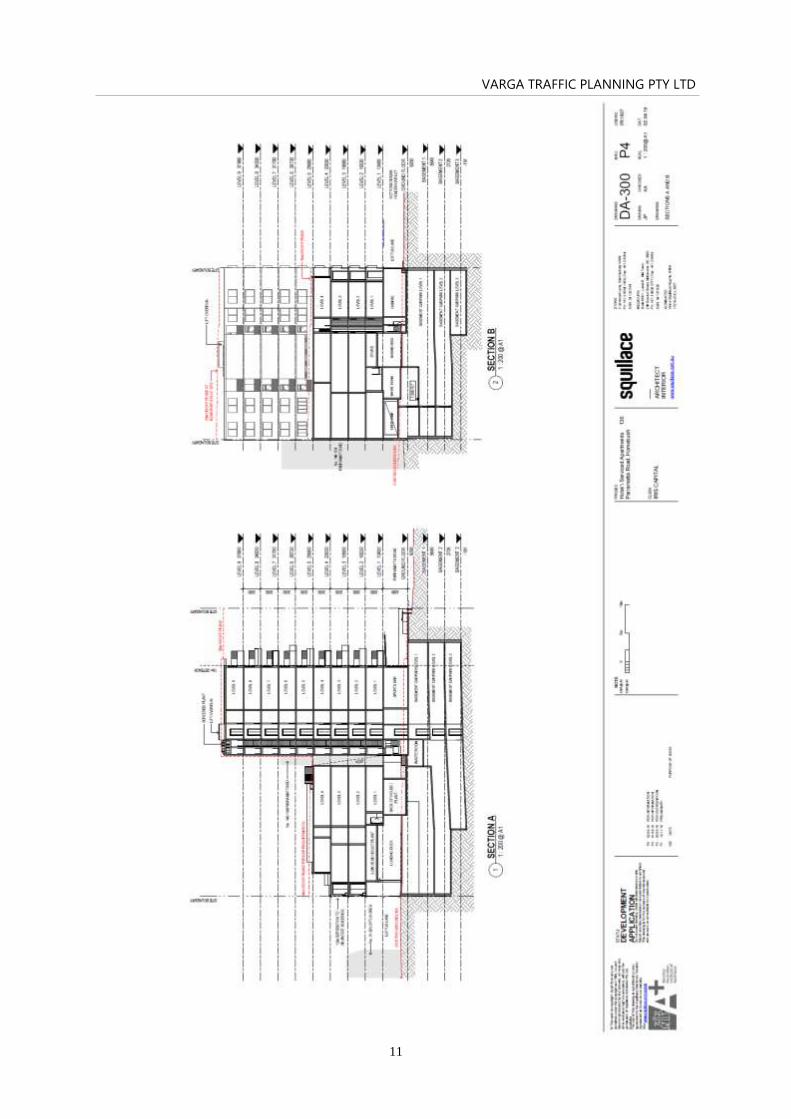
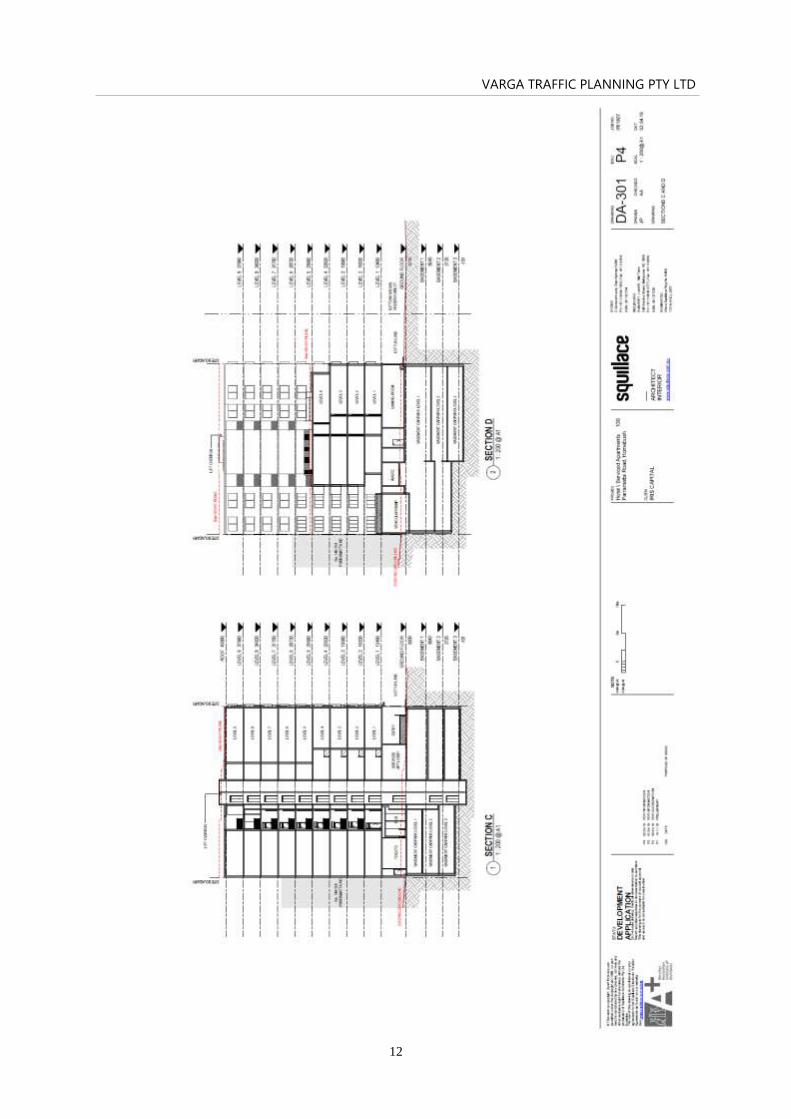
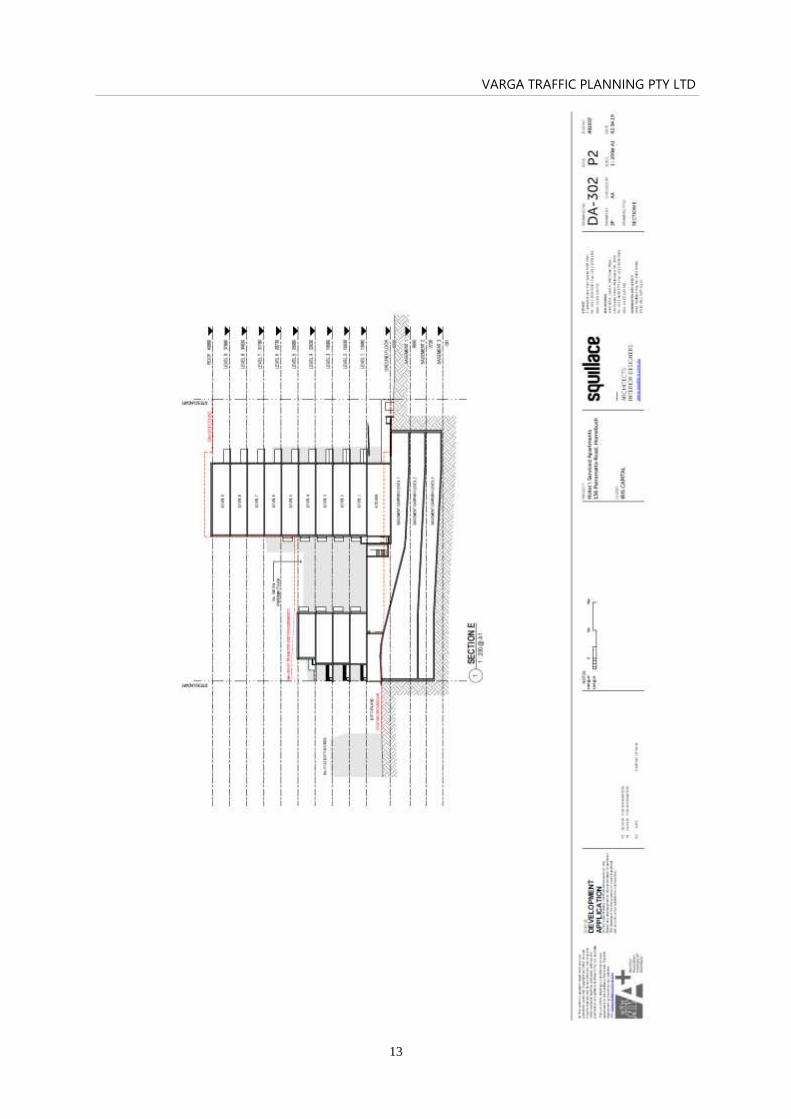
Plans of the proposed development have been prepared by Squillace Architects and are
reproduced in the following pages.
VARGA TRAFFIC PLANNING PTY LTD
7
VARGA TRAFFIC PLANNING PTY LTD
8

VARGA TRAFFIC PLANNING PTY LTD
9
VARGA TRAFFIC PLANNING PTY LTD
10
VARGA TRAFFIC PLANNING PTY LTD
11
VARGA TRAFFIC PLANNING PTY LTD
12
VARGA TRAFFIC PLANNING PTY LTD
13
VARGA TRAFFIC PLANNING PTY LTD
14
3. TRAFFIC ASSESSMENT
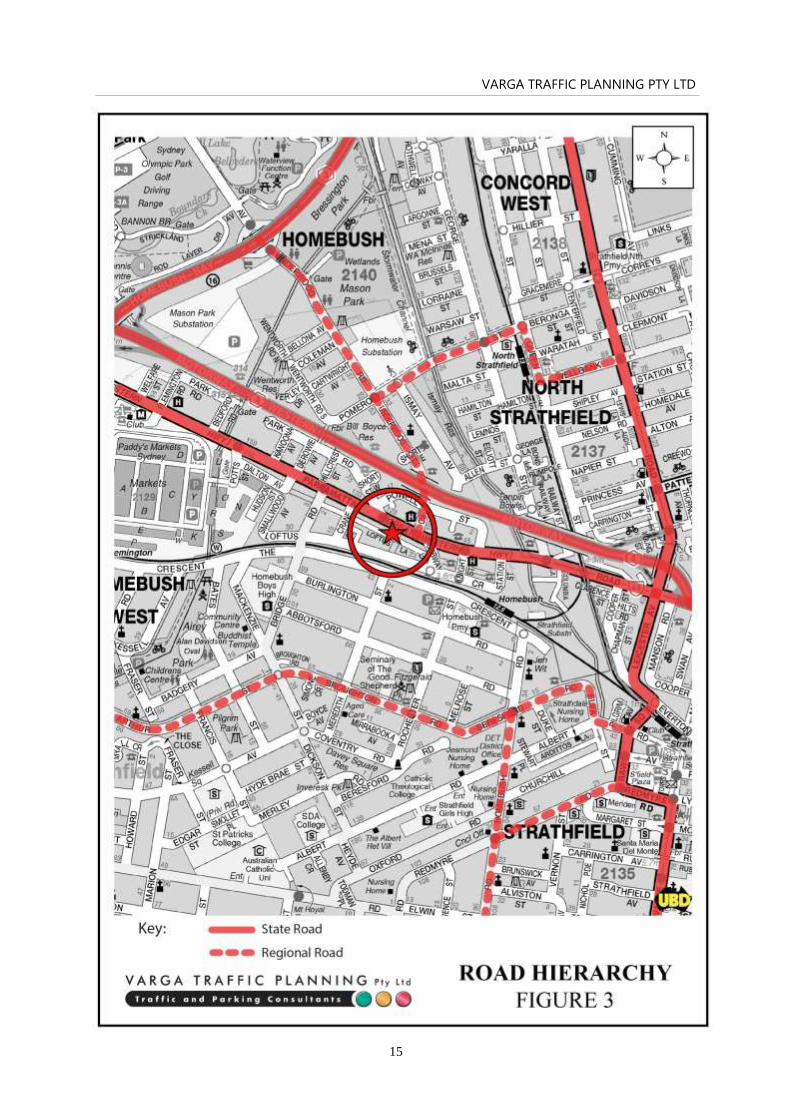
Road Hierarchy
The road hierarchy allocated to the road network in the vicinity of the site by the Roads and
Maritime Services is illustrated on Figure 3.
The M4 Motorway is classified by the RMS as a State Road and provides the key east-west
road link in the area, which extends from Concord in Sydney’s inner west to Lapstone at the
foothills of the Blue Mountains. It typically carries two traffic lanes in each direction in the
vicinity of the site, with opposing traffic flows separated by a central median island. All
intersections with the M4 Motorway are grade-separated.
Parramatta Road is also classified by the RMS as a State Road and provides another key east-
west road link in the area, linking Sydney CBD and Granville. It typically carries three traffic
lanes in each direction in the vicinity of the site, with Clearway restrictions applying along
both sides of the road during commuter peak periods.
Loftus Lane is a local, unclassified service lane that is primarily used to provide vehicular
access to those properties with street frontage to Parramatta Road. Kerbside parking is
generally permitted along one side of the laneway, subject to sign-posted restrictions.
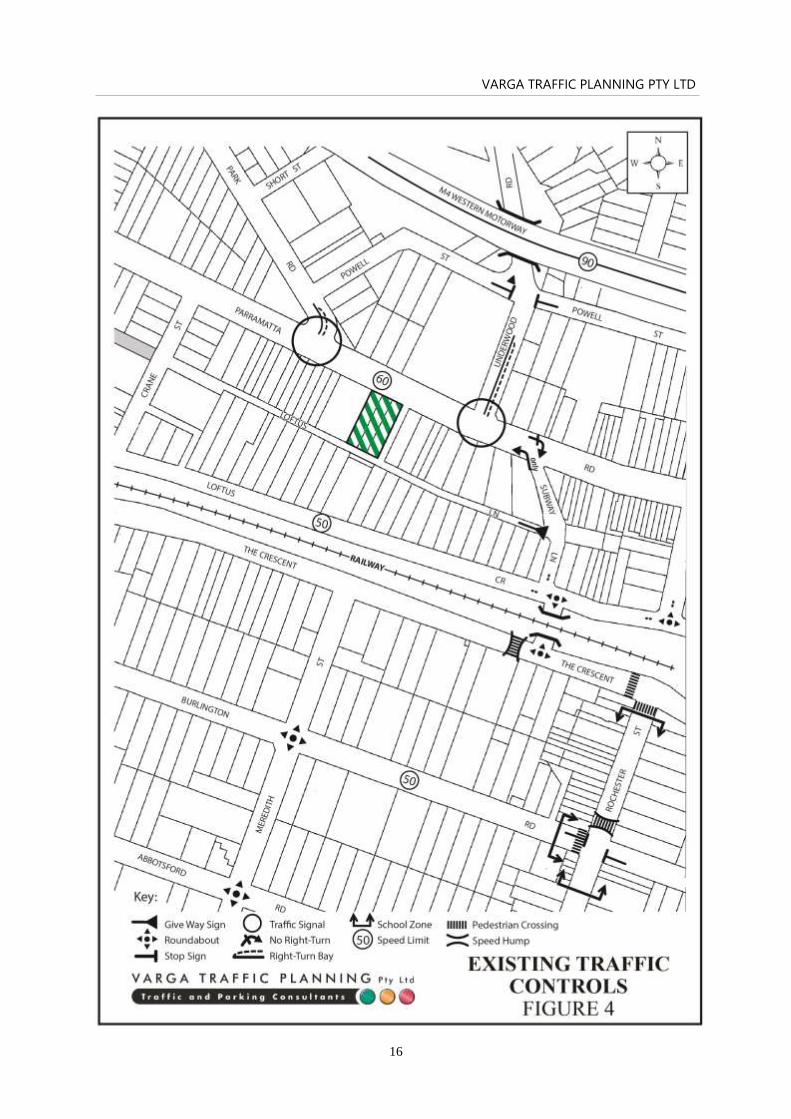
Existing Traffic Controls
The existing traffic controls which apply to the road network in the vicinity of the site are
illustrated on Figure 4. Key features of those traffic controls are:
▪ a 90 km/h SPEED LIMIT which applies to the M4 Motorway
▪ a 60 km/h SPEED LIMIT which applies to Parramatta Road
▪ a 50 km/h SPEED LIMIT which applies to all local roads in the area
VARGA TRAFFIC PLANNING PTY LTD
15
VARGA TRAFFIC PLANNING PTY LTD
16
VARGA TRAFFIC PLANNING PTY LTD
17
▪ TRAFFIC SIGNALS in Parramatta Road where it intersects with Park Road and
Underwood Road
▪ a NO-RIGHT TURN restriction in Parramatta Road onto Subway Lane
▪ a LEFT-TURN ONLY restriction in Subway Lane onto Parramatta Road
▪ ROUNDABOUTS in Loftus Crescent where it intersects with Subway Lane and Knight
Street.
Existing Public Transport
The existing public transport services available within the vicinity of the site are illustrated on
Figure 5.
The Homebush Railway Station is located within 500 metres walking distance (approx. 6
minutes) to / from the site servicing the T2 inner West & Leppington Line travelling between
Parramatta or Leppington to City and vice versa. Train services typically arrive / depart the
station at 5-10 minute intervals during commuter peak periods and at 15 minute intervals at
other times. This level of service frequency will enable commuters to turn up and go without
needing to rely on a train timetable.
The nearest bus stop on Parramatta Road is located within a convenient 250 metres walking
distance (approx. 3 minutes) to / from the site servicing bus route 525 (Parramatta to
Burwood via Sydney Olympic Park) and bus route 526 (Burwood to Rhodes Shopping
Centre).
On the above basis, it is clear that the site is readily accessible by existing public transport
services and is ideally located to facilitate travel by sustainable modes of transport.
Existing Traffic Conditions
An indication of the existing traffic conditions on the road network in the vicinity of the site
is provided by peak period traffic surveys undertaken as part of this traffic study.

VARGA TRAFFIC PLANNING PTY LTD
18
VARGA TRAFFIC PLANNING PTY LTD
19
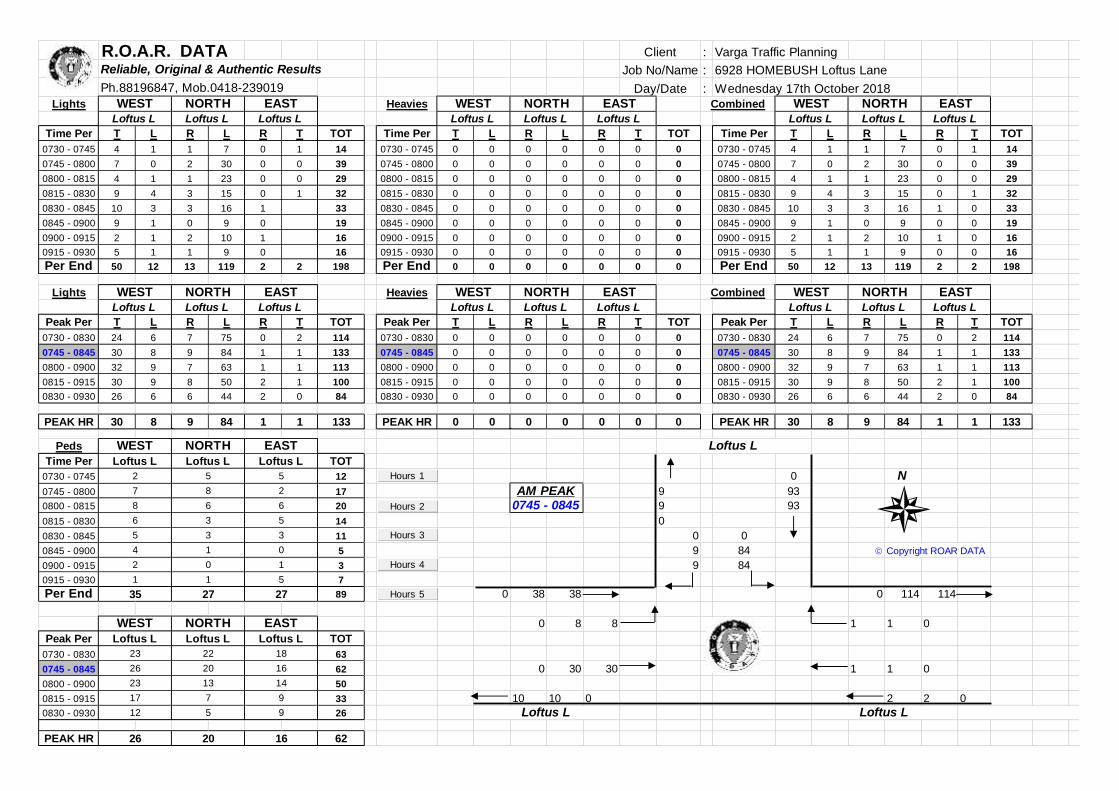
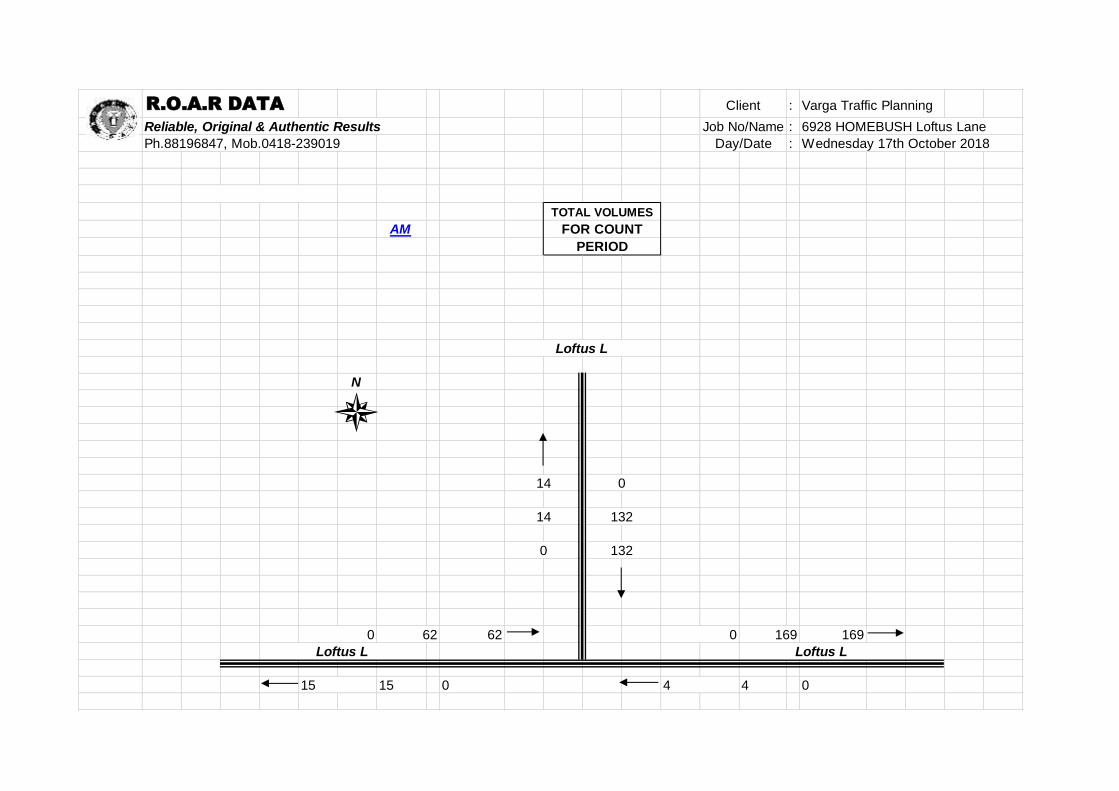
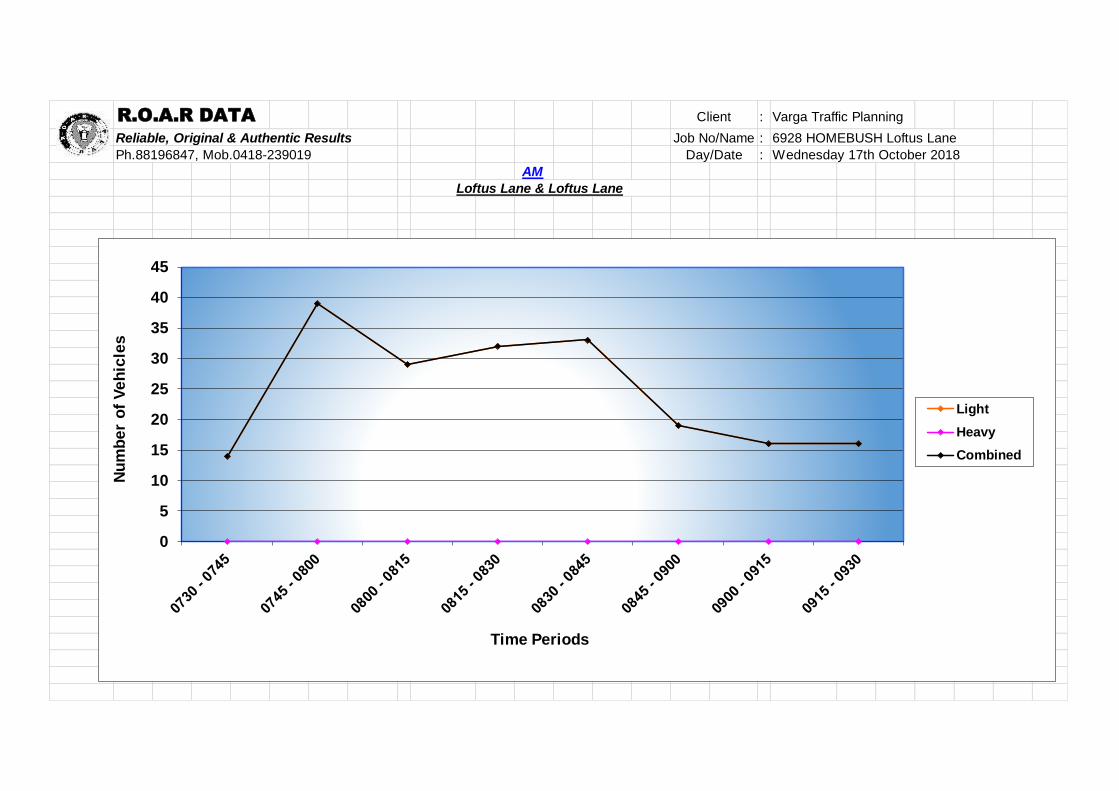
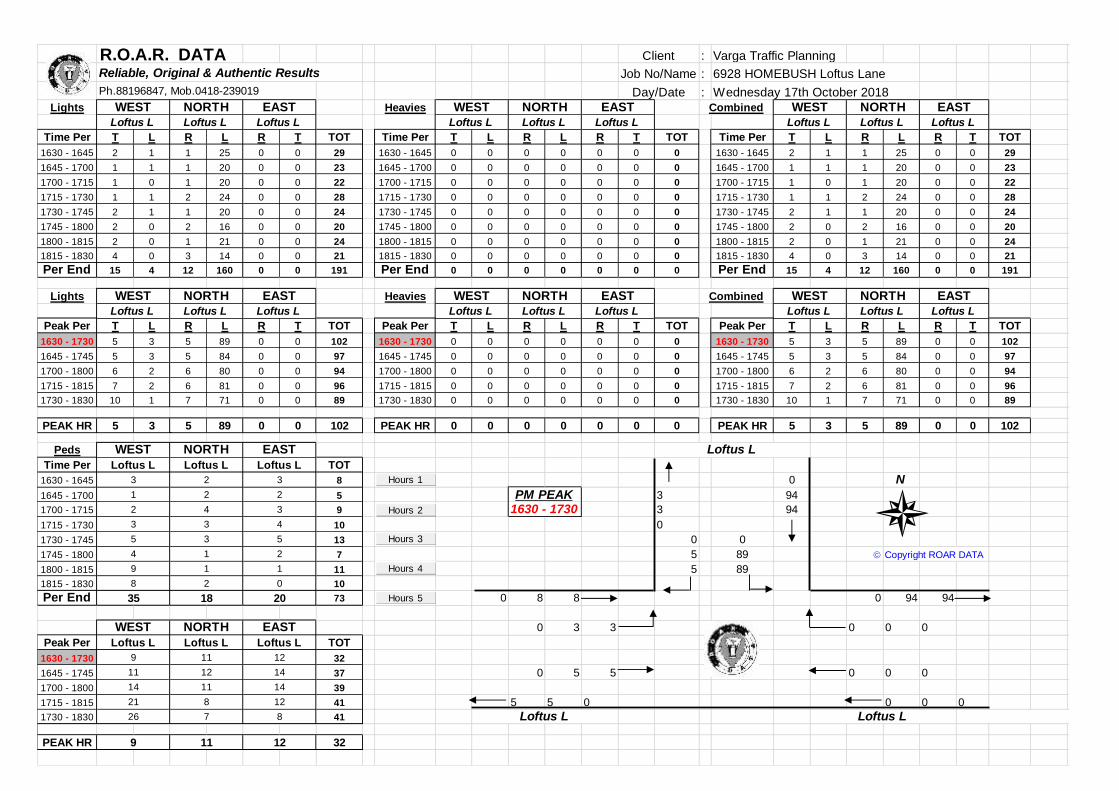
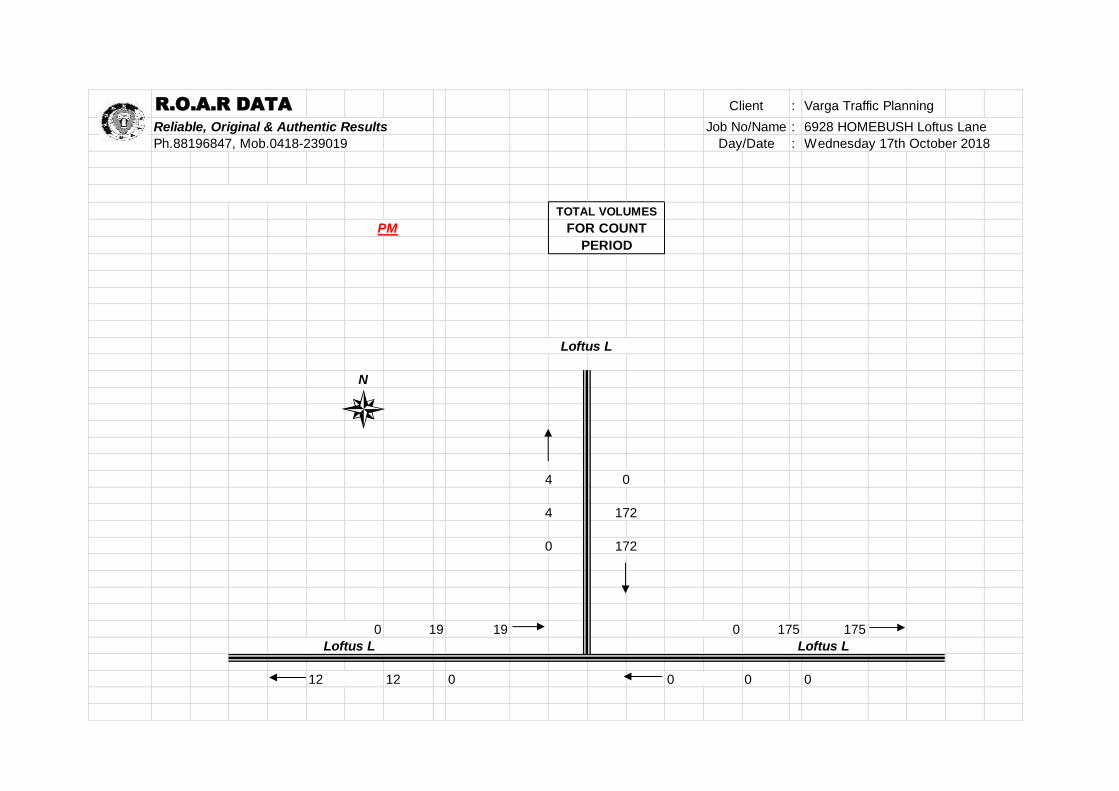
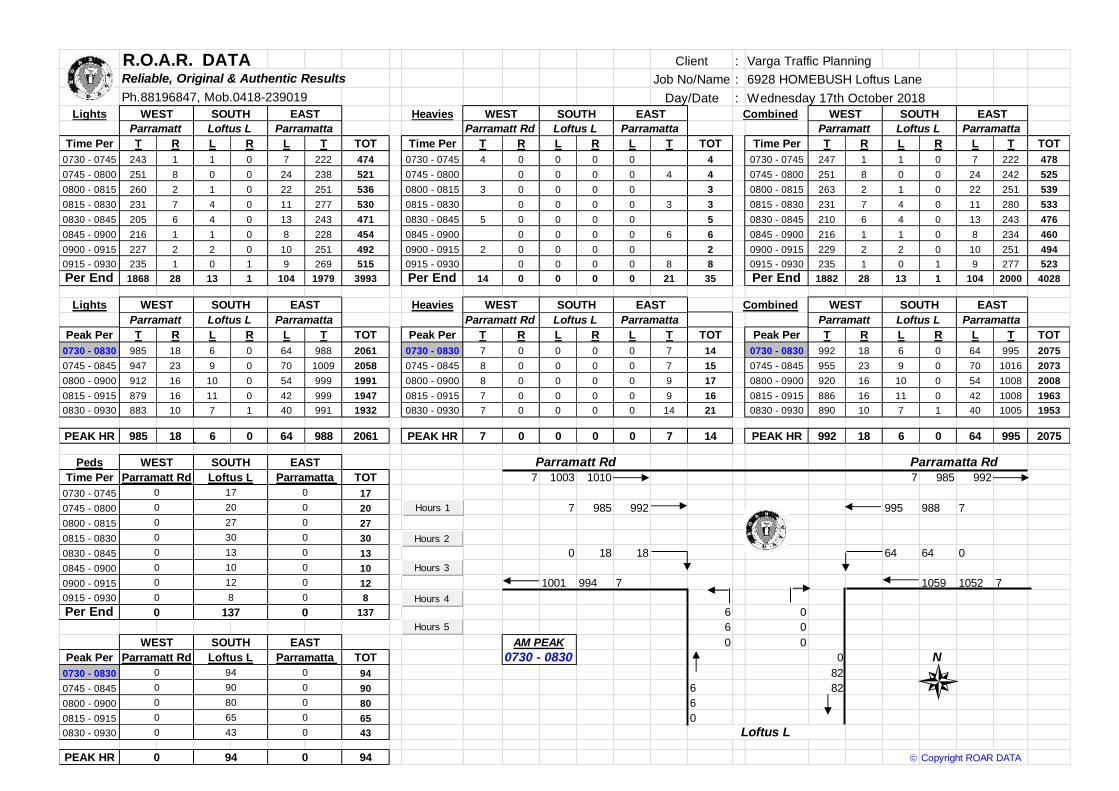
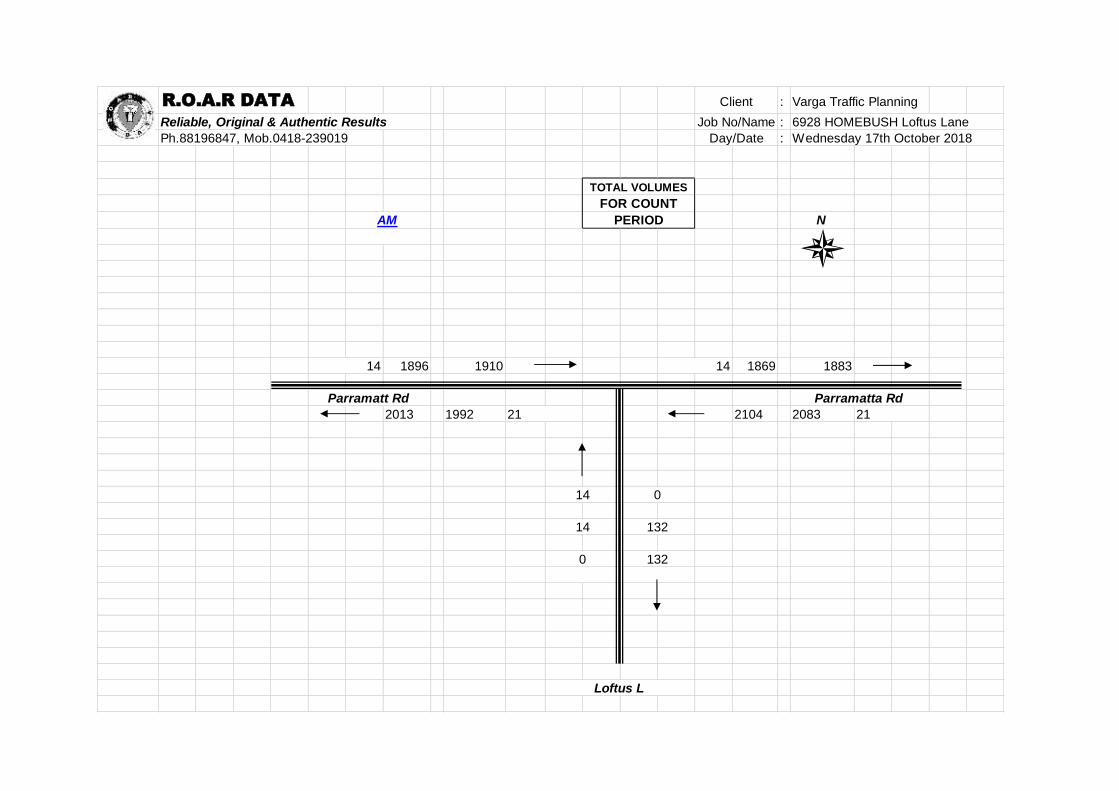
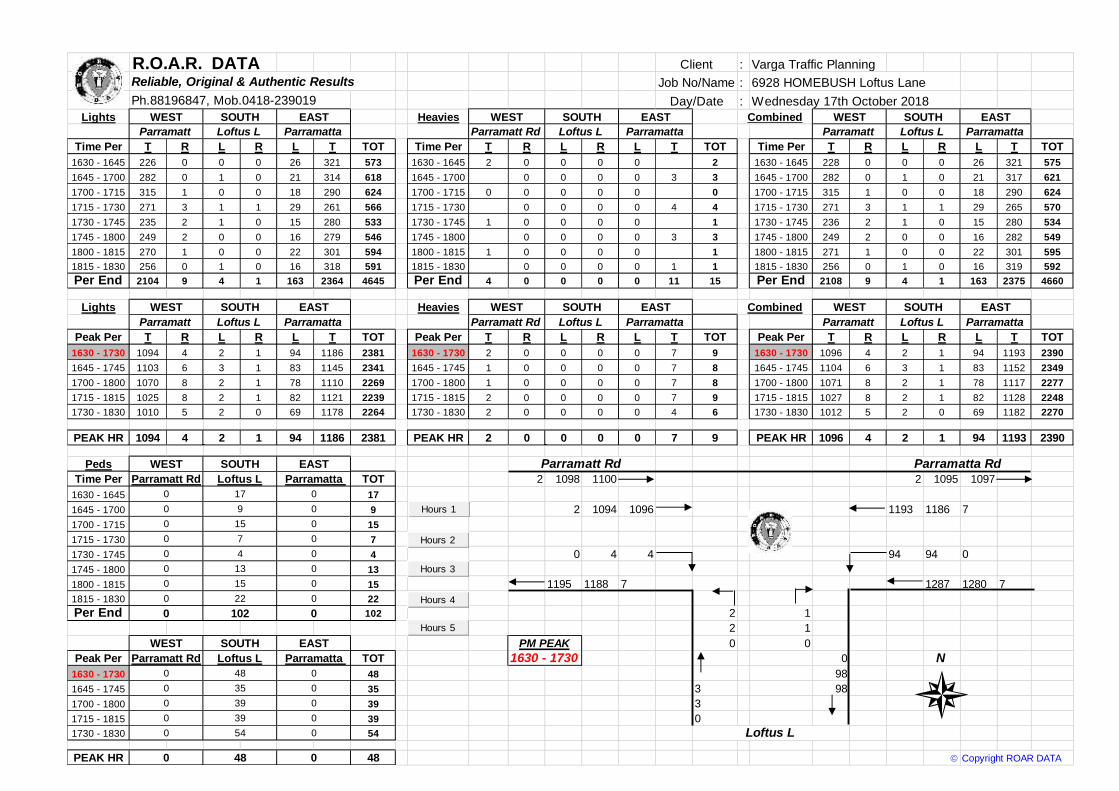
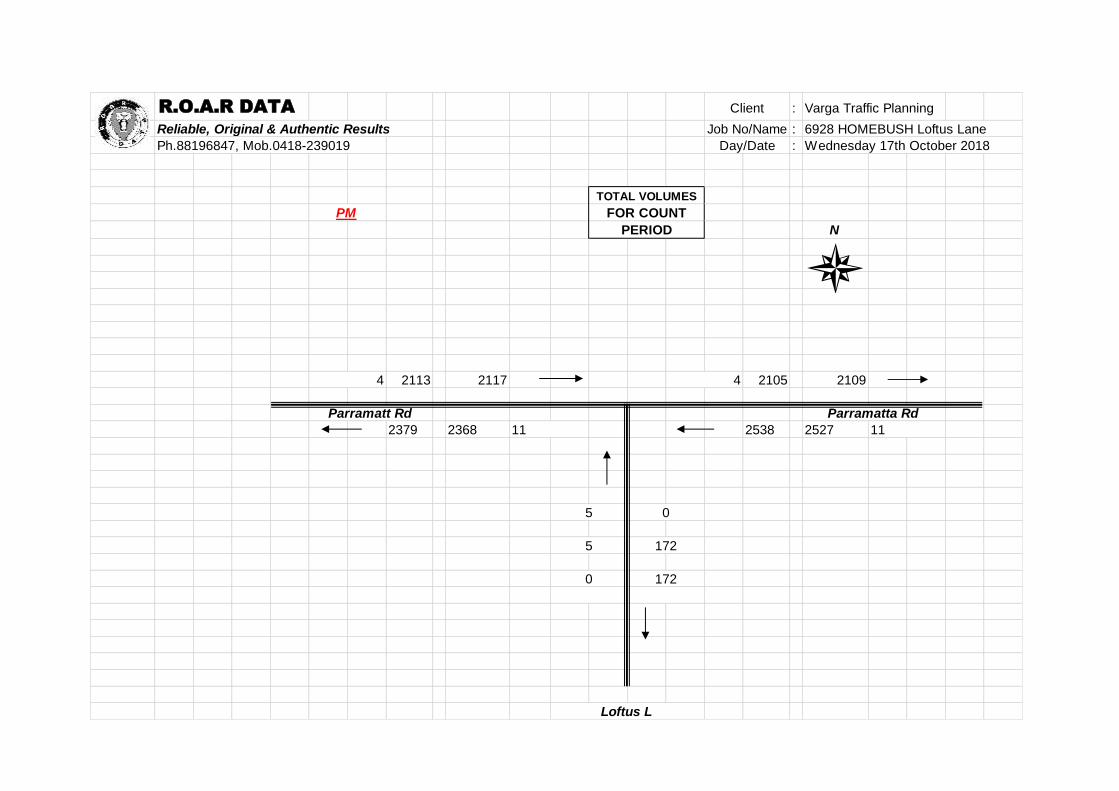
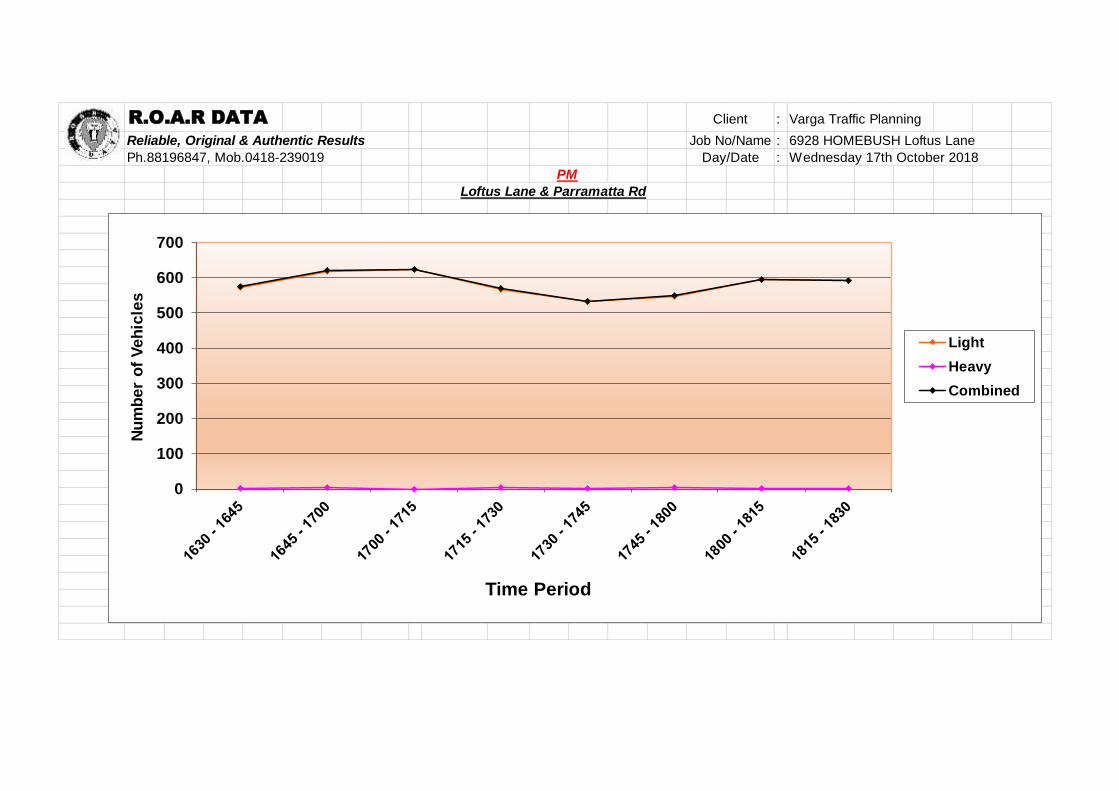
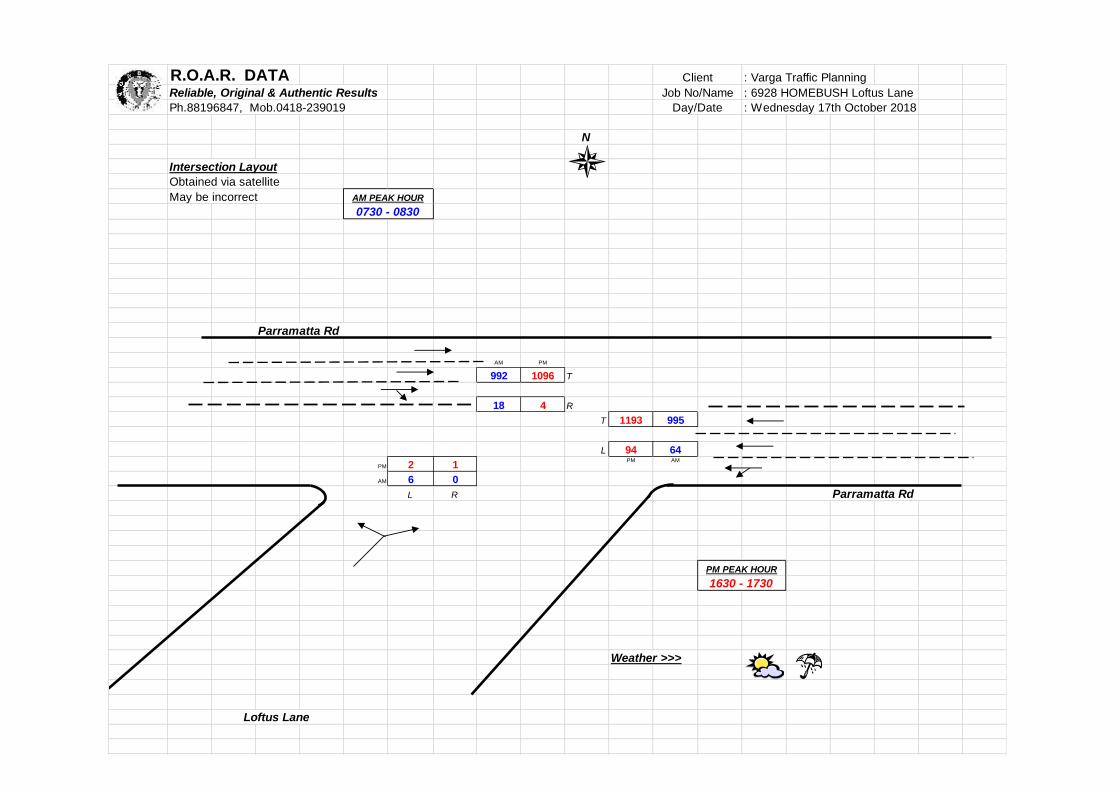
The traffic surveys were undertaken at the intersections of Parramatta Road / Loftus Lane and
Loftus Lane / Loftus Lane on Wednesday 17th October 2018 between 7:30am-9:30am and
4:30pm-6:30pm. The results of the traffic surveys are reproduced in full in Appendix A and
reveal that:
• two-way traffic flows in Parramatta Road are typically in the order of 2,000 to 2,400
vehicles per hour (vph) in the AM peak and PM peak hours
• two-way traffic flows in the north-south section of Loftus Lane are typically in the
order of 100 vph in the AM and PM peak hours
• two-way traffic flows in the east-west section of Loftus Lane are typically in the order
of 50 vph in the AM and PM peak hours.
Projected Traffic Generation
The traffic implications of a development proposal primarily concern the effects of the
additional traffic flows generated as a result of a development and its impact on the
operational performance of the adjacent road network during the morning and afternoon
weekday commuter peak periods.
An indication of the traffic generation potential of the development proposal is provided by
reference to the Roads and Maritime Services publication Guide to Traffic Generating
Developments, Section 3 - Landuse Traffic Generation (October 2002) and the updated traffic
generation rates in the RMS Technical Direction (TDT 2013/04a) document.
The RMS Technical Direction document specifies that it replaces those sections of the RMS
Guide indicated, and that it must be followed when RMS is undertaken trip generation and/or
parking demand assessments.
The RMS Guidelines and the updated TDT 2013/04a are based on extensive surveys of a
wide range of land uses and nominate the following traffic generation rates which are
applicable to the residential component of the development proposal:

VARGA TRAFFIC PLANNING PTY LTD
20
High Density Residential Flat Dwellings
AM: 0.19 peak hour vehicle trips per unit
PM: 0.15 peak hour vehicle trips per unit
However, neither the RMS Guidelines or Technical Direction nominates a traffic generation
rate for pubs or serviced apartments.
For the pub component 16 parking spaces are proposed, based on surveys of a similar nearby
development, as detailed later in the report. If it conservatively estimated that the duration of
stay at the pub is 1.5 hours, that equates to a traffic generation potential of less than 10
vehicles per hour (vph).
For the serviced apartments component of the development proposal, reference is again made
to the traffic generation rates of 0.19/0.15 vph/dwelling nominated in the RMS Technical
Direction 2013/04a in respect of high density residential flat buildings.
Application of the above traffic generation rates to the development proposal yields a traffic
generation potential of approximately 12 vehicle trips per hour (vph) during the AM peak
hour and 20 vph during the PM peak hour, as set out below:
Projected Future Traffic Generation Potential
AM PM
Residential Apartments (44 apartments): 8.4 vph 6.6 vph
Serviced Apartments (19 apartments): 3.6 vph 2.9 vph
Pub (532m2): N/A 10.0 vph
TOTAL TRAFFIC GENERATION POTENTIAL: 12.0 vph 19.5 vph
That projected future level of traffic generation potential should however, be offset or
discounted by the volume of traffic which could reasonably be expected to be generated by
the existing uses of the site, in order to determine the nett increase (or decrease) in traffic
generation potential expected of the site to occur as a consequence of the development
proposal.
The RMS Guidelines and Technical Direction nominate the following traffic generation rates
which are applicable to the existing uses of the site:
VARGA TRAFFIC PLANNING PTY LTD
21
Bulky Goods Retail Stores
2.7 PM peak hour vehicle trips per 100m2 GFA
Car Tyre Retail Outlets
1 PM peak hour vehicle trips per 100m2 site area
Application of the above traffic generation rates to the existing buildings on the site yields a
traffic generation potential of approximately 13 vph during the AM peak hour and 24 vph
during the PM peak hour as set out below:
Existing Peak Hour Traffic Generation Potential
AM PM
Bulky Goods Retail Store (~800m2): 10.8 vph 21.6 vph
Vehicle Workshop (~250m2): 2.5 vph 2.5 vph
NETT INCREASE IN TRAFFIC GENERATION POTENTIAL: 13.3 vph 24.1 vph
Accordingly, it is likely that the proposed development will result in a nett decrease in the
traffic generation potential of the site of approximately 1 vph during the AM peak hour and a
nett decrease in the traffic generation potential of the site of of approximately 5 vph during
the PM peak hour, as set out below:
Projected Nett Change in Peak Hour Traffic Generation Potential
of the Site as a Consequence of the Development Proposal
AM PM
Projected Future Traffic Generation Potential: 12.0 vph 19.5 vph
Less Existing Traffic Generation Potential: -13.3 vph -24.1 vph
NETT CHANGE IN TRAFFIC GENERATION POTENTIAL: -1.3 vph -4.6 vph
Notwithstanding the above, for the purposes of this assessment, it has been assumed that all
of the projected future traffic flows of 12 vph in the AM peak hour and 20 vph in PM peak
hour, will be new or “additional” to the existing traffic flows currently using the adjacent
road network.
That projected increase in the traffic generation potential of the site as a consequence of the
planning proposal will clearly not have any unacceptable traffic implications in terms of road
network capacity, as is demonstrated by the following section of this report.
VARGA TRAFFIC PLANNING PTY LTD
22
Traffic Implications - Road Network Capacity
The traffic implications of those additional traffic flows on the operational performance of
the nearby road network has been assessed using the SIDRA program which is widely used
by the RMS and many LGA’s. Criteria for evaluating the results of SIDRA analysis are
reproduced in the following pages.
Parramatta Road / Loftus Lane Intersection
The results of the SIDRA analysis of the subject intersection is summarised in Tables 1,
revealing that:
▪ the intersection currently operates at Level of Service “B” under the existing traffic
demands during the AM peak hour with total average vehicle delays in the order of
0.6 seconds/vehicle
▪ the intersection currently operates at Level of Service “D” under the existing traffic
demands during the PM peak hour with total average vehicle delays in the order of 0.4
seconds/vehicle
▪ under the projected future traffic demands expected to be generated by the
development proposal, the intersection is expected to continue to operate at existing
Levels of Service during both the AM and PM peak hour, with increases in total
average vehicle delays of less than 0.1 second/vehicle.
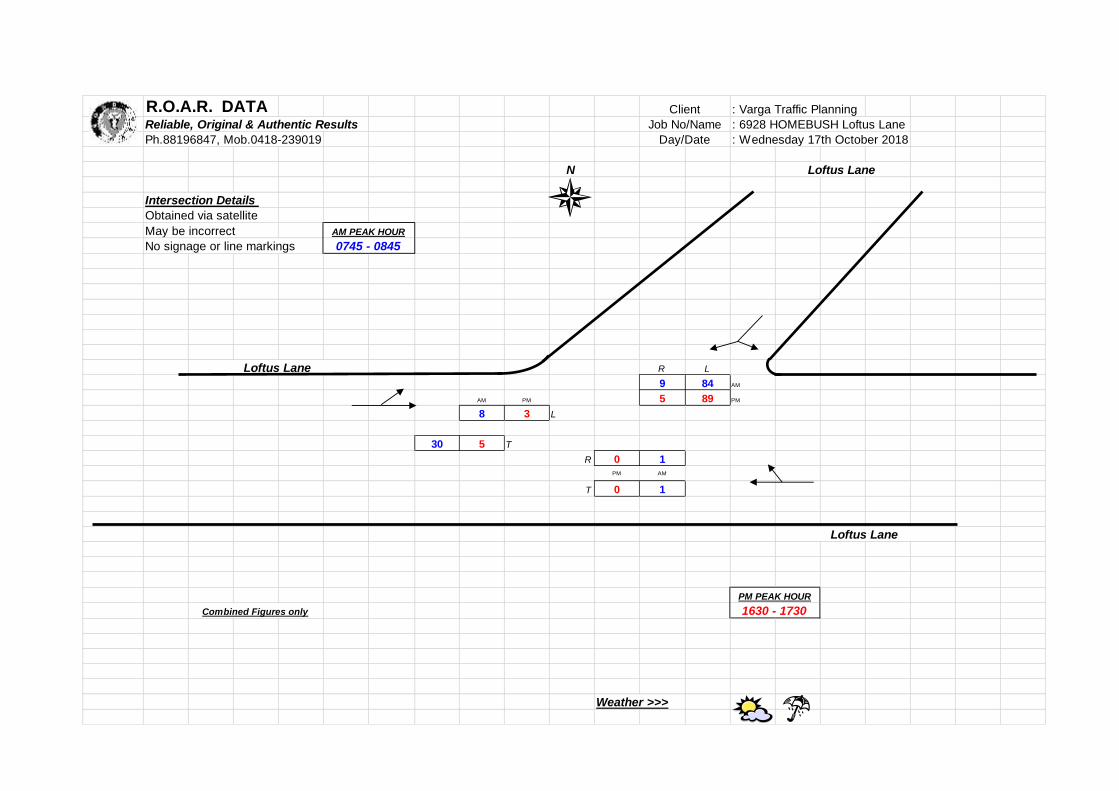
Loftus Lane / Loftus Lane Intersection
The results of the SIDRA analysis of the subject intersection is summarised in Tables 2,
revealing that:
▪ the intersection currently operates at Level of Service “A” under the existing traffic
demands during both the AM and PM peak hour with total average vehicle delays in
the order of 4 seconds/vehicle
VARGA TRAFFIC PLANNING PTY LTD
23
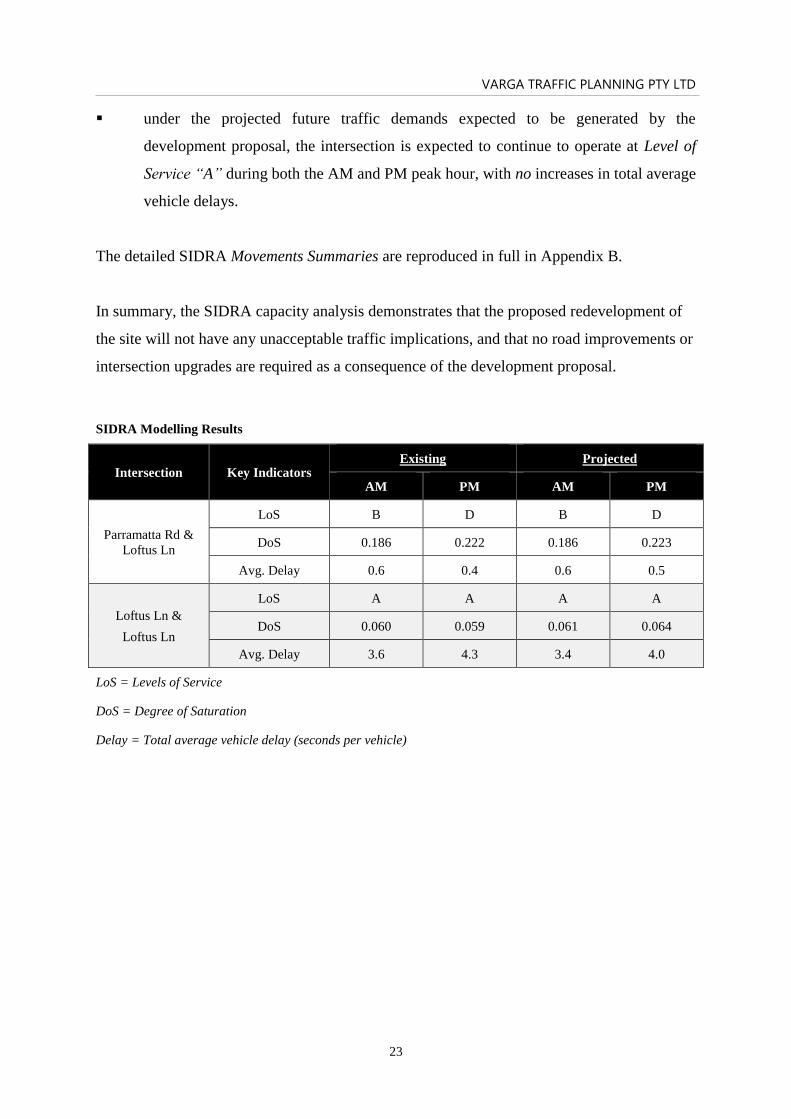
▪ under the projected future traffic demands expected to be generated by the
development proposal, the intersection is expected to continue to operate at Level of
Service “A” during both the AM and PM peak hour, with no increases in total average
vehicle delays.
The detailed SIDRA Movements Summaries are reproduced in full in Appendix B.
In summary, the SIDRA capacity analysis demonstrates that the proposed redevelopment of
the site will not have any unacceptable traffic implications, and that no road improvements or
intersection upgrades are required as a consequence of the development proposal.
SIDRA Modelling Results
Intersection Key Indicators Existing Projected
AM PM AM PM
Parramatta Rd &
Loftus Ln
LoS B D B D
DoS 0.186 0.222 0.186 0.223
Avg. Delay 0.6 0.4 0.6 0.5
Loftus Ln &
Loftus Ln
LoS A A A A
DoS 0.060 0.059 0.061 0.064
Avg. Delay 3.6 4.3 3.4 4.0
LoS = Levels of Service
DoS = Degree of Saturation
Delay = Total average vehicle delay (seconds per vehicle)
VARGA TRAFFIC PLANNING PTY LTD
24
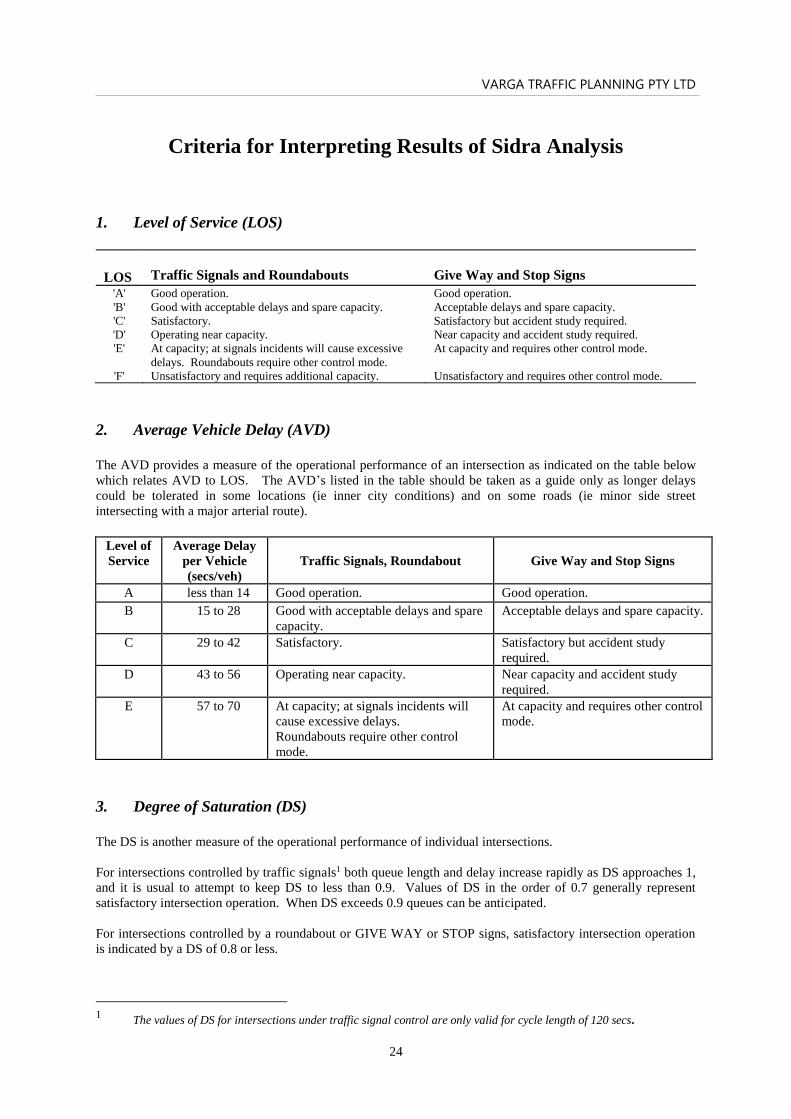
Criteria for Interpreting Results of Sidra Analysis
1. Level of Service (LOS)
LOS
Traffic Signals and Roundabouts
Give Way and Stop Signs 'A'
'B'
'C'
'D'
'E'
'F'
Good operation.
Good with acceptable delays and spare capacity.
Satisfactory.
Operating near capacity.
At capacity; at signals incidents will cause excessive
delays. Roundabouts require other control mode.
Unsatisfactory and requires additional capacity.
Good operation.
Acceptable delays and spare capacity.
Satisfactory but accident study required.
Near capacity and accident study required.
At capacity and requires other control mode.
Unsatisfactory and requires other control mode.
2. Average Vehicle Delay (AVD)
The AVD provides a measure of the operational performance of an intersection as indicated on the table below
which relates AVD to LOS. The AVD’s listed in the table should be taken as a guide only as longer delays
could be tolerated in some locations (ie inner city conditions) and on some roads (ie minor side street
intersecting with a major arterial route).
Level of
Service
Average Delay
per Vehicle
(secs/veh)
Traffic Signals, Roundabout
Give Way and Stop Signs
A less than 14 Good operation. Good operation.
B 15 to 28 Good with acceptable delays and spare
capacity.
Acceptable delays and spare capacity.
C 29 to 42 Satisfactory. Satisfactory but accident study
required.
D 43 to 56 Operating near capacity. Near capacity and accident study
required.
E 57 to 70 At capacity; at signals incidents will
cause excessive delays.
Roundabouts require other control
mode.
At capacity and requires other control
mode.
3. Degree of Saturation (DS)
The DS is another measure of the operational performance of individual intersections.
For intersections controlled by traffic signals1 both queue length and delay increase rapidly as DS approaches 1,
and it is usual to attempt to keep DS to less than 0.9. Values of DS in the order of 0.7 generally represent
satisfactory intersection operation. When DS exceeds 0.9 queues can be anticipated.
For intersections controlled by a roundabout or GIVE WAY or STOP signs, satisfactory intersection operation
is indicated by a DS of 0.8 or less.
1 The values of DS for intersections under traffic signal control are only valid for cycle length of 120 secs.
VARGA TRAFFIC PLANNING PTY LTD
25
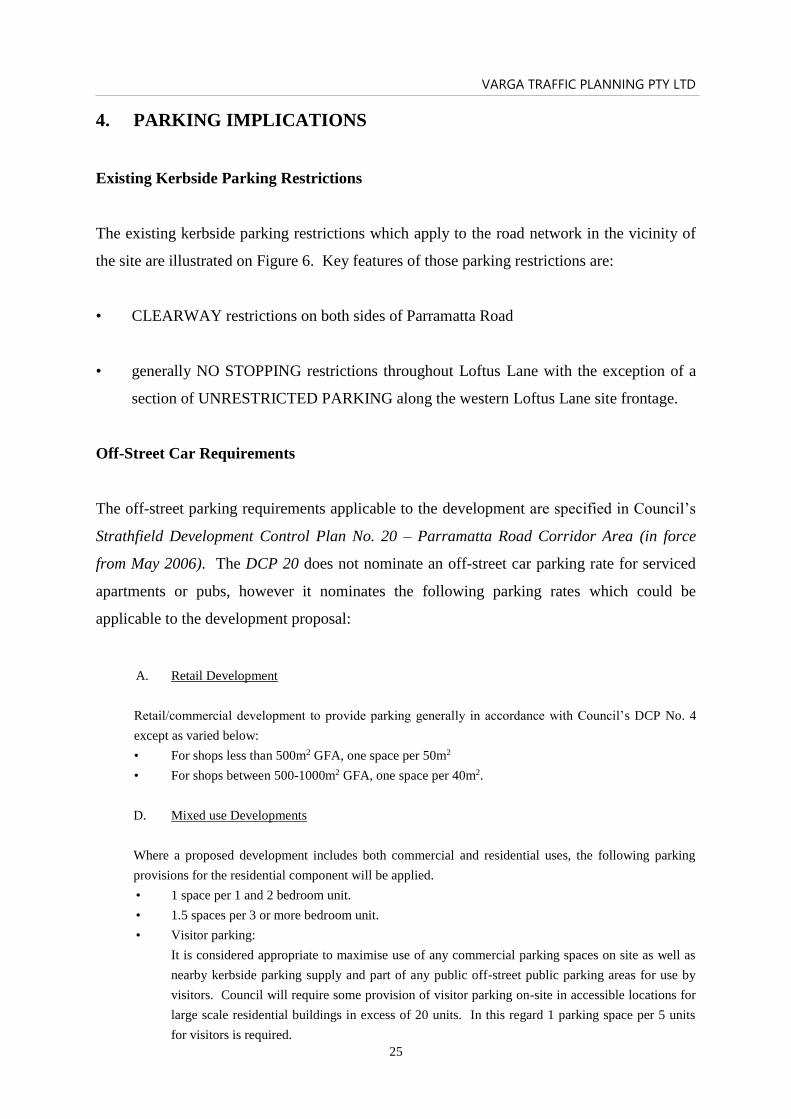
4. PARKING IMPLICATIONS
Existing Kerbside Parking Restrictions
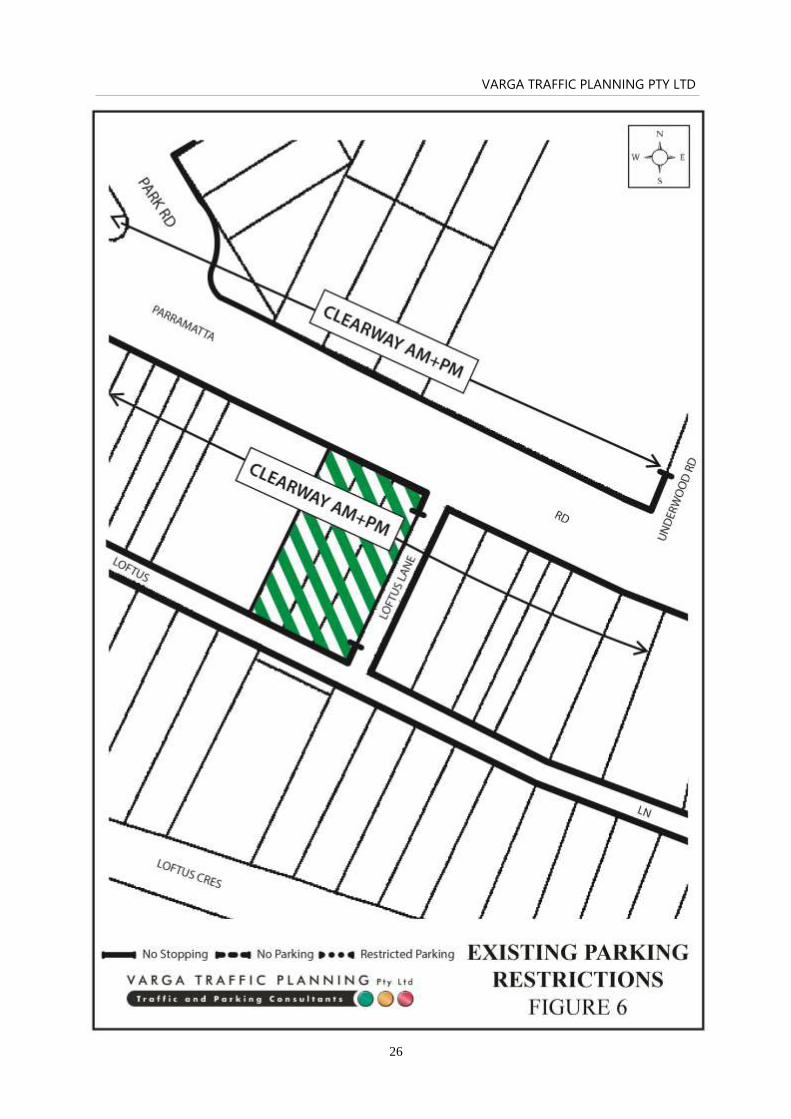
The existing kerbside parking restrictions which apply to the road network in the vicinity of
the site are illustrated on Figure 6. Key features of those parking restrictions are:
• CLEARWAY restrictions on both sides of Parramatta Road
• generally NO STOPPING restrictions throughout Loftus Lane with the exception of a
section of UNRESTRICTED PARKING along the western Loftus Lane site frontage.
Off-Street Car Requirements
The off-street parking requirements applicable to the development are specified in Council’s
Strathfield Development Control Plan No. 20 – Parramatta Road Corridor Area (in force
from May 2006). The DCP 20 does not nominate an off-street car parking rate for serviced
apartments or pubs, however it nominates the following parking rates which could be
applicable to the development proposal:
A. Retail Development
Retail/commercial development to provide parking generally in accordance with Council’s DCP No. 4
except as varied below:
• For shops less than 500m2 GFA, one space per 50m2
• For shops between 500-1000m2 GFA, one space per 40m2.
D. Mixed use Developments
Where a proposed development includes both commercial and residential uses, the following parking
provisions for the residential component will be applied.
• 1 space per 1 and 2 bedroom unit.
• 1.5 spaces per 3 or more bedroom unit.
• Visitor parking:
It is considered appropriate to maximise use of any commercial parking spaces on site as well as
nearby kerbside parking supply and part of any public off-street public parking areas for use by
visitors. Council will require some provision of visitor parking on-site in accessible locations for
large scale residential buildings in excess of 20 units. In this regard 1 parking space per 5 units
for visitors is required.
VARGA TRAFFIC PLANNING PTY LTD
26
VARGA TRAFFIC PLANNING PTY LTD
27
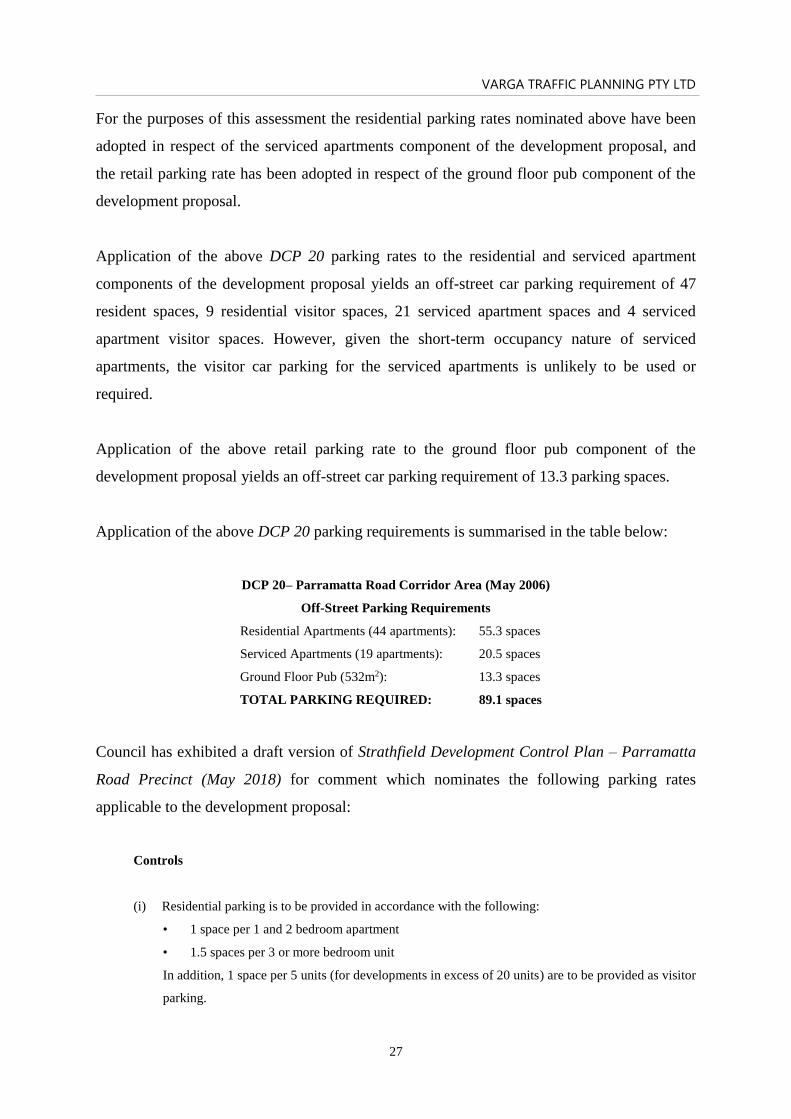
For the purposes of this assessment the residential parking rates nominated above have been
adopted in respect of the serviced apartments component of the development proposal, and
the retail parking rate has been adopted in respect of the ground floor pub component of the
development proposal.
Application of the above DCP 20 parking rates to the residential and serviced apartment
components of the development proposal yields an off-street car parking requirement of 47
resident spaces, 9 residential visitor spaces, 21 serviced apartment spaces and 4 serviced
apartment visitor spaces. However, given the short-term occupancy nature of serviced
apartments, the visitor car parking for the serviced apartments is unlikely to be used or
required.
Application of the above retail parking rate to the ground floor pub component of the
development proposal yields an off-street car parking requirement of 13.3 parking spaces.
Application of the above DCP 20 parking requirements is summarised in the table below:
DCP 20– Parramatta Road Corridor Area (May 2006)
Off-Street Parking Requirements
Residential Apartments (44 apartments): 55.3 spaces
Serviced Apartments (19 apartments): 20.5 spaces
Ground Floor Pub (532m2): 13.3 spaces
TOTAL PARKING REQUIRED: 89.1 spaces
Council has exhibited a draft version of Strathfield Development Control Plan – Parramatta
Road Precinct (May 2018) for comment which nominates the following parking rates
applicable to the development proposal:
Controls
(i) Residential parking is to be provided in accordance with the following:
• 1 space per 1 and 2 bedroom apartment
• 1.5 spaces per 3 or more bedroom unit
In addition, 1 space per 5 units (for developments in excess of 20 units) are to be provided as visitor
parking.

VARGA TRAFFIC PLANNING PTY LTD
28
(ii) For commercial/retail development and other land uses parking is to be provided at the following
rates:
• Retail less than 500m2 GFA: 1 space per 100m2
• Retail between 500-1000m2 GFA: 1 space per 75m2
Application of the above Draft DCP parking rates to the residential and serviced apartment
components of the development proposal yields an off-street car parking requirement of 47
resident spaces, 9 residential visitor spaces, 21 serviced apartment spaces and 4 serviced
apartment visitor spaces. However, given the short-term occupancy nature of serviced
apartments, the visitor car parking is unlikely to be used or required.
Application of the Draft DCP – Parramatta Road Precinct (May 2018) retail parking rates to
the ground floor pub component of the development proposal yields an off-street car parking
requirement of 7.1 spaces.
Application of the above Draft DCP Parramatta Road Precinct parking requirements are set
out in the table below:
Draft DCP – Parramatta Road Precinct (May 2018)
Off-Street Parking Requirements
Residential Apartments (44 apartments): 55.3 spaces
Serviced Apartments (19 apartments): 20.5 spaces
Ground Floor Pub (532m2): 7.1 spaces
TOTAL PARKING REQUIRED: 82.9 spaces
Neither DCP 20 nor the Draft DCP – Parramatta Road Precinct (May 2018) nominate a
parking rate for hotels/pubs, and reference is therefore made to the following parking rates
which are nominated in Part I of Strathfield Consolidated Development Control Plan 2005 (3
May 2006):
3.2.3 Hotels
(a) Parking
(i) 1 space per 3.5m2 licensed floor area plus 1 space per room or motel unit.
VARGA TRAFFIC PLANNING PTY LTD
29
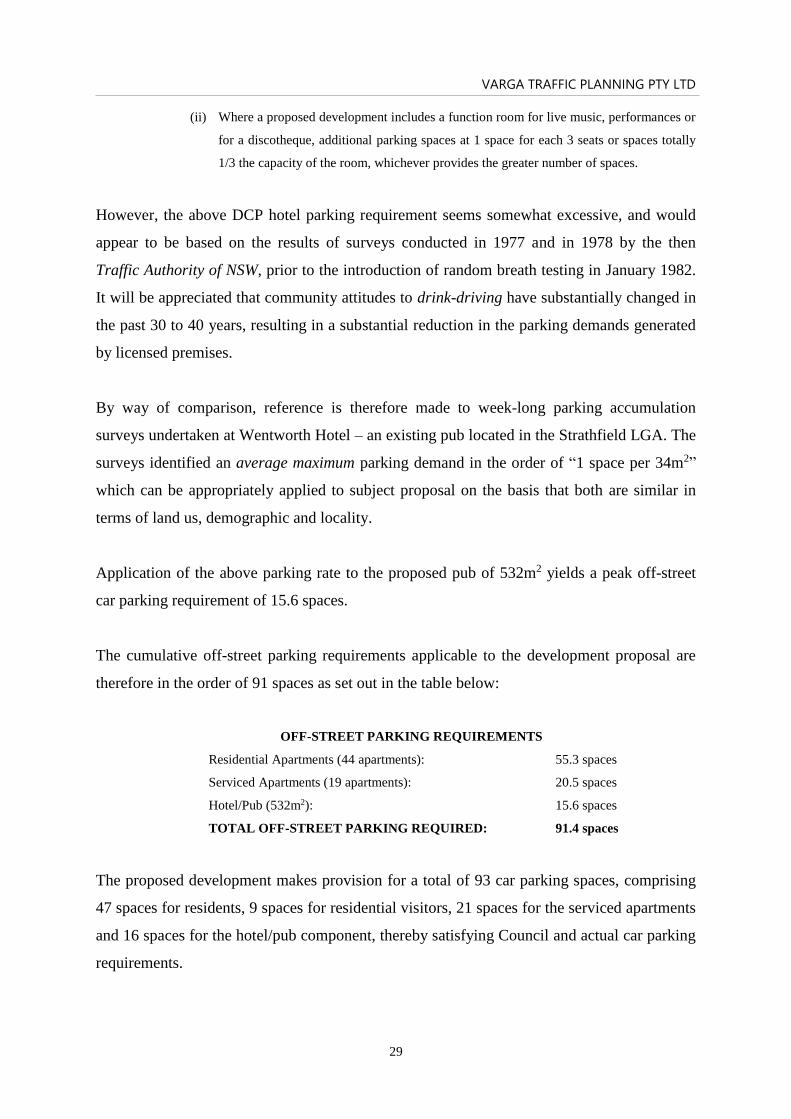
(ii) Where a proposed development includes a function room for live music, performances or
for a discotheque, additional parking spaces at 1 space for each 3 seats or spaces totally
1/3 the capacity of the room, whichever provides the greater number of spaces.
However, the above DCP hotel parking requirement seems somewhat excessive, and would
appear to be based on the results of surveys conducted in 1977 and in 1978 by the then
Traffic Authority of NSW, prior to the introduction of random breath testing in January 1982.
It will be appreciated that community attitudes to drink-driving have substantially changed in
the past 30 to 40 years, resulting in a substantial reduction in the parking demands generated
by licensed premises.
By way of comparison, reference is therefore made to week-long parking accumulation
surveys undertaken at Wentworth Hotel – an existing pub located in the Strathfield LGA. The
surveys identified an average maximum parking demand in the order of “1 space per 34m2”
which can be appropriately applied to subject proposal on the basis that both are similar in
terms of land us, demographic and locality.
Application of the above parking rate to the proposed pub of 532m2 yields a peak off-street
car parking requirement of 15.6 spaces.
The cumulative off-street parking requirements applicable to the development proposal are
therefore in the order of 91 spaces as set out in the table below:
OFF-STREET PARKING REQUIREMENTS
Residential Apartments (44 apartments):
Serviced Apartments (19 apartments):
Hotel/Pub (532m2):
55.3 spaces
20.5 spaces
15.6 spaces
TOTAL OFF-STREET PARKING REQUIRED: 91.4 spaces
The proposed development makes provision for a total of 93 car parking spaces, comprising
47 spaces for residents, 9 spaces for residential visitors, 21 spaces for the serviced apartments
and 16 spaces for the hotel/pub component, thereby satisfying Council and actual car parking
requirements.
VARGA TRAFFIC PLANNING PTY LTD
30
The geometric design layout of the proposed car parking facilities has been designed to
comply with the relevant requirements specified in the Standards Australia publication
Parking Facilities Part 1 – O3ff-Street Car Parking AS2890.1 and Parking Facilities Part 6 -
Off-Street Parking for People with Disabilities AS2890.6 in respect of parking bay
dimensions, ramp gradients and aisle widths.
Loading/Servicing Provisions
The proposed new mixed-use building is expected to be serviced by a variety of light
commercial vehicles and trucks up to and including 8.8m long MRV rigid trucks.
A dedicated service bay will be provided on the southern side of the building, at the ground
floor level. The manoeuvring area has been designed to accommodate the swept turning path
requirements of these 8.8m long MRV rigid trucks, allowing them to reverse into the loading
bay and to then exit the site whilst travelling in forward gear at all times, as demonstrated by
the attached swept turning path diagram.
It is noted in this regard that Standards Australia AS2890.2 – 2002 permits on-street
manoeuvring provided where it is “strictly limited” to one reversing movement, either into or
out of the street, if permitted by the relevant authority. In this instance, it is noted that Loftus
Lane is a quiet, local service lane which carries minimal volumes of traffic, and is therefore
ideally suited to a reversing manoeuvre into the site, with a forward exit when departing the
site.
Restricting movements into the site to reversing only ensures that the reversing manoeuvre
can be undertaken safely as the driver will have clear visibility of any vehicles approaching
from behind (as opposed to reversing out of the site which is not favoured).
The geometric design layout of the proposed loading/service area has been designed to
comply with the relevant requirements specified in the Standards Australia publication
Parking Facilities Part 2 - Off-Street Commercial Vehicle Facilities AS2890.2 in respect of
loading bay dimensions for MRV trucks.
VARGA TRAFFIC PLANNING PTY LTD
31
Conclusion
In summary, the proposed parking facilities satisfy the relevant requirements specified in
both Council’s requirements as well as the Australian Standards and it is therefore concluded
that the proposed development will not have any unacceptable parking or loading
implications.
1
0
.
8
4
1
0
.
8
4
1
0
.
8
6
PA
RA
PE
TR
L 3
0.2
4
RO
OF
RL
3
1.2
3
RO
OF
RL
3
2.7
7
R
O
O
F
R
L 18.74
1
0
.
6
2
8.15
8.05
10.16
10.01
10.81
11.02
9
.
9
9
9
.
9
8
1
0
.
0
3
1
0
.
1
3
1
0
.
3
9
1
0
.
4
0
9.85
9.84
9.89
9.91
8.56
8.35
8.13
7.95
9.98
10.08
9.95
10.47
10.74
10.83
10.81
10.91
10.90
10.82
10.48
10.69
10.94
8.67
8.47
8.26
8.09
7.88
8.00
10.07
10.13
10.17
10.30
10.27
10.37
10.45
10.48
11.03
10.79
10.58
10.98
10.97
10.93
10.80
10.55
9.06
8
.
5
3
1
0
.
8
0
10.49
10.94
8.348.809.03
9.07
9.19
9.239.349.41
9.58
9.99
8.25
8.42
8.60
8.73
10.27
9.97
1
0
.
5
1
1
0
.
5
0
1
0
.
5
8
S
M
H
S
I
P
UP
UP
UP
UP
UP
UP
UP
LINE OF HEIGHTPLANE CHANGE
32 m HOB.16 m HOB .
BOUNDARY
BOUN
DARY
BOUN
DARY
10m SETBACK - DRAFT DCP
No. 146-154 PARRAMATTA RDEXISTING 7 STOREYRESIDENTIAL APARTMENTS
No. 31-32 LOFTUS CRESEXISTING 2 STOREYTOWNHOUSES
DEEP SOIL ZONE TOACCOMODATE LARGE TREE
162 m²
COURTYARD
RAMP GRADIENTS SUBJECT TOFURTHER ADVICE FROMCOUNCIL & TRAFFIC ENGINEER.
AUGUSTUS LOFTUS
EXISTING LAYBACKAND SPLAYS TO BEREMOVED
EXISTING KERB ANDSPLAYS TO BE REMOVED
PROPOSED NEWFOOTPATH
FOOT
PATH
NEW 1200mm WIDEFOOTPATH TO LANE
WEATHERPROOF/TERRACE AREA
MAIN PUBENTRY
SPORTS THEATRE
BACK TO BACKSPORTS THEATRE
APPROX.EX RL 8.33
9.170 RL
FIRE BOOSTER &ASSEMBLY
SUBSTATION TO FUTUREDETAIL
UP
EXISTINGSTORMWATEROUTLET
GAMINGENTRY
FIREEXIT
SERVICEDAPARTMENT
ENTRY
LOFTUS LANE
LINE OF AWNING ABOVE
DEEP SOIL ZONE BELOW TOACCOMODATE LARGE TREE
EXISTING TREE TO BEDEMOLISHED
FHR
DRIVEWAY
LOFT
US LA
NEBOUNDARY
MAIN VEHICULARENTRY VEHICULAR RAMP
1:14 RAMP
1:14 RAMP
8.600 RL 8.886 RL
67 m²
WASTE
1:41:20
ROAD RL10.740
1:5.71:20
196 m²
SPORTS BAR
173 m²
GAMING
RL10.550
65 m²
LOADING DOCK
1:20 WALKWAYBIN
BIN
BIN
BIN
BAR
GAMING BAR
COMMERCIAL WASTERESIDENTIAL WASTE
10.550 RL
10.480 RL
27 m²
KITCHEN
35 m²
TOILETS
LINE OF FLOOR ABOVE
58 m²
GARDEN / AIRLOCK
VOID
VOID
VOID
31 m²
PLANT / BOH
RESIDENTIALENTRY
SERVICEDAPARTMENT
LOBBY
RESIDENTIALLOBBY
PUB LIFT
6450
EGRESS
2.4m
BULK
HEAD
ABO
VE
STORE
20 m²
OFFICE
9.200 RL
9.200 RL
10.450 RL
OUTDOORFOODSTAND
9.200 RL9.200 RL
10.295 RL
1:16
11.040 RL
10.900 RL
BIN
BIN
BIN
BIN
BIN
10.450 RL
50 m²
LOBBY
BIN
10.445 RL
BOXE
S
2175
RESI LIFT
SERVICEDAPTS LIFT
BIN
BIN
BIN
BIN
BIN
BIN
BIN
BIN
BIN
BIN
WASTE CHUTE
LOW HEIGHTAREA / PLANT
9.500 RL
LINE
OF O
SD A
BOVE
10.841 RL
MR
V - M
edium
R
igid V
ehicle
MRV - Medium Rigid Vehicle
19072
PROJECT NO.
136 Parramatta Road
Homebush
Phone +61 2 9904 3224PO Box 1868
Neutral Bay, NSW 2089www.vargatraffic.com.au
Sydney, Australia
VARGA TRAFFIC PLANNING Pty LtdABN 88 071 762 537Suite 6, Level 120 Young StreetNeutral Bay, NSW 2089
DRAWING TITLE
ADDRESS
TYRV
REVIEWED PREPARED
PROJECT
IRIS HOTEL
DATE DRAWN
2019-3-27
TURNING PATHS 190403
1:250 @ A4

VARGA TRAFFIC PLANNING PTY LTD
APPENDIX A
TRAFFIC SURVEY DATA
R.O.A.R. DATA : Varga Traffic Planning
Reliable, Original & Authentic Results : 6928 HOMEBUSH Loftus Lane
Ph.88196847, Mob.0418-239019 : Wednesday 17th October 2018
Lights Heavies
Time Per T L R L R T TOT Time Per T L R L R T TOT Time Per T L R L R T TOT
0730 - 0745 4 1 1 7 0 1 14 0730 - 0745 0 0 0 0 0 0 0 0730 - 0745 4 1 1 7 0 1 14
0745 - 0800 7 0 2 30 0 0 39 0745 - 0800 0 0 0 0 0 0 0 0745 - 0800 7 0 2 30 0 0 39
0800 - 0815 4 1 1 23 0 0 29 0800 - 0815 0 0 0 0 0 0 0 0800 - 0815 4 1 1 23 0 0 29
0815 - 0830 9 4 3 15 0 1 32 0815 - 0830 0 0 0 0 0 0 0 0815 - 0830 9 4 3 15 0 1 32
0830 - 0845 10 3 3 16 1 33 0830 - 0845 0 0 0 0 0 0 0 0830 - 0845 10 3 3 16 1 0 33
0845 - 0900 9 1 0 9 0 19 0845 - 0900 0 0 0 0 0 0 0 0845 - 0900 9 1 0 9 0 0 19
0900 - 0915 2 1 2 10 1 16 0900 - 0915 0 0 0 0 0 0 0 0900 - 0915 2 1 2 10 1 0 16
0915 - 0930 5 1 1 9 0 16 0915 - 0930 0 0 0 0 0 0 0 0915 - 0930 5 1 1 9 0 0 16
Per End 50 12 13 119 2 2 198 Per End 0 0 0 0 0 0 0 Per End 50 12 13 119 2 2 198
Lights Heavies
Peak Per T L R L R T TOT Peak Per T L R L R T TOT Peak Per T L R L R T TOT
0730 - 0830 24 6 7 75 0 2 114 0730 - 0830 0 0 0 0 0 0 0 0730 - 0830 24 6 7 75 0 2 114
0745 - 0845 30 8 9 84 1 1 133 0745 - 0845 0 0 0 0 0 0 0 0745 - 0845 30 8 9 84 1 1 133
0800 - 0900 32 9 7 63 1 1 113 0800 - 0900 0 0 0 0 0 0 0 0800 - 0900 32 9 7 63 1 1 113
0815 - 0915 30 9 8 50 2 1 100 0815 - 0915 0 0 0 0 0 0 0 0815 - 0915 30 9 8 50 2 1 100
0830 - 0930 26 6 6 44 2 0 84 0830 - 0930 0 0 0 0 0 0 0 0830 - 0930 26 6 6 44 2 0 84
PEAK HR 30 8 9 84 1 1 133 PEAK HR 0 0 0 0 0 0 0 PEAK HR 30 8 9 84 1 1 133
Peds
Time Per TOT
0730 - 0745 12 0 N
0745 - 0800 17 9 93
0800 - 0815 20 9 93
0815 - 0830 14 0
0830 - 0845 11 0 0
0845 - 0900 5 9 84 Copyright ROAR DATA
0900 - 0915 3 9 84
0915 - 0930 7
Per End 89 0 38 38 0 114 114
0 8 8 1 1 0
Peak Per TOT
0730 - 0830 63
0745 - 0845 62 0 30 30 1 1 0
0800 - 0900 50
0815 - 0915 33 10 10 0 2 2 0
0830 - 0930 26
PEAK HR 62
EAST
Loftus L Loftus L Loftus L Loftus L Loftus L Loftus L
WEST
Loftus L Loftus L
NORTH EAST
WEST
WEST NORTH EAST
Loftus L Loftus L Loftus L
Loftus L Loftus L
NORTH
NORTH NORTH EAST
Loftus L Loftus L Loftus L
Loftus L Loftus L Loftus L
WEST NORTH
Loftus L
Combined
Combined
WEST NORTH EAST Loftus L
WEST
WEST
EAST
Loftus L
2 5 5
7 8 2
8 6 6
6 3 5
5 3 3
4 1 0
2 0 1
1 1 5
Loftus L Loftus L Loftus L
35 27 27
WEST NORTH EAST
23 22 18
26 20 16
23 13 14
17 7 9
12 5 9
26 20 16
Loftus L
0745 - 0845AM PEAK
Loftus L
Client
Job No/Name
Day/Date
EAST
Hours 1
Hours 2
Hours 3
Hours 4
Hours 5
R.O.A.R DATA : Varga Traffic Planning
Reliable, Original & Authentic Results : 6928 HOMEBUSH Loftus Lane
Ph.88196847, Mob.0418-239019 : Wednesday 17th October 2018
AM
N
62 169
15 0 4 0
PERIOD
TOTAL VOLUMES
15 4
Loftus L
620
Loftus L
0
14
14 0
132
132
FOR COUNT
Client
Job No/Name
Day/Date
1690
Loftus L
R.O.A.R DATA : Varga Traffic Planning
Reliable, Original & Authentic Results : 6928 HOMEBUSH Loftus Lane
Ph.88196847, Mob.0418-239019 : Wednesday 17th October 2018
AM
Loftus Lane & Loftus Lane
Client
Job No/Name
Day/Date
0
5
10
15
20
25
30
35
40
45
Nu
mb
er
of
Ve
hic
les
Time Periods
Light
Heavy
Combined
R.O.A.R. DATA : Varga Traffic Planning
Reliable, Original & Authentic Results : 6928 HOMEBUSH Loftus Lane
: Wednesday 17th October 2018
Lights Heavies
Time Per T L R L R T TOT Time Per T L R L R T TOT Time Per T L R L R T TOT
1630 - 1645 2 1 1 25 0 0 29 1630 - 1645 0 0 0 0 0 0 0 1630 - 1645 2 1 1 25 0 0 29
1645 - 1700 1 1 1 20 0 0 23 1645 - 1700 0 0 0 0 0 0 0 1645 - 1700 1 1 1 20 0 0 23
1700 - 1715 1 0 1 20 0 0 22 1700 - 1715 0 0 0 0 0 0 0 1700 - 1715 1 0 1 20 0 0 22
1715 - 1730 1 1 2 24 0 0 28 1715 - 1730 0 0 0 0 0 0 0 1715 - 1730 1 1 2 24 0 0 28
1730 - 1745 2 1 1 20 0 0 24 1730 - 1745 0 0 0 0 0 0 0 1730 - 1745 2 1 1 20 0 0 24
1745 - 1800 2 0 2 16 0 0 20 1745 - 1800 0 0 0 0 0 0 0 1745 - 1800 2 0 2 16 0 0 20
1800 - 1815 2 0 1 21 0 0 24 1800 - 1815 0 0 0 0 0 0 0 1800 - 1815 2 0 1 21 0 0 24
1815 - 1830 4 0 3 14 0 0 21 1815 - 1830 0 0 0 0 0 0 0 1815 - 1830 4 0 3 14 0 0 21
Per End 15 4 12 160 0 0 191 Per End 0 0 0 0 0 0 0 Per End 15 4 12 160 0 0 191
Lights Heavies
Peak Per T L R L R T TOT Peak Per T L R L R T TOT Peak Per T L R L R T TOT
1630 - 1730 5 3 5 89 0 0 102 1630 - 1730 0 0 0 0 0 0 0 1630 - 1730 5 3 5 89 0 0 102
1645 - 1745 5 3 5 84 0 0 97 1645 - 1745 0 0 0 0 0 0 0 1645 - 1745 5 3 5 84 0 0 97
1700 - 1800 6 2 6 80 0 0 94 1700 - 1800 0 0 0 0 0 0 0 1700 - 1800 6 2 6 80 0 0 94
1715 - 1815 7 2 6 81 0 0 96 1715 - 1815 0 0 0 0 0 0 0 1715 - 1815 7 2 6 81 0 0 96
1730 - 1830 10 1 7 71 0 0 89 1730 - 1830 0 0 0 0 0 0 0 1730 - 1830 10 1 7 71 0 0 89
PEAK HR 5 3 5 89 0 0 102 PEAK HR 0 0 0 0 0 0 0 PEAK HR 5 3 5 89 0 0 102
Peds
Time Per TOT
1630 - 1645 8 0 N
1645 - 1700 5 3 94
1700 - 1715 9 3 94
1715 - 1730 10 0
1730 - 1745 13 0 0
1745 - 1800 7 5 89 Copyright ROAR DATA
1800 - 1815 11 5 89
1815 - 1830 10
Per End 73 0 8 8 0 94 94
0 3 3 0 0 0
Peak Per TOT
1630 - 1730 32
1645 - 1745 37 0 5 5 0 0 0
1700 - 1800 39
1715 - 1815 41 5 5 0 0 0 0
1730 - 1830 41
PEAK HR 32
EAST
Loftus L
Client
Job No/Name
Day/Date
EAST
1630 - 1730PM PEAK
Loftus L Loftus L26 7 8
9 11 12
14 11 14
21 8 12
9 11 12
11 12 14
Loftus L Loftus L Loftus L
35 18 20
WEST NORTH EAST
9 1 1
8 2 0
5 3 5
4 1 2
2 4 3
3 3 4
3 2 3
1 2 2
Loftus L Loftus L Loftus L
Combined
Combined
WEST NORTH EAST Loftus L
WEST NORTH EAST
Loftus L Loftus L Loftus L
NORTH EAST
Loftus L Loftus L Loftus L
WEST
Loftus L Loftus L
WEST NORTH EAST
Loftus L Loftus L Loftus L Loftus L
NORTH
Loftus LLoftus L
NORTH EAST
WEST
WEST
Loftus L Loftus L Loftus L
Ph.88196847, Mob.0418-239019
NORTHWEST
Hours 1
Hours 2
Hours 3
Hours 4
Hours 5
R.O.A.R DATA : Varga Traffic Planning
Reliable, Original & Authentic Results : 6928 HOMEBUSH Loftus Lane
Ph.88196847, Mob.0418-239019 : Wednesday 17th October 2018
N
19 175
12 0 0 0
Day/Date
1750
Loftus L
Job No/Name
Client
0
4
4 0
172
172
FOR COUNT
12 0
PM
Loftus L
190
Loftus L
PERIOD
TOTAL VOLUMES

R.O.A.R DATA : Varga Traffic Planning
Reliable, Original & Authentic Results : 6928 HOMEBUSH Loftus Lane
Ph.88196847, Mob.0418-239019 : Wednesday 17th October 2018
Loftus Lane & Loftus Lane
Client
Job No/Name
Day/Date
PM
0
5
10
15
20
25
30
35
Nu
mb
er
of
Ve
hic
les
Time Periods
Light
Heavy
Combined
R.O.A.R. DATA : Varga Traffic Planning
Reliable, Original & Authentic Results : 6928 HOMEBUSH Loftus Lane
Ph.88196847, Mob.0418-239019 : Wednesday 17th October 2018
N
Intersection Details
Obtained via satellite
May be incorrect
No signage or line markings
R L
9 84 AM
AM PM 5 89 PM
8 3 L
30 5 T
R 0 1PM AM
T 0 1
Weather >>>
Combined Figures only 1630 - 1730
PM PEAK HOUR
Loftus Lane
Loftus Lane
0745 - 0845
Client
Job No/Name
Day/Date
AM PEAK HOUR
Loftus Lane
R.O.A.R. DATA : Varga Traffic Planning
Reliable, Original & Authentic Results : 6928 HOMEBUSH Loftus Lane
Ph.88196847, Mob.0418-239019 : Wednesday 17th October 2018
Lights Heavies
Time Per T R L R L T TOT Time Per T R L R L T TOT Time Per T R L R L T TOT
0730 - 0745 243 1 1 0 7 222 474 0730 - 0745 4 0 0 0 0 4 0730 - 0745 247 1 1 0 7 222 478
0745 - 0800 251 8 0 0 24 238 521 0745 - 0800 0 0 0 0 4 4 0745 - 0800 251 8 0 0 24 242 525
0800 - 0815 260 2 1 0 22 251 536 0800 - 0815 3 0 0 0 0 3 0800 - 0815 263 2 1 0 22 251 539
0815 - 0830 231 7 4 0 11 277 530 0815 - 0830 0 0 0 0 3 3 0815 - 0830 231 7 4 0 11 280 533
0830 - 0845 205 6 4 0 13 243 471 0830 - 0845 5 0 0 0 0 5 0830 - 0845 210 6 4 0 13 243 476
0845 - 0900 216 1 1 0 8 228 454 0845 - 0900 0 0 0 0 6 6 0845 - 0900 216 1 1 0 8 234 460
0900 - 0915 227 2 2 0 10 251 492 0900 - 0915 2 0 0 0 0 2 0900 - 0915 229 2 2 0 10 251 494
0915 - 0930 235 1 0 1 9 269 515 0915 - 0930 0 0 0 0 8 8 0915 - 0930 235 1 0 1 9 277 523
Per End 1868 28 13 1 104 1979 3993 Per End 14 0 0 0 0 21 35 Per End 1882 28 13 1 104 2000 4028
Lights Heavies
Peak Per T R L R L T TOT Peak Per T R L R L T TOT Peak Per T R L R L T TOT
0730 - 0830 985 18 6 0 64 988 2061 0730 - 0830 7 0 0 0 0 7 14 0730 - 0830 992 18 6 0 64 995 2075
0745 - 0845 947 23 9 0 70 1009 2058 0745 - 0845 8 0 0 0 0 7 15 0745 - 0845 955 23 9 0 70 1016 2073
0800 - 0900 912 16 10 0 54 999 1991 0800 - 0900 8 0 0 0 0 9 17 0800 - 0900 920 16 10 0 54 1008 2008
0815 - 0915 879 16 11 0 42 999 1947 0815 - 0915 7 0 0 0 0 9 16 0815 - 0915 886 16 11 0 42 1008 1963
0830 - 0930 883 10 7 1 40 991 1932 0830 - 0930 7 0 0 0 0 14 21 0830 - 0930 890 10 7 1 40 1005 1953
PEAK HR 985 18 6 0 64 988 2061 PEAK HR 7 0 0 0 0 7 14 PEAK HR 992 18 6 0 64 995 2075
Peds
Time Per TOT 7 1003 1010 7 985 992
0730 - 0745 17
0745 - 0800 20 7 985 992 995 988 7
0800 - 0815 27
0815 - 0830 30
0830 - 0845 13 0 18 18 64 64 0
0845 - 0900 10
0900 - 0915 12 1001 994 7 1059 1052 7
0915 - 0930 8
Per End 137 6 0
6 0
0 0
Peak Per TOT 0 N
0730 - 0830 94 82
0745 - 0845 90 6 82
0800 - 0900 80 6
0815 - 0915 65 0
0830 - 0930 43
PEAK HR 94 Copyright ROAR DATA
Client
Job No/Name
Day/Date
Loftus L
Parramatt
EAST Combined
AM PEAK
0730 - 0830
WEST SOUTH EAST WEST SOUTH
Parramatta
WEST SOUTH EAST
Parramatt Loftus L Parramatta Parramatt Rd Loftus L Parramatta Parramatt Loftus L
SOUTH EAST Combined WESTWEST SOUTH EAST WEST
Loftus L Parramatta
Parramatta
SOUTH
WEST SOUTH EAST
EAST
Parramatt Loftus L Parramatt Rd Loftus L Parramatta
Parramatt Rd Loftus L Parramatta
Parramatt Rd
0 17 0
0 20 0
0 27 0
0 30 0
Parramatta Rd
0 137 0
0 13 0
0 10 0
0 94 0
12 0
0 8 0
0
Loftus L Parramatta
0
0 65 0
Parramatt Rd
0 80 0
WEST SOUTH EAST
90 0
0 94
0 43
0
0
Hours 1
Hours 2
Hours 3
Hours 4
Hours 5
R.O.A.R DATA : Varga Traffic Planning
Reliable, Original & Authentic Results : 6928 HOMEBUSH Loftus Lane
Ph.88196847, Mob.0418-239019 : Wednesday 17th October 2018
N
1896 1910 1869 1883
2013 1992 2104 2083
Job No/Name
Day/Date
Client
21
14
Parramatt Rd Parramatta Rd
AM
TOTAL VOLUMES
132
132
14
21
14
FOR COUNT
PERIOD
Loftus L
14
0
0

R.O.A.R DATA : Varga Traffic Planning
Reliable, Original & Authentic Results : 6928 HOMEBUSH Loftus Lane
Ph.88196847, Mob.0418-239019 : Wednesday 17th October 2018
AM
Loftus Lane & Parramatta Rd
Client
Job No/Name
Day/Date
0
100
200
300
400
500
600
Nu
mb
er
of
Ve
hic
les
Time Period
Light
Heavy
Combined
R.O.A.R. DATA : Varga Traffic Planning
Reliable, Original & Authentic Results : 6928 HOMEBUSH Loftus Lane
Ph.88196847, Mob.0418-239019 : Wednesday 17th October 2018
Lights Heavies
Time Per T R L R L T TOT Time Per T R L R L T TOT Time Per T R L R L T TOT
1630 - 1645 226 0 0 0 26 321 573 1630 - 1645 2 0 0 0 0 2 1630 - 1645 228 0 0 0 26 321 575
1645 - 1700 282 0 1 0 21 314 618 1645 - 1700 0 0 0 0 3 3 1645 - 1700 282 0 1 0 21 317 621
1700 - 1715 315 1 0 0 18 290 624 1700 - 1715 0 0 0 0 0 0 1700 - 1715 315 1 0 0 18 290 624
1715 - 1730 271 3 1 1 29 261 566 1715 - 1730 0 0 0 0 4 4 1715 - 1730 271 3 1 1 29 265 570
1730 - 1745 235 2 1 0 15 280 533 1730 - 1745 1 0 0 0 0 1 1730 - 1745 236 2 1 0 15 280 534
1745 - 1800 249 2 0 0 16 279 546 1745 - 1800 0 0 0 0 3 3 1745 - 1800 249 2 0 0 16 282 549
1800 - 1815 270 1 0 0 22 301 594 1800 - 1815 1 0 0 0 0 1 1800 - 1815 271 1 0 0 22 301 595
1815 - 1830 256 0 1 0 16 318 591 1815 - 1830 0 0 0 0 1 1 1815 - 1830 256 0 1 0 16 319 592
Per End 2104 9 4 1 163 2364 4645 Per End 4 0 0 0 0 11 15 Per End 2108 9 4 1 163 2375 4660
Lights Heavies
Peak Per T R L R L T TOT Peak Per T R L R L T TOT Peak Per T R L R L T TOT
1630 - 1730 1094 4 2 1 94 1186 2381 1630 - 1730 2 0 0 0 0 7 9 1630 - 1730 1096 4 2 1 94 1193 2390
1645 - 1745 1103 6 3 1 83 1145 2341 1645 - 1745 1 0 0 0 0 7 8 1645 - 1745 1104 6 3 1 83 1152 2349
1700 - 1800 1070 8 2 1 78 1110 2269 1700 - 1800 1 0 0 0 0 7 8 1700 - 1800 1071 8 2 1 78 1117 2277
1715 - 1815 1025 8 2 1 82 1121 2239 1715 - 1815 2 0 0 0 0 7 9 1715 - 1815 1027 8 2 1 82 1128 2248
1730 - 1830 1010 5 2 0 69 1178 2264 1730 - 1830 2 0 0 0 0 4 6 1730 - 1830 1012 5 2 0 69 1182 2270
PEAK HR 1094 4 2 1 94 1186 2381 PEAK HR 2 0 0 0 0 7 9 PEAK HR 1096 4 2 1 94 1193 2390
Peds
Time Per TOT 2 1098 1100 2 1095 1097
1630 - 1645 17
1645 - 1700 9 2 1094 1096 1193 1186 7
1700 - 1715 15
1715 - 1730 7
1730 - 1745 4 0 4 4 94 94 0
1745 - 1800 13
1800 - 1815 15 1195 1188 7 1287 1280 7
1815 - 1830 22
Per End 102 2 1
2 1
0 0
Peak Per TOT 0 N
1630 - 1730 48 98
1645 - 1745 35 3 98
1700 - 1800 39 3
1715 - 1815 39 0
1730 - 1830 54
PEAK HR 48 Copyright ROAR DATA
0 39 0
WEST SOUTH EAST
Parramatt Rd Loftus L Parramatta
0
0 54 0
0 48 0
39 0
0 48 0
0 35 0
0 22 0
0 102 0
0 13 0
0 15 0
0 7 0
0 4 0
0 9 0
0 15 0
Parramatt Rd Loftus L Parramatta
0 17 0
EAST
EAST
Parramatt Loftus L Parramatta Parramatt Rd Loftus L Parramatta
Parramatta RdParramatt Rd
Loftus L Parramatta
Parramatta
SOUTH
Loftus L
WESTWEST SOUTH EAST WEST EAST
SOUTH EAST
Parramatt Loftus L Parramatta Parramatt Rd Loftus L Parramatta Parramatt
PM PEAK
1630 - 1730
WEST SOUTH EAST WEST SOUTH
SOUTH
WEST SOUTH
Client
Job No/Name
Day/Date
Loftus L
Parramatt
EAST Combined WEST
Combined
Hours 1
Hours 2
Hours 3
Hours 4
Hours 5
R.O.A.R DATA : Varga Traffic Planning
Reliable, Original & Authentic Results : 6928 HOMEBUSH Loftus Lane
Ph.88196847, Mob.0418-239019 : Wednesday 17th October 2018
N
2113 2117 2105 2109
2379 2368 2538 2527
0
172
172
Loftus L
5
5
11
4
Parramatt Rd Parramatta Rd
4
11
Client
PM
Job No/Name
Day/Date
TOTAL VOLUMES
FOR COUNT
PERIOD
0
R.O.A.R DATA : Varga Traffic Planning
Reliable, Original & Authentic Results : 6928 HOMEBUSH Loftus Lane
Ph.88196847, Mob.0418-239019 : Wednesday 17th October 2018
Job No/Name
Day/Date
Client
Loftus Lane & Parramatta Rd
PM
0
100
200
300
400
500
600
700
Nu
mb
er
of
Ve
hic
les
Time Period
Light
Heavy
Combined
R.O.A.R. DATA : Varga Traffic Planning
Reliable, Original & Authentic Results : 6928 HOMEBUSH Loftus Lane
Ph.88196847, Mob.0418-239019 : Wednesday 17th October 2018
N
Intersection Layout
Obtained via satellite
May be incorrect
AM PM
992 1096 T
18 4 R
T 1193 995
L 94 64
PM 2 1PM AM
AM 6 0
L R
Weather >>>
Parramatta Rd
Parramatta Rd
PM PEAK HOUR
1630 - 1730
Loftus Lane
Client
Job No/Name
Day/Date
AM PEAK HOUR
0730 - 0830
VARGA TRAFFIC PLANNING PTY LTD
APPENDIX B
SIDRA MOVEMENT SUMMARIES

MOVEMENT SUMMARYSite: 101 [Existing AM]
Loftus Lane & Loftus Lane IntersectionSite Category: (None)Giveway / Yield (Two-Way)
Movement Performance - VehiclesDemand Flows 95% Back of QueueMov
ID Turn Deg.
SatnAverage
Delay Level ofService
Prop. Queued
Effective Stop Rate
Aver. No.Cycles
AverageSpeed Total HV Vehicles Distance
veh/h % v/c sec veh m km/hEast: Loftus Lane
5 T1 1 0.0 0.001 0.1 LOS A 0.0 0.0 0.10 0.27 0.10 48.2
6 R2 1 0.0 0.001 4.7 LOS A 0.0 0.0 0.10 0.27 0.10 47.3
Approach 2 0.0 0.001 2.4 NA 0.0 0.0 0.10 0.27 0.10 47.8
North: Loftus Lane
7 L2 84 0.0 0.060 4.6 LOS A 0.2 1.7 0.09 0.50 0.09 46.4
9 R2 9 0.0 0.060 4.7 LOS A 0.2 1.7 0.09 0.50 0.09 46.0
Approach 93 0.0 0.060 4.7 LOS A 0.2 1.7 0.09 0.50 0.09 46.4
West: Loftus Lane
10 L2 8 0.0 0.020 4.6 LOS A 0.0 0.0 0.00 0.11 0.00 48.9
11 T1 30 0.0 0.020 0.0 LOS A 0.0 0.0 0.00 0.11 0.00 49.3
Approach 38 0.0 0.020 1.0 NA 0.0 0.0 0.00 0.11 0.00 49.2
All Vehicles 133 0.0 0.060 3.6 NA 0.2 1.7 0.07 0.39 0.07 47.2
Site Level of Service (LOS) Method: Delay (RTA NSW). Site LOS Method is specified in the Parameter Settings dialog (Site tab).Vehicle movement LOS values are based on average delay per movement.Minor Road Approach LOS values are based on average delay for all vehicle movements.NA: Intersection LOS and Major Road Approach LOS values are Not Applicable for two-way sign control since the average delay is not a good LOS measure due to zero delays associated with major road movements.SIDRA Standard Delay Model is used. Control Delay includes Geometric Delay.Gap-Acceptance Capacity: SIDRA Standard (Akçelik M3D).HV (%) values are calculated for All Movement Classes of All Heavy Vehicle Model Designation.
SIDRA INTERSECTION 8.0 | Copyright © 2000-2019 Akcelik and Associates Pty Ltd | sidrasolutions.comOrganisation: VARGA TRAFFIC PLANNING | Processed: Wednesday, 3 April, 2019 9:23:15 AMProject: Z:\DATA\Data\Jobs01\Jobs\19work\19072Y_136-144ParramattaRdHomebush\SIDRA\190403\LoftusLn_LoftusLn_Intersn.sip8

MOVEMENT SUMMARYSite: 101 [Existing PM]
Loftus Lane & Loftus Lane IntersectionSite Category: (None)Giveway / Yield (Two-Way)
Movement Performance - VehiclesDemand Flows 95% Back of QueueMov
ID Turn Deg.
SatnAverage
Delay Level ofService
Prop. Queued
Effective Stop Rate
Aver. No.Cycles
AverageSpeed Total HV Vehicles Distance
veh/h % v/c sec veh m km/hEast: Loftus Lane
5 T1 1 0.0 0.001 0.0 LOS A 0.0 0.0 0.04 0.27 0.04 48.4
6 R2 1 0.0 0.001 4.6 LOS A 0.0 0.0 0.04 0.27 0.04 47.5
Approach 2 0.0 0.001 2.3 NA 0.0 0.0 0.04 0.27 0.04 47.9
North: Loftus Lane
7 L2 89 0.0 0.059 4.6 LOS A 0.2 1.7 0.03 0.52 0.03 46.6
9 R2 5 0.0 0.059 4.6 LOS A 0.2 1.7 0.03 0.52 0.03 46.1
Approach 94 0.0 0.059 4.6 LOS A 0.2 1.7 0.03 0.52 0.03 46.5
West: Loftus Lane
10 L2 3 0.0 0.004 4.6 LOS A 0.0 0.0 0.00 0.20 0.00 48.4
11 T1 5 0.0 0.004 0.0 LOS A 0.0 0.0 0.00 0.20 0.00 48.9
Approach 8 0.0 0.004 1.7 NA 0.0 0.0 0.00 0.20 0.00 48.7
All Vehicles 104 0.0 0.059 4.3 NA 0.2 1.7 0.03 0.49 0.03 46.7
Site Level of Service (LOS) Method: Delay (RTA NSW). Site LOS Method is specified in the Parameter Settings dialog (Site tab).Vehicle movement LOS values are based on average delay per movement.Minor Road Approach LOS values are based on average delay for all vehicle movements.NA: Intersection LOS and Major Road Approach LOS values are Not Applicable for two-way sign control since the average delay is not a good LOS measure due to zero delays associated with major road movements.SIDRA Standard Delay Model is used. Control Delay includes Geometric Delay.Gap-Acceptance Capacity: SIDRA Standard (Akçelik M3D).HV (%) values are calculated for All Movement Classes of All Heavy Vehicle Model Designation.
SIDRA INTERSECTION 8.0 | Copyright © 2000-2019 Akcelik and Associates Pty Ltd | sidrasolutions.comOrganisation: VARGA TRAFFIC PLANNING | Processed: Wednesday, 3 April, 2019 9:23:15 AMProject: Z:\DATA\Data\Jobs01\Jobs\19work\19072Y_136-144ParramattaRdHomebush\SIDRA\190403\LoftusLn_LoftusLn_Intersn.sip8

MOVEMENT SUMMARYSite: 101 [Proposed AM]
Loftus Lane & Loftus Lane IntersectionSite Category: (None)Giveway / Yield (Two-Way)
Movement Performance - VehiclesDemand Flows 95% Back of QueueMov
ID Turn Deg.
SatnAverage
Delay Level ofService
Prop. Queued
Effective Stop Rate
Aver. No.Cycles
AverageSpeed Total HV Vehicles Distance
veh/h % v/c sec veh m km/hEast: Loftus Lane
5 T1 2 0.0 0.002 0.1 LOS A 0.0 0.0 0.08 0.18 0.08 48.8
6 R2 1 0.0 0.002 4.7 LOS A 0.0 0.0 0.08 0.18 0.08 47.8
Approach 3 0.0 0.002 1.6 NA 0.0 0.0 0.08 0.18 0.08 48.5
North: Loftus Lane
7 L2 84 0.0 0.061 4.7 LOS A 0.2 1.7 0.10 0.50 0.10 46.4
9 R2 10 0.0 0.061 4.7 LOS A 0.2 1.7 0.10 0.50 0.10 46.0
Approach 94 0.0 0.061 4.7 LOS A 0.2 1.7 0.10 0.50 0.10 46.3
West: Loftus Lane
10 L2 8 0.0 0.022 4.6 LOS A 0.0 0.0 0.00 0.10 0.00 48.9
11 T1 35 0.0 0.022 0.0 LOS A 0.0 0.0 0.00 0.10 0.00 49.4
Approach 43 0.0 0.022 0.9 NA 0.0 0.0 0.00 0.10 0.00 49.3
All Vehicles 140 0.0 0.061 3.4 NA 0.2 1.7 0.07 0.37 0.07 47.3
Site Level of Service (LOS) Method: Delay (RTA NSW). Site LOS Method is specified in the Parameter Settings dialog (Site tab).Vehicle movement LOS values are based on average delay per movement.Minor Road Approach LOS values are based on average delay for all vehicle movements.NA: Intersection LOS and Major Road Approach LOS values are Not Applicable for two-way sign control since the average delay is not a good LOS measure due to zero delays associated with major road movements.SIDRA Standard Delay Model is used. Control Delay includes Geometric Delay.Gap-Acceptance Capacity: SIDRA Standard (Akçelik M3D).HV (%) values are calculated for All Movement Classes of All Heavy Vehicle Model Designation.
SIDRA INTERSECTION 8.0 | Copyright © 2000-2019 Akcelik and Associates Pty Ltd | sidrasolutions.comOrganisation: VARGA TRAFFIC PLANNING | Processed: Wednesday, 3 April, 2019 9:23:15 AMProject: Z:\DATA\Data\Jobs01\Jobs\19work\19072Y_136-144ParramattaRdHomebush\SIDRA\190403\LoftusLn_LoftusLn_Intersn.sip8
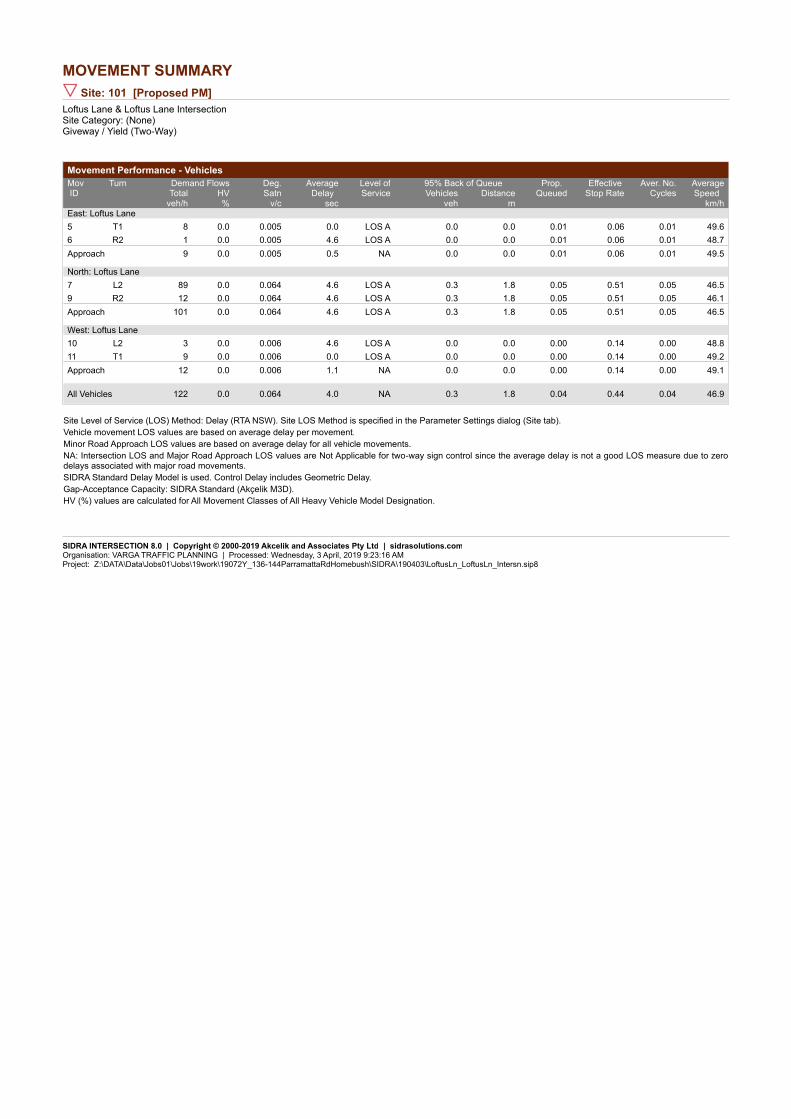
MOVEMENT SUMMARYSite: 101 [Proposed PM]
Loftus Lane & Loftus Lane IntersectionSite Category: (None)Giveway / Yield (Two-Way)
Movement Performance - VehiclesDemand Flows 95% Back of QueueMov
ID Turn Deg.
SatnAverage
Delay Level ofService
Prop. Queued
Effective Stop Rate
Aver. No.Cycles
AverageSpeed Total HV Vehicles Distance
veh/h % v/c sec veh m km/hEast: Loftus Lane
5 T1 8 0.0 0.005 0.0 LOS A 0.0 0.0 0.01 0.06 0.01 49.6
6 R2 1 0.0 0.005 4.6 LOS A 0.0 0.0 0.01 0.06 0.01 48.7
Approach 9 0.0 0.005 0.5 NA 0.0 0.0 0.01 0.06 0.01 49.5
North: Loftus Lane
7 L2 89 0.0 0.064 4.6 LOS A 0.3 1.8 0.05 0.51 0.05 46.5
9 R2 12 0.0 0.064 4.6 LOS A 0.3 1.8 0.05 0.51 0.05 46.1
Approach 101 0.0 0.064 4.6 LOS A 0.3 1.8 0.05 0.51 0.05 46.5
West: Loftus Lane
10 L2 3 0.0 0.006 4.6 LOS A 0.0 0.0 0.00 0.14 0.00 48.8
11 T1 9 0.0 0.006 0.0 LOS A 0.0 0.0 0.00 0.14 0.00 49.2
Approach 12 0.0 0.006 1.1 NA 0.0 0.0 0.00 0.14 0.00 49.1
All Vehicles 122 0.0 0.064 4.0 NA 0.3 1.8 0.04 0.44 0.04 46.9
Site Level of Service (LOS) Method: Delay (RTA NSW). Site LOS Method is specified in the Parameter Settings dialog (Site tab).Vehicle movement LOS values are based on average delay per movement.Minor Road Approach LOS values are based on average delay for all vehicle movements.NA: Intersection LOS and Major Road Approach LOS values are Not Applicable for two-way sign control since the average delay is not a good LOS measure due to zero delays associated with major road movements.SIDRA Standard Delay Model is used. Control Delay includes Geometric Delay.Gap-Acceptance Capacity: SIDRA Standard (Akçelik M3D).HV (%) values are calculated for All Movement Classes of All Heavy Vehicle Model Designation.
SIDRA INTERSECTION 8.0 | Copyright © 2000-2019 Akcelik and Associates Pty Ltd | sidrasolutions.comOrganisation: VARGA TRAFFIC PLANNING | Processed: Wednesday, 3 April, 2019 9:23:16 AMProject: Z:\DATA\Data\Jobs01\Jobs\19work\19072Y_136-144ParramattaRdHomebush\SIDRA\190403\LoftusLn_LoftusLn_Intersn.sip8

MOVEMENT SUMMARYSite: 101 [Existing AM]
Parramatta Road & Loftus Lane IntersectionSite Category: (None)Giveway / Yield (Two-Way)
Movement Performance - VehiclesDemand Flows 95% Back of QueueMov
ID Turn Deg.
SatnAverage
Delay Level ofService
Prop. Queued
Effective Stop Rate
Aver. No.Cycles
AverageSpeed Total HV Vehicles Distance
veh/h % v/c sec veh m km/hSouth: Loftus Lane
1 L2 6 0.0 0.029 5.7 LOS A 0.1 0.6 0.61 0.59 0.61 42.9
3 R2 1 0.0 0.029 80.3 LOS F 0.1 0.6 0.61 0.59 0.61 43.0
Approach 7 0.0 0.029 16.3 LOS B 0.1 0.6 0.61 0.59 0.61 42.9
East: Parramatta Road
4 L2 64 0.0 0.182 5.6 LOS A 0.0 0.0 0.00 0.11 0.00 57.4
5 T1 995 0.7 0.182 0.0 LOS A 0.0 0.0 0.00 0.03 0.00 59.7
Approach 1059 0.7 0.182 0.4 NA 0.0 0.0 0.00 0.04 0.00 59.5
West: Parramatta Road
11 T1 992 0.7 0.186 0.5 LOS A 0.6 4.5 0.05 0.01 0.05 59.2
12 R2 18 0.0 0.186 15.3 LOS B 0.6 4.5 0.19 0.04 0.19 51.9
Approach 1010 0.7 0.186 0.8 NA 0.6 4.5 0.06 0.01 0.06 59.1
All Vehicles 2076 0.7 0.186 0.6 NA 0.6 4.5 0.03 0.03 0.03 59.2
Site Level of Service (LOS) Method: Delay (RTA NSW). Site LOS Method is specified in the Parameter Settings dialog (Site tab).Vehicle movement LOS values are based on average delay per movement.Minor Road Approach LOS values are based on average delay for all vehicle movements.NA: Intersection LOS and Major Road Approach LOS values are Not Applicable for two-way sign control since the average delay is not a good LOS measure due to zero delays associated with major road movements.SIDRA Standard Delay Model is used. Control Delay includes Geometric Delay.Gap-Acceptance Capacity: SIDRA Standard (Akçelik M3D).HV (%) values are calculated for All Movement Classes of All Heavy Vehicle Model Designation.
SIDRA INTERSECTION 8.0 | Copyright © 2000-2019 Akcelik and Associates Pty Ltd | sidrasolutions.comOrganisation: VARGA TRAFFIC PLANNING | Processed: Wednesday, 3 April, 2019 9:25:15 AMProject: Z:\DATA\Data\Jobs01\Jobs\19work\19072Y_136-144ParramattaRdHomebush\SIDRA\190403\ParramattaRd_LoftusLn_Intsn.sip8
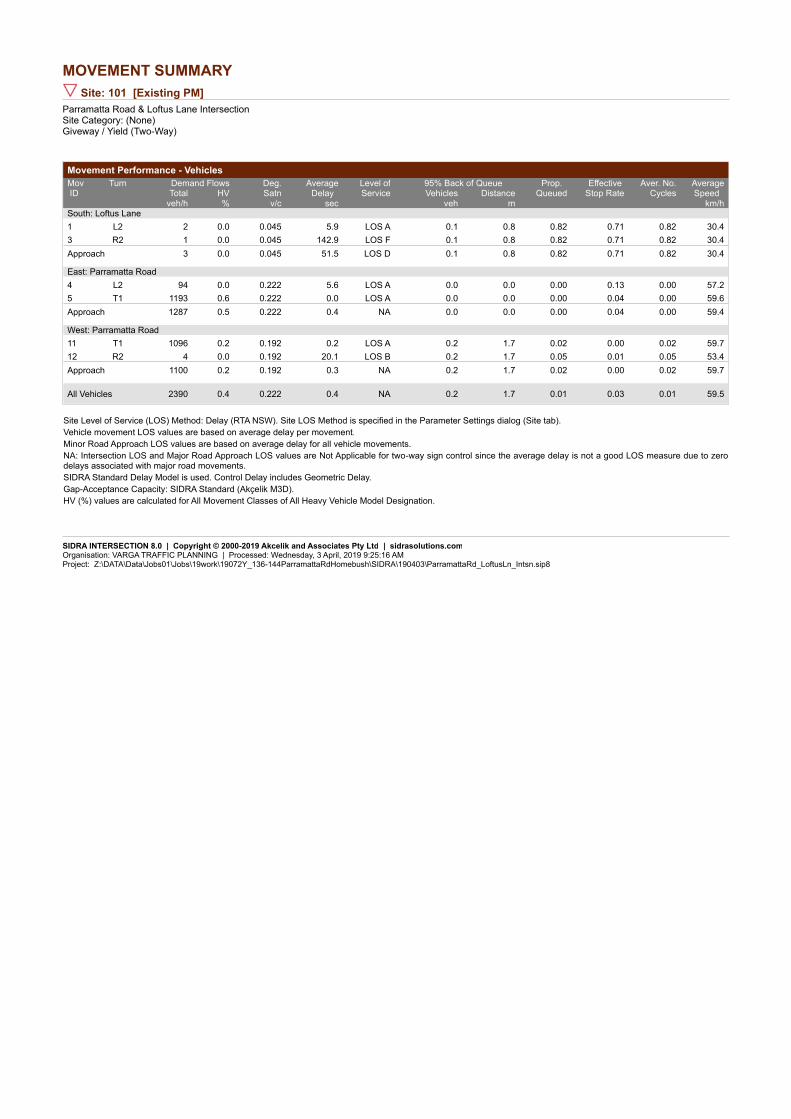
MOVEMENT SUMMARYSite: 101 [Existing PM]
Parramatta Road & Loftus Lane IntersectionSite Category: (None)Giveway / Yield (Two-Way)
Movement Performance - VehiclesDemand Flows 95% Back of QueueMov
ID Turn Deg.
SatnAverage
Delay Level ofService
Prop. Queued
Effective Stop Rate
Aver. No.Cycles
AverageSpeed Total HV Vehicles Distance
veh/h % v/c sec veh m km/hSouth: Loftus Lane
1 L2 2 0.0 0.045 5.9 LOS A 0.1 0.8 0.82 0.71 0.82 30.4
3 R2 1 0.0 0.045 142.9 LOS F 0.1 0.8 0.82 0.71 0.82 30.4
Approach 3 0.0 0.045 51.5 LOS D 0.1 0.8 0.82 0.71 0.82 30.4
East: Parramatta Road
4 L2 94 0.0 0.222 5.6 LOS A 0.0 0.0 0.00 0.13 0.00 57.2
5 T1 1193 0.6 0.222 0.0 LOS A 0.0 0.0 0.00 0.04 0.00 59.6
Approach 1287 0.5 0.222 0.4 NA 0.0 0.0 0.00 0.04 0.00 59.4
West: Parramatta Road
11 T1 1096 0.2 0.192 0.2 LOS A 0.2 1.7 0.02 0.00 0.02 59.7
12 R2 4 0.0 0.192 20.1 LOS B 0.2 1.7 0.05 0.01 0.05 53.4
Approach 1100 0.2 0.192 0.3 NA 0.2 1.7 0.02 0.00 0.02 59.7
All Vehicles 2390 0.4 0.222 0.4 NA 0.2 1.7 0.01 0.03 0.01 59.5
Site Level of Service (LOS) Method: Delay (RTA NSW). Site LOS Method is specified in the Parameter Settings dialog (Site tab).Vehicle movement LOS values are based on average delay per movement.Minor Road Approach LOS values are based on average delay for all vehicle movements.NA: Intersection LOS and Major Road Approach LOS values are Not Applicable for two-way sign control since the average delay is not a good LOS measure due to zero delays associated with major road movements.SIDRA Standard Delay Model is used. Control Delay includes Geometric Delay.Gap-Acceptance Capacity: SIDRA Standard (Akçelik M3D).HV (%) values are calculated for All Movement Classes of All Heavy Vehicle Model Designation.
SIDRA INTERSECTION 8.0 | Copyright © 2000-2019 Akcelik and Associates Pty Ltd | sidrasolutions.comOrganisation: VARGA TRAFFIC PLANNING | Processed: Wednesday, 3 April, 2019 9:25:16 AMProject: Z:\DATA\Data\Jobs01\Jobs\19work\19072Y_136-144ParramattaRdHomebush\SIDRA\190403\ParramattaRd_LoftusLn_Intsn.sip8

MOVEMENT SUMMARYSite: 101 [Proposed AM]
Parramatta Road & Loftus Lane IntersectionSite Category: (None)Giveway / Yield (Two-Way)
Movement Performance - VehiclesDemand Flows 95% Back of QueueMov
ID Turn Deg.
SatnAverage
Delay Level ofService
Prop. Queued
Effective Stop Rate
Aver. No.Cycles
AverageSpeed Total HV Vehicles Distance
veh/h % v/c sec veh m km/hSouth: Loftus Lane
1 L2 6 0.0 0.029 5.7 LOS A 0.1 0.6 0.61 0.58 0.61 42.9
3 R2 1 0.0 0.029 80.4 LOS F 0.1 0.6 0.61 0.58 0.61 43.0
Approach 7 0.0 0.029 16.3 LOS B 0.1 0.6 0.61 0.58 0.61 42.9
East: Parramatta Road
4 L2 65 0.0 0.183 5.6 LOS A 0.0 0.0 0.00 0.11 0.00 57.4
5 T1 995 0.7 0.183 0.0 LOS A 0.0 0.0 0.00 0.03 0.00 59.7
Approach 1060 0.7 0.183 0.4 NA 0.0 0.0 0.00 0.04 0.00 59.5
West: Parramatta Road
11 T1 992 0.7 0.186 0.5 LOS A 0.6 4.5 0.05 0.01 0.05 59.2
12 R2 18 0.0 0.186 15.3 LOS B 0.6 4.5 0.19 0.04 0.19 51.9
Approach 1010 0.7 0.186 0.8 NA 0.6 4.5 0.06 0.01 0.06 59.1
All Vehicles 2077 0.7 0.186 0.6 NA 0.6 4.5 0.03 0.03 0.03 59.2
Site Level of Service (LOS) Method: Delay (RTA NSW). Site LOS Method is specified in the Parameter Settings dialog (Site tab).Vehicle movement LOS values are based on average delay per movement.Minor Road Approach LOS values are based on average delay for all vehicle movements.NA: Intersection LOS and Major Road Approach LOS values are Not Applicable for two-way sign control since the average delay is not a good LOS measure due to zero delays associated with major road movements.SIDRA Standard Delay Model is used. Control Delay includes Geometric Delay.Gap-Acceptance Capacity: SIDRA Standard (Akçelik M3D).HV (%) values are calculated for All Movement Classes of All Heavy Vehicle Model Designation.
SIDRA INTERSECTION 8.0 | Copyright © 2000-2019 Akcelik and Associates Pty Ltd | sidrasolutions.comOrganisation: VARGA TRAFFIC PLANNING | Processed: Wednesday, 3 April, 2019 9:25:16 AMProject: Z:\DATA\Data\Jobs01\Jobs\19work\19072Y_136-144ParramattaRdHomebush\SIDRA\190403\ParramattaRd_LoftusLn_Intsn.sip8

MOVEMENT SUMMARYSite: 101 [Proposed PM]
Parramatta Road & Loftus Lane IntersectionSite Category: (None)Giveway / Yield (Two-Way)
Movement Performance - VehiclesDemand Flows 95% Back of QueueMov
ID Turn Deg.
SatnAverage
Delay Level ofService
Prop. Queued
Effective Stop Rate
Aver. No.Cycles
AverageSpeed Total HV Vehicles Distance
veh/h % v/c sec veh m km/hSouth: Loftus Lane
1 L2 2 0.0 0.046 5.8 LOS A 0.1 0.8 0.81 0.70 0.81 30.3
3 R2 1 0.0 0.046 144.3 LOS F 0.1 0.8 0.81 0.70 0.81 30.3
Approach 3 0.0 0.046 52.0 LOS D 0.1 0.8 0.81 0.70 0.81 30.3
East: Parramatta Road
4 L2 101 0.0 0.223 5.6 LOS A 0.0 0.0 0.00 0.14 0.00 57.1
5 T1 1193 0.6 0.223 0.0 LOS A 0.0 0.0 0.00 0.04 0.00 59.6
Approach 1294 0.5 0.223 0.5 NA 0.0 0.0 0.00 0.05 0.00 59.4
West: Parramatta Road
11 T1 1096 0.2 0.192 0.2 LOS A 0.2 1.7 0.02 0.00 0.02 59.7
12 R2 4 0.0 0.192 20.3 LOS B 0.2 1.7 0.05 0.01 0.05 53.3
Approach 1100 0.2 0.192 0.3 NA 0.2 1.7 0.02 0.00 0.02 59.7
All Vehicles 2397 0.4 0.223 0.5 NA 0.2 1.7 0.01 0.03 0.01 59.5
Site Level of Service (LOS) Method: Delay (RTA NSW). Site LOS Method is specified in the Parameter Settings dialog (Site tab).Vehicle movement LOS values are based on average delay per movement.Minor Road Approach LOS values are based on average delay for all vehicle movements.NA: Intersection LOS and Major Road Approach LOS values are Not Applicable for two-way sign control since the average delay is not a good LOS measure due to zero delays associated with major road movements.SIDRA Standard Delay Model is used. Control Delay includes Geometric Delay.Gap-Acceptance Capacity: SIDRA Standard (Akçelik M3D).HV (%) values are calculated for All Movement Classes of All Heavy Vehicle Model Designation.
SIDRA INTERSECTION 8.0 | Copyright © 2000-2019 Akcelik and Associates Pty Ltd | sidrasolutions.comOrganisation: VARGA TRAFFIC PLANNING | Processed: Wednesday, 3 April, 2019 9:25:17 AMProject: Z:\DATA\Data\Jobs01\Jobs\19work\19072Y_136-144ParramattaRdHomebush\SIDRA\190403\ParramattaRd_LoftusLn_Intsn.sip8