12 month forecast currency returns vs USD, quarterly ...
16
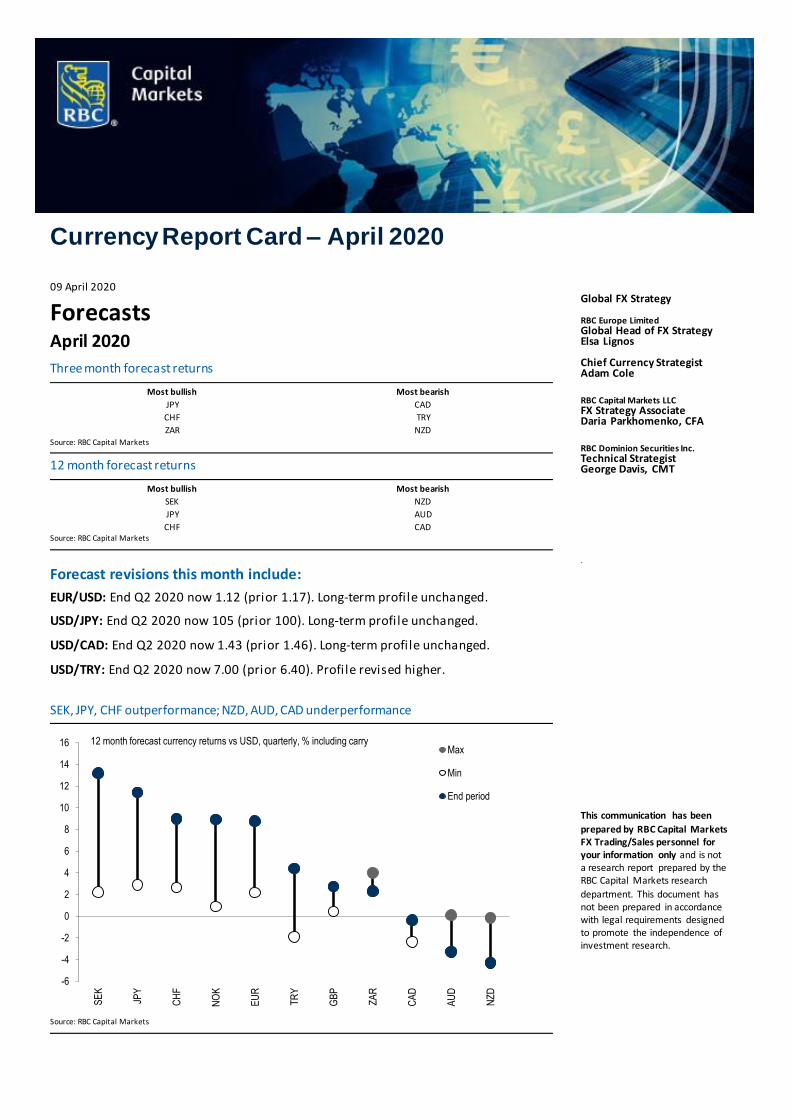
Currency Report Card – April 2020 09 April 2020 Forecasts April 2020 Three month forecast returns Most bullish Most bearish JPY CAD CHF TRY ZAR NZD Source: RBC Capital Markets 12 month forecast returns Most bullish Most bearish SEK NZD JPY AUD CHF CAD Source: RBC Capital Markets Forecast revisions this month include: EUR/USD: End Q2 2020 now 1.12 (prior 1.17). Long-term profile unchanged. USD/JPY: End Q2 2020 now 105 (prior 100). Long-term profile unchanged. USD/CAD: End Q2 2020 now 1.43 (prior 1.46). Long-term profile unchanged. USD/TRY: End Q2 2020 now 7.00 (prior 6.40). Profile revised higher. SEK, JPY, CHF outperformance; NZD, AUD, CAD underperformance Source: RBC Capital Markets Global FX Strategy RBC Europe Limited Global Head of FX Strategy Elsa Lignos Chief Currency Strategist Adam Cole RBC Capital Markets LLC FX Strategy Associate Daria Parkhomenko, CFA RBC Dominion Securities Inc. Technical Strategist George Davis, CMT . This communication has been prepared by RBC Capital Markets FX Trading/Sales personnel for your information only and is not a research report prepared by the RBC Capital Markets research department. This document has not been prepared in accordance with legal requirements designed to promote the independence of investment research. -6 -4 -2 0 2 4 6 8 10 12 14 16 SEK JPY CHF NOK EUR TRY GBP ZAR CAD AUD NZD Max Min End period 12 month forecast currency returns vs USD, quarterly, % including carry
Transcript of 12 month forecast currency returns vs USD, quarterly ...
Currency Report Card – April 2020
09 April 2020
Forecasts April 2020
Three month forecast returns
Most bullish Most bearish
JPY CAD
CHF TRY
ZAR NZD Source: RBC Capital Markets
12 month forecast returns
Most bullish Most bearish
SEK NZD
JPY AUD
CHF CAD Source: RBC Capital Markets
Forecast revisions this month include:
EUR/USD: End Q2 2020 now 1.12 (prior 1.17). Long-term profile unchanged.
USD/JPY: End Q2 2020 now 105 (prior 100). Long-term profile unchanged.
USD/CAD: End Q2 2020 now 1.43 (prior 1.46). Long-term profile unchanged.
USD/TRY: End Q2 2020 now 7.00 (prior 6.40). Profile revised higher.
SEK, JPY, CHF outperformance; NZD, AUD, CAD underperformance
Source: RBC Capital Markets
Global FX Strategy RBC Europe Limited Global Head of FX Strategy Elsa Lignos Chief Currency Strategist Adam Cole
RBC Capital Markets LLC FX Strategy Associate Daria Parkhomenko, CFA
RBC Dominion Securities Inc. Technical Strategist George Davis, CMT
.
This communication has been
prepared by RBC Capital Markets FX Trading/Sales personnel for your information only and is not a research report prepared by the RBC Capital Markets research
department. This document has not been prepared in accordance with legal requirements designed to promote the independence of investment research.
-6
-4
-2
0
2
4
6
8
10
12
14
16
SE
K
JPY
CH
F
NO
K
EU
R
TR
Y
GB
P
ZA
R
CA
D
AU
D
NZ
D
Max
Min
End period
12 month forecast currency returns vs USD, quarterly, % including carry

Currency Report Card
09 April 2020 2
Table of contents
US Dollar.................................................................................................................................... 3 Euro ........................................................................................................................................... 4 Japanese Yen............................................................................................................................. 5 Sterling ...................................................................................................................................... 6 Swiss Franc ................................................................................................................................ 7 Swedish Krona .......................................................................................................................... 8 Norwegian Krone ................................................................................................................. 9 Canadian Dollar ..................................................................................................................10 Australian Dollar .....................................................................................................................11 New Zealand Dollar ................................................................................................................12 Turkish Lira .........................................................................................................................13 South African Rand ............................................................................................................14 Forecasts .................................................................................................................................15 Disclaimer................................................................................................................................16

Currency Report Card
09 April 2020 3
US Dollar Elsa Lignos
1-3 Month Outlook – Funding pressures abate…
March was a striking month for USD with huge DXY weakness in the first part of the month, an even bigger rally in the middle and a sell-off into month-end, leaving it little changed on net but with a 9% trough-to-peak move. Some of it can be rationalised by looking at the price action in funding markets. As l iquidity and risk appetite deteriorated in March, cross-currency basis blew out (particularly when looking at OIS basis) and implied USD yields shot higher, particularly for short dates. The scramble for USD had a knock-on effect on the spot market, leading to USD gains across the board. Part of that was driven by fundamentals (if accessing USD through swaps becomes prohibitively expensive, market participants may turn to the spot market), but we think that was exaggerated by speculative flow. Importantly, the Fed has demonstrated extreme sensitivity to market pressures, and a readiness to do whatever it takes to address them. So far we have seen 3m weekly repos, a resumption of USD swap lines with major central banks, an extension of those swap lines to the rest of G10 and some EM, treasury repo agreements for foreign central banks, as well as a breakneck expansion in asset purchases (Figure 2), going further out the credit curve than ever before. That has prompted normalisation in funding markets, a reversal in USD, and a bounce in equity markets. Of the three, we have most confidence in the Fed’s ability to control the first (funding markets). For the second (the USD outlook), we have left our end-year forecasts for EUR/USD and USD/JPY unchanged – looking for some USD weakness – but forecasting USD strength elsewhere, particularly against weaker EMFX. While the past month has been marked by USD-directionality, as markets process the full economic fall-out of COVID-19, we expect that to evolve into more idiosyncratic moves (reflected in our forecasts).
6-12 Month Outlook – Timing the virus fall-out
Many of the new facilities announced by the Fed have an end-date of September 2020 though Powell has made clear this is relatively meaningless and the Fed will extend all programmes as needed. One thing that is clear is that the hurdle for taking back rate cuts is very high and for both USD/JPY and EUR/USD, we think this will translate to FX hedges being put back on over time (see pg 4 and 5). The November election which once loomed large over 2020 has fallen by the wayside, with Biden now confirmed as the Democrat candidate. The US fiscal response to coronavirus is huge and still growing, but high private sector savings and foreign demand for USTs mean funding is assured for now.
Indicators
Current (Previous)* Official cash rate 0.00-0.25% (1.00-1.25%) Trend interest rates (10yr average) 1.9% Bias in interest rate market Neutral
Core PCE Inflation %Y/Y Feb (Jan) 1.8% (1.7%) Inflation target Price stability Budget balance % GDP FY17 (FY16) -3.4% (-3.1%) Budget balance target % GDP - GDP Growth % y/y Q4 (Q3) 2.3% (2.1%)
Trend GDP %y/y 2.5% Purchasing Power Parity Value - Spot - PPP Valuation -
Current account balance % GDP Q4 (Q3) -2.3% (-2.5%) Trend current account balance % GDP -2.6% Moody's Foreign Currency Rating Aaa Outlook Stable * Current is latest month, quarter or year
Source: RBC Capital Markets; Bloomberg
1. Large moves in EUR/USD basis
2. Fed’s balance sheet growing at breakneck pace
Source: RBC Capital Markets; Bloomberg
Forecasts
Source: RBC Capital Markets estimates
Q1 Q2f Q3f Q4f Q1f Q2f Q3f Q4f
EUR/USD 1.10 1.12 1.16 1.20 1.17 1.16 1.15 1.14
EUR/JPY 119 118 116 114 113 115 116 117
EUR/CAD 1.55 1.60 1.66 1.68 1.61 1.59 1.56 1.54
20212020
-200
-150
-100
-50
0
50
100
Sep-19 Oct-19 Nov-19 Dec-19 Jan-20 Feb-20 Mar-20 Apr-20
Euribor vs. Libor
EONIA v. FF
EUR/USD 3m basis
0
1,000
2,000
3,000
4,000
5,000
6,000
7,000
05 06 07 08 09 10 11 12 13 14 15 16 17 18 19 20
Federal Reserve total assets (USD bn)
Currency Report Card
09 April 2020 4
Euro Elsa Lignos
1-3 Month Outlook – Caught in USD crosswinds
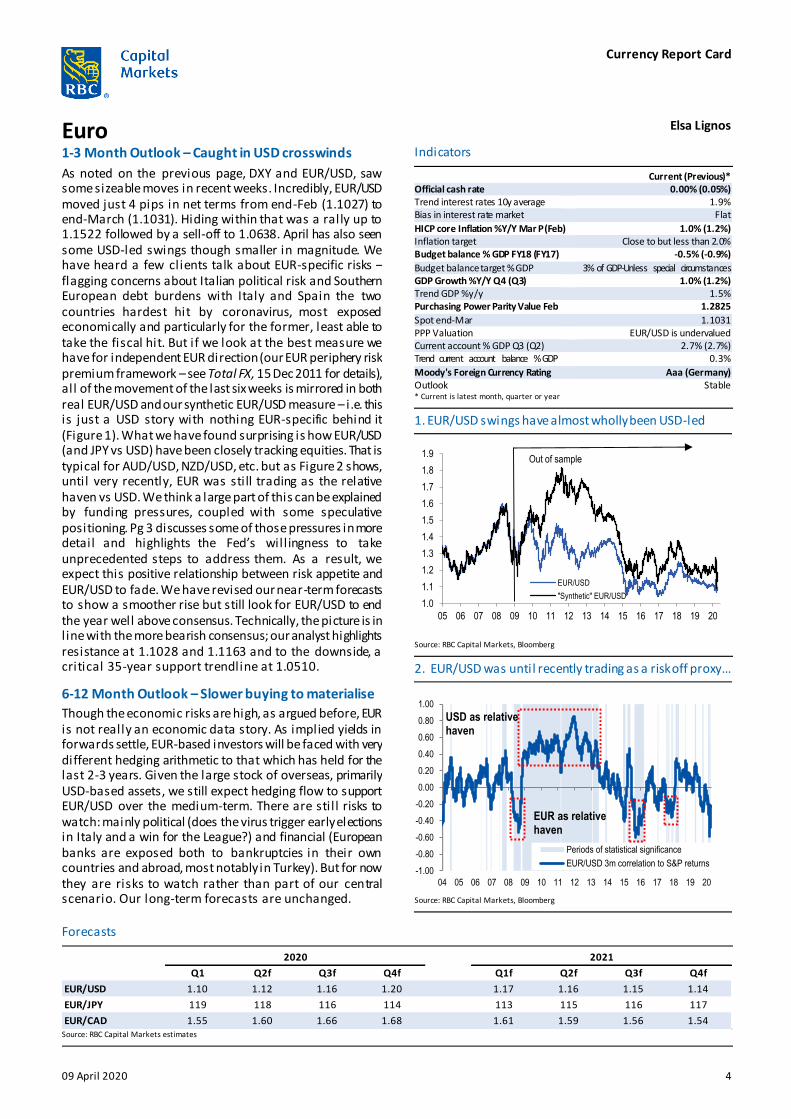
As noted on the previous page, DXY and EUR/USD, saw some sizeable moves in recent weeks. Incredibly, EUR/USD moved just 4 pips in net terms from end-Feb (1.1027) to end-March (1.1031). Hiding within that was a rally up to 1.1522 followed by a sell-off to 1.0638. April has also seen some USD-led swings though smaller in magnitude. We have heard a few clients talk about EUR-specific risks – flagging concerns about Italian political risk and Southern European debt burdens with Italy and Spain the two countries hardest hit by coronavirus, most exposed economically and particularly for the former, least able to take the fiscal hit. But if we look at the best measure we have for independent EUR direction (our EUR periphery risk premium framework – see Total FX, 15 Dec 2011 for details), all of the movement of the last six weeks is mirrored in both real EUR/USD and our synthetic EUR/USD measure – i .e. this is just a USD story with nothing EUR-specific behind it (Figure 1). What we have found surprising is how EUR/USD (and JPY vs USD) have been closely tracking equities. That is typical for AUD/USD, NZD/USD, etc. but as Figure 2 shows, until very recently, EUR was still trading as the relative haven vs USD. We think a large part of this can be explained by funding pressures, coupled with some speculative positioning. Pg 3 discusses some of those pressures in more detail and highlights the Fed’s will ingness to take unprecedented steps to address them. As a result, we expect this positive relationship between risk appetite and EUR/USD to fade. We have revised our near-term forecasts to show a smoother rise but still look for EUR/USD to end the year well above consensus. Technically, the picture is in l ine with the more bearish consensus; our analyst highlights resistance at 1.1028 and 1.1163 and to the downside, a critical 35-year support trendline at 1.0510.
6-12 Month Outlook – Slower buying to materialise
Though the economic risks are high, as argued before, EUR is not really an economic data story. As implied yields in forwards settle, EUR-based investors will be faced with very different hedging arithmetic to that which has held for the last 2-3 years. Given the large stock of overseas, primarily USD-based assets, we still expect hedging flow to support EUR/USD over the medium-term. There are stil l risks to watch: mainly political (does the virus trigger early elections in Italy and a win for the League?) and financial (European banks are exposed both to bankruptcies in their own countries and abroad, most notably in Turkey). But for now they are risks to watch rather than part of our central scenario. Our long-term forecasts are unchanged.
Indicators
Current (Previous)* Official cash rate 0.00% (0.05%) Trend interest rates 10y average 1.9% Bias in interest rate market Flat
HICP core Inflation %Y/Y Mar P (Feb) 1.0% (1.2%) Inflation target Close to but less than 2.0% Budget balance % GDP FY18 (FY17) -0.5% (-0.9%)
Budget balance target % GDP 3% of GDP-Unless special circumstances GDP Growth %Y/Y Q4 (Q3) 1.0% (1.2%) Trend GDP %y/y 1.5% Purchasing Power Parity Value Feb 1.2825
Spot end-Mar 1.1031 PPP Valuation EUR/USD is undervalued Current account % GDP Q3 (Q2) 2.7% (2.7%) Trend current account balance % GDP 0.3%
Moody's Foreign Currency Rating Aaa (Germany) Outlook Stable * Current is latest month, quarter or year
Source: RBC Capital Markets, Bloomberg
1. EUR/USD swings have almost wholly been USD-led
2. EUR/USD was until recently trading as a risk off proxy…
Source: RBC Capital Markets, Bloomberg
Forecasts
Source: RBC Capital Markets estimates
Q1 Q2f Q3f Q4f Q1f Q2f Q3f Q4f
EUR/USD 1.10 1.12 1.16 1.20 1.17 1.16 1.15 1.14
EUR/JPY 119 118 116 114 113 115 116 117
EUR/CAD 1.55 1.60 1.66 1.68 1.61 1.59 1.56 1.54
20212020
1.0
1.1
1.2
1.3
1.4
1.5
1.6
1.7
1.8
1.9
05 06 07 08 09 10 11 12 13 14 15 16 17 18 19 20
EUR/USD
"Synthetic" EUR/USD
Out of sample
-1.00
-0.80
-0.60
-0.40
-0.20
0.00
0.20
0.40
0.60
0.80
1.00
04 05 06 07 08 09 10 11 12 13 14 15 16 17 18 19 20
Periods of statistical significance
EUR/USD 3m correlation to S&P returns
EUR as relative haven
USD as relative haven

Currency Report Card
09 April 2020 5
Japanese Yen Adam Cole
1-3 Month Outlook – USD/JPY trending lower
In net terms, USD/JPY ended March almost where it started the month, but the high to low range (over 1000pts) was the third widest since the GFC. While the sell-off in the first half of the month and the recovery in the second half was symmetric, the drivers of the two legs were very different. The collapse from the last February peak was a straightforward risk-off move as global equity markets slumped. The equally sharp rebound in the second half of March happened independent of moves in equities and other proxies for global risk conditions and was part of an across the board USD rally that mirrored stress in USD funding markets. With those stresses having eased somewhat (USD/JPY basis has normalised, though LIBOR spreads are stil l wide) USD/JPY’s relationship with risk appetite should revert to something historically more normal. For now, large doses of fiscal and monetary stimulus globally appear to have stabilised risky assets and gone some way to backstop growth expectations for 2020. With no anchor for expectations in 2021 and beyond, however, and no visible end-point for COVID-19-related disruption, further material declines in risky asset prices, carrying USD/JPY lower, are clearly possible.
On neutral risk assumptions, our core view remains that USD/JPY will move steadily lower. The hurdle for the Fed taking back the stimulus it delivered through the course of March is high and one of the key side-effects of this is to dramatically reduce the cost of hedging for Japanese investors, whose hedge ratios appear to be historically low (Figure 1). So long as the cost of hedging remains low, we expect a wholesale shift to putting hedges back onto foreign bond portfolios and the USD/JPY sell ing that results from this will drive the pair lower.
6-12 Month Outlook – Taregt 95 in USD/JPY
Large shifts in hedges take time to materialise and we expect this trend to extend well into H2. BoJ policy, as usual, plays a very l imited role in driving JPY and the central bank’s options are very limited. Fiscal policy adjustments in Japan have also been typically modest. We estimate that “real” fiscal easing amounted to only around 2% of GDP in April’s package, though it was touted as up to 20% of GDP.
We have made changes to the short-term profile for USD/JPY to reflect the starting point, but the profile of steady decline is unchanged, as is our end-year forecast of 95.
Indicators
Current (Previous)* Official cash rate -0.1% (-0.1%) Trend interest rates 10y average 0.15% Bias in interest rate market Flat
CPI Inflation %Y/Y Feb (Jan) 0.6% (0.8%) Inflation target 2.0% Budget balance % GDP FY18 (FY19) -2.4% (-3.0%) Budget balance target % GDP n/a GDP Growth %Y/Y Q4 (Q3) -0.7% (1.7%)
Trend GDP %Y/Y 1.0% Purchasing Power Parity Value Feb 87.50 Spot end-Mar 107.54 PPP Valuation USD/JPY is overvalued
Current a/c balance % GDP Q4 (Q4) 3.7% (3.6%) Trend current account balance % GDP 2.6% Moody's Foreign Currency Rating A1 Outlook Stable * Current is latest month, quarter or year
Source: RBC Capital Markets, Bloomberg
1. Hedge ratios fell as hedging cost rose…
2. …but cost of hedging has now fallen significantly
Source: RBC Capital Markets, Bloomberg
Forecasts
Source: RBC Capital Markets estimates
Q1 Q2f Q3f Q4f Q1f Q2f Q3f Q4f
USD/JPY 108 105 100 95 97 99 101 103
EUR/JPY 119 118 116 114 113 115 116 117
CAD/JPY 76 73 70 68 70 72 74 76
20212020
0.4
0.5
0.6
0.7
0.8
0.9
1.0
-300
-200
-100
0
100
200
300
400
500
Jan-00 Jan-03 Jan-06 Jan-09 Jan-12 Jan-15 Jan-18
Sell 10 yr JGB, buy 10 yrUST, 3M hedge, bps
Aggregate Lifers' hedgeratio, RHS
0
1
2
3
4
5
6
7
03 04 05 06 07 08 09 10 11 12 13 14 15 16 17 18 19 20
Implied yield on Japan's overseas bond holdings, %
3M USD hedging cost
Based on u/c rates
Based on fwd pricing

Currency Report Card
09 April 2020 6
Sterling Adam Cole
1-3 Month Outlook – Fiscal vulnerabilities
GBP traded poorly against USD and EUR in March, though most of its losses were during the days of greatest stress in global equities around the middle of the month. With both USD and EUR quite neutral to general risk appetite currently, GBP’s losses were mostly due to its status as a mild proxy for risk, confirmed by small gains against the more extreme risk proxies like the commodity currencies. Beyond the spillover from shifts in general risk appetite, GBP had little direction through March. The BoE cut rates by 65bp to the effective lower bound, but this mirrored moves by most other DM central banks and with rates close to zero almost everywhere, it is hard to see either yield or rate expectations playing much of a role in driving GBP going forward. Fiscally, the UK has been relatively active in responding to the economic damage done by measures to control the spread of COVID-19 (Figure 1). Taking the March 11 Budget measures and later COVID-19-specific measures together, discretionary fiscal easing in the UK amounts to around 4% of GDP in FY 2020 and 2021. This is higher than the DM average and significantly higher than most of the rest of Europe. In the peak months of the crisis, easier fiscal policy is FX-positive, though in the UK’s case, it is less clear that this is sustainable in the longer-term. The UK private sector also runs a financial deficit (Figure 2), unlike the US and most of Europe, meaning increased government borrowing will need to be covered by ever larger capital inflows from abroad. This in turn raises the risk of a weaker currency as a mechanism for attracting those flows.
As COVID-19 and measures to mitigate the damage done by social distancing has completely dominated the domestic policy debate, Brexit has barely featured over the last month. With less than three months remaining to the deadline for the UK requesting an extension to the transition period, however, this will necessarily change in the coming weeks. Particularly with PM Johnson in hospital, an extension seems more and more inevitable. To the extent that extending the transition period delays the risk of exiting on WTO terms, in isolation this would probably be positive for GBP. For this reason, we have pushed the peak in EUR/GBP into 2021 from 2020, though the peak level remains unchanged (0.96).
6-12 Month Outlook – Ongoing weakness
Into H2 and beyond, there will be increasing focus on the UK’s twin deficits and our central expectation remains that GBP grinds lower.
Indicators
Current (Previous)* Official cash rate 0.10% (0.25%) Trend interest rates 10y average 3.3% Bias in interest rate market Flat CPI Inflation %Y/Y Feb (Jan) 1.7% (1.8%)
Inflation target (HICP) 2.0% Budget balance % GDP FY18 (FY17) -2.3% (-2.4%) Budget balance target % GDP Budget surplus as soon as possible GDP Growth %Y/Y Q4 (Q3) 1.1% (1.3%) Trend GDP %Y/Y 1.5%
Purchasing Power Parity Value Feb 1.4520 Spot end-Mar 1.2420 PPP Valuation GBP/USD is undervalued Current a/c balance % GDP Q4 (Q3) -3.8% (-4.8%)
Trend current account balance % GDP -3.9% Moody's Foreign Currency Rating Aa1 Outlook Stable * Current is latest month, quarter or year
Source: RBC Capital Markets, national finance ministries * 5% widening of output gap
1. UK being fiscally active
2. UK financial balances look precarious
Source: RBC Capital Markets, ONS
Forecasts
Source: RBC Capital Markets estimates
Q1 Q2f Q3f Q4f Q1f Q2f Q3f Q4f
GBP/USD 1.24 1.24 1.26 1.28 1.23 1.21 1.20 1.19
EUR/GBP 0.89 0.90 0.92 0.94 0.95 0.96 0.96 0.96
GBP/JPY 134 131 126 121 119 120 121 122
GBP/CAD 1.75 1.78 1.80 1.79 1.70 1.66 1.63 1.60
20212020
0.0
1.0
2.0
3.0
4.0
5.0
6.0
7.0
8.0
9.0
10.0
US CA GB DE FR IT ES JP AU NZ SE NO CH
Spending
Tax
Automatic stabilisers*
Net effect of fiscal changes, cumulative 2020-21, % GDP

Currency Report Card
09 April 2020 7
Swiss Franc Elsa Lignos
1-3 Month Outlook – Renewed intervention
Through the market sell-off of the past six weeks, EUR/CHF was directionally following equities but with a particularly low beta. The peak-to-trough move in EUR/CHF was just 2% (compared to swings of +/-10% elsewhere in G10 and larger stil l in EM). Figure 1 shows how the pair’s correlation to equity returns has ticked marginally higher but its elasticity remains suppressed. Figure 2 hints at the work the SNB is having to do, to keep things that way. It shows FX reserves (latest data point is Feb) against total sight deposits (weekly data released by the SNB, latest data point Apr 6). The rise in sight deposits suggests larger intervention, and the SNB admitted as much last month. In more recent trading sessions it has been helped by the reversal in risk appetite and the bounce in global equity markets. With tail risks still fat in both directions though there is still a lot of work for the SNB to do. As noted last month, that the SNB’s actions during periods of risk aversion will be more about managing the pace of CHF appreciation rather than reversing it. Technically, a downtrend has been in place for USD/CHF over the past year, with moves to resistance at 0.9895 and a double top at 1.0023 expected to attract selling interest in this regard. A daily close below initial support at 0.9630 would add to bearish momentum, exposing 0.9503 and 0.9392 thereafter.
6-12 Month Outlook – Hostage to global factors
As always, the long-term outlook for CHF will be determined by global not domestic factors. If the world tips into recession, there is little the SNB can do to prevent CHF from strengthening, as others cut rates to SNB-like levels. In any kind of positive, albeit low, global growth environment, CHF should be an underperformer. For the last decade, it has almost consistently been disappointed by realised inflation relative to its forecasts. Its most recent forecasts show average inflation of just 0.5% in 2021 and inflation nowhere near its 2% target, even at the end of the forecast horizon in Q3 2022. The current global virus situation does l ittle to improve those prospects. CHF looks l ike it will spend longer trapped between market forces pushing it higher and the SNB trying to contain the move.
Indicators
Current (Previous)* Official cash rate -0.25 to -1.25% (0.25 to -0.75%) Trend interest rates 10y average 1.70% Bias in interest rate market Flat CPI Inflation %Y/Y Mar (Feb) -0.5% (-0.1%)
Inflation target less than 2.0% Budget balance % GDP FY19 (FY18) 1.2% (1.6%) Budget balance target % GDP Balanced over the business cycle GDP Growth %Y/Y Q4 (Q3) 1.5% (1.1%) Trend GDP %Y/Y 1.80%
EUR Purchasing Power Parity Value Feb 1.1877 EUR/CHF spot end-Mar 1.0602 EUR/CHF PPP Valuation EUR/CHF is undervalued Current a/c balance % GDP Q4 (Q3) 12.3% (10.7%)
Trend current account balance % GDP 8.0% Moody's Foreign Currency Rating Aaa Outlook Stable * Current is latest month, quarter or year
Source: RBC Capital Markets; Bloomberg
1. EUR/CHF: Sustained low correlation to equity returns
2. Rise in sight deposits signaling rise in intervention
Source: RBC Capital Markets; Bloomberg, SNB
Forecasts
Source: RBC Capital Markets estimates
Q1 Q2f Q3f Q4f Q1f Q2f Q3f Q4f
USD/CHF 0.96 0.94 0.90 0.87 0.90 0.91 0.93 0.95
EUR/CHF 1.06 1.05 1.04 1.04 1.05 1.06 1.07 1.08
CHF/JPY 112 112 112 110 108 108 109 109
CAD/CHF 0.68 0.66 0.63 0.62 0.65 0.67 0.68 0.70
2020 2021
-0.1
0.0
0.1
0.2
0.3
0.4
0.5
0.6
0.7
0.8
0.9
-0.1
0.0
0.1
0.2
0.3
0.4
0.5
0.6
0.7
0.8
0.9
14 15 16 17 18 19 20
Correlation, LHS
Beta, RHSEURCHF vs S&P daily returns
0
100
200
300
400
500
600
700
800
08 09 10 11 12 13 14 15 16 17 18 19 20
FX reserves (CHF bn)
Total sight deposits (CHF bn)

Currency Report Card
09 April 2020 8
Swedish Krona Elsa Lignos
1-3 Month Outlook – Riksbank prefers zero rates
Having reached an 11 year high of 11.4166 in mid-March, EUR/SEK has settled back below 11. The broad uptrend remains in place, both in EUR/SEK and USD/SEK but there are a few things helping limit the extent of SEK losses. (1) As noted last month, positioning helped shield SEK, most notably in the early stages of the cri sis when SEK-funded long carry trades were cut on the spike in volatility. Our internal positioning metric has seen some sizeable swings in USD/SEK – with an initial unwind of SEK shorts, fl ipping the market temporarily long SEK, back to extreme shorts and now retracing (Figure 1). (2) While central banks everywhere are easing, the Riksbank is reluctant to push rates back into negative territory, having only just got them back to zero. Instead it has announced measures aimed at boosting l iquidity – up to SEK500bn of 2y repo rate funding to banks that can then lend to companies with a pledge from Ingves to “do more if it turns out that the funds offered aren’t enough” though take-up from banks so far has been low (the fourth auction conducted this week had just two bids for SEK17bn of the 100bn on offer). Ingves has argued expanded asset purchases would be more effective than returning to negative rates in the current crisis. On the downside, Sweden is exposed as a small, open economy and though it has not seen the scale of COVID-19 cases/deaths of Southern Europe, it is sti l l on the same exponential growth rate path seen elsewhere. Having so far taken a light-touch approach to virus restrictions, the Swedish govt has now tabled a bill allowing it to take faster decisions on more stringent measures if necessary (not yet passed but it has majority support in Parliament). The risk is that the economic impact takes longer to play out. Technically, the long-term uptrend in EUR/SEK favours using pullbacks to support at 10.8197 and 10.5361 as a buying opportunity. A return above resistance at 11.0200 would end the recent consolidation phase, opening up 11.2043 and 11.4262 as the uptrend is reasserted.
6-12 Month Outlook – Cheap but can stay that way
Figure 2 shows that SEK is cheap by historical standards but as discussed before, it can stay that way for some time. Over a 12m horizon we expect a trend down to 10.00 in EUR/SEK. That will leave it cheap but with policy normalisation even further away than it was before, i t will take longer for SEK to return to any measure of ‘long-term fair value’.
Indicators
Current (Previous)* Official cash rate 0.0% (-0.25%) Trend interest rates 10y average 3.0% Bias in interest rate market Flat CPIF Inflation %Y/Y Feb (Jan) 1.0% (1.2%)
Inflation target (UND1X) 2.0% Budget balance % GDP FY18 (FY17) 1.25% (1.55%) Budget balance target % GDP Cyclical average surplus of 1% GDP Growth %Y/Y Q4 (Q3) 0.8% (1.9%) Trend GDP %Y/Y 2.0%
EUR Purchasing Power Parity Value Feb 9.0387 Spot end-Mar 10.9265 PPP Valuation EUR/SEK is overvalued Current a/c balance % GDP Q4 (Q3) 3.9% (3.7%)
Trend current account balance % GDP 4.5% Moody's Foreign Currency Rating Aaa Outlook Stable * Current is latest month, quarter or year
Source: RBC Capital Markets, interbank market estimates
1. SEK positioning has seen some sizeable swings
2. SEK increasingly “cheap” but can stay that way
Source: RBC Capital Markets; Bloomberg
Forecasts
Source: RBC Capital Markets estimates
Q1 Q2f Q3f Q4f Q1f Q2f Q3f Q4f
USD/SEK 9.91 9.73 9.14 8.58 8.72 8.71 8.70 8.77
EUR/SEK 10.93 10.90 10.60 10.30 10.20 10.10 10.00 10.00
NOK/SEK 0.95 0.96 0.94 0.93 0.94 0.94 0.93 0.95
CAD/SEK 7.04 6.81 6.39 6.13 6.32 6.36 6.39 6.50
20212020
-30%
-20%
-10%
0%
10%
20%
30%
40%
50%
Jan-19 Jul-19 Jan-20
USD/SEK net est. positioning
70
80
90
100
110
120
130
140
150
89 91 93 95 97 99 01 03 05 07 09 11 13 15 17 19
CPI-based REER
RULC-based REER
NEER
Sweden TWI, long-run average=100Avg calculated post-SEK float (Nov 1992)

Currency Report Card
09 April 2020 9
Norwegian Krone Elsa Lignos 1-3 Month Outlook – Retracing from extremes
It is hard to overstate the extremity of NOK’s mid-March sell-off. Figure 1 shows a 45 year history of EUR/NOK and how unprecedented the spike was in both levels and size. USD/NOK was even more extreme – a 33% rally in the space of a few weeks; there are EM currencies in a full-blown crisis that look stable by comparison. It would be hard to point to any fundamental factor that could justify that size of move. NOK’s correlation to Brent has increased sharply alongside the collapse in crude (Figure 2), but it would be ludicrous to pin NOK’s move on crude alone. If proof is needed, one just has to look at the 18% 9-20 March sell-off in NOK/RUB. Norway and Russia are no match on fiscal stability or exposure to oil. Norway’s sovereign wealth fund gives it ample protection. Press reports suggest the government may need to withdraw funds, with revenues already weak on the back of weak oil prices. But the numbers floated (~$14bn) are a drop compared to the $1trn AUM of the fund. It seems like this was the final capitulation of long-term NOK bulls, exaggerated by thin l iquidity making NOK pretty much untradeable last month. April has seen a retracement and we have actually left our forecasts unchanged – with spot now back around the 11.30 target we had pencilled in for end-Q2 and 11.10 still our target for year-end. We still expect swings around that, though much smaller in magnitude than what we saw last month. Our estimates of positioning put NOK close to neutral – unsurprisingly investors seem to be giving it a wide berth. That should l imit the scope for the next sell -off, even if OPEC+ do not manage to agree a large enough production cut (as we go to press, there is talk of a 10mbpd cut from OPEC+ alone but still concerns that is not enough for falling demand, and oil prices are softer on the day). Technically, the broader trend in EUR/NOK is still upward despite the sharp pullback since mid-March. Moves to support at 10.9957 and 10.5366 may attract technical buying interest. Initial resistance is located at 11.3988.
6-12 Month Outlook – Only marginal gains
Norway is one of the few countries in G10 that so far has not delivered any real fiscal easing (see Total FX, 4 March). While it announced a reduction in VAT rates, the cuts mostly reverse in 2021 leaving its stance net neutral. Support will come from automatic stabilisers, but in relative terms we expect NOK will only see grinding gains at best.
Indicators
Current (Previous)* Official cash rate 0.25% (1.00%) Trend interest rates 10y average 3.6% Bias in interest rate market Flat
CPI (ex energy and taxes) %Y/Y Mar (Feb) 2.1% (2.1%) Inflation target % 2.5% Budget balance % GDP 2019 (2018) 8.8% (8.1%) Budget balance target % GDP Structural, non-oil deficit < 4% GDP Mainland Growth %y/y Q4 (Q3) 1.9% (2.9%)
Trend GDP %q/q 0.6% EUR Purchasing Power Parity Value Feb 9.0439 Spot end-Mar 11.4753 PPP Valuation EUR/NOK is overvalued
Current a/c balance % GDP Q2 (Q1) 4.0% (4.5%) Trend current account balance % GDP 9.0% Moody's Foreign Currency Rating Aaa Outlook Stable * Current is latest month, quarter or year
Source: RBC Capital Markets, Bloomberg
1. An unprecedented move in EUR/NOK
2. NOK particularly sensitive to moves in Brent
Source: RBC Capital Markets; Bloomberg
Forecasts
Source: RBC Capital Markets estimates
Q1 Q2f Q3f Q4f Q1f Q2f Q3f Q4f
USD/NOK 10.40 10.09 9.74 9.25 9.32 9.31 9.30 9.21
EUR/NOK 11.48 11.30 11.30 11.10 10.90 10.80 10.70 10.50
NOK/SEK 0.95 0.96 0.94 0.93 0.94 0.94 0.93 0.95
CAD/NOK 7.40 7.06 6.81 6.61 6.75 6.80 6.84 6.82
20212020
5
6
7
8
9
10
11
12
13
Jan-76 Jan-82 Jan-88 Jan-94 Jan-00 Jan-06 Jan-12 Jan-18
EUR/NOK
-0.8
-0.6
-0.4
-0.2
0.0
0.2
0.4
0.6
Apr-16 Oct-16 Apr-17 Oct-17 Apr-18 Oct-18 Apr-19 Oct-19 Apr-20
EURNOK-2y swapEURNOK-BrentBrent-2y NO
Rolling 3m correlation

Currency Report Card
09 April 2020 10
Canadian Dollar George Davis 1-3 Month Outlook – Negative growth shock
USD/CAD reached a 4-year high of 1.4668 in mid-March after the coronavirus was declared a global pandemic. CAD was blindsided by the growth shock from a sudden, abrupt shutdown of the Canadian economy via social distancing measures and a 60% plunge in WTI crude oil prices as fears of a global recession were amplified by the escalation of a price war between Saudi Arabia and Russia.
The response from the Bank of Canada and Canadian government has been swift and comprehensive in order to mitigate the growth shock to the economy. On the monetary side, the BoC has cut the overnight rate by 150bps to 0.25% and introduced a myriad of programs to ensure that financial markets function properly and that credit is available to both individuals and companies. This has culminated in the Bank undertaking a quantitative easing (QE) program for the first time. We see the BoC’s balance sheet on course to expand to more than 20% of GDP by the end of this year from just 5% of GDP in 2019. On the fiscal side, the government has followed suit with an economic response plan aimed at supporting Canadian individuals and businesses facing hardships as a direct result of COVID-19. Taken together, these measures total about CAD105billion and represent about 4.6% of GDP (Figure 1 and 2). If we add the CAD85bn in tax deferrals and CAD50bn in credit backing/guarantees announced to the fiscal programs, we see the deficit for the 2020/2021 fiscal year tracking at CAD170bn. Factoring in some additional industry-specific relief packages, the deficit could ultimately reach CAD200bn or 10% of GDP from the combination of these measures and automatic fiscal stabilizers.
Despite all of these proactive measures, the economy will not be able to avoid a recession due to the amplitude of the growth shock. We see negative growth in Q1 and Q2 2020, with the brunt of it in Q2 as the economy contracts around a whopping 30% and the unemployment rate spikes to above 20%. This should keep CAD on the defensive, with USD/CAD moving to 1.4300 in Q2 and the risk of an overshoot to 1.4500 possible as the shocks are absorbed.
6-12 Month Outlook – Relaxed social distancing
We are assuming that social distancing measures will be relaxed through the summer, allowing for a rebound to positive growth in H2 2020 and 2021 as interest rates remain close to the lower bound. While forecast confidence bands are wide and the timing of the distancing critical, this should allow for modest CAD appreciation.
Indicators
Current (Previous)* Official cash rate 0.25% (0.75%)
Trend interest rates 10y average 0.99% Bias in interest rate market Neutral Core CPI Inflation (Trim) %Y/Y Feb (Jan) 2.0% (2.1%) CPI inflation target range %Y/Y 1-3% Budget balance % GDP FY19 (FY18) -0.6% (-0.9%)
Budget balance target % GDP Declining over the business cycle GDP growth %Q/Q saar Q4 (Q3) 0.3% (1.1%) Trend GDP %Q/Q 2.20% Purchasing Power Parity value Feb 1.2447 Spot end-Mar 1.4062
PPP valuation USD/CAD is overvalued Current account balance % GDP Q4 (Q3) -2.0% (-2.3%) Trend current account balance % GDP -2.98% Moody’s foreign currency rating Aaa Outlook Stable * Current is latest month, quarter or year
Source: RBC Economics
1. Government measures taken to combat COVID-19
2. A strong fiscal response from the Canadian government
Source: RBC Capital Markets, national finance ministries
Forecasts
Source: RBC Capital Markets estimates
Q1 Q2f Q3f Q4f Q1f Q2f Q3f Q4f
USD/CAD 1.41 1.43 1.43 1.40 1.38 1.37 1.36 1.35
EUR/CAD 1.55 1.60 1.66 1.68 1.61 1.59 1.56 1.54
CAD/JPY 76.5 73.4 69.9 67.9 70.3 72.3 74.3 76.3
20212020
20
40
60
80
100
120
Fiscal Programs
Small Business Subsidy
CCB
Targeted Programs
PPE Procurement
GST Credit
CERB
Wage Subsidy
Fiscal stimulus programs, billions
0.0
1.0
2.0
3.0
4.0
5.0
6.0
7.0
8.0
9.0
10.0
US CA GB DE FR IT ES JP AU NZ SE NO CH
Spending
Tax
Automatic stabilisers*
Net effect of fiscal changes, cumulative 2020-21, % GDP
Currency Report Card
09 April 2020 11
Australian Dollar Adam Cole
1-3 Month Outlook – Still a risk proxy
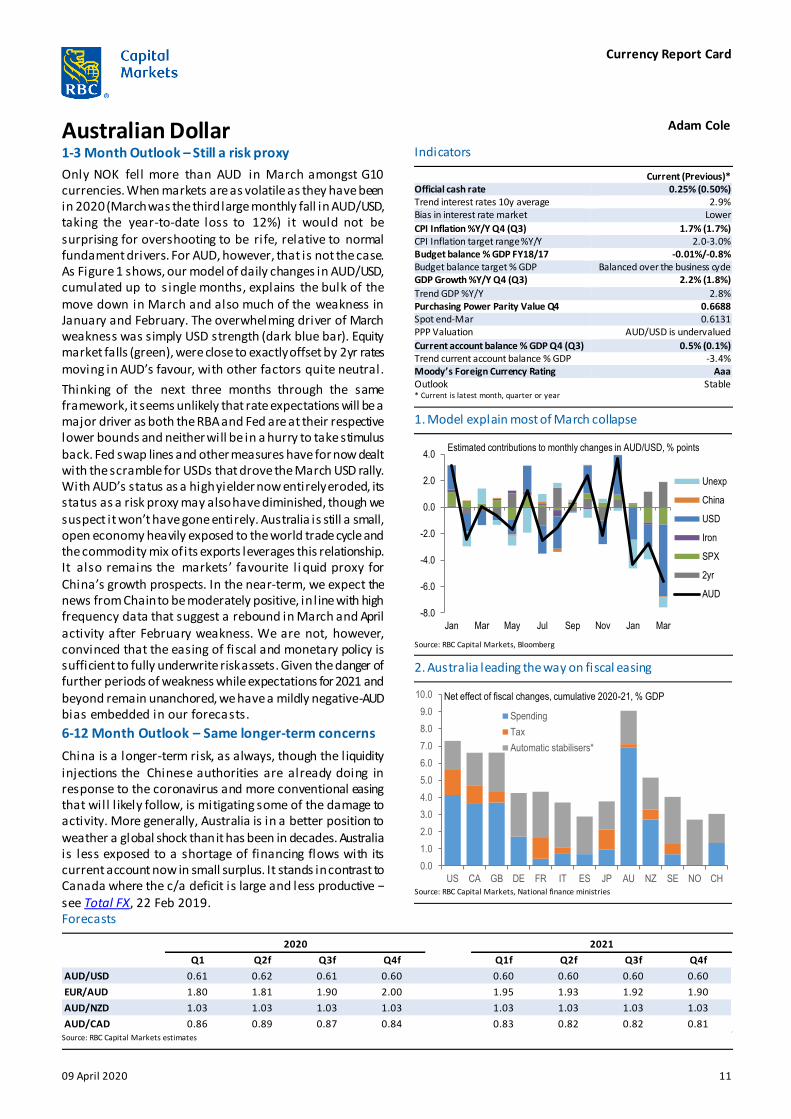
Only NOK fell more than AUD in March amongst G10 currencies. When markets are as volatile as they have been in 2020 (March was the third large monthly fall in AUD/USD, taking the year-to-date loss to 12%) it would not be surprising for overshooting to be rife, relative to normal fundament drivers. For AUD, however, that is not the case. As Figure 1 shows, our model of daily changes in AUD/USD, cumulated up to s ingle months, explains the bulk of the move down in March and also much of the weakness in January and February. The overwhelming driver of March weakness was simply USD strength (dark blue bar). Equity market falls (green), were close to exactly offset by 2yr rates moving in AUD’s favour, with other factors quite neutral.
Thinking of the next three months through the same framework, it seems unlikely that rate expectations will be a major driver as both the RBA and Fed are at their respective lower bounds and neither will be in a hurry to take stimulus back. Fed swap lines and other measures have for now dealt with the scramble for USDs that drove the March USD rally. With AUD’s status as a high yielder now entirely eroded, its status as a risk proxy may also have diminished, though we suspect it won’t have gone entirely. Australia is still a small, open economy heavily exposed to the world trade cycle and the commodity mix of its exports leverages this relationship. It also remains the markets’ favourite l i quid proxy for China’s growth prospects. In the near-term, we expect the news from Chain to be moderately positive, in l ine with high frequency data that suggest a rebound in March and April activity after February weakness. We are not, however, convinced that the easing of fiscal and monetary policy is sufficient to fully underwrite risk assets. Given the danger of further periods of weakness while expectations for 2021 and beyond remain unanchored, we have a mildly negative-AUD bias embedded in our forecasts.
6-12 Month Outlook – Same longer-term concerns
China is a longer-term risk, as always, though the liquidity injections the Chinese authorities are already doing in response to the coronavirus and more conventional easing that will l ikely follow, is mitigating some of the damage to activity. More generally, Australia is in a better position to weather a global shock than it has been in decades. Australia is less exposed to a shortage of financing flows with its current account now in small surplus. It stands in contrast to Canada where the c/a deficit is large and less productive – see Total FX, 22 Feb 2019.
Indicators
Current (Previous)* Official cash rate 0.25% (0.50%) Trend interest rates 10y average 2.9% Bias in interest rate market Lower
CPI Inflation %Y/Y Q4 (Q3) 1.7% (1.7%) CPI Inflation target range %Y/Y 2.0-3.0% Budget balance % GDP FY18/17 -0.01%/-0.8% Budget balance target % GDP Balanced over the business cycle GDP Growth %Y/Y Q4 (Q3) 2.2% (1.8%)
Trend GDP %Y/Y 2.8% Purchasing Power Parity Value Q4 0.6688 Spot end-Mar 0.6131 PPP Valuation AUD/USD is undervalued
Current account balance % GDP Q4 (Q3) 0.5% (0.1%) Trend current account balance % GDP -3.4% Moody’s Foreign Currency Rating Aaa Outlook Stable * Current is latest month, quarter or year
Source: RBC Capital Markets, Bloomberg
1. Model explain most of March collapse
2. Australia leading the way on fiscal easing
Source: RBC Capital Markets, National finance ministries
Forecasts
Source: RBC Capital Markets estimates
Q1 Q2f Q3f Q4f Q1f Q2f Q3f Q4f
AUD/USD 0.61 0.62 0.61 0.60 0.60 0.60 0.60 0.60
EUR/AUD 1.80 1.81 1.90 2.00 1.95 1.93 1.92 1.90
AUD/NZD 1.03 1.03 1.03 1.03 1.03 1.03 1.03 1.03
AUD/CAD 0.86 0.89 0.87 0.84 0.83 0.82 0.82 0.81
20212020
-8.0
-6.0
-4.0
-2.0
0.0
2.0
4.0
Jan Mar May Jul Sep Nov Jan Mar
Unexp
China
USD
Iron
SPX
2yr
AUD
Estimated contributions to monthly changes in AUD/USD, % points
0.0
1.0
2.0
3.0
4.0
5.0
6.0
7.0
8.0
9.0
10.0
US CA GB DE FR IT ES JP AU NZ SE NO CH
Spending
Tax
Automatic stabilisers*
Net effect of fiscal changes, cumulative 2020-21, % GDP

Currency Report Card
09 April 2020 12
New Zealand Dollar Adam Cole
1-3 Month Outlook – A similar story to AUD
Although there was plenty to focus on in terms of domestic policy, NZD/USD traded largely with general risk appetite and USD direction in March, falling almost 5% against USD and only slightly outperforming AUD. Since March 25, NZ is in a similar state of lockdown to the US and UK and like most other economies, we have little in the way of hard activity data to assess what the impact of this has been. ANZ consumer confidence fell to a 10 year low in March, but so far, remains above the lows in the GFC, unlike business confidence which fell to a multi-decade low. It will be many months before we have “hard” activity data that reflect the shock of the lockdown. The NZ government’s package of wage subsidies and corporate tax reductions amount to around 3.5% of GDP – broadly in l ine with the average of other DMs, but less aggressive than Australia .
RBNZ cut the OCR from 1.0% to 0.25% on March 15, in one swipe removing NZD’s status as a high yielder within G10. A week later, it opened a NZD30bn (maximum) QE programme, buying NZD750mn a week of government bonds. OIS imply a small risk of RBNZ cutting rates to zero and bond yields are sub-1% out to almost 10 years. With expectations as tightly anchored as they are and NZD now having almost no yield premium to other G10 currencies, in a similar way to AUD, this raises the question of what will drive NZD direction going forward? Although it is as yet untested, we suspect NZD will remain a proxy for global risk appetite, though less so than AUD. NZ is an open economy exposed to global growth, it is also an external debtor and stil l runs a current account deficit. NZD is less liquid than all other G10 currencies except NOK. With global risk appetite stil l vulnerable to setbacks until a longer-term solution to COVID-19 is found, our forecasts have a moderately negative-NZD bias.
6-12 Month Outlook – Moderate weakness
NZ is very exposed on the services (tourism) front but less exposed to the goods fall-out as its export mix is generally low beta to global growth. It has the lowest participation in global value chains than any other OECD country. NZ also has further room on the fiscal side to react to a deeper turndown, having run small budget surpluses in recent years. The weakness in March pushed NZ’s REER below its long-term average for the first time in a decade (Figure 1).
Indicators
Current (Previous)* Official cash rate 0.25% (1.00%)
Trend interest rates 10yr average 5.40% Bias in interest rate market Falling
CPI Inflation %Y/Y Q4 (Q3) 1.8% (1.5%) Inflation target 1.0-3.0%
Budget balance % GDP FY18/FY17 1.1%/0.9% Budget balance target % GDP Balanced over business cycle
GDP Growth %Y/Y Q4 (Q3) 1.8% (2.3%) Trend GDP %Y/Y 3.1%
Purchasing Power Parity Value Q4 0.6636 NZD/USD end-Mar 0.5957
Valuation NZD/USD is undervalued Current account balance % GDP Q4 (Q3) -3.3% (-3.5%)
Trend current account balance % GDP -3.1% Moody's Foreign Currency Rating Aaa
Outlook Stable * Current is latest month, quarter or year
Source: RBC Capital Markets, Bloomberg, BIS
1. NZD undervalued for first time in 10 years
2. Domestic inflation still elevated
Source: RBC Capital Markets; Bloomberg
Forecasts
Source: RBC Capital Markets estimates
Q1 Q2f Q3f Q4f Q1f Q2f Q3f Q4f
NZD/USD 0.60 0.60 0.59 0.58 0.58 0.58 0.58 0.58
EUR/NZD 1.85 1.87 1.97 2.07 2.02 2.00 1.98 1.97
AUD/NZD 1.03 1.03 1.03 1.03 1.03 1.03 1.03 1.03
NZD/CAD 0.84 0.86 0.84 0.81 0.80 0.79 0.79 0.78
20212020
-30
-20
-10
0
10
20
30
94 96 98 00 02 04 06 08 10 12 14 16 18 20
NZD BIS real effective exchange rate deviation from LR average, %
-3
-2
-1
0
1
2
3
4
5
6
7
01 02 03 04 05 06 07 08 09 10 11 12 13 14 15 16 17 18 19
Non-tradables
Tradables
NZ CPI, y/y
Currency Report Card
09 April 2020 13
Turkish Lira Daria Parkhomenko 1-3 Month Outlook – Turning even more bearish TRY
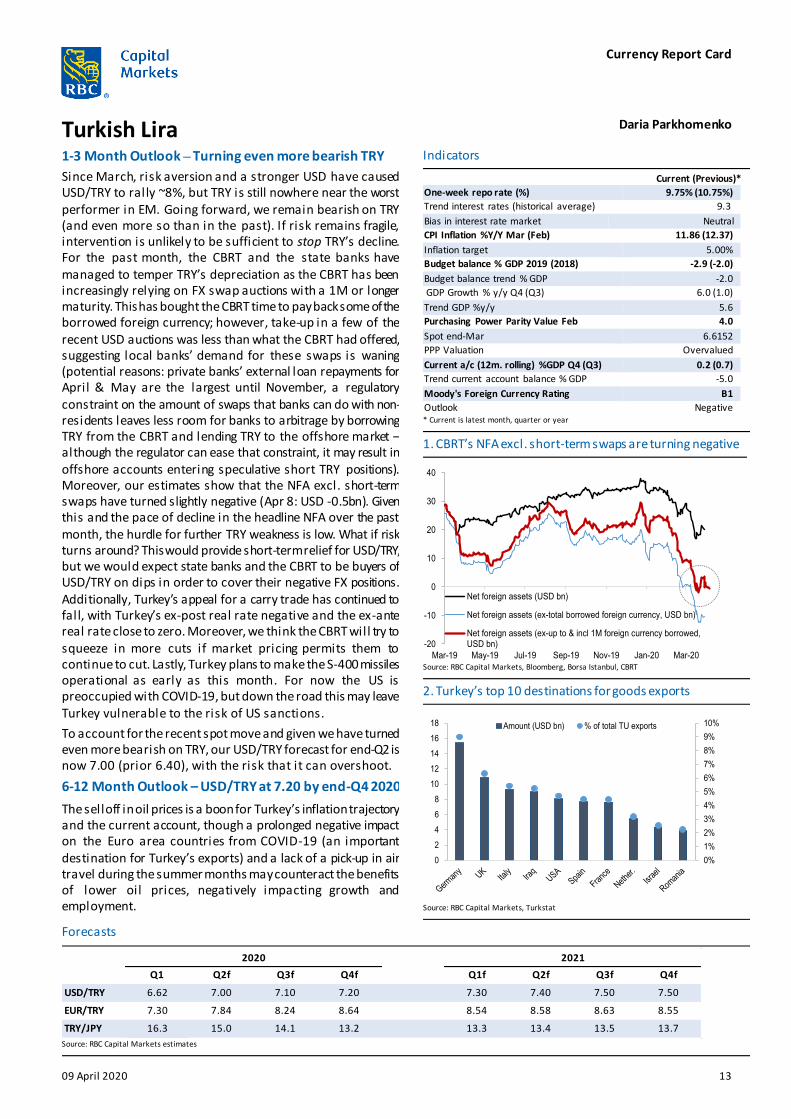
Since March, risk aversion and a stronger USD have caused USD/TRY to rally ~8%, but TRY is still nowhere near the worst performer in EM. Going forward, we remain bearish on TRY (and even more so than in the past). If risk remains fragile, intervention is unlikely to be sufficient to stop TRY’s decline. For the past month, the CBRT and the state banks have managed to temper TRY’s depreciation as the CBRT has been increasingly relying on FX swap auctions with a 1M or longer maturity. This has bought the CBRT time to pay back some of the borrowed foreign currency; however, take-up in a few of the recent USD auctions was less than what the CBRT had offered, suggesting local banks’ demand for these swaps is waning (potential reasons: private banks’ external loan repayments for April & May are the largest until November, a regulatory constraint on the amount of swaps that banks can do with non-residents leaves less room for banks to arbitrage by borrowing TRY from the CBRT and lending TRY to the offshore market – although the regulator can ease that constraint, it may result in offshore accounts entering speculative short TRY positions). Moreover, our estimates show that the NFA excl. short-term swaps have turned slightly negative (Apr 8: USD -0.5bn). Given this and the pace of decline in the headline NFA over the past month, the hurdle for further TRY weakness is low. What if risk turns around? This would provide short-term relief for USD/TRY, but we would expect state banks and the CBRT to be buyers of USD/TRY on dips in order to cover their negative FX positions. Additionally, Turkey’s appeal for a carry trade has continued to fall, with Turkey’s ex-post real rate negative and the ex-ante real rate close to zero. Moreover, we think the CBRT will try to squeeze in more cuts if market pricing permits them to continue to cut. Lastly, Turkey plans to make the S-400 missiles operational as early as this month. For now the US is preoccupied with COVID-19, but down the road this may leave Turkey vulnerable to the risk of US sanctions.
To account for the recent spot move and given we have turned even more bearish on TRY, our USD/TRY forecast for end-Q2 is now 7.00 (prior 6.40), with the risk that it can overshoot.
6-12 Month Outlook – USD/TRY at 7.20 by end-Q4 2020
The selloff in oil prices is a boon for Turkey’s inflation trajectory and the current account, though a prolonged negative impact on the Euro area countries from COVID-19 (an important destination for Turkey’s exports) and a lack of a pick-up in air travel during the summer months may counteract the benefits of lower oil prices, negatively impacting growth and employment.
Indicators
Current (Previous)*
One-week repo rate (%) 9.75% (10.75%)
Trend interest rates (historical average) 9.3
Bias in interest rate market Neutral
CPI Inflation %Y/Y Mar (Feb) 11.86 (12.37)
Inflation target 5.00%
Budget balance % GDP 2019 (2018) -2.9 (-2.0)
Budget balance trend % GDP -2.0
GDP Growth % y/y Q4 (Q3) 6.0 (1.0)
Trend GDP %y/y 5.6
Purchasing Power Parity Value Feb 4.0
Spot end-Mar 6.6152
PPP Valuation Overvalued
Current a/c (12m. rolling) %GDP Q4 (Q3) 0.2 (0.7)
Trend current account balance % GDP -5.0
Moody's Foreign Currency Rating B1
Outlook Negative * Current is latest month, quarter or year
Source: RBC Capital Markets, Bloomberg, Borsa Istanbul, CBRT
1. CBRT’s NFA excl. short-term swaps are turning negative
2. Turkey’s top 10 destinations for goods exports
Source: RBC Capital Markets, Turkstat
Forecasts
Source: RBC Capital Markets estimates
Q1 Q2f Q3f Q4f Q1f Q2f Q3f Q4f
USD/TRY 6.62 7.00 7.10 7.20 7.30 7.40 7.50 7.50
EUR/TRY 7.30 7.84 8.24 8.64 8.54 8.58 8.63 8.55
TRY/JPY 16.3 15.0 14.1 13.2 13.3 13.4 13.5 13.7
2020 2021
-20
-10
0
10
20
30
40
Mar-19 May-19 Jul-19 Sep-19 Nov-19 Jan-20 Mar-20
Net foreign assets (USD bn)
Net foreign assets (ex-total borrowed foreign currency, USD bn)
Net foreign assets (ex-up to & incl 1M foreign currency borrowed,USD bn)
0%
1%
2%
3%
4%
5%
6%
7%
8%
9%
10%
0
2
4
6
8
10
12
14
16
18 Amount (USD bn) % of total TU exports
Currency Report Card
09 April 2020 14
South African Rand Daria Parkhomenko 1-3 Month Outlook – Risk sentiment, WGBI exclusion
Since March, ZAR is one of the worst performers globally due to the fragile risk backdrop and to a lesser extent, Moody’s downgrading South Africa to junk (with a negative outlook).
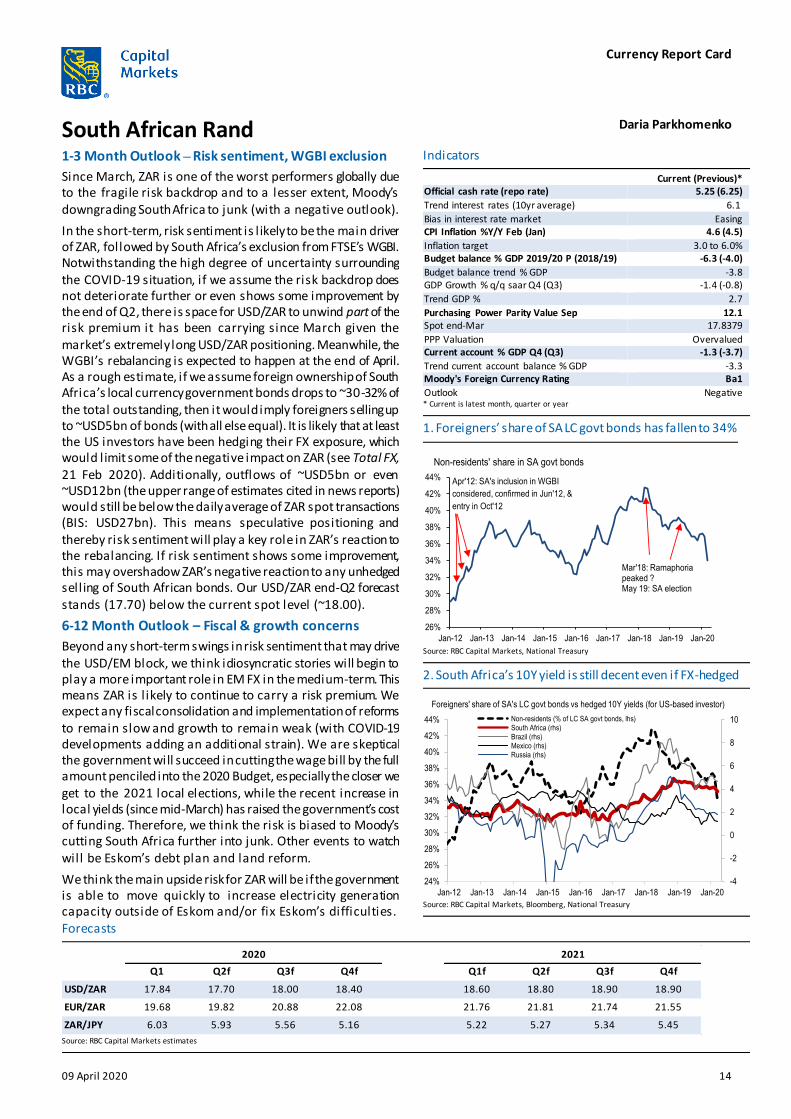
In the short-term, risk sentiment is l ikely to be the main driver of ZAR, followed by South Africa’s exclusion from FTSE’s WGBI. Notwithstanding the high degree of uncertainty surrounding the COVID-19 situation, if we assume the risk backdrop does not deteriorate further or even shows some improvement by the end of Q2, there is space for USD/ZAR to unwind part of the risk premium it has been carrying since March given the market’s extremely long USD/ZAR positioning. Meanwhile, the WGBI’s rebalancing is expected to happen at the end of April. As a rough estimate, if we assume foreign ownership of South Africa’s local currency government bonds drops to ~30-32% of the total outstanding, then it would imply foreigners selling up to ~USD5bn of bonds (with all else equal). It is likely that at least the US investors have been hedging their FX exposure, which would limit some of the negative impact on ZAR (see Total FX, 21 Feb 2020). Additionally, outflows of ~USD5bn or even ~USD12bn (the upper range of estimates cited in news reports) would still be below the daily average of ZAR spot transactions (BIS: USD27bn). This means speculative positioning and thereby risk sentiment will play a key role in ZAR’s reaction to the rebalancing. If risk sentiment shows some improvement, this may overshadow ZAR’s negative reaction to any unhedged selling of South African bonds. Our USD/ZAR end-Q2 forecast stands (17.70) below the current spot level (~18.00).
6-12 Month Outlook – Fiscal & growth concerns
Beyond any short-term swings in risk sentiment that may drive the USD/EM block, we think idiosyncratic stories will begin to play a more important role in EM FX in the medium-term. This means ZAR is l ikely to continue to carry a risk premium. We expect any fiscal consolidation and implementation of reforms to remain slow and growth to remain weak (with COVID-19 developments adding an additional strain). We are skeptical the government will succeed in cutting the wage bill by the full amount penciled into the 2020 Budget, especially the closer we get to the 2021 local elections, while the recent increase in local yields (since mid-March) has raised the government’s cost of funding. Therefore, we think the risk is biased to Moody’s cutting South Africa further into junk. Other events to watch will be Eskom’s debt plan and land reform.
We think the main upside risk for ZAR will be if the government is able to move quickly to increase electricity generation capacity outside of Eskom and/or fix Eskom’s difficulties.
Indicators
Current (Previous)* Official cash rate (repo rate) 5.25 (6.25)
Trend interest rates (10yr average) 6.1
Bias in interest rate market Easing CPI Inflation %Y/Y Feb (Jan) 4.6 (4.5)
Inflation target 3.0 to 6.0% Budget balance % GDP 2019/20 P (2018/19) -6.3 (-4.0)
Budget balance trend % GDP -3.8 GDP Growth % q/q saar Q4 (Q3) -1.4 (-0.8)
Trend GDP % 2.7
Purchasing Power Parity Value Sep 12.1 Spot end-Mar 17.8379
PPP Valuation Overvalued Current account % GDP Q4 (Q3) -1.3 (-3.7)
Trend current account balance % GDP -3.3 Moody's Foreign Currency Rating Ba1
Outlook Negative * Current is latest month, quarter or year
Source: RBC Capital Markets, National Treasury
1. Foreigners’ share of SA LC govt bonds has fallen to 34%
2. South Africa’s 10Y yield is still decent even if FX-hedged
Source: RBC Capital Markets, Bloomberg, National Treasury
Forecasts
Source: RBC Capital Markets estimates
Q1 Q2f Q3f Q4f Q1f Q2f Q3f Q4f
USD/ZAR 17.84 17.70 18.00 18.40 18.60 18.80 18.90 18.90
EUR/ZAR 19.68 19.82 20.88 22.08 21.76 21.81 21.74 21.55
ZAR/JPY 6.03 5.93 5.56 5.16 5.22 5.27 5.34 5.45
2020 2021
26%
28%
30%
32%
34%
36%
38%
40%
42%
44%
Jan-12 Jan-13 Jan-14 Jan-15 Jan-16 Jan-17 Jan-18 Jan-19 Jan-20
Non-residents' share in SA govt bonds
Apr'12: SA's inclusion in WGBI
considered, confirmed in Jun'12, &
entry in Oct'12
Mar'18: Ramaphoria peaked ?May 19: SA election
-4
-2
0
2
4
6
8
10
24%
26%
28%
30%
32%
34%
36%
38%
40%
42%
44%
Jan-12 Jan-13 Jan-14 Jan-15 Jan-16 Jan-17 Jan-18 Jan-19 Jan-20
Non-residents (% of LC SA govt bonds, lhs)
South Africa (rhs)
Brazil (rhs)
Mexico (rhs)
Russia (rhs)
Foreigners' share of SA's LC govt bonds vs hedged 10Y yields (for US-based investor)

Currency Report Card
09 April 2020 15
Forecasts Spot forecasts
Source: RBC Capital Markets estimates
EUR Crosses
Source: RBC Capital Markets estimates
Q1 Q2f Q3f Q4f Q1f Q2f Q3f Q4f
EUR/USD 1.10 1.12 1.16 1.20 1.17 1.16 1.15 1.14
USD/JPY 108 105 100 95 97 99 101 103
GBP/USD 1.24 1.24 1.26 1.28 1.23 1.21 1.20 1.19
USD/CHF 0.96 0.94 0.90 0.87 0.90 0.91 0.93 0.95
USD/SEK 9.91 9.73 9.14 8.58 8.72 8.71 8.70 8.77
USD/NOK 10.40 10.09 9.74 9.25 9.32 9.31 9.30 9.21
USD/CAD 1.41 1.43 1.43 1.40 1.38 1.37 1.36 1.35
AUD/USD 0.61 0.62 0.61 0.60 0.60 0.60 0.60 0.60
NZD/USD 0.60 0.60 0.59 0.58 0.58 0.58 0.58 0.58
USD/TRY 6.62 7.00 7.10 7.20 7.30 7.40 7.50 7.50
USD/ZAR 17.84 17.70 18.00 18.40 18.60 18.80 18.90 18.90
2020 2021
Q1 Q2f Q3f Q4f Q1f Q2f Q3f Q4f
EUR/USD 1.10 1.12 1.16 1.20 1.17 1.16 1.15 1.14
EUR/JPY 119 118 116 114 113 115 116 117
EUR/GBP 0.89 0.90 0.92 0.94 0.95 0.96 0.96 0.96
EUR/CHF 1.06 1.05 1.04 1.04 1.05 1.06 1.07 1.08
EUR/SEK 10.93 10.90 10.60 10.30 10.20 10.10 10.00 10.00
EUR/NOK 11.48 11.30 11.30 11.10 10.90 10.80 10.70 10.50
EUR/CAD 1.55 1.60 1.66 1.68 1.61 1.59 1.56 1.54
EUR/AUD 1.80 1.81 1.90 2.00 1.95 1.93 1.92 1.90
EUR/NZD 1.85 1.87 1.97 2.07 2.02 2.00 1.98 1.97
EUR/TRY 7.30 7.84 8.24 8.64 8.54 8.58 8.63 8.55
EUR/ZAR 19.68 19.82 20.88 22.08 21.76 21.81 21.74 21.55
2020 2021

Currency Report Card
09 April 2020 16
Disclaimer IMPORTANT DISCLOSURE: THIS COMMUNICATION HAS BEEN GENERATED BY AN EMPLOYEE OF RBCCM AND IS BEING CONVEYED TO YOU AS A SOLICITATION (FOR PURPOSES OF 17 CFR §§1.71(a)-(c) AND 23.605) FOR ENTERING INTO A DERIVATIVES TRANSACTION.
This communication has been prepared by RBC Capital Markets (“RBCCM”) sales personnel for institutional clients and your information only and is not a research report prepared by the RBCCM Research Department. Unless otherwise specified, the views expressed herein are the author’s and may differ from the views of RBCCM’s Research Department and from the views of others within RBCCM. The information in the body of this communication is intended to provide general company and/or market commentary, is not intended to provide a sufficient basis for an investment decision and should not be considered a research report. This material may include references to recently published research notes and reports by RBCCM’s Research Department. Complete
research notes and reports, including important conflicts disclosures, are available at www.rbcinsight.com. You should assume that trading desks at RBCCM or its affiliates makes markets and/or hold positions, and may have conducted underwriting or other investment banking work in any of the securities referenced herein. Information contained herein has been compiled by RBCCM from sources believed to be reliable, but no representation or warranty, express or implied, is made as to its accuracy, completeness or correctness. Every province in Canada, state in the U.S., and most countries throughout the world have their own laws regulating the types of securities and other investment products which may be offered to their residents, as well as the process
for doing so. As a result, the securities discussed in this communication may not be eligible for sale in some jurisdictions. To the full extent permitted by law neither RBCCM nor any of its affiliates or any other person accepts any liability whatsoever for any direct, or indirect or consequential loss or damage arising from any use of the information contained herein. No matter contained in this communication may be reproduced or copied by any means without the prior consent of RBCCM.
RBC Capital Markets is the global brand name for the capital markets business of Royal Bank of Canada and its affiliates. United States: This communication has been approved by RBC Capital Markets, LLC (member FINRA, NYSE, SIPC), which is a U.S. registered broker-dealer and which accepts responsibility for this communication and its dissemination in the United States. Any U.S. recipient of this communication that is not a registered broker-dealer or a bank acting in a broker or dealer capacity and that wishes further information regarding, or to effect any transaction in, any of the securities discussed in this communication, should contact and place orders with RBC Capital Markets, LLC. This communication is not a research report or a product of RBCCM's
Research Department. Canada: RBC Dominion Securities Inc. (member IIROC and CIPF). United Kingdom: This publication has been approved by RBC Europe Limited, which is authorised by the Prudential Regulation Authority (“PRA”) and regulated by the Financial Conduct Authority and PRA. Hong Kong: Royal Bank of Canada, Hong Kong (regulated by HKMA and SFC. Financial Services provided to Australia: Financial services may be provided in Australia in accordance with applicable law. Financial services provided by the Royal Bank of Canada, Hong Kong Branch are provided pursuant to the Royal Bank of Canada's Australian Financial Services Licence (“AFSL”) (No. 246521). Australia: Royal Bank of Canada, Sydney Branch (regulated by the Australian Securities
& Investments Commission and the Australian Prudential Regulation Authority; AFSL 246521; ABN 86 076 940 880). This document is distributed only to persons who satisfy the definition of wholesale client for the purposes of the Corporations Act 2001 and not intended for distribution to retail clients. Japan: Securities business (as defined under the Financial Instruments and Exchange Law) in Japan will be carried out by RBC Capital Markets (Japan) Ltd. in compliance with all applicable laws and regulations. RBC Capital Markets (Japan) Ltd. is a Financial Instrument Dealer registered with the Kanto Financial
Bureau (Kinsho #203) and a member of Japan Securities Dealers Association (“JSDA”) and the Financial Futures Association of Japan (“FFAJ”). Banking business (as defined under the Banking Law) in Japan will be carried out by Royal Bank of Canada, Tokyo Branch in compliance with applicable laws and regulations. Singapore: Royal Bank of Canada, Singapore Branch (regulated by the Monetary Authority of Singapore). The document is distributed only to persons who satisfy the definition of institutional investors as defined in the Securities and Futures Act (Chapter 289 of Singapore).
For non-institutional investors in the U.S., Canada, nothing in this report constitutes legal, accounting or tax advice or individually tailored investment advice. This material is prepared for general circulation to clients and has been prepared without regard to the individual financial circumstances and objectives of persons who receive it. Past performance is not a guide to future performance, future returns are not guaranteed, and a loss of original capital may occur. Interest rates, market conditions, special offers, tax ruling and other investment factors are subject to change. You are advised to seek independent advice from your financial adviser before purchasing any product or if you are in doubt about any of the contents of this document. If you do not obtain independent
advice, you should consider whether the product is suitable for you. To persons receiving this from RBC Wealth Management Asia: This document has been prepared by RBC Capital Markets. It is made available to you by Royal Bank of Canada, Singapore Branch in Singapore, Royal Bank of Canada, Hong Kong Branch in Hong Kong and/or RBC Investment Services (Asia) Limited in Hong Kong (“RBC Wealth Management Asia”). This is not a research report and commentary contained herein should not be considered to be research.
This material is not for distribution in Singapore to investors who are not “accredited investors”, as defined in the Securities and Futures Act (Cap. 289) of Singapore and in Hong Kong, to investors who are not “professional investors”, as defined in the Securities and Futures Ordinance (Cap. 571 of Hong Kong) and any rules made under that Ordinance. This material has been prepared for general circulation and does not take into account the objectives, financial situation, or needs of any recipient. The information and opinions contained in this document has been obtained from sources believed to be reliable and neither RBC Wealth Management Asia nor its related companies or affiliates (collectively, “RBC”) make any representation or warranty as to its adequacy,
completeness, accuracy or timeliness for any particular purpose. You are advised to seek independent advice from a financial adviser before purchasing any product. Any past performance, projection, forecast or simulation of results is not necessarily indicative of the future or l ikely performance of any investment. RBC accepts no liability whatsoever for any direct, indirect or consequential losses or damages arising from or in connection with the use or reliance of this material or its contents. The information herein is not intended for distribution to, or use by, any person or entity in any jurisdiction or country where such distribution or use would be contrary to law or regulation. If you are in doubt about any of the contents of this document, you should
obtain independent professional advice.
This content relies on tracking technologies to monitor, understand and improve our electronic communication and your online experience, to customize marketing, and to track your usage of RBC content, websites and services. Tracking technology may identify when you visit specific RBC content and may be shared with third parties involved in customizing RBC marketing on RBC or digital channels. RBC does not sell your information to third parties, nor do we
track your interaction with a third party website. For more information, see our privacy policy at http://www.rbc.com/privacysecurity/ca/index.html.
® Registered trademark of Royal Bank of Canada. Used under license. © 2020. All rights reserved.