12 karel debrabandere_evaluation_of_satellite_irradiation_data__at_200_sites
23
©3E | | www.3E.eu EVALUATION OF SATELLITE IRRADIATION DATA AT 200 SITES IN WESTERN EUROPE 22 October 2015 Karel De Brabandere | [email protected]
-
Upload
sandia-national-laboratories-energy-climate-renewables -
Category
Presentations & Public Speaking
-
view
349 -
download
0
Transcript of 12 karel debrabandere_evaluation_of_satellite_irradiation_data__at_200_sites

©3E | | www.3E.eu
EVALUATION OF SATELLITE
IRRADIATION DATA AT 200 SITES IN
WESTERN EUROPE
22 October 2015 Karel De Brabandere | [email protected]

3E in a nutshell
2
• Founded in 1999
• 120 experts, 18
nationalities
• Projects in over 30
countries, 5
continents
• Offices in (a.o.)
• Brussels
• Toulouse
• Cape Town
• London

Need for accurate irradiation data
3
Long term yield assessment
Long term average
Yearly variation
Performance evaluation
Yearly reference yield
Monthly reference yield
Fault detection
Daily reference yield
Hourly reference yield

Need for accurate irradiation data
4
On-site Irradiance sensors can have excellent accuracy
But in reality:
• Sensor type
• Dome / Flat
• Si / Thermopile
• Soiling
• Shading
• Orientation
• Degradation
• Availability
• … Regular validation of sensors is a necessity!

Satellite irradiation data
5
Meteosat-8/9/10 (MSG) satellite imagery
• SEVIRI instrument
• Coverage: Europe, Africa
• Temporal resolution: 15 min
• Nadir spatial resolution: 3 x 3 km²
• Start: January 2004

Satellite irradiation data
6
Services evaluated
• macc-rad (SoDa)
• HelioClim-3 v3, v4, v5 (SoDa)
• cpp (KNMI)
• gsip (NOAA)
‘Empirical’ models
• Image Cloud mask Irradiance
• macc-rad and HelioClim-3
‘Physical’ models
• Image Cloud properties Irradiance
• cpp and gsip
Are the (rather new) physical models better than the empirical models?

Satellite irradiation data
7
Data evaluated
• Global horizontal irradiation
• Hourly / Daily / Monthly aggregated
• 2011 - 2015

Evaluation at 203 sites in Western Europe
8
Pyranometer data from national meteo stations
France: 160 MétéoFrance stations
Belgium: 12 RMI (KMI / IRM) stations
• Daily aggregated global horizontal irradiation
• 2012 - 2013
Netherlands: 31 KNMI stations
• Hourly global horizontal irradiation
• 2011 - 2015

Evaluation metrics
9
• Root Mean Square Error
(RMSE)
• Standard Deviation of Error
(SDE)
• Bias
RMSE [%]
𝑅𝑀𝑆𝐸2 = 𝑆𝐷𝐸2 + 𝐵𝑖𝑎𝑠2
Daily data
Monthly data
Individual site 𝐸 𝑥 = 𝑥2
𝑁

Evaluation: 2012
10
Macc-rad: high bias
Hc3: improvement
with every version
Cpp: Best in class

Evaluation: 2013
11
Macc-rad: high bias
Hc3: improvement
with every version
Cpp: Best in class
Very similar results for
2013

Evaluation: Netherlands 2011
12
Why focus on
Netherlands?
• Consistent high
quality of meteo
• Almost no horizon
shading
• Almost no snow
• Hourly
• Long history up till
yesterday
• Free & verifiable
Hourly Data

Evaluation: Netherlands 2012
13
Why focus on
Netherlands?
• Consistent high
quality
• No horizon
shading
• Almost no snow
• Hourly
• Long history
• Free & verifiable

Evaluation: Netherlands 2013
14
Why focus on
Netherlands?
• Consistent high
quality
• No horizon
shading
• Almost no snow
• Hourly
• Long history
• Free & verifiable

Evaluation: Netherlands 2014
15
Why focus on
Netherlands?
• Consistent high
quality
• No horizon
shading
• Almost no snow
• Hourly
• Long history
• Free & verifiable

Evaluation: Netherlands 2014 April – 2015 Feb
16
NOAA gsip
• Data from March
2014 onwards
Evaluation on 11
months!
Hourly, daily:
rather poor accuracy
Monthly:
good accuracy
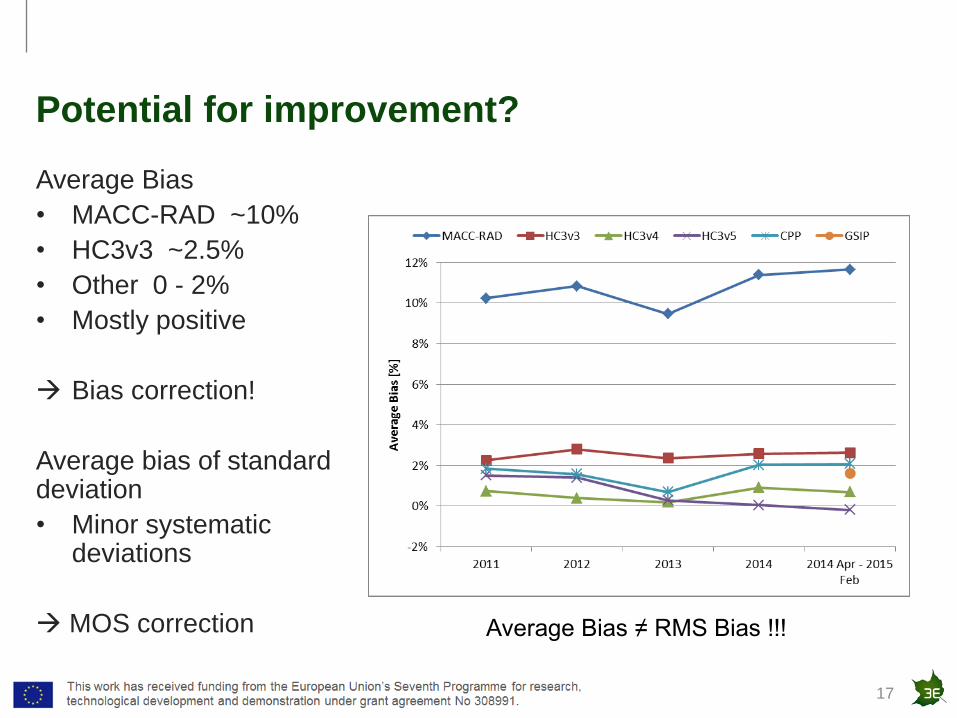
Potential for improvement?
17
Average Bias
• MACC-RAD ~10%
• HC3v3 ~2.5%
• Other 0 - 2%
• Mostly positive
Bias correction!
Average bias of standard deviation
• Minor systematic deviations
MOS correction Average Bias ≠ RMS Bias !!!

Potential for improvement?
18
Daily Bias pattern
(Bias grouped by
‘hour of day’)
• Systematic
patterns for all
databases
• Huge impact on
Plane-of-Array
irradiation!
More advanced
MOS correction

Potential for improvement?
19
Basic MOS correction
of:
• Bias
• Bias of SD
𝑌 = 𝑏 ∙ 𝑋𝑝
Only 2 parameters
• Factor 𝑏
• Exponent 𝑝

Potential for improvement?
20
Macc-rad:
• Huge reduction of
Bias
• Smaller reductions
in SDE
Small, but significant
improvements for
HC3v3 and cpp
• monthly RMSE
cpp: 4% 3%
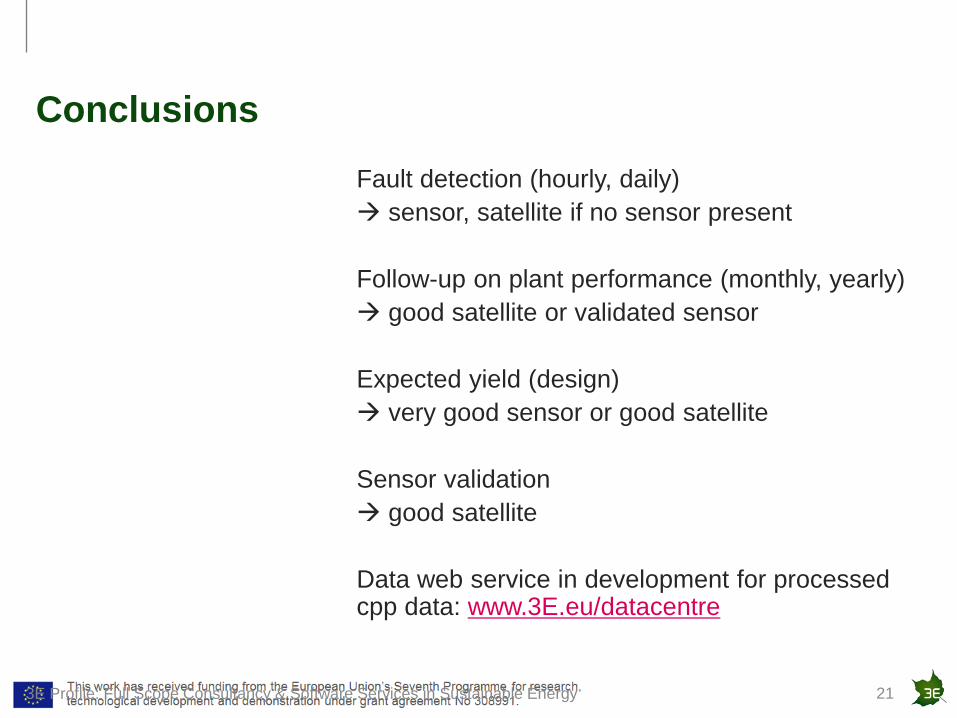
Conclusions
3E Profile: Full Scope Consultancy & Software Services in Sustainable Energy 21
Fault detection (hourly, daily)
sensor, satellite if no sensor present
Follow-up on plant performance (monthly, yearly)
good satellite or validated sensor
Expected yield (design)
very good sensor or good satellite
Sensor validation
good satellite
Data web service in development for processed cpp data: www.3E.eu/datacentre

Acknowledgements
22
SoDa macc-rad, HelioClim3: http://www.soda-pro.com/
KNMI msg-cpp: http://msgcpp.knmi.nl/
NOAA gsip: http://www.class.ncdc.noaa.gov/
KNMI hourly data: http://knmi.nl/nederland-nu/klimatologie/uurgegevens
RMI: http://www.meteo.be/
Météo-France: http://www.meteofrance.com/
3E provides:
• cpp data for performance analysis
• Sensor validation
• Data web service at www.3E.eu/datacentre (soon)
www.3E.eu

Thank you
23
Brussels
Toulouse
Gent
Louvain-La-Neuve
Beijing
Istanbul
Cape Town
London
Milano
www.3E.eu