112Gbps Serial Transmission over Copper - Xilinx · PDF file112Gbps Serial Transmission over...
25
DesignCon 2017 112Gbps Serial Transmission over Copper – PAM4 vs PAM8 Signaling Min Wu, Xilinx Inc. [email protected] Kelvin Qiu [email protected] Geoff Zhang, Xilinx Inc. [email protected]
Transcript of 112Gbps Serial Transmission over Copper - Xilinx · PDF file112Gbps Serial Transmission over...

DesignCon 2017
112Gbps Serial Transmission over Copper
– PAM4 vs PAM8 Signaling
Min Wu, Xilinx Inc.
Kelvin Qiu
Geoff Zhang, Xilinx Inc.

Abstract
112Gbps over backplane or copper cable transmission is imminent. This paper presents feasibility studies between two signal modulation schemes, PAM4 and PAM8, over channels based on the latest achievable PCB and connector designs. NRZ signaling is excluded in this study because the loss would be too much for it to deliver acceptable performance, even with FEC.
The loss at Nyquist frequency for PAM8 is generally less than that for PAM4, which indicates PAM8 requires less bandwidth. However, PAM8 requires more SNR to achieve the same SER/BER than PAM4. Thus, it is not obvious which modulation is more suitable for the 100G speed node without detailed analysis. This paper only represents preliminary study conclusions.
The paper starts with Salz SNR analysis to obtain system operating margin for each modulation scheme with three selected link channels. Then practical equalizer implementations are explored for the SNR margin for a given SER. The conclusion shall provide insight to both system and signal integrity engineers as well as silicon vendors into the choice of a signal modulation scheme that is more suitable and feasible for the 100G applications.
Authors Biography
Min Wu is currently a SerDes System Architect at Xilinx. He has over 20 years of industrial experience in the development and implementation of single-carrier modulation and multi-carrier modulation modems/demodulators/PHYs, which include but not limited to V.34/V.90/ADSL/VDSL modems, DVB-T/ATSC demodulator, and 10G Base-T/40G/56G transceivers. Prior to joining Xilinx, he was a Principal Systems Engineer at Applied Micro. Before Applied Micro, he held various engineering positions with Cresta Technology, Genesis, STMicroelectronics, Creative Labs, etc. He holds Master degree from Tennessee Tech and Bachelor degree from Fudan University, both in Electrical Engineering.
Kelvin (Zhiqiang) Qiu is a senior technical member of the Cisco Switching Product group. He has worked on signal integrity design for ASIC, package and PCB board for the past 15+ years. His experience includes high speed serial links signaling design, backplane and optical module interconnect optimization and measurement. His research interests include signal integrity, power integrity and computation electromagnetics. He holds a BS and MS in Physics from Nanjing University from China and MSEE from Clemson University, SC.
Geoff Zhang received his Ph.D. in 1997 in microwave engineering and signal processing from Iowa State University, Ames, Iowa. He joined Xilinx Inc. in June, 2013. Geoff is currently a Distinguished Engineer and Supervisor, in transceiver architecture and modeling under SerDes Technology Group. Prior to joining Xilinx he has employment experiences with HiSilicon, Huawei Technologies, LSI, Agere Systems, Lucent, and Texas Instruments. His current interest is in transceiver architecture modeling and system level end-to-end simulation, both electrical and optical.

1. Introduction
As date rate continues to increase, 112Gbps over single lane over copper and/or optics is on the horizon. Whether 112Gbps over copper is doable has become a frequent discussion topic in the industry nowadays. The feasibility certainly depends on the choice of signal modulation and channel characteristics. But what is the most appropriate modulation scheme, given the state of the art of PCB design and manufacturing, connector technology, and SerDes capabilities?
At 50G node PAM4 (4-level pulse amplitude modulation) is opted over NRZ for medium reach (MR) and long reach (LR) applications where insertion loss can be as high as 35dB at 14GHz demanded by some system houses, although OIF CEI-56G for PAM4 specifies 20dB and 30dB ball to ball as the maximum loss budget for MR and LR, respectively. The related channels are beyond the direct reach of NRZ signaling without resorting to retimers.
The Nyquist frequency for 112Gbps is 56, 28, and 18.67GHz, for NRZ, PAM4, and PAM8 (8-level pulse amplitude modulation) signaling. Typically, the smaller the Nyquist frequency is, the less the channel loss. The loss for NRZ is too excessive for a reasonable length of transmission. As a result, this study does not include NRZ; rather it only focuses on PAM4 vs. PAM8 modulations. Other modulations such as duobinary or ENRZ are not discussed either in this paper.
Although the insertion loss at 18.67GHz for PAM8 is smaller than that at 28GHz for PAM4 for any practical channels that do not possess noticeable suck-outs around the frequency of interest, PAM8 signaling requires more SNR to achieve the same SER (symbol error ratio) than PAM4. Thus, it is not straightforward as, without case-by-case studies, which modulation is more suitable for the 100G node application. It is the intension of this paper to provide insight to system and SI engineers as well as silicon vendors into the choice of a modulation that is more likely for the 100G applications.
The work starts with Salz SNR, which has been widely adopted as a mathematical SNR figure-of-merit, over bandwidth-limited channels. The Salz SNR, which is the direct result of the use of the MMSE-DFE criterion, is computed for both PAM4 and PAM8 for three different link systems. The corresponding Salz SNR margin, the difference between Salz SNR and the required SNR for a given SER is computed. Larger SNR margin is considered as the more viable approach. Implementation cost and architecture complexity are not directly discussed in this paper.
After Salz SNR margin analysis, more realistic equalization implementations, comprising different combinations of RX FFE and DFE tap numbers are considered; no TX FIR or RX CTLE are included; this however does not change the conclusion. For different equalization configurations SNR margin is simulated based on optimally computed FFE and DFE tap coefficient values for the selected CDR sampling phase at different AWGN levels, but without including crosstalk effect.
From the equalization combinations one is chosen for more detailed analysis by including both crosstalk and AWGN, for all the three link systems. The choice of FFE and DFE tap number is more based on practical implementation considerations. From the study it is preliminarily concluded that PAM4 should outperform PAM8 in achievable SNR margin at the 100G node for backplane and copper cable transmissions.

2. Link Channel Descriptions
Three link channels, named Link-1, Link-2, and Link-3, are chosen for analysis in this paper. They are based on different PCB material, backplane design, and connector technologies. Channel loss profiles, shown in Figure 1, indicate that they are all smooth enough up to 30GHz without major fluctuations. The losses at the Nyquist frequencies for PAM4 and PAM8 are highlighted in the insertion loss plot; they are also summarized in Table 1. It is seen that the larger the channel loss, the larger the difference in dB at the Nyquist frequency between PAM4 and PAM8. The system crosstalk will be discussed, but towards the end in this paper.
Figure 1. Channel insertion loss profiles for the three channels under study.
Table 1. Insertion losses at the Nyquist frequency for the three channels.
Nyquist Frequency (GHz)
Link-1
Link-2
Link-3
PAM4 at 28.00 14.22 dB 21.27 dB 28.41 dB
PAM8 at 18.67 9.99 dB 13.55 dB 19.10 dB
Loss at Nyquist 4.23 dB 7.72 dB 9.31 dB
The pulse responses of the three channels are shown in Figure 2. Each horizontal grid represents one symbol unit interval. They are 17.8571ps and 26.7857ps for PAM4 and PAM8, respectively. As the insertion loss for PAM8 is smaller than that for PAM4, the corresponding pulse responses for PAM8 show more strength. On the other hand, for the same signal modulation the more lossy the channel is, the more reduced pulse response amplitude.

Figure 2. Pulse responses aligned in time for PAM4 and PAM8 for three channels.
3. PAM4 and PAM8 Basics
A brief summary of main characteristics of PAM4 and PAM8 is provided in Table 2, in a comparative manner for easy comprehension. The specific values are for 112Gbps.
Table 2. Comparison between PAM4 and PAM8.
Modulation
PAM4
PAM8
Number of bits in a symbol
2
3
Mapping to PAM (Gray coding)
(Level 0 to M-1)
1 0
1 1
0 1
0 0
1 0 0 1 0 1 1 1 1 1 1 0 0 1 0 0 1 1 0 0 1 0 0 0
Time duration per symbol (UI)
2/DataRate (= 17.8571 ps)
3/DataRate (= 26.7857 ps)
Number of distinct symbols
4
8
Number of eyes
3
7
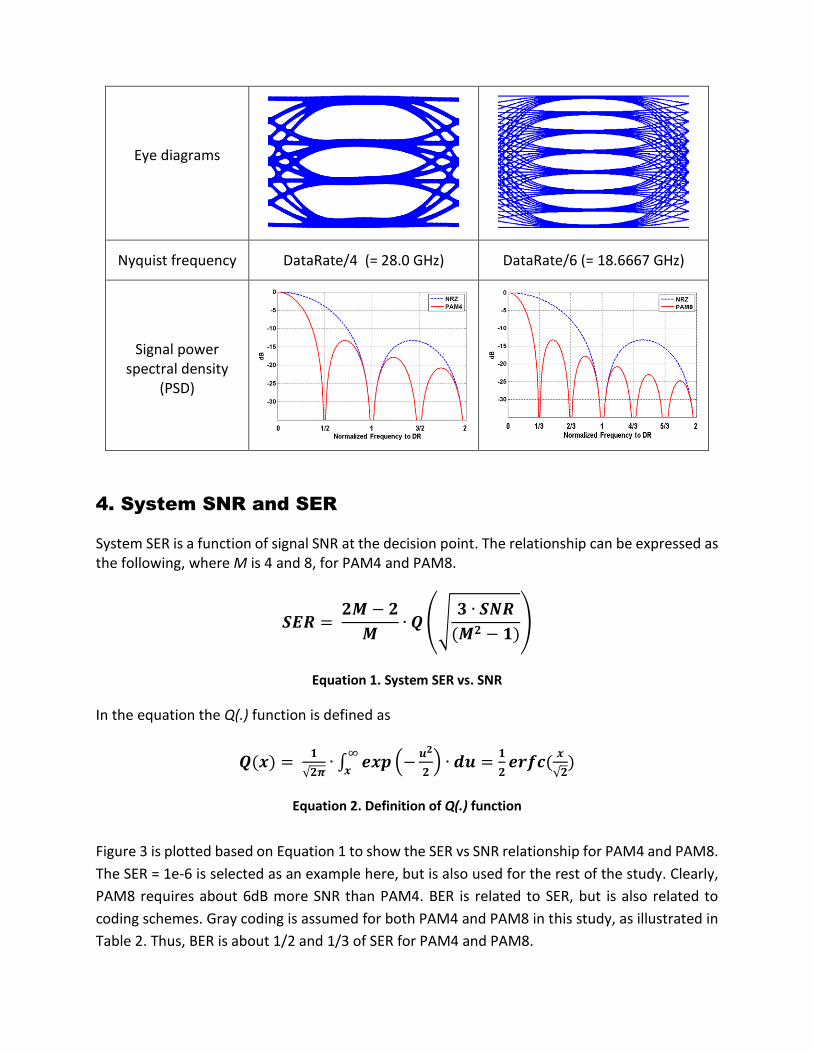
Eye diagrams
Nyquist frequency
DataRate/4 (= 28.0 GHz)
DataRate/6 (= 18.6667 GHz)
Signal power
spectral density (PSD)
4. System SNR and SER
System SER is a function of signal SNR at the decision point. The relationship can be expressed as the following, where M is 4 and 8, for PAM4 and PAM8.
𝑺𝑬𝑹 = 𝟐𝑴 − 𝟐
𝑴∙ 𝑸 (√
𝟑 ∙ 𝑺𝑵𝑹
(𝑴𝟐 − 𝟏))
Equation 1. System SER vs. SNR
In the equation the Q(.) function is defined as
𝑸(𝒙) = 𝟏
√𝟐𝝅∙ ∫ 𝒆𝒙𝒑 (−
𝒖𝟐
𝟐) ∙ 𝒅𝒖 =
𝟏
𝟐𝒆𝒓𝒇𝒄(
𝒙
√𝟐)
∞
𝒙
Equation 2. Definition of Q(.) function
Figure 3 is plotted based on Equation 1 to show the SER vs SNR relationship for PAM4 and PAM8.
The SER = 1e-6 is selected as an example here, but is also used for the rest of the study. Clearly,
PAM8 requires about 6dB more SNR than PAM4. BER is related to SER, but is also related to
coding schemes. Gray coding is assumed for both PAM4 and PAM8 in this study, as illustrated in
Table 2. Thus, BER is about 1/2 and 1/3 of SER for PAM4 and PAM8.

Figure 3. Relationship between SER and SNR for PAM4 and PAM8, with SER=1e-6 highlighted.
5. Salz SNR Analysis
The Salz SNR is the result of the use of the optimal MMSE-DFE criterion to estimate system operating margin, i.e., the difference between the required SNR for the target SER and the achievable SNR. Salz SNR represents an upper bound on a given system performance with practical implementations.
The Salz SNR can be derived as
𝑺𝑵𝑹𝑺𝒂𝒍𝒛 = 𝟏𝟎 ∙ 𝐥𝐨𝐠𝟏𝟎 {𝒆𝒙𝒑 [𝟏
𝑭𝑵
∫ 𝐥𝐧 (𝟏 +𝑺(𝒇)
𝑵(𝒇)) ∙
𝑭𝑵
𝟎
𝒅𝒇]}
≈ 𝟏
𝑭𝑵
∫ 𝟏𝟎 ∙ 𝐥𝐨𝐠𝟏𝟎 [𝑺(𝒇)
𝑵(𝒇)] ∙ 𝒅𝒇 = 𝑨𝑽𝑮𝟎<𝒇<𝑭𝑵
[𝑺𝑵𝑹𝒅𝑩(𝒇)]𝑭𝑵
𝟎
Equation 3. Salz SNR computation.
Where, S(f) is the signal power density, N(f) is the noise power density, and FN is the frequency bandwidth which is typically set to the Nyquist frequency.
The Salz SNR for the three channels in Figure 1 is computed for differently assumed AWGN power (the integrated PSD) levels. AWGN is a basic noise model used in information theory to emulate the effect of random processes. PSD stands for power spectral density, which is an indicator of the strength of the variations (energy) as a function of frequency.

The difference between the Salz SNR and the required SNR for SER at 1e-6 is then calculated. This difference indicates link margin under Salz assumptions and for the assumed AWGN noise power. The results are shown in Figure 4.
Figure 4. Salz SNR margin between PAM4 and PAM8 for the three channels.
From the Salz SNR approach for the three channels, it is observed that PAM4 has more SNR margin over PAM8 for all three channels. On the other hand, for the same noise power, Link-1 has more margin than link-2, and Link-2 more margin than Link-3. This is due to Salz SNR assumptions and might not be the case with a practical equalizer.
It is also observed that the margin difference between PAM4 and PAM8 becomes smaller when channel loss becomes larger. To explore this a little further let’s look at a channel with die-to-die loss at roughly 40dB at 28GHz and compare Salz SNR margin for SER at 1e-6 and 1e-4. It is seen in Figure 5 that even for this very lossy but relatively smooth channel PAM4 outperforms PAM8 in SNR. However, when loss exceeds a certain level neither PAM4 nor PAM8 can provide the required performance. It is also seen that the higher the target SER the more the SNR margin as less SNR is required.
PAM8 will have advantages over PAM4 for quite a few legacy channels designed for 25G NRZ and 56G PAM4 systems. This is because there is usually a notch beyond approximately 25GHz, which is within the Nyquist frequency of PAM4 but outside that of PAM8 at 112Gbps. The suck-outs are justified for lower data rates as a trade-off for lower system cost. Figure 6 shows a legacy backplane channel in line with the above description. The Salz SNR margin for SER=1e-6 indicates that PAM8 outperforms PAM4. For the low SNR end, however, the two modulations are comparable. This is true only because Salz SNR is ideal. For a practical equalization configuration, PAM8 will be shown to be able to work better than PAM4; this link will be revisited in section 6.4.

Figure 5. A highly lossy but smooth channel. PAM4 outperforms PAM8 with Salz SNR.
Figure 6. A legacy channel example to show PAM8 outperforms PAM4 with Salz SNR.
6. A Realistic Equalizer
6.1 Simulation setup More practical equalization configurations are explored from now on after Salz SNR analysis. The simulation setup is depicted in Figure 7. The blocks for FFE and DFE can have different number of taps. For the same number of FFE taps, the pre-cursor and post-cursor partition can also be different for PAM4 and PAM8. Crosstalk effect will be addressed later.
The channel pulse response is sampled at baud rate. To begin with, equalization EQ1 (defined as 128-tap FFE and 32-tap DFE) tap coefficients are adapted to achieve the highest possible SNR, based on the sampled channel response.

Figure 7. Generic simulation setup.
SNR is defined as
𝑺𝑵𝑹 = 𝑷𝒔𝒊𝒈𝒏𝒂𝒍
𝑷𝒔𝒍𝒊𝒄𝒆𝒓_𝒆𝒓𝒓𝒐𝒓
Equation 4. Signal SNR definition.
Due to baud rate sampling, channel bandwidth is 28GHz and 18.67GHz respectively for PAM4 and PAM8. The choice of the sampling phase will be discussed a little later in Section 7.
6.2 SNR margin with EQ1
The SNR margin for each link is computed for different AWGN power levels (defined w.r.t. the TX output signal power) with optimally computed FFE and DFE coefficients. The results are plotted in Figure 8. It is observed that the SNR margin trend matches pretty well with the Salz SNR margin, which is seen as the upper bound. The SNR margin gap for Link-2 at low AWGN power will be discussed in 7.4.
Figure 8. SNR margin with EQ1 at SER=1e-6 for the three channels.

6.3 Detailed case study
A case study for Link-3 with AWGN power = -35dB for PAM8 is provided with more details. The channel symbol-sampled pulse response is shown in Figure 9. The sampled eyes before and after the equalization are shown in Figure 10 and Figure 11. Figure 12 shows error signature.
Figure 9. Sampled pulse response for Link-3.
Figure 10. Sampled eye before EQ.
Figure 11. Sampled eye after EQ
Figure 12. Error signal in time and histogram.
6.4 Revisiting Link-4
It is seen that the suck-out impact on Link-4 using PAM4 is limited with Salz SNR analysis is applied. However, intuitively one would think that the big suck-out should impact PAM4 performance more than that of PAM8. To understand better EQ1 is chosen; it is less ideal than Salz SNR analysis. Link-4 channel pulse responses for PAM4 and PAM8 are shown in Figure 13 with the pulse peak aligned.

The simulated SNR margin for SER=1e-6 is shown in Figure 14. It is seen that PAM8 indeed works better than PAM4 for the entire AWGN range computed. It is noted that if crosstalk is included, most likely neither PAM8 nor PAM4 will work even for low AWGN levels. One lesson learned is that to work at 100G channels must be designed smooth enough and crosstalk must be well controlled. Accordingly, channels like Link-4 will not be further discussed in this paper.
Figure 13. Peak aligned pulse response for Link-4.
Figure 14. EQ1 based SNR margin for Link-4.

7. More Simplified Equalizers
7.1 Configurations for simulation
The EQ1 discussed above is impractical for its cost, both implementation complexity and power consumption. Table 3 shows the gradually simplified equalization configurations for different channels and different modulations schemes. The FFE center tap, a division between pre-cursor and post-cursor taps, is automatically adapted for maximum SNR.
Table 3. Equalization configurations for channel and modulation combinations.
EQ Config.
FFE Taps
DFE Taps
Signal Modulation
FFE Pre-Cursor Taps
Link-1
Link-2
Link-3
EQ1
128
32 PAM4 19 13 9
PAM8 5 4 6
EQ2
64
1 PAM4 13 7 9
PAM8 6 4 6
EQ3
32
1 PAM4 8 7 6
PAM8 2 4 5
EQ4
24
1 PAM4 6 6 6
PAM8 2 3 4
EQ5
16
1 PAM4 4 5 5
PAM8 2 3 3
7.2 Sampling phase
The sampling phase is chosen at the location where the pulse response peaks. This choice does not guarantee the optimal sampling phase in terms of SNR, but should not be too far away from the peaking phase. Figure 15 shows the achievable SNR with EQ3 for Link-2. For PAM8 the SNR is normalized to that of PAM4 at phase 0, by subtracting 4.754dB for this specific case. It is seen that the optimal phase lies within 0.1UI from the peak. The loss in SNR is really small for both. However, PAM8 is much more sensitive to phase perturbations than PAM4, which should also be taken into account while determining the choice of a modulation scheme.
7.3 SNR margins
The SNR margin for different equalization implementations for the three link channels is simulated and plotted in Figure 16 through Figure 18, together with the Salz SNR margin. Before we discuss the results, it is worth pointing out that, due to various implementation impairments and non-idealities, extra operating margin has to be allocated.

Figure 15. Channel achievable SNR with Link-2 EQ3 for different sampling phases.
Figure 16. SNR Margin for different EQ setups for Link-1.

Figure 17. SNR Margin for different EQ setups for Link-2.
Figure 18. SNR Margin for different EQ setups for Link-3.

An example of eye diagrams without noise are simulated as shown in Figure 19.
Figure 19. Example eye diagrams for PAM4 and PAM8.
7.4 Observations and discussions
Let’s consider some observations from Figure 16 through Figure 18. 1. SNR margin performance gap at low AWGN for Link-2 w.r.t. the Salz SNR margin (Figure 17):
A zoomed-in view of the PAM4 pulse response shows that there exist relatively strong reflections just over 250 UI away from the peak (Figure 20). None of the equalization schemes studied can remove those reflections, thus causing SNR degradation. However, when AWGN becomes larger the reflection impact becomes less dominant. As a result, the overall SNR margin starts to resemble more closely to that of Salz SNR margin.
Figure 20. Zoomed-in PAM4 pulse response of Link-2.

2. Figure 16 through Figure 18 are recaptured in Figure 21 for the high AWGN (low SNR) end. For the low-loss channel (left most), PAM4 (solid lines) shows advantages over PAM8 (dashed lines) when noise is high. This is because SNR is dominated by noise. On the other hand, for the high loss channel (right most), PAM4 does not show obvious advantages over PAM8 as residual ISI and noise are at least comparable.
Figure 21. SNR margin at high AWGN end.
3. In Link-3 (Figure 18) PAM4 performs better with EQ1, EQ2, and EQ5, while PAM8 performs better with EQ4 and EQ5. From Table 3 it is seen that EQ3 and EQ4 have 25 and 17 post-cursor taps for PAM4; there are 26 and 19 post-cursor taps for PAM8. The pulse responses are normalized and shown in Figure 22. Combining all it is seen that EQ3 and EQ4 can basically cover the reflections for PAM8 (red fluctuations just below 20th tap), but not for PAM4 (blue fluctuations beyond 23rd tap). On the other hand, since EQ2 and EQ1 can cover both PAM4 and PAM8, thus PAM4 outperforms. For EQ5, the reflections can be handled for neither PAM4 nor PAM8, hence PAM4 again outperforms.
Figure 22. Normalized Link-3 pulse responses.
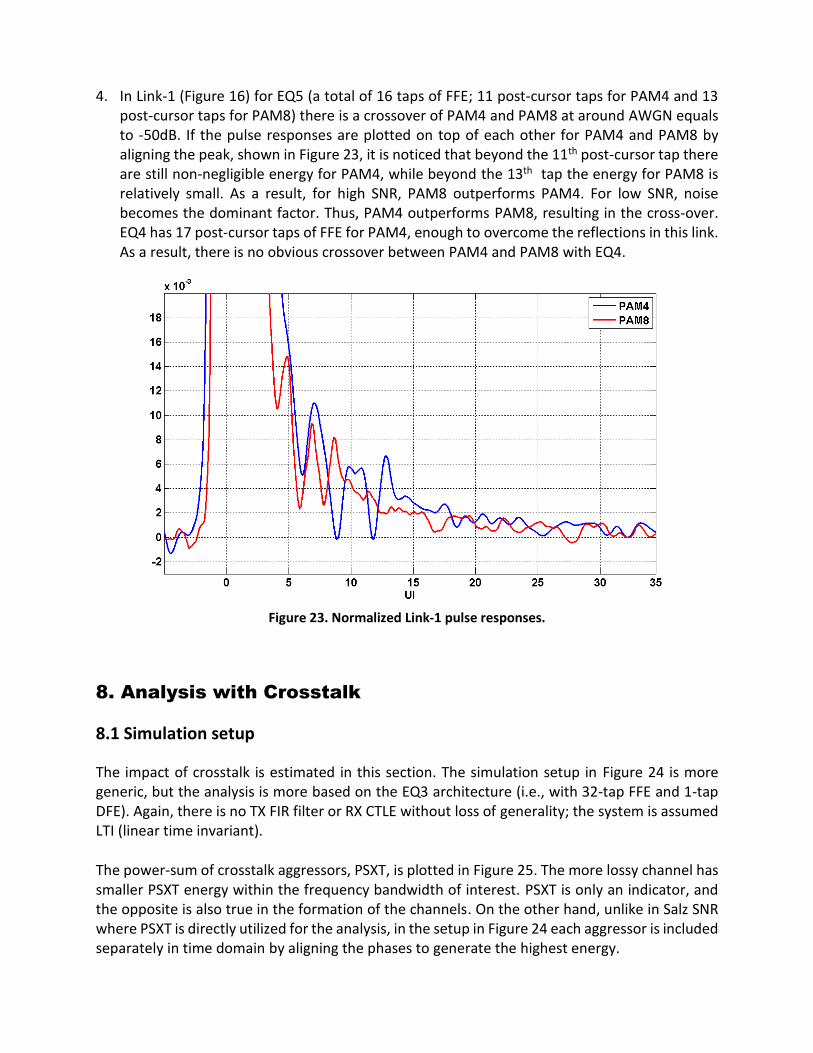
4. In Link-1 (Figure 16) for EQ5 (a total of 16 taps of FFE; 11 post-cursor taps for PAM4 and 13 post-cursor taps for PAM8) there is a crossover of PAM4 and PAM8 at around AWGN equals to -50dB. If the pulse responses are plotted on top of each other for PAM4 and PAM8 by aligning the peak, shown in Figure 23, it is noticed that beyond the 11th post-cursor tap there are still non-negligible energy for PAM4, while beyond the 13th tap the energy for PAM8 is relatively small. As a result, for high SNR, PAM8 outperforms PAM4. For low SNR, noise becomes the dominant factor. Thus, PAM4 outperforms PAM8, resulting in the cross-over. EQ4 has 17 post-cursor taps of FFE for PAM4, enough to overcome the reflections in this link. As a result, there is no obvious crossover between PAM4 and PAM8 with EQ4.
Figure 23. Normalized Link-1 pulse responses.
8. Analysis with Crosstalk
8.1 Simulation setup
The impact of crosstalk is estimated in this section. The simulation setup in Figure 24 is more generic, but the analysis is more based on the EQ3 architecture (i.e., with 32-tap FFE and 1-tap DFE). Again, there is no TX FIR filter or RX CTLE without loss of generality; the system is assumed LTI (linear time invariant).
The power-sum of crosstalk aggressors, PSXT, is plotted in Figure 25. The more lossy channel has smaller PSXT energy within the frequency bandwidth of interest. PSXT is only an indicator, and the opposite is also true in the formation of the channels. On the other hand, unlike in Salz SNR where PSXT is directly utilized for the analysis, in the setup in Figure 24 each aggressor is included separately in time domain by aligning the phases to generate the highest energy.

Figure 24. Simulation setup with crosstalk present.
Figure 25. Crosstalk PSXT profiles for the tree systems.
8.2 Simulated SNR margin
The simulated SNR margin for SER=1e-6 is shown in Figure 26 for the three link channels, first without crosstalk and then with crosstalk. Depending on the channel and the AWGN noise power level, the crosstalk impact can be large or not so large.

Figure 26. SNR margin with EQ3 equalization scheme.
The following are observed from Figure 26.
As long as the loss is controlled to approximately 25dB, PAM4 has advantages over PAM8, regardless of high or low AWGN levels. For Link-1 there is around 3dB more margin for PAM4; for Link-2 there is about 1dB margin for PAM4. For Link-3 the margin is comparable, but PAM4 should be given more favorite emphasis due to its simplicity.
For a higher loss channel such as Link-3, PAM8 shows more margin than PAM4 for the higher SNR (lower AWGN) end only under certain conditions. However, this is root-caused as the impact from some unaccounted-for reflections. Consequently, increasing the equalizer range should be able to handle the more extended major reflections. In general, PAM4 still outperforms PAM8 with the higher loss channel.
For relatively low SNR and high loss channels the SNR margin is almost the same for PAM4 and PAM8. However, due to compatibility back to the 50G designs, SerDes complexity, implementation cost, parameter sensitivity, and system robustness, PAM4 should still be prioritized over PAM8.
In short, from the analysis so far the preliminary conclusion is that PAM4 should be recommended over PAM8 for the 100G applications. On the other hand, considering that a lot of impairments and nonidealities are yet to be included in the above analyses, an extra margin, e.g., 3dB, should be allocated; in other words, to be only satisfied with the SNR margin being non-negative is not enough in a real system.

8.3 Link system SER and BER
An example for Link-2 at AWGN = -40dB is discussed. Figure 27 shows the Link-2 pulse responses. The normalized FFE coefficients are plotted on top of the pulse response, while the 1-tap DFE is no shown. In Figure 28 the symbol-spaced sampled eyes before and after the equalizer are displayed. The eye opening after equalization is obvious. The vertical axis is normalized such that the error slicer levels are at +/- 1/4 and +/- 3/4 for PAM4, and are at +/- 7/8, +/- 5/8, +/-3/8, and +/- 1/8 for PAM8.
Now, using Equation 1 we can estimate the system BER. Extra 3dB margin is assumed for the
unaccounted-for impairments. The SER and BER results are estimated and summarized in Table
4. It is seen that PAM4 does work out better than PAM8 for the given conditions. The difference
in BER is by about two orders.
Figure 27. Link-2 pulse responses and FFE coefficients for PAM4 and PAM8.
Figure 28. Sampled eyes before and after the equalizer for PAM4.

Figure 29. Sampled eyes before and after the equalizer for PAM8.
Table 4. System performance for Link-2 using EQ3.
SNR (after 3dB margin)
Estimated SER
Estimated BER
PAM4
22.91 dB
3.04e-10
1.52e-10
PAM8
28.02 dB
3.44e-8
1.15e-8
9. Impact of PAR
The above analysis is only based on SNR. In actual silicon implementations in which the TX swing
is constraint and RX linearity range is limited and/or ADC full-scale-range is confined, the signal
PAR (peak-to-average ratio) needs to be taken into account as well. PAR is simply defined as the
signal peak power over average power, as shown in Equation 5.
𝑷𝑨𝑹 = 𝟏𝟎𝒍𝒐𝒈𝟏𝟎
𝑺𝒊𝒈𝒑𝒆𝒂𝒌𝟐
𝑺𝒊𝒈𝒓𝒎𝒔𝟐
Equation 5. Definition of PAR.
For the transmitter the PAR for PAM4 is 2.55dB and for PAM8 is 3.68dB, while NRZ has PAR equal to 0dB. Thus, PAM4 has about 1.1dB advantage over PAM8. Besides the difference in PAR at the TX output, the link channel also incurs differences in PAR. This is because different signal modulations require different bandwidths, which in turn have different impact on the signal.

For the three link channels analyzed above the PAR are computed and summarized in Table 5.
Table 5. PAR for PAM4 and PAM8 due to different link channels.
Channel Link-1 Link-2 Link-3
PAM4 6.16 dB 7.80 dB 9.33 dB
PAM8 4.41 dB 6.06 dB 7.65 dB
Difference 1.75 dB 1.74 dB 1.68 dB
When the signal PAR and channel PAR are combined, the difference between PAM4 and PAM8
for the three channels are shown in Table 6. On average, PAM8 gained about 0.6dB in SNR.
Despite this PAM4 should be still the choice of the modulation for the 100G application.
Table 6. PAR for PAM4 and PAM8 due to modulation and the channel.
Combined Link-1 Link-2 Link-3
PAM4 8.71 dB 10.35 dB 11.88 dB
PAM8 8.09 dB 9.74 dB 11.33 dB
Difference 0.62 dB 0.61 dB 0.55 dB
For example, for the case study in Section 8.3, the BERPAM4 in Table 4 will be modified from 1.52e-
10 to 2.10e-9, which is still about one order better than BERPAM8 =1.15e-8.
10. Summary and Future Work
In this paper the feasibility of transmitting data at the 100G speed node over backplane channels
is analyzed. Specifically, two signal modulations, PAM4 and PAM8, are compared in terms of
system operating margin for the target SER, under the assumption of AWGN and crosstalk noise.
It is seen that channels with loss at 25dB at 28GHz can be handled using PAM4 signaling for 100G
copper applications. Although copper cable channels are not directly analyzed, it is assumed they
are more easily to handle electrically than the backplane channel, in terms of loss, reflections,
and crosstalk.
On the other hand, PAM8 signaling showed less system SNR margin while requires more
complicated designs. Thus, for newly designed channels targeting the 100G speed node PAM4
has shown advantages over PAM8. Additionally, at the 50G node both OIF and IEEE have adopted
PAM4 signaling for medium and long reach applications. Thus, to promote PAM4 also takes care
of backward compatibility with the 50G speed node.

If stronger FEC can be applied such that the raw SER (pre-FEC BER) can be relaxed, for example,
to 1e-3, channel loss from package ball to ball can be likely extended up to 30dB. From SER=1e-
6 to 1e-3 the SNR requirement is reduced by approximately 3.5dB for both PAM4 and PAM8.
It is worthy pointing out that channel impedance discontinuity control, system crosstalk
management, system manufacturing variability reduction, and active components PVT
performance assurance should be seriously given attention to for a product worthy system.
With the development of new technologies 112Gbps discussions will continue before standard
bodies prescribe detailed specifications. In the near future, the work on the 100G transmission
over copper will be continuing, from theoretical analysis to silicon level designs. On the system
level evaluation side, more work is needed on PAM4 and PAM8 susceptibility to impairments and
nonlinearity, to channel variations, and to equalization setting differences. On the silicon design
side, the determination of architecture for the receiver is another topic requiring lots of studies.
For example, the receiver architecture can be analog-based or DSP-based. Each has its own
advantages and disadvantages. Another area demanding more depth investigation is the FEC.
Still another area needs attention is the connector design; better impedance match and smaller
coupling are always desired. In short, at the 100G the system level specifications are more about
the combined effect than individual impact. COM-like tools should be developed and used for
the link system margin analysis.

References
[1] Jack Salz, “Optimum mean-square decision feedback equalization,” Bell System Technical
Journal, vol. 52, no. 8, pp. 1341-1374, 1973
[2] Henry Wong, et al, “Salz SNR Modification for High Speed Serial Link System Performance
Estimation”, DesignCon 2012
[3] Chris Cole, et al, “PAM-N Tutorial Material”, 802.3bj 100 Gb/s Backplane and Copper
Cable Task Force IEEE 802.3 Plenary Session Waikoloa, HI 12-15 March 2012
[4] Ali Enteshari, et al, “40/100 Gbps Transmission Over Copper, Myth and Realities”,
DesignCon 2009
[5] George Zimmerman, “Salz SNR Text and Procedure”, IEEE 802.3bz 2.5/5GBASE-T Task
Force Architecture Ad Hoc – 25 Aug 2015
[6] Charles Moore, et al, “A method for evaluating channels”, 100 Gb/s Backplane and
Copper Study Group, Singapore, March 2011
[7] A. Vareljian, “Channel Qualification Based on Salz”, IEEE 802.3bj Task Force, Sep 2012
[8] Ali Ghiasi, et al, “Investigation of 112GbpsbE Based on PAM-4 and PAM-8”, IEEE 802.3bm
Task Force, Sept 27-28, 2012, Geneva