Bi-national Commission for Collaboration on Health Guyana and Suriname.
Upload
trinhnguyetCategory
view
222download
1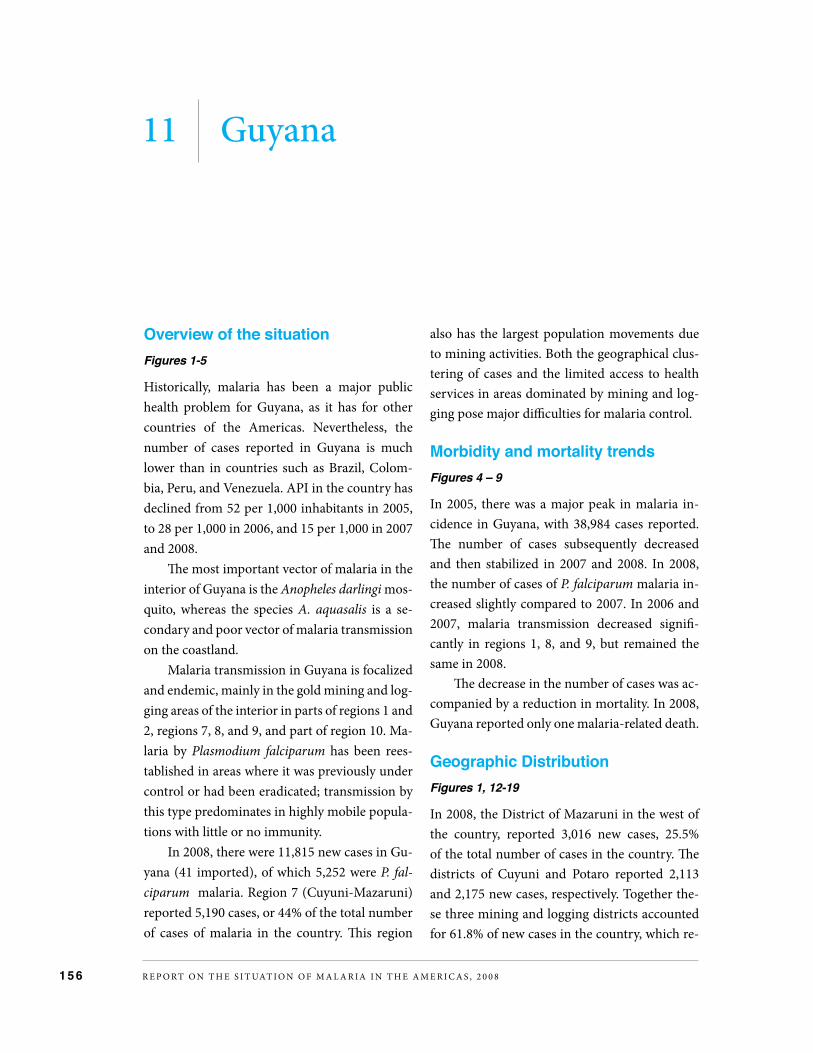
guyana11
Overview of the situation Figures 1-5
Historically, malaria has been a major public health problem for Guyana, as it has for other countries of the Americas. nevertheless, the number of cases reported in Guyana is much lower than in countries such as Brazil, colom-bia, Peru, and Venezuela. APi in the country has declined from 52 per 1,000 inhabitants in 2005, to 28 per 1,000 in 2006, and 15 per 1,000 in 2007 and 2008.
The most important vector of malaria in the interior of Guyana is the Anopheles darlingi mos-quito, whereas the species A. aquasalis is a se-condary and poor vector of malaria transmission on the coastland.
Malaria transmission in Guyana is focalized and endemic, mainly in the gold mining and log-ging areas of the interior in parts of regions 1 and 2, regions 7, 8, and 9, and part of region 10. Ma-laria by Plasmodium falciparum has been rees-tablished in areas where it was previously under control or had been eradicated; transmission by this type predominates in highly mobile popula-tions with little or no immunity.
in 2008, there were 11,815 new cases in Gu-yana (41 imported), of which 5,252 were P. fal-ciparum malaria. Region 7 (cuyuni-Mazaruni) reported 5,190 cases, or 44% of the total number of cases of malaria in the country. This region
also has the largest population movements due to mining activities. Both the geographical clus-tering of cases and the limited access to health services in areas dominated by mining and log-ging pose major difficulties for malaria control.
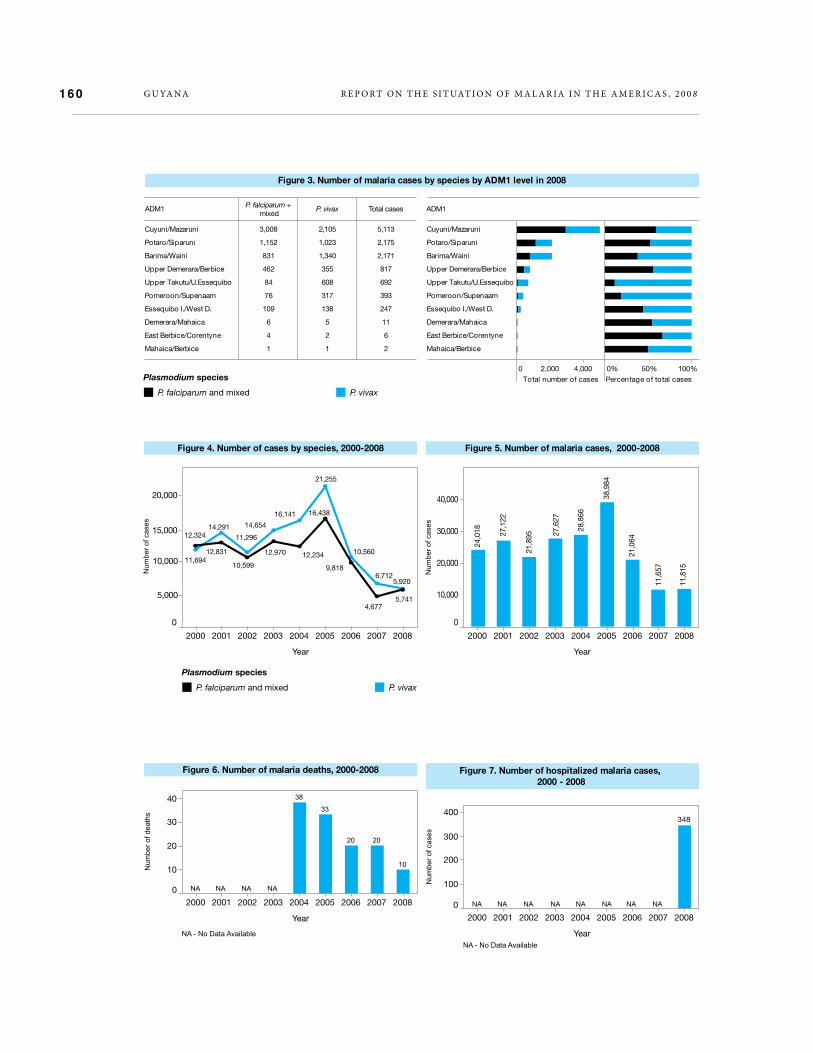
Morbidity and mortality trendsFigures 4 – 9
in 2005, there was a major peak in malaria in-cidence in Guyana, with 38,984 cases reported. The number of cases subsequently decreased and then stabilized in 2007 and 2008. in 2008, the number of cases of P. falciparum malaria in-creased slightly compared to 2007. in 2006 and 2007, malaria transmission decreased signifi-cantly in regions 1, 8, and 9, but remained the same in 2008.
The decrease in the number of cases was ac-companied by a reduction in mortality. in 2008, Guyana reported only one malaria-related death.
Geographic DistributionFigures 1, 12-19
in 2008, the District of Mazaruni in the west of the country, reported 3,016 new cases, 25.5% of the total number of cases in the country. The districts of cuyuni and Potaro reported 2,113 and 2,175 new cases, respectively. together the-se three mining and logging districts accounted for 61.8% of new cases in the country, which re-
R e P O R t O n t H e S i t uAt i O n O f M A l A R iA i n t H e A M e R i c A S , 2 0 0 81 5 6

R e P O R t O n t H e S i t uAt i O n O f M A l A R iA i n t H e A M e R i c A S , 2 0 0 8 G u YA nA 1 5 7
presents a pointed focalization of the problem. Within each district, however, malaria cases are distributed among a large number of localities, making it difficult to control.
The georeferencing of malarious localities in Guyana provides visual confirmation of the fact that, in 2008, 352 localities were reported as a source of cases but of these, 206 reported less than 5 cases each. Only 32 districts registered more than 50 cases in the year and only six loca-lities had more than 250 cases.
in Region 8, the town of Mahdia recorded 983 new cases in 2008, the highest number of cases in the country. The towns of Konawaruk in Region 8, Omai in Region 7 and Mabura Hill in Region 10 constitute a major focus of trans-mission at the confluence of these three regions, close to the center of the country. These are gold mining and logging areas, where about 54% of the cases were P. falciparum malaria, affecting mostly an Afro-Guyanese population.
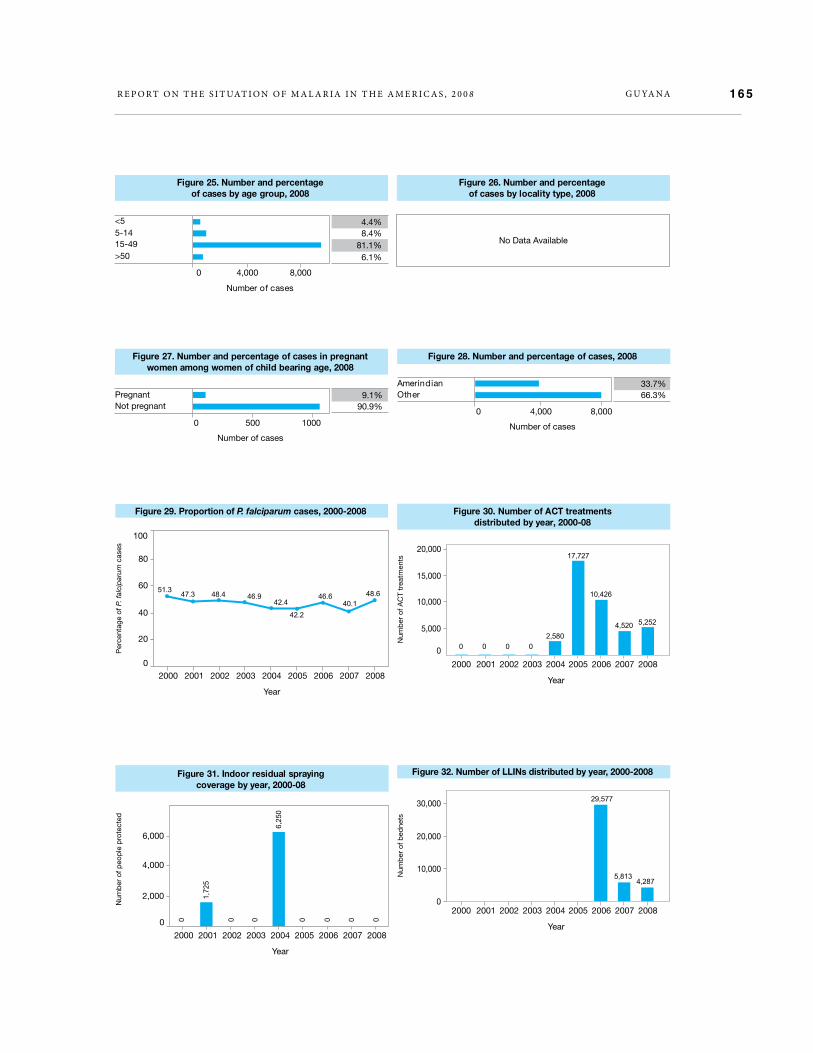
Malaria in specific populations Figures 25–28
in 2008, Guyana reported 517 cases of malaria in children under 5 years of age, or 4.3% of the total number of malaria cases in the country. Along with costa Rica, Guyana is the country with the lowest proportion of cases in this age group, which might be explained by the fact that mala-ria is mostly endemic in mining areas. in 2008, 81% of total cases were reported in people bet-ween 15 and 49 years of age and, of those, 80% were among males.
in Guyana, the Amerindian population is significantly affected by malaria. in 2008, 34% of the total number of cases reported occurred in this ethnic group, much higher than in other
countries.in the districts of Rupununi West, Region 9,
ireng/upper Potaro, Region 8 and Moruka/Po-meroon, Region 2 the proportion of cases among Amerindians was 86%, 79% and 69%, respecti-vely. Among persons infected with malaria in Region 9, in the south of the country, Amerin-dians were the most affected. Also, the region had higher incidence rates of the disease than the rest of the country.
Pregnant women accounted for 9% of ma-laria cases among all women between 15 and 45 years of age with malaria in 2008. This propor-tion was similar to that observed in Brazil, but higher than other countries, like Bolivia and co-lombia. This may reflect better recordkeeping of malaria during pregnancy than exists in other countries.
Diagnosis and treatmentFigures 20-24, 29–30
As in the rest of the Amazon region, P. falcipa-rum strains in Guyana are resistant to chloroqui-ne and sulfadoxine-pyrimethamine treatment. in 2004, Guyana changed its malaria treatment policy, and introduced the use of Acts as a first line of treatment for uncomplicated P. falciparum malaria.
in 2004, 2,580 artemether + lumefantri-ne treatments were distributed. in 2005, 17,727 Act treatments were distributed and more than 10,000 treatments were distributed in 2006. This can partly be explained by the fact that both P. vivax and P. falciparum malaria rose sharply during 2005, as it did in Brazil and many other countries in the region.
By the end of 2006, the number of cases had fallen significantly. The Malaria control

R e P O R t O n t H e S i t uAt i O n O f M A l A R iA i n t H e A M e R i c A S , 2 0 0 8G u YA nA
Program has continued to use the arthemether + lumefantrine combination as a first line of treatment. two evaluations of therapeutic effica-cy have been conducted.
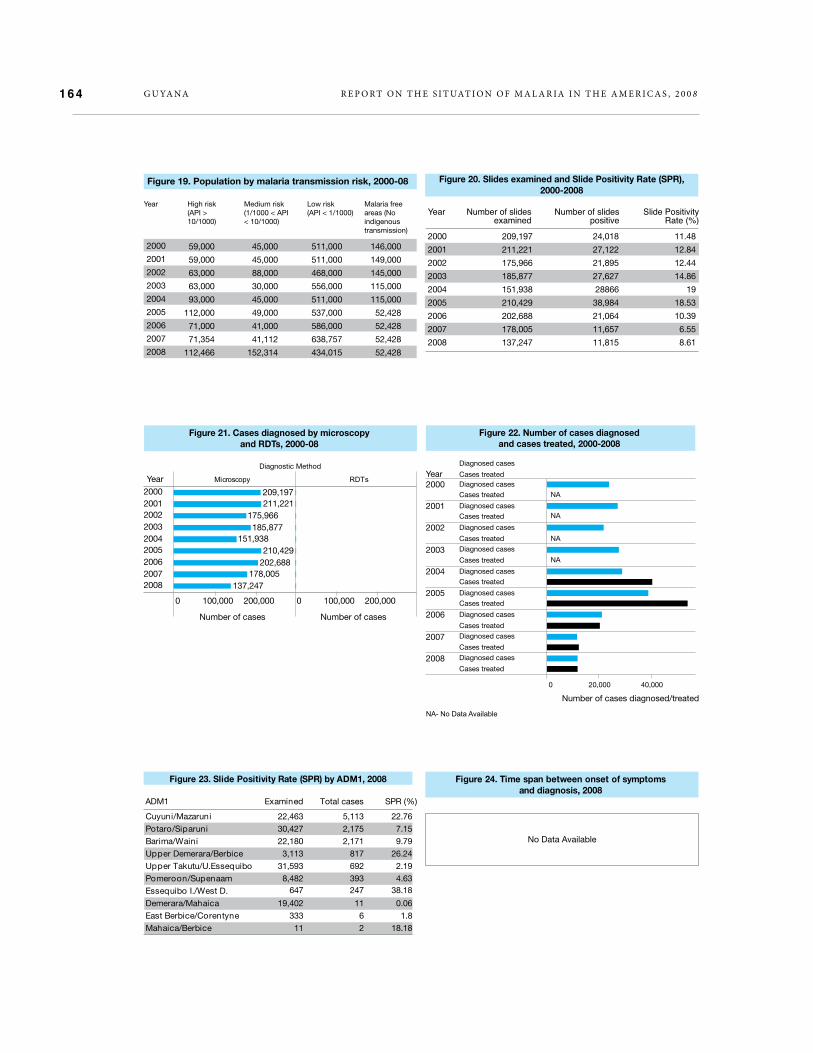
The slide positivity rate in 2008 was 8.6%, a proportion similar to that of other countries in the region, and lower than that of Brazil and co-lombia. This positivity rate is lower than the an-nual average for the decade, but is slightly higher than the 2007 rate. in 2008, the number of blood slides examined was lower than in 2007, while the number of cases remained relatively stable. This may highlight the need for enhanced mi-croscopy for the early detection of cases.
Guyana’s information system does not re-cord the time span between the onset of symp-toms and diagnosis. However, it is noteworthy that many of the cases that were part of the out-breaks in Regions 7 and 8 in 2008 were diagno-sed in the capital city of Georgetown. in 2008, 2,143 of the 5,190 cases reported in Region 7 (41%) were diagnosed and treated in the capital.
in 2008, the use of rapid diagnostic tests for malaria was not reported.
Populations in mining areas can readily ac-cess medicines that are not recommended by the Ministry of Health. This presents a problem for the malaria treatment policy in Guyana. The in-discriminate use of these drugs to suppress cli-nical symptoms makes it difficult to detect cases and contribute to widespread resistance.
Prevention and vector controlFigures 31-33
The use of long-lasting insecticide impregnated nets (llins) started in Guyana in 2006, with the distribution of 29,577 nets purchased by the go-vernment with financial support from the Glo-bal fund, and Amazon Malaria initiative (AMi) projects. currently, llins are the primary in-tervention for malaria vector control in Guyana. The policy dictates the distribution of two llins per household, and the development of joint in-tervention that includes llin distribution and access to treatment with Act.
The AMi project also provided support for the distribution of mosquito nets, of which 5,813 llins were distributed in 2007 and 4,287 llins were distributed in 2008. Distribution focused on vulnerable groups, such as pregnant women, children under the age of 5 years, and miners and loggers in Regions 1, 7, 8, 9 and 10. in 2008, no indoor residual spraying took place.
Financing of malaria controlFigure 34
Since 2005, Guyana became a beneficiary of a Global fund project for malaria control, which in recent years has supported the intensification of control activities in priority regions. The eu-ropean union and the AMi project, financed by the uSAiD and coordinated by the PAHO, have provided funding for technical cooperation to control malaria. in 2008, approximately half of the funding for control measures was provided by external sources.
1 5 8

R e P O R t O n t H e S i t uAt i O n O f M A l A R iA i n t H e A M e R i c A S , 2 0 0 8 G u YA nA 1 5 9
Legend
Number of cases by species
500
P. vivax
P. falciparum
500250
Figure 1. Number of cases by locality, 2008
Suriname
Guyana
Brazil
Venezuela
49%
51%
Plasmodium species
P. vivax
Figure 2. Proportion of cases by species, 2008
P. falciparum and mixed
R e P O R t O n t H e S i t uAt i O n O f M A l A R iA i n t H e A M e R i c A S , 2 0 0 8G u YA nA
ADM1 Total casesP. vivaxP. falciparum + mixed
Figure 3. Number of malaria cases by species by ADM1 level in 2008
ADM1
4,0002,0000 0% 50% 100%
Total number of cases Percentage of total cases
Cuyuni/Mazaruni
Potaro/Siparuni
Barima/Waini
Upper Demerara/Berbice
Upper Takutu/U.Essequibo
Pomeroon/Supenaam
Essequibo I./West D.
Demerara/Mahaica
East Berbice/Corentyne
Mahaica/Berbice 2
6
11
247
393
692
817
2,171
2,175
5,113
1
2
5
138
317
608
355
1,340
1,023
2,105
1
4
6
109
76
84
462
831
1,152
3,008 Cuyuni/Mazaruni
Potaro/Siparuni
Barima/Waini
Upper Demerara/Berbice
Upper Takutu/U.Essequibo
Pomeroon/Supenaam
Essequibo I./West D.
Demerara/Mahaica
East Berbice/Corentyne
Mahaica/Berbice
Plasmodium species
P. falciparum and mixed P. vivax
Figure 4. Number of cases by species, 2000-2008
2000 2001 2002 2003 2004 2005 2006 2007 2008
Year
0
10,000
15,000
20,000
Num
ber o
f cas
es
Plasmodium species
P. falciparum and mixed P. vivax
5,000
11,694
14,291
11,296
14,654
16,141
21,255
10,560
6,7125,920
12,324
12,831
10,599
12,970 12,234
16,438
9,818
4,6775,741
24,0
18 27,1
22
21,8
95 27,6
27
28,8
66
38,9
84
21,0
64
11,6
57
11,8
15
Figure 5. Number of malaria cases, 2000-2008
2000 2001 2002 2003 2004 2005 2006 2007 2008
Year
30,000
20,000
Num
ber o
f cas
es
40,000
0
10,000
0
10
2020
33
38
NANANANA
Num
ber o
f dea
ths
Figure 6. Number of malaria deaths, 2000-2008
2000 2001 2002 2003 2004 2005 2006 2007 2008
Year
40
30
20
10
NA - No Data Available
NA NA NA NA NA NA NA NA
348
Num
ber o
f cas
es
2000 2001 2002 2003 2004 2005 2006 2007 2008
Year
0
400
300
200
100
Figure 7. Number of hospitalized malaria cases, 2000 - 2008
NA - No Data Available
1 6 0
R e P O R t O n t H e S i t uAt i O n O f M A l A R iA i n t H e A M e R i c A S , 2 0 0 8 G u YA nA 1 6 1
Year
2000 2001 2002 2003 2004 2005 2006 2007 2008
-5000
-10,000
0
5,000
Plasmodium species
P. falciparum and mixed P. vivax
Diff
eren
ce in
num
ber
of c
ases
-792
-3,848
-10,695
5,114
1,487
3,358
-2,995
2,5971,064
-5,141
-6,620
4,204
-736
2,371
-2,232
507
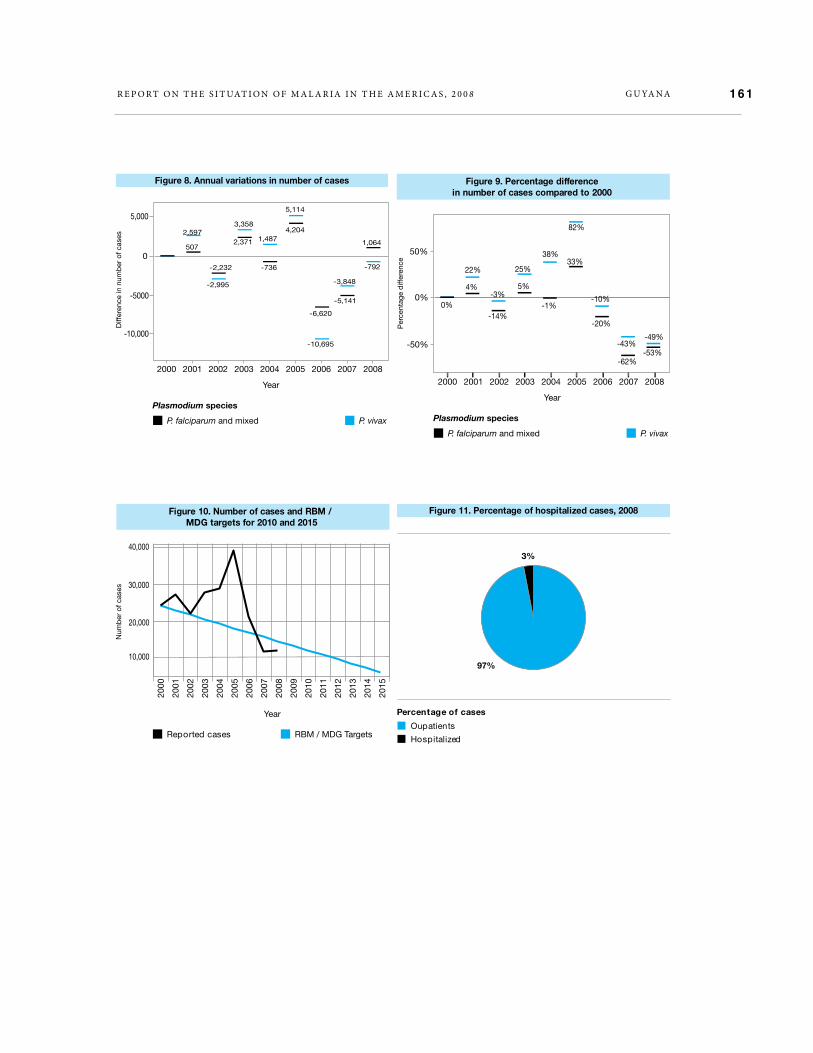
Figure 8. Annual variations in number of cases
Year
2000 2001 2002 2003 2004 2005 2006 2007 2008
-50%
0%
50%
Per
cent
age
diff
eren
ce
Figure 9. Percentage differencein number of cases compared to 2000
-49%-43%
-10%
82%
38%
25%
-3%
22%
0%
-53%-62%
-20%
33%
-1%
5%
-14%
4%
Plasmodium species
P. falciparum and mixed P. vivax
Num
ber
of c
ases
2000
2001
2002
2003
2004
2005
2006
2007
2008
2009
2010
2011
2012
2013
2014
2015
10,000
20,000
40,000
30,000
Figure 10. Number of cases and RBM / MDG targets for 2010 and 2015
Year
Reported cases RBM / MDG Targets
Figure 11. Percentage of hospitalized cases, 2008
3%
97%
Percentage of cases
Oupatients
Hospitalized

R e P O R t O n t H e S i t uAt i O n O f M A l A R iA i n t H e A M e R i c A S , 2 0 0 8G u YA nA
Figure 12. Localities (ADM2) with highest malaria burden and cummulative proportion of total cases in the country, 2008
0 200 400 600 800 1,000
Number of cases
0% 20% 40% 60% 80% 100%
Cummulative proportion (%) of total cases
Mahdia
Omai
Puruni River
Mabura Hill
Arimu Mine
Arakaka
Konawaruk
Issano
Barama River
Port Kaituma
Cuyuni River
Quartzstone Landing
Aranka River
Oko River 238
238
241
258
265
277
319
406
469
514
586
602
667
983
54%
52%
50%
48%
45%
43%
40%
38%
34%
30%
25%
20%
15%
9%
* See Annex A for a complete list.
Figure 13. Localities by numberof malaria cases, 2008
Number of cases
501-1,000
251-500
101-250
51-100
11-50
6-10
1-5
Grand Total
206
42
72
18
12
6
5
3�1
Number of localities
0 50 100 150 200 250 300 350 0 50 100 150 200 250
Number of localities
501-1,000
251-500
101-250
51-100
11-50
6-10
1-5 174
23
39
8
10
4
1
Grand Total 259
Figure 14. Localities by number ofP. falciparum cases, 2008
Number ofP. falciparum
cases
Figure 15. Regions (ADM1) by number of cases, API and percentage of P. falciparum cases, 2008
Number of cases (logarithmic scale)
API0
100200
290.56
25
250
1 2 5 10 20 50 100 200 500 1,000 2,000 5,000 10,0000
10
20
30
40
50
60
Upper Takutu/U.Essequibo
Potaro/Siparuni
Pomeroon/Supenaam
Mahaica/Berbice
Essequibo I./West D.
East Berbice/Corentyne
Demerara/MahaicaCuyuni/Mazaruni
Barima/Waini
Per
cent
age
of P
. fal
cip
arum
cas
es
1 6 2

R e P O R t O n t H e S i t uAt i O n O f M A l A R iA i n t H e A M e R i c A S , 2 0 0 8 G u YA nA 1 6 3
Figure 16. Annual Parasite Index (API) by districts (ADM2), 2008
Legend
Municipal API
0.01
0.1
1
10
100
Suriname
Guyana
Brazil
Venezuela
Figure 17. Population by malariatransmission risk, 2008
High risk (API > 10/1000)
Medium risk (1/1000 < API < 10/1000)
Low risk (API < 1/1000)
Malaria free areas (No indigenous transmission)
20%
15%7%
58%
Population
0
Number of cases
0
API
100 200 3002,000 4,000 6,000 400
0.04
0.04
0.05
2.4
7.98
19.87
35.69
89.43
215.45
290.56
11
2
6
247
393
817
692
2,171
2,175
5,113Cuyuni/Mazaruni
Potaro/Siparuni
Barima/Waini
Upper Takutu/U.Essequibo
Upper Demerara/Berbice
Pomeroon/Supenaam
Essequibo I./West D.
East Berbice/Corentyne
Mahaica/Berbice
Demerara/Mahaica
* See Appendix A to the list.
API (cases/ 1000 people at risk)
0 290.56
Figure 18. Annual Parasite Index (API) and numberof cases by district, 2008
R e P O R t O n t H e S i t uAt i O n O f M A l A R iA i n t H e A M e R i c A S , 2 0 0 8G u YA nA
2000
2001
2002
2003
2004
2005
2006
2007
2008 52,428
52,428
52,428
52,428
115,000
115,000
145,000
149,000
146,000
434,015
638,757
586,000
537,000
511,000
556,000
468,000
511,000
511,000
152,314
41,112
41,000
49,000
45,000
30,000
88,000
45,000
45,000
112,466
71,354
71,000
112,000
93,000
63,000
63,000
59,000
59,000
Figure 19. Population by malaria transmission risk, 2000-08
Year Malaria freeareas (Noindigenoustransmission)
Low risk(API < 1/1000)
Medium risk(1/1000 < API< 10/1000)
High risk(API >10/1000)
Year Number of slidesexamined
Number of slidespositive
Slide PositivityRate (%)
2000
2001
2002
2003
2004
2005
2006
2007
2008
Figure 20. Slides examined and Slide Positivity Rate (SPR),2000-2008
8.61
6.55
10.39
18.53
19
14.86
12.44
12.84
11.48
11,815
11,657
21,064
38,984
28866
27,627
21,895
27,122
24,018
137,247
178,005
202,688
210,429
151,938
185,877
175,966
211,221
209,197
Number of cases Number of cases
200020012002200320042005200620072008 137,247
178,005202,688210,429
151,938185,877
175,966211,221209,197
0 100,000 200,000 0 100,000 200,000
Year
Diagnostic Method
Microscopy RDTs
Figure 21. Cases diagnosed by microscopyand RDTs, 2000-08
NA
NA
NA
NA
Figure 22. Number of cases diagnosedand cases treated, 2000-2008
Year2000
2001
2002
2003
2004
2005
2006
2007
2008
Diagnosed cases
Cases treatedDiagnosed casesCases treated
Diagnosed casesCases treated
Diagnosed cases
Cases treatedDiagnosed cases
Cases treated
Diagnosed casesCases treated
Diagnosed casesCases treated
Diagnosed cases
Cases treatedDiagnosed cases
Cases treatedDiagnosed cases
Cases treated
0 20,000 40,000
Number of cases diagnosed/treated
NA- No Data Available
ADM1 Examined Total cases SPR (%)
Figure 23. Slide Positivity Rate (SPR) by ADM1, 2008
Cuyuni/Mazaruni
Potaro/Siparuni
Barima/Waini
Upper Demerara/Berbice
Upper Takutu/U.Essequibo
Pomeroon/Supenaam
Essequibo I./West D.
Demerara/Mahaica
East Berbice/Corentyne
Mahaica/Berbice
4.63
2.19
26.24
7.15
18.18
38.18
1.8
0.06
9.79
22.76
393
692
817
2,175
2
247
6
11
2,171
5,113
8,482
31,593
3,113
30,427
11
647
333
19,402
22,180
22,463
Figure 24. Time span between onset of symptomsand diagnosis, 2008
No Data Available
1 6 4
R e P O R t O n t H e S i t uAt i O n O f M A l A R iA i n t H e A M e R i c A S , 2 0 0 8 G u YA nA 1 6 5
Figure 25. Number and percentageof cases by age group, 2008
Number of cases
<55-1415-49>50 6.1%
81.1%8.4%4.4%
4,000 8,0000
Figure 26. Number and percentageof cases by locality type, 2008
No Data Available
90.9%9.1%
Number of cases
PregnantNot pregnant
Figure 27. Number and percentage of cases in pregnantwomen among women of child bearing age, 2008
0 1000500
Figure 28. Number and percentage of cases, 2008
66.3%33.7%
Number of cases
AmerindianOther
0 4,000 8,000
2000 2001 2002 2003 2004 2005 2006 2007 2008
Year
100
0
20
40
60
80
Per
cent
age
of P
. fal
cip
arum
cas
es
51.3 47.3 48.4 46.942.4
42.2
46.640.1
48.6
Figure 29. Proportion of P. falciparum cases, 2000-2008
2000 2001 2002 2003 2004 2005 2006 2007 2008
Year
Figure 30. Number of ACT treatmentsdistributed by year, 2000-08
Num
ber
of A
CT
trea
tmen
ts
20,000
15,000
10,000
5,000
0 0000
5,2524,520
10,426
17,727
2,580
Figure 31. Indoor residual sprayingcoverage by year, 2000-08
2000 2001 2002 2003 2004 2005 2006 2007 2008
Year
Num
ber
of p
eop
le p
rote
cted
0
6,25
0
1,72
5
0 0 0 0 0 0 0
6,000
4,000
2,000
Figure 32. Number of LLINs distributed by year, 2000-2008
Num
ber
of b
edne
ts
2000 2001 2002 2003 2004 2005 2006 2007 2008
Year
0
10,000
20,000
30,000
4,2875,813
29,577

R e P O R t O n t H e S i t uAt i O n O f M A l A R iA i n t H e A M e R i c A S , 2 0 0 8G u YA nA
Figure 33. Number of ITNs distributed by year, 2000-08
Not Distributed
Figure 34. Sources for malaria control funds by year, 2000-08
2000
NA
2001 2002 2003 2004 2005 2006 2007 2008
Year
US
$
0
1M
2M
Financing sources
USAID
UN agencies
Other bilateral funds
Global Fund
Government
NA - Data not available
1 6 6