11-02-13 UK Renewable Energy Roadmap Update … · Renewable Heat ... nuclear power and carbon...
68
UK Renewable Energy Roadmap Update 2012 27 December 2012
Transcript of 11-02-13 UK Renewable Energy Roadmap Update … · Renewable Heat ... nuclear power and carbon...
UK Renewable Energy Roadmap Update 2012
27 December 2012

UK Renewable Energy Roadmap Update 2012
2
UK Renewable Energy Roadmap Update 2012
3
Contents
Ministerial Foreword ................................................................................................... 4
Executive Summary ................................................................................................... 6
Introduction ................................................................................................................ 9
Background: Renewables Roadmap ...................................................................... 9
Purpose of Roadmap Update ................................................................................. 9
Analysis on Progress and Changes ......................................................................... 10
Energy Demand Projections ................................................................................. 10
Deployment of Renewable Energy to 2020 .......................................................... 10
Technology Cost Projections ................................................................................ 16
Jobs & Investment ................................................................................................ 21
Renewable Electricity ........................................................................................... 25
Solar PV ............................................................................................................... 44
Renewable Heat ................................................................................................... 54
Renewable Transport ........................................................................................... 61
Cross-border Energy Trading and Infrastructure ...................................................... 65

UK Renewable Energy Roadmap Update 2012
4
Ministerial Foreword The Government is committed to supporting renewable energy as part of a diverse, low-carbon and secure energy mix. Alongside gas and low-carbon transport fuels, nuclear power and carbon capture and storage (CCS), renewable energy brings energy security, decarbonisation of our economy and green growth. Since the first Renewable Energy Roadmap in 2011, the UK is on track to meet our first interim target on the way towards our ambitious target of 15% renewable energy by 2020. We have seen a year of vibrant growth and investment that has brought thousands of new jobs and is driving down the costs of renewables. Whilst this Renewable Energy Roadmap focuses on reaching our 2020 targets, it is clear that renewables will have a pivotal role to play in the UK energy mix in the decades beyond.
Between 1 April 2011 and 31 July 2012, DECC collated renewable industry announcements totalling around £12.7bn confirmed and planned investments, with the potential support of around 22,800 jobs. From the 1,000 jobs being delivered by the €2bn Gwynt y Mor offshore wind farm in North Wales to the 8,600 jobs currently supported by the onshore wind sector, the UK economy is reaping the benefits of new investment in renewables.
At the same time, the costs of many important renewable energy technologies are coming down. The cost of solar photovoltaics (PV) installations fell by 50% between summer 2011 and March 2012, which means that large-scale solar electricity is increasingly within our grasp, and for this reason the Roadmap Update includes it for the first time as a key technology. In addition, the Offshore Wind Cost Reduction Task Force has set out a pathway for offshore wind costs to fall by a third by 2020, and the industry are working to achieve that goal through the Offshore Wind Programme Board.
The Government is clear that as costs come down, the unit cost of renewables subsidies must also reduce in order to minimise pressures on consumer bills. Decisions we have taken this year through the Renewables Obligation Banding Review mean that the costs to consumers of subsidising large scale renewable electricity in 2013/14 (as estimated in July 2012) will be £6 less per household than if we had continued with current bands. Household consumers can benefit directly from our plans to launch the domestic Renewable Heat Incentive next year, alongside a reformed small scale Feed-in Tariffs scheme for electricity and the new Green Deal.
The amount of market support to be available for low-carbon electricity investment (under the Levy Control Framework) up to 2020/21 has now been agreed. This will be set at £7.6 billion (real 2011/12 prices) in 2020, and will help diversify our energy mix by increasing the amount of electricity coming from renewables from 11% today to around 30% by 2020, as well as supporting new nuclear power and carbon capture and storage.
We recognise that some communities are uneasy about the pace of development of onshore wind. Government is sensitive to these concerns. Through the call for

UK Renewable Energy Roadmap Update 2012
5
evidence on onshore wind launched in September we want to ensure that communities can have more of a say over developments, and can benefit directly if wind farms are sited nearby and that wider investment and employment benefits are felt locally. Changes put in place through the localism agenda will enable more local communities to have a bigger say and stake in planning decisions and ensure that renewables projects are well-sited.
While recognising that there are different approaches to some matters of energy policy in different parts of the UK, this new Renewable Energy Roadmap has been produced in collaboration with other governmental departments and the Devolved Administrations, working together to deliver the actions it sets out towards a cleaner, affordable, more secure energy future for the UK.
Rt. Hon. Edward Davey MP
Secretary of State for
Energy and Climate Change
Carwyn Jones AM
First Minister of Wales
Arlene Foster, MLA
Minister of Enterprise Trade and Investment
Fergus Ewing MSP
Minister for Energy, Enterprise & Tourism

UK Renewable Energy Roadmap Update 2012
6
Executive Summary
The Coalition Government is committed to increasing the deployment of renewable energy across the United Kingdom (UK). This, the first annual update to the Renewable Energy Roadmap (the Roadmap) published last July, shows both strong growth in renewable electricity deployment over the last year and that the UK is on track to meet the first interim target on the way to the ambitious target of 15% renewable energy consumption by 2020. This update sets out the progress and changes delivered in the sector over the past year, and set out the challenges and actions for the year ahead. In 2011, renewable energy accounted for 3.8% of energy consumption, up from 3.2% in 2010. We expect it to increase to over 4% in line with the first interim target on the way to 2020.
Renewable electricity has seen dramatic growth since the Roadmap was published last year. In the year July 2011 to June 2012, the total electricity generation from renewables increased by 27% reaching 37.9TWh from a total of 14.4GW installed capacity.
Both offshore and onshore wind showed a marked increase in installed capacity, up 60% to 2.5GW and up 24% to 5.3GW respectively over the period.
The UK’s first coal-fired to biomass-fired electricity generation conversion opened during 2012 at Tilbury, and a second is soon to follow at Ironbridge.
Solar photovoltaics (solar PV) recorded the highest growth with a five and a half times increase in capacity to 1.4GW by the end of June 2012 compared to June 2011. Solar PV is now identified as a key technology in this Renewable Energy Roadmap Update (the Update) as costs have fallen dramatically and deployment increased markedly.
In 2011, around 14TWh of UK heat was generated from renewable sources, an increase of 5% over the year. Renewable transport is on track to meet the interim transport target, as defined by the Renewable Transport Fuel Obligation, of around 5% by 2013/2014.
We expect growth across all sectors to continue or increase. There is a strong pipeline for offshore and onshore wind, bioenergy and large-scale solar PV projects. Significant growth in industrial and domestic wood use and heat pump installations is also expected once the positive impacts of the Renewable Heat Incentive (RHI) and Renewable Heat Premium Payment (RHPP) are fully embedded.
Policy developments over the year fulfilled the commitments made in last year’s Roadmap. 72 of the 110 actions set out there are now complete and we have made good progress on the remaining 38. The Government launched the RHI in November 2011 supporting commercial, industrial and community renewable heating installations, over 650 of which have accredited under the scheme in its first year. The Government has consulted on proposals to expand the incentive to domestic installations. Alongside the RHI , the RHPP Scheme has provided grant

UK Renewable Energy Roadmap Update 2012
7
funding for domestic renewable heat installations. The Department of Energy and Climate Change (DECC) published a strategic framework for heat ‘The Future of Heating’ in March 2012, shortly followed by a Bioenergy Strategy to guide policy decisions in these sectors.
Renewable Transport policy development has focussed on continuing advances towards delivering genuine greenhouse gas savings in the sector. Biofuels play a role in our efforts to tackle climate change but it is crucial that any biofuels used are sustainable and lead to a worthwhile reduction in greenhouse gas emissions. The UK has long called for the key issue of indirect land use change (ILUC) to be addressed. The UK welcomes the work undertaken by the European Commission to bring forward a proposal on ILUC and is considering its response.
In the electricity sector, the Government published the Renewables Obligation (RO) Banding Review in July 2012, setting new tariffs for most technologies for 2013-17. The Feed-in Tariffs (FITs) scheme for small scale renewable and low-carbon electricity installations has been revised so that it is on a sound and sustainable footing. The Energy Bill has been published and is a key milestone in the Government’s Electricity Market Reform (EMR) programme. The new Contracts for Difference (CfDs) available from 2014 will deliver stable financial incentives for low-carbon electricity development, bringing greater certainty for investors and lower costs for consumers.
The RO banding changes are estimated to deliver 11TWh more generation annually from 2016/17 compared to current bands and will cost the average household £6 less in 2013/14 than previously planned (as estimated in July 2012). For specific technologies, cost reduction is most evident in the steeply declining cost of solar PV, with costs estimated to have fallen by up to 50% between summer 2011 and March 2012. In addition, the recent Offshore Wind Cost Reduction Task Force identified the potential for the levelised cost of offshore wind to reach £100 per MWh by 2020, and the capital costs of onshore wind are projected to fall by around 3.6% between 2011/12 and 2015/16. The amount of market support to be available for low-carbon electricity investment (under the Levy Control Framework) up to 2020 has now been agreed. This will be set at £7.6 billion (real 2011/12 prices) in 2020/21 and will help diversify our energy mix by increasing the amount of electricity coming from renewables from 11% today to around 30% by 2020.
Renewable energy is supporting jobs and investment in the UK throughout the supply chain. Sources indicate that the Renewables sector (covering electricity, heat and transport) currently supports around 110,000 jobs directly and in immediate supply chains, with around 160,000 jobs supported further along the supply chain. By 2020, the sector could support around 400,000 direct and immediate supply chain jobs and many more further along supply chains. In advanced engineering and environmental technology sectors, renewable energy represented the largest source of inward investment projects in 2011/12. Between 1 April 2011 and 31 July 2012, DECC collated renewable industry announcements totalling around £12.7bn of confirmed and planned investments, with the potential support of around 22,800 jobs, bringing economic growth to

UK Renewable Energy Roadmap Update 2012
8
every part of the country. Many more jobs and substantial investments have come from hundreds of thousands of small-scale renewables projects, particularly in solar PV. Offshore wind developers have a vision for a minimum of 50% UK content (i.e. 50% of the total value of the windfarm is spent in the UK) and industry is working in partnership with DECC and the Department for Business, Innovation and Skills (BIS) to realise this vision. The sector strategy for offshore wind, being developed jointly by Government and industry as part of the wider industrial strategy programme, will promote innovation, investment and economic growth in the UK.
While the benefits of renewable energy on a large scale are important for the UK, the benefits of smaller-scale projects are also being realised. The Coalition Agreement included a commitment to supporting community energy projects, which can play an important part in raising awareness about low carbon energy and in giving communities control over their own energy supply. Policies such as the FITs scheme and the RHPP communities scheme are designed to allow support for community energy projects. Additionally, at a local level the Government is sympathetic to the concerns of communities about developments in their areas. We have undertaken a call for evidence on costs and onshore wind community engagement and benefits, looking at how communities can have more of a say over, and receive greater benefit from, hosting onshore wind in their area.
Looking ahead, the Government is taking forward a robust programme of work in renewable energy policy. This document sets out the actions that will be needed over the next year – by Government, Devolved Administrations, industry and others - to achieve the growth potential of renewables, in ways that are affordable and give confidence to investors, consumers and communities hosting renewable energy developments. Key priorities will be to introduce the domestic RHI, implement the RO banding review, legislate for EMR and set strike prices for the new CfDs.

UK Renewable Energy Roadmap Update 2012
9
Introduction
Background: Renewables Roadmap
1.1 The UK is legally committed to delivering 15% of its energy demand from renewable sources by 2020 contributing to our energy security and decarbonisation objectives. This commitment is shared by the Devolved Administrations, who have set themselves challenging domestic targets for the level of both renewable electricity and heat consumption by 20201.
1.2 Last year, DECC published the Renewable Energy Roadmap2, which presented the framework for the delivery of renewable energy deployment in the UK as well as a comprehensive programme of action. Over the last year, the Office for Renewable Energy Deployment (ORED) has continued to work with industry, investors, the Devolved Administrations and others to deliver this programme and with it a substantial increase in the amount of renewable energy deployed across the country. We committed to publishing annual updates of the Roadmap to provide information on progress and changes in renewable energy over each year and our journey towards the 2020 target.
1.3 Whilst the Renewable Energy Roadmap focuses on reaching our 2020 targets, it is clear that renewables will have a pivotal role to play in the UK energy mix in the decades beyond. The Climate Change Act requires the UK to reduce greenhouse gas (GHG) emissions by at least 80% below 1990 levels by 2050. In the interim, our legislated Carbon Budgets require cuts in emissions to keep us on track to meet this.
1.4 Recent DECC analysis shows that electricity demand is likely to increase by between 30% and 100% by 2050. This is because heating, transport and industrial processes will need to increasingly be electrified. DECC modelling3 estimates that under a range of scenarios (with average emission intensity at 100gCO2/kWh) renewable electricity could deliver a total capacity of up to 72GW by 2030 depending upon build rates and costs.
Purpose of Roadmap Update
1.5 This annual Roadmap Update provides analysis on the progress and changes over the year including energy demand projections, renewable energy deployment to 2020, and technology cost projections. Updates on renewable jobs and investments are provided as well as specific information covering deployment, project pipelines, new actions, and case studies on each of the key technologies. Solar PV is now included as a key technology and energy trading and infrastructure is also described in an individual section.
1 DECC (2011) UK Renewable Energy Roadmap, p9 http://www.decc.gov.uk/assets/decc/11/meeting-energy-
demand/renewable-energy/2167-uk-renewable-energy-roadmap.pdf 2 DECC (2011) UK Renewable Energy Roadmap
http://www.decc.gov.uk/en/content/cms/meeting_energy/renewable_ener/re_roadmap/re_roadmap.aspx 3 DECC (2012) Gas Generation Strategy Modelling, DECC Gas Generation Strategy
http://www.decc.gov.uk/en/content/cms/meeting_energy/oil_gas/gasgenstrat/gasgenstrat.aspx#

UK Renewable Energy Roadmap Update 2012
10
Analysis on Progress and Changes
2.1 This chapter examines the most recent data on deployment levels and outlines the changes that have occurred over the past year. It also sets out our analysis of the deployment pipeline for key technologies, identifying areas where changes have taken place.
2.2 Last year’s Roadmap set out 110 actions. We have completed 72 of these and 38 are currently commenced and ongoing. Our progress in delivery against each of the actions is set out in Annex A (Annex of Actions).
Energy Demand Projections
2.3 As highlighted in last year’s Roadmap, one of the key uncertainties in defining deployment ambitions is predicting future energy demand. Over the year, the Government’s estimate of energy consumption in 2020 has been revised downwards, meaning the 15% target for renewable energy deployment has also reduced from last year’s central estimate of 234TWh to a new range of 223-230TWh covering heat, transport and electricity4.
2.4 In the short to medium term the estimates for electricity demand are lower than previously projected. This is primarily due to revised Office for Budget Responsibility economic output projections (Gross Domestic Product (GDP) update) which projects demand for total electricity to be around 3% lower (approximately 10TWh) in 2015. In the long run however, the impact of lower GDP is largely offset by other factors, in particular, higher Office for National Statistics population projections and rail electrification.
Deployment of Renewable Energy to 2020
2.5 The Government continues to believe that encouraging a diverse mix of energy sources, including renewables, is the best way to meet our decarbonisation objectives, protect consumers against rising energy prices and ensure the lights stay on. It remains true, as stated in the Overarching National Policy Statement for Energy5, that there is an urgent need for new large-scale renewable energy projects to ensure that we meet the 2020 target and wider decarbonisation ambitions.
4 DECC (2012) Analysis based on Energy and Emissions Projections
http://www.decc.gov.uk/en/content/cms/about/ec_social_res/analytic_projs/en_emis_projs/en_emis_projs.a
spx 5 DECC (2011) Overarching National Policy Statement for Energy
http://www.decc.gov.uk/assets/decc/11/meeting-energy-demand/consents-planning/nps2011/1938-
overarching-nps-for-energy-en1.pdf

UK Renewable Energy Roadmap Update 2012
11
2.6 Last year’s Roadmap provided an analysis of potential deployment to 2020 taking into account factors such as technology cost, build rates and the policy framework. These variables were modelled to produce illustrative ‘central ranges’ for deployment based on analysis using published literature and discussions with industry overlain by industry high and low scenarios for each technology around central ranges. These central ranges did not represent technology specific targets or the level of our ambition. We committed to update our analysis annually to reflect the evolution of policy and observed levels of deployment.
2.7 The Government has now agreed a Levy Control Framework (LCF)6 to 2020/21 consistent with the Electricity Market Reform White Paper. The LCF will be set at £7.6 billion (real 2011/12 prices) in the final year – a tripling of support (in real terms) for low-carbon energy which will enable us to meet our renewables goals and DECC will have full flexibility to allocate resources within this budget without ringfences. We are accordingly confident that the UK can deliver around 30% of electricity generation from renewable sources by 2020.
2.8 Key uncertainties continue to include future energy demand, cost trajectories of technologies, and the level of renewable energy deployment which industry believes can be achieved.
2.9 Last year’s Roadmap sets out the potential for growth in offshore wind generation to 2020 with up to 18GW if costs come down. It recognised that the UK has the best offshore wind resources in Europe. Since then, the industry-led Offshore Wind Cost Reduction Task Force7 has set out a number of steps which would support sustainable cost reduction within the industry, and the Crown Estate’s cost reduction pathways work set out possible cost reduction trajectories finding that with deployment at scale and industry learning, achieving £100/MWh is challenging but achievable. There are clearly big challenges to overcome, for example ensuring sufficient supply chain capacity, and bringing forward new investment in a difficult economic climate. The Government is working with industry to address barriers to deployment, cost reduction and supply chain development.
2.10 Last year’s Roadmap suggested that we could see up to around 13GW of onshore wind capacity by 2020. Since last year we have had an increase of 1.3GW in operational capacity (between January 2011 and end of June 2012) and the onshore wind pipeline holds an additional 6.1GW of projects awaiting or under construction as well as 7GW awaiting planning approval68. The current pipeline is likely to have the potential to provide the appropriate quantity of deployment to fulfil our ambition outlined last year. However, we cannot be certain how much of the capacity in the pipeline projects will go forward as not everything in the pipeline will be consented and not everything consented will be built.
6 Some policies are funded by way of mandatory obligations on energy companies. The Levy Control
Framework is a control mechanism designed to limit the extent of these obligations. 7 DECC (2012) Cost Reduction Task Force report
http://www.decc.gov.uk/en/content/cms/meeting_energy/wind/offshore/owcrtf/owcrtf.aspx

UK Renewable Energy Roadmap Update 2012
12
2.11 Last year’s Roadmap indicated that biomass electricity could contribute up to 6GW by 2020. As of the end of June 2012, there was 3.4GW of operational biomass electricity capacity50 in the UK and a healthy pipeline of projects exists. Since the 2011 Roadmap we have received evidence of increased potential of enhanced co-firing and biomass conversion, which could raise the upper bound of the range suggested in last year’s Roadmap.
2.12 This year’s Roadmap sets out the Government’s view that solar PV has the potential to form a significant part of our renewable energy generation mix, and analysis shows that the market could bring forward between 7 to 20GW of solar PV by 202074,75.
2.13 Overall, the potential for key technologies (biomass electricity, offshore wind, onshore wind, marine energy, solar PV, biomass heat, ground source and air source heat pumps, and renewable transport) needed to deliver the 2020 target is similar to that anticipated last year. The uncertain nature of deployment across the portfolio of technologies as well as their relative cost effectiveness means that generation may end up at the high end of one technology’s deployment range and therefore requiring less deployment of others. DECC will continue to model detailed projected deployment using our Dynamic Dispatch Model (DDM), refining our projections for each technology early in 2013.
Progress in Deployment
2.14 Using the methodology required by the EU Renewable Energy Directive, 3.8% of UK energy consumption in 2011 came from renewable sources; this is up from 3.2% in 20108. Progress is illustrated in Figure 1 and we are on track to meet our next interim target on the way to meeting the 2020 target.
8 DECC (2012) Digest of UK Energy Statistics (DUKES) 26 July 2012,
http://www.decc.gov.uk/en/content/cms/statistics/publications/dukes/dukes.aspx#

UK Renewable Energy Roadmap Update 2012
13
Figure 1 Progress in Renewable Electricity, Heat and Transport9
2.15 Good progress is also being made in the Devolved Administrations against their own targets.
Northern Ireland:
• The Northern Ireland Executive’s Programme for Government 2008 to 2011
target of 12% electricity consumption from renewable sources by 2012 was
exceeded during the year10.
• The Northern Ireland Executive’s Strategic Energy Framework has set a target
of 40% electricity consumption from renewable sources by 2020 and the new
Programme for Government 2011-2015 includes an interim target of 20%
electricity consumption from renewable sources by 2015.
Scotland:
• The update to the Scottish Government’s Renewables Routemap was
published on 30 October 2012 and includes a new interim target to meet the
equivalent of 50% of Scottish electricity demand from renewables by 201511.
9 DECC (2012) Data from Digest of UK Energy Statistics (DUKES) published 26
th July 2012.
http://www.decc.gov.uk/en/content/cms/statistics/publications/dukes/dukes.aspx# and analysis based on
Energy and Emissions Projections, October 2012,
http://www.decc.gov.uk/en/content/cms/about/ec_social_res/analytic_projs/en_emis_projs/en_emis_projs.a
spx 10
Over the twelve month rolling period to end March 2012, on average, 14.3% of electricity consumption was
from renewable sources. 11
Scottish Government (2012) 2020 Renewable Routemap for Scotland Update
http://www.scotland.gov.uk/Topics/Business-Industry/Energy/UpdateRenewableRoutemap

UK Renewable Energy Roadmap Update 2012
14
– Electricity - The Scottish Government target is for renewables to generate the equivalent of 100% of gross annual electricity consumption by 2020, with an interim target of 31% by 2011. Final annual generation statistics for 2011 show Scotland generated 13.7TWh of electricity from renewable sources. Using 2010’s gross consumption as a proxy for 2011, around 35 per cent of Scotland’s electricity needs came from renewables in 2011, surpassing the interim target12
. – Heat - The Scottish Government has a target for the equivalent of 11%
of heat demand to come from renewable sources by 2020. Steady progress is being made, with the latest figure of 3.8% in 2011 showing an increase of more than 35% from the previous year13.
– Community & Locally Owned Energy - The Scottish Government has a target for at least 500MW of renewables installed capacity to be in local or community ownership by 2020. In 2011, 147MW of installed capacity was owned this way14.
Wales:
• The Welsh Government does not have devolved renewable energy targets
although progress can be shown through deployment of major renewable
projects including:
– Gwynt-y-Mor 576MW offshore wind farm is scheduled to be fully operational by the end of 2014.
– Pen y Cymoedd 256MW wind farm was consented this year and is due to become fully operational in 2016.
– The Planning Inspectorate (PI) has concluded its examination of Brechfa Forest (between 56-84MW) and a decision will be made by UK Government Ministers in March 2013.
12
Scottish Government (2012) Energy statistics summary
http://www.scotland.gov.uk/Topics/Statistics/Browse/Business/Energy/energysumsep2012 13
Scottish Government (2011) Renewable Heat in Scotland, A report by the Energy Saving Trust for the
Scottish Government http://www.energysavingtrust.org.uk/scotland/Take-action/Get-business-
funding/Renewable-Heat-in-Scotland-2011 14
Scottish Government (2012) Community and locally owned renewable energy in Scotland, A report by the
Energy Saving Trust for the Scottish Government
http://www.energysavingtrust.org.uk/scotland/Publications2/Communities/Community-and-locally-owned-
renewable-energy-PDF

UK Renewable Energy Roadmap Update 2012
15
Case study: Energy Wales - A Low Carbon Transition (March 2012)15
The Welsh Government is taking advantage of the transition to a low-carbon economy. The Welsh Government's approach focuses on ensuring Wales is an excellent place to conduct business and make long-term energy capital investments. A number of actions are being progressed to realise this ambition. They are:
• streamlining the approach to planning and consenting of energy
developments. For example, they will establish a new Natural Resources
Body for Wales by April 2013, bringing together the functions of a number of
statutory bodies, and they are currently reviewing the existing consenting
regimes for energy developments with a view to introduce any necessary
legislative changes through a Planning Bill.
• implementing Wales’ Infrastructure Investment Plan to ensure that future
investment is clearly and strategically prioritised and supports renewable
energy deployment.
• coordinating and prioritising delivery through a cross-government Energy
Programme.
Alongside providing industry with long-term investment certainty, Energy Wales emphasises the importance of ensuring that energy developments deliver long-term economic benefits, particularly for communities impacted by energy infrastructure developments. Wales aims to position itself at the forefront of the innovation, research and development in low-carbon technologies. The Energy Programme is now co-coordinating and prioritising efforts in Wales to exploit the benefits associated with renewable technologies.
15
Welsh Government (2012) Energy Wales: A Low Carbon Transition,
http://wales.gov.uk/docs/desh/publications/120314energywalesen.pdf

UK Renewable Energy Roadmap Update 2012
16
Technology Cost Projections
Electricity Levelised Cost Ranges
2.16 Since last year, there have been a number of changes to the levelised costs of renewable electricity technologies. There has been a dramatic reduction in the cost of solar PV; between summer 2011 and March 2012 costs are estimated to have fallen by up to 50%16,17.
2.17 Additionally, evidence gathered during the RO Banding Review (based on an independent study by Arup18 updated with evidence received from generators, manufacturers and independent third parties during the consultation in January 2012) shows capital costs for onshore wind are expected to fall by 3.6% between 2011/12 and 2015/16. However, we also recognise the risk that costs could fall more or less swiftly than expected, and therefore committed to completing the recently closed Call for Evidence to examine the latest onshore wind costs.
2.18 We expect the cost of electricity generation from renewable technologies to decrease for most technologies by 2020 due to learning associated with increased deployment as outlined in last year’s Renewable Energy Roadmap. The cost of offshore wind has scope to decrease further if the recommendations of the Cost Reduction Task Force (CRTF) are implemented (see box below).
2.19 The relative cost of renewable technologies compared to Combined Cycle Gas Turbine (CCGT) will depend on the progression of costs and fuel prices over the next decade. Under a central gas fuel price, the cheapest onshore wind is expected to become competitive with CCGT within the next few years19.
16
Updates to the Feed-in Tariff Model Documentation of Changes for solar PV Consultation, 26 October 2011,
Cambridge Economic Policy Associates Ltd and Parsons Brinckerhoff
http://www.decc.gov.uk/assets/decc/11/consultation/FITs-comp-review-p1/3365-updates-to-FITs-model-
doc.pdf 17
Solar PV Cost Update, May 2012, Parsons Brinckerhoff http://www.decc.gov.uk/assets/decc/11/meeting-
energy-demand/renewable-energy/4290-solar-pv-cost-update-report--3-feb-2012-.pdf 18
Review of Generation costs and deployment potential of renewable electricity technologies in the UK, Arup,
October 2011 http://www.decc.gov.uk/assets/decc/11/consultation/ro-banding/3237-cons-ro-banding-arup-
report.pdf 19
Assumes the Carbon Price Floor is in place.
http://www.decc.gov.uk/en/content/cms/about/ec_social_res/analytic_projs/gen_costs/gen_costs.aspx

UK Renewable Energy Roadmap Update 2012
17
Case study: Offshore Wind Cost Reduction Task Force20
The Renewable Energy Roadmap 2011 set out that up to 18GW of offshore wind could be deployed by 2020 if costs come down. An industry-led CRTF, chaired by Andrew Jamieson (Chair of Renewable UK) was established to set out a path and an action plan to bring costs down to £100/MWh by 2020. The CRTF reported to Ministers on 13 June 201221. Alongside this, the Crown Estate’s ‘Offshore Wind Cost Reduction Pathways Study’ set out the evidence on pathways to deliver the cost saving opportunities that are available and achievable by 202022.
The report concluded that the cost of offshore wind can reach £100MW/h by 2020, based on the evidence gathered and assuming that recommendations are followed. The CRTF focussed on 6 key areas that offer opportunities to reduce costs: supply chain, innovation, contracting strategies, planning and consenting, grid and transmission, and finance.
Among the 29 recommendations, the CRTF particularly highlighted that more efficient contracting and collaborative working has the potential to be transformative in lowering costs. The CRTF also recognised work being done to attract turbine manufacturing to the UK. It noted that whilst areas within the UK supply chain are performing well, UK Government and industry need to focus on key supply chain constraints that have the potential to delay the delivery of projects (e.g. castings and forgings and cables). Working with UK Trade and Industry (UKTI) and The Crown Estate, DECC, within wider work on supply chain issues23, is taking forward a programme of cable manufacturer engagement24 25.
As recommended by the CRTF, the Government has established an industry led Offshore Wind Programme Board to drive forward the development of the UK offshore wind sector and supply chain, by proactively addressing barriers to deployment, cost reduction and supply chain development.
20
Photograph courtesy of JDR Cables. 21
DECC (2012) Cost Reduction Task Force Report
http://www.decc.gov.uk/en/content/cms/meeting_energy/wind/offshore/owcrtf/owcrtf.aspx 22
The Crown Estate (2012) Cost Reduction Task Force Report
http://www.thecrownestate.co.uk/media/305094/Offshore%20wind%20cost%20reduction%20pathways%20s
tudy.pdf 23
The Crown Estate (2011) Round 3 Progress in Building offshore wind supply Chain
http://www.thecrownestate.co.uk/media/275201/towards_round_3_progress_in_building_offshore_wind_su
pply_chain.pdf 24
The Crown Estate (2012) Press Release “Opportunity for Cable Suppliers to address offshore wind gap”
http://www.thecrownestate.co.uk/news-media/news/2012/opportunity-for-cable-suppliers-to-address-
offshore-wind-gap/ 25
The Crown Estate (2012) Cable Consulting International’s Cable Manufacturing Capability Study
http://www.thecrownestate.co.uk/media/341885/Windfarm%20export%20cable%20market%20study.pdf

UK Renewable Energy Roadmap Update 2012
18
Heat Levelised Cost Ranges
2.20 Industrial, commercial or public sector heat installations are typically larger than those at a domestic scale, and therefore benefit from economies of scale. These differences lead to distinct ranges of levelised heat costs, presented below in Figure 2 and Figure 3. The distinction between domestic and non-domestic heat has also been taken into account in the design of the Renewable Heat Incentive (RHI), which offers separate schemes for non-domestic and domestic heat generators, which is now reflected in this Update.
2.21 The estimated levelised costs of renewable heating technologies have increased in the last year due to a number of factors including increases in the price of electricity, uncertainty around biomass prices, widening assumptions on suitability of domestic application and inflation from 2010 to 2012 prices.
Figure 2 Estimated and Projected Levelised Cost Ranges for Non-Domestic Heat Technologies in 2010 and 202026
26
Figure on the basis of 2012 prices. New work on cost data on Renewable Heat technologies currently
underway and expected to be published early 2013. The levelised cost calculations take account of operational
expenditure over the lifetime of the technology, capital expenditure, as well as barrier costs in the case of
renewable technologies. A 12% rate of return on capital expenditure has been assumed and a social discount
rate of 3.5% has been applied in all present value calculations for non-domestic technologies. A 7.5% rate of
return on capital expenditure has been assumed and a social discount rate of 3.5% has been applied in all
present value calculations for domestic technologies. The graphs do not include levelised cost estimates for
biogas as these are uncertain and currently being consulted on.

UK Renewable Energy Roadmap Update 2012
19
Figure 3 Estimated and Projected Levelised Cost Ranges for Domestic Heat Technologies in 2010 and 202026
Case study: Bioenergy Strategy
In April 2012 the Government published its Bioenergy Strategy27. The strategy sets out the Coalition Government’s approach to securing the benefits of bioenergy by establishing a framework for policy development that helps ensure bioresources are utilised sustainably in the UK from 2020-2050 for the heat, electricity and transport sectors. The Strategy also provides a response to the main recommendations set out in the Committee on Climate Change’s Bioenergy Review, published in December 201128.
The Strategy’s overarching principle is that bioenergy must deliver genuine carbon reductions, and the role for the UK Government is to steer sustainable development of bioenergy in the UK, and as far as possible internationally. To deliver this outcome, the Strategy set out four key principles that will govern policies and bioenergy deployment going forward. Bioenergy policies should:
• Offer genuine carbon savings to 2050 and beyond.
• Be cost-effective in meeting energy and climate change objectives.
• Take into account the needs of the wider bioeconomy (i.e. must not starve
non-energy sectors of feedstocks, particularly when they offer significant long
27
DECC (2012) UK Bioenergy Strategy
http://www.decc.gov.uk/en/content/cms/meeting_energy/bioenergy/strategy/strategy.aspx 28
Committee on Climate Change (2011) Bioenergy Review http://www.theccc.org.uk/reports/bioenergy-review

UK Renewable Energy Roadmap Update 2012
20
term carbon abatement opportunities).
• Monitor and be ready to respond to any risks to key priorities such as food
security and biodiversity.
The Strategy considered both the wider opportunities offered by biomass, such as contribution to a diversified energy mix that improves energy security, and the risks such as the uncertainty over the long term availability of sustainable bioresources. It concluded that uncertainties are not so great as to justify inaction, and using current evidence, identified a set of low risk sustainable deployment pathways for biomass in the context of our future energy system.
Provided the right mechanisms are in place to ensure sustainability, analysis indicates that by 2020 as much as 11% of the UK’s total primary energy demand (across heat, transport and electricity) could come from bioenergy without significant impacts on food production or the environment. In the longer term, bioenergy contributions will depend significantly on the costs of accessing biomass supplies in international markets. As demand for feedstock is expected to intensify leading up to 2050, analysis suggests around 12% of the UK’s total primary energy demand could come from biomass (within a wide range of 8%-21%). These potential penetration levels are consistent with other studies in this area, but remain highly uncertain.
Follow on actions include consulting on revised sustainability criteria that sets out a GHG target trajectory, formally linked to RO eligibility, that tightens at 5-year intervals. Proposals also include bringing in criteria specific to woodfuel based on established sustainability schemes for forests such as the Forest Stewardship Council (FSC) and the Programme for the Endorsement of Forest Certification (PEFC). The intention is for updated sustainability criteria to be implemented by October 2013 (see Annex of Actions, Annex B: Activities to Deliver Deployment). This will provide greater certainty to secure investment in new generation and sustainable supply-chain development. The Government will also facilitate voluntary action by the Anaerobic Digestion (AD) industry with the aim of avoiding or mitigating risks from the use of crops as a feedstock for AD to food production and enhanced biodiversity and water quality.
UK Renewable Energy Roadmap Update 2012
21
Jobs & Investment
Renewable energy is an attractive market for investors, and is already supporting skills and jobs throughout the supply chain. Since April 2011, DECC has collated industry announcements of renewable energy investments to monitor the increasing activity in the sector. Highlights include:
• £12.7bn total announced investment between 1 April 2011 and 31 July 2012.
• 22,800 total announced jobs between 1 April 2011 and 31 July 201229.
UK Trade and Investment30 (2012) has recorded:
• 71 renewable energy Foreign Direct Investment (FDI) projects into the UK in
2011/12, which generated or safeguarded 2,625 jobs.
• Renewable energy represented the largest source of inward investment in
2011/12 among advanced engineering and environmental technology sectors.
• Renewable energy is the joint seventh largest sector in terms of the number of
FDI projects to the UK recorded in 2011/12.
In addition to current industry investment, there is significant potential for renewables industry potential going forward to 2020. Sources indicate that the renewables sector (covering electricity, heat and transport) currently supports around 110,000 jobs directly and in immediate supply chains, with another 160,000 jobs supported further along the supply chain. By 2020, the sector could support around 400,000 direct and immediate supply chain jobs and many more further along supply chains31.
In 2011, onshore wind supported more than 8,600 jobs. By 2020, there could be around 11,600 direct and supply chain jobs rising to around 15,500 total jobs if wider quantifiable impacts are taken into account32. Offshore wind has the potential to provide the UK with an estimated up to 70,000 jobs and £8bn in annual revenues33. If bioenergy deployment reached the levels predicted in the 2011
29
DECC (2012) Renewable Energy Investment and Jobs
http://www.decc.gov.uk/en/content/cms/meeting_energy/renewable_ener/ored/oredjobs/oredjobs.aspx 30
http://www.ukti.gov.uk/home.html?guid=none 31
The 110,000 and 400,000 are from REA report, Renewable Energy: Made in Britain 2012. The wider supply
chain job estimate is based on the Low Carbon Environmental Goods and Services 2012 study by K-Matrix,
commissioned by BIS. 32
BiGGAR Economics (2012) Onshore Wind: direct & wider economic impacts Report produced for DECC and
RenewableUK http://www.decc.gov.uk/publications/basket.aspx?filetype=4&filepath=11%2fmeeting-energy-
demand%2fwind%2f5229-onshore-wind-direct--wider-economic-impacts.pdf&minwidth=true#basket 33
DECC (2009) A prevailing wind: advancing UK offshore wind deployment
http://www.decc.gov.uk/publications/basket.aspx?filetype=4&filepath=What+we+do%2fUK+energy+supply%2
fEnergy+mix%2fRenewable+energy%2fORED%2f1_20090715171833_e_%40%40_APrevailingWindadvancingU
Koffshorewinddeployment.pdf&minwidth=true#basket based on Carbon Trust (2008) Report Offshore wind
power: big challenge, big opportunity http://www.carbontrust.com/media/42162/ctc743-offshore-wind-
power.pdf

UK Renewable Energy Roadmap Update 2012
22
Renewables Roadmap, then there may be somewhere in the region of 35-50,000 UK jobs in bioenergy by 202034.
Separately, the Offshore Wind Developers Forum has subscribed to a vision for a minimum of 50% UK content (50% of the total value of the windfarm is spent in the UK) from offshore wind projects. DECC, with BIS and the Prime Minister’s office, are working together with the industry to deliver an Offshore Wind Sector Strategy as part of the Government's wider industrial strategy programme.
Case study: Scottish Inward Investment
Scotland has seen a number of major investment decisions in recent months from leading international companies planning to develop their offshore renewables businesses in Scotland:
• Areva announced plans in November 2012 for a new offshore wind
manufacturing plant in Scotland, and their commitment to developing the UK
offshore wind industry creating 750 jobs and many more in the supply
chain35.
• Spanish wind company Gamesa announced in March 2012 that its new UK
new wind turbine manufacturing plant is to be sited at the Port of Leith in
Edinburgh, creating around 800 jobs, with investment up to €150 million36.
The company has already opened a £12.5million Offshore Wind Technology
Centre at Strathclyde Business Park near Glasgow, dedicated to the design
and development of their new offshore wind technology37.
• Samsung Heavy Industries announced in January 2012 that it will base its
first European offshore wind project in Fife in an inward venture worth up to
£100m, creating 500 jobs in Scotland38.
• Mitsubishi Power Systems Europe Ltd unveiled plans in 2010 to invest up to
£100 million in an engineering facility to carry out research and development
into offshore wind turbine technology in Edinburgh, creating up to 200 jobs
over the next 5 years39.
34
NNFCC (2012) UK jobs in the bioenergy sectors by 2020
http://www.nnfcc.co.uk/tools/uk-jobs-in-the-bioenergy-sectors-by-2020-nnfcc-11-025 35
Scottish Government (2012) Press Release ”Energy development opens door to 750 jobs”
http://www.scotland.gov.uk/News/Releases/2012/11/energy-development19112012 36
Scottish Government (2012) Press Release: “Eight hundred renewables jobs for Leith”
http://www.scotland.gov.uk/News/Releases/2012/03/Leith-renewables-jobs23032012 37
Scottish Government (2011) Press Release “Offshore Wind Technology”
http://www.scotland.gov.uk/News/Releases/2011/09/28145922 38
Scottish Government (2012) Press Release: “Samsung chooses Scotland”
http://www.scotland.gov.uk/News/Releases/2012/01/samsung31012012

UK Renewable Energy Roadmap Update 2012
23
Case study: Community Energy
The Coalition Agreement included a commitment to supporting community energy projects, which can play an important part in raising awareness about low carbon energy and in giving communities control over their own energy supply. Policies such as the FITs scheme and the RHPP communities scheme are designed to support community energy projects. Local energy generation is complementary to energy management and energy saving measures, and communities can also play an important role in the delivery of the Smart Meters and Green Deal programmes. DECC has been working with a Community Energy Contact Group to develop a more comprehensive strategy on the issue.
This will aim to establish an integrated and long-term strategic approach to DECC’s community energy activity, recognising and encouraging collective action to purchase, save, manage and generate energy where appropriate. It will seek to engage and motivate communities about where their energy comes from and how they use it, and establish certainty and simplicity around a supportive framework for community energy projects. The strategy will help DECC achieve its policy objectives and empower communities to collectively own, control and benefit from their own energy in locally appropriate ways.
39
Scottish Government (2010) Press Release “Investment in green energy”
http://www.scotland.gov.uk/News/Releases/2010/12/03100354

UK Renewable Energy Roadmap Update 2012
24

UK Renewable Energy Roadmap Update 2012
25
Renewable Electricity
2.22 Electricity generation from renewable sources for the period July 2011 to June 2012 reached 38TWh, increasing by 27% compared to the same period the year before40. Capacity grew by 40% to 14.4GW over the same period. The contribution of all renewables to UK electricity generation was 10.4% for the period July 2011 to June 2012, 2.4% higher than the same period a year earlier. This increasing trend is continuing and we expect to be at more than 17GW by spring 201341.
2.23 This overall trend has been mirrored by individual technologies. Overall wind generation between July 2011 and June 2012 was 34% higher than the same period the year before and installed capacity by end of June 2012 was 34% higher at the end of June 2012 compared with a year earlier.
2.24 Between July 2011 and end of June 2012, offshore wind increased by 944MW bringing total installed capacity to 2.5GW. Generation rose to 6.1TWh for the year July 2011 to June 2012, increasing by 2.1TWh on the year before. Onshore wind capacity increased by 1.1GW over same period bringing total installed capacity to 5.3GW by end of June 2012. Generation rose to 11.2TWh for the year July 2011 to end of June 2012, increasing by 2.3TWh on the year before.
2.25 Bioenergy saw an increase of 900MW between July 2011 and June 2012 with a total installed capacity reaching 3.4GW while generation rose to 14.6TWh for the year July 2011 to June 2012, increasing by almost 1.6TWh compared to the previous period. For solar PV, capacity increased by 1.2GW between June 2011 and end of June 2012 (a 466% increase over that 12 month period).
2.26 Generation from hydro sources during the period July 2011 to end of June 2012 increased by almost 30% on the same period the previous year due to higher rainfall. By the end of October 2012, over 1.5GW of small-scale plant was installed and confirmed on FITs, following the introduction of the scheme in April 2010.
40
Unless otherwise indicated all data on this page from table ET 6.1 and table ET 5.1, Energy Trends,
September 2012 http://www.decc.gov.uk/en/content/cms/statistics/publications/trends/trends.aspx. Biomass
capacity includes co-firing. 41
DECC analysis based on Renewable Energy Planning Database and table ET 5.1, Energy Trends, September
2012 http://www.decc.gov.uk/en/content/cms/statistics/publications/trends/trends.aspx.

UK Renewable Energy Roadmap Update 2012
26
Figure 4 Renewable Electricity Generation42
42
DECC (2012) Digest of UK Energy Statistics (DUKES) published 26 July 2012
http://www.decc.gov.uk/en/content/cms/statistics/publications/dukes/dukes.aspx#

UK Renewable Energy Roadmap Update 2012
27
Biomass Electricity
• During the 12 months to end of June 2012, 38% of the renewable electricity
generated in the UK came from bioenergy43. Half of this was generated from
landfill gas with the remainder from sewage gas, other wastes, wood, bioliquids
and animal and plant residues.
• The Government Response to the Renewable Obligation Banding Review
(published July 201244) set out the intention to focus the deployment of biomass
electricity over the banding review period (2013-2017) on the cheaper and
transitional technologies of conversion and co-firing45 (i.e. coal replacement).
Replacing coal with biomass is lower cost compared to other renewables (since
it involves use of existing assets) with significant carbon savings as it replaces
high carbon coal. Conversions and co-firing can also secure a flexible, though
short term, low-carbon electricity source to maintain security of electricity supply.
• The Government Response to the RO Banding Review set out a cautious
approach to new build dedicated biomass and after a public consultation
launched in September 201246, has announced the introduction of a non-
legislative cap of 400MW on new build dedicated biomass power under the RO.
The limit will be enforced through potential changes to grandfathering policy,
and enabled through a notification process around the point of final investment.
The Government Response to the consultation is available on the DECC web
site47.
• Biomass must be sourced and used sustainably. The Government aims for the
UK to be the first country in the EU to implement mandatory standards for
eligibility for support under the RO, including a tightening trajectory for minimum
GHG emission standards.
• In the Devolved Administrations, the Scottish Government’s Zero Waste Plan
sets out the role of efficient energy from waste technologies. The introduction of
separate food waste collections will offer an excellent opportunity for AD in
Scotland.
43
DECC (2012) Digest of UK Energy Statistics (DUKES) published 26 July 2012,
http://www.decc.gov.uk/en/content/cms/statistics/publications/dukes/dukes.aspx# 44
DECC (2012) Consultation on the Renewables Obligation Banding Review
http://www.decc.gov.uk/en/content/cms/consultations/cons_ro_review/cons_ro_review.aspx 45
The Government Response to the RO Banding Review set out the following bands for biomass co-firing: Low
range (standard) (below 50% co-firing), medium range (50% to below 85% co-firing), and high range (85% to
below 100% co-firing). 46
DECC (2012) Biomass Electricity & Combined Heat & Power plants. Consultation on proposals to enhance the
sustainability criteria and to ensure affordability for the use of biomass feedstocks under the Renewables
Obligation (RO) http://www.decc.gov.uk/assets/decc/11/consultation/ro-banding/6339-consultation-on-
biomass-electricity--combined-hea.pdf 47
DECC (2012) Renewables Obligation Banding Review for the period 1 April 2013 to 31 March 2017:
Government Response to the further consultation on biomass affordability and retaining the minimum calorific
value requirement in the RO. http://www.decc.gov.uk/publications/basket.aspx?filetype=4&filepath=11%2fconsultation%2fro-
banding%2f7328-renewables-obligation-banding-review-for-the-perio.pdf&minwidth=true#basket

UK Renewable Energy Roadmap Update 2012
28
Priority actions: • De-risk the supply chain for sustainable feedstocks and introduce sustainability
standards for solid biomass: The Government will introduce revised
sustainability criteria under the Banding Review with the intention of
implementation by October 2013. These will provide greater certainty needed to
secure investment in new generation and drive further emissions reduction
through the supply-chain.
• Implement the AD Strategy and Action Plan: The Government will complete
implementation of the AD Strategy and Action Plan by summer 2013 (apart from
ongoing actions).
• Reduce barriers for innovative low-carbon technologies: In line with the findings
of the cross government Bioenergy Strategy and the Low Carbon Innovation
Group’s48 Bioenergy Technology Innovation Needs Assessment49, a number of
activities to promote low carbon innovative biomass technologies will be
undertaken.
48
The Low Carbon Innovation Co-ordination Group (LCICG) brings together the major public sector backed
funding and delivery bodies that are supporting low carbon innovation in the UK.
http://www.lowcarboninnovation.co.uk/ 49
LCICG (2012) Technology Innovation Needs Assessment
http://www.lowcarboninnovation.co.uk/working_together/technology_focus_areas/bioenergy/

UK Renewable Energy Roadmap Update 2012
29
Deployment Pipeline
Figure 5 Capacity of biomass electricity projects in the planning pipeline50
2.27 Figure 5 above shows the total biomass capacity (including biomass co-firing and conversions) in the pipeline as of July (operational data) and mid-August (non-operational data) 2012. There has been an additional 1GW operational capacity for biomass electricity in the 18 months since the Roadmap was first published.
50
The operational figure was obtained using the operational baseline 2.4GW (figure 20, UK Renewable Energy
Roadmap (July 2011) http://www.decc.gov.uk/assets/decc/11/meeting-energy-demand/renewable-
energy/2167-uk-renewable-energy-roadmap.pdf) and increasing by the installed biomass electricity capacity
(landfill gas, sewage sludge digestion, municipal solid waste combustion, animal biomass, anaerobic digestion,
plant biomass, co-firing) as of end of June 2012 obtained from table 6.1 Energy Trends, September 2012
http://www.decc.gov.uk/assets/decc/11/stats/publications/energy-trends/5627-energy-trends-june-2012.pdf.
The capacity figures for the “under construction, awaiting construction and applications being considered”
stages are obtained from the DECC’s “Renewable Energy Planning Database (REPD) dated 14 August 2012
(dedicated biomass, landfill gas, municipal and industrial waste, sewage gas)
https://restats.decc.gov.uk/cms/planning-database/. Attrition rates are based on historic consenting rates
taken from the REPD and based on capacity in the pipeline from 2008 to August 2012.

UK Renewable Energy Roadmap Update 2012
30
2.28 Implementation of a cap on dedicated biomass under the Renewables Obligation is expected to limit deployment to centrally forecast levels set out in the Government Response the RO Banding Review, this may impact the pipeline presented in the next Roadmap Update.
Case study: Sleaford Renewable Energy
Construction work on the Sleaford Renewable Energy Plant in Lincolnshire started in May 2012 and the plant is due to enter commercial operation in 2014. Generating electricity from the burning of straw, the 38MW power station is one of the very first of its type to be built in the UK. It will generate electricity for 65,000 homes and employ up to 80 people, and during its two-year construction phase, up to 250 people will work on the site. The generating plant is owned by Eco2 Lincs Ltd.
As well as generating low-carbon electricity, the plant will supply heat to a number of local facilities. The provision of heat is one part of a package of measures that will benefit the town as the plant is built and enters operation. Other measures include a local apprenticeship scheme, funding for community projects and a new cycleway and footpath.
Most of the straw has been secured on long-term contracts with the vast majority coming from farms within 30 miles of Sleaford. Ash produced by the plant will be recycled as crop fertiliser. The generating process at the Sleaford plant will reduce the UK’s carbon emissions by over 150,000 tonnes of CO2 per annum.

UK Renewable Energy Roadmap Update 2012
31
Offshore Wind
• As the most scalable of the UK’s bulk renewable technologies, offshore wind
can be a key part of the UK’s energy mix to 2020 and beyond. Since January
2011, the UK has maintained its position as the global leader in offshore wind in
terms of installed capacity, deployment, capacity increase and market size.
Capacity has increased by almost 1GW since July 2011 to a total installed
capacity of 2.5GW (as of end of June 2012)51. Since July this year, we have
seen more projects completed, taking total capacity to 2.7GW by mid-
November52.
• Recent offshore wind developments include:
- Greater Gabbard completed construction with a capacity of 503MW.
- Ormonde, and Sheringham Shoal officially opened with a capacity of 150MW
and 317MW respectively
- The first Northern Ireland site off the east coast of Northern Ireland has been
leased with a capacity of 600MW to First Flight Wind Limited.
• Last year we judged that if costs come down significantly as the industry
matures, the UK could see up to 18GW of offshore wind deployed by 2020. Over
the last year, the CRTF set out a plan of action to bring costs down to
£100/MWh by 2020. The work of the CRTF and the Crown Estate demonstrates
that this is challenging but achievable.
• Since 2000, the Crown Estate have awarded development rights with the
potential of over 47GW of offshore wind capacity, including the recent leasing of
600MW in Northern Ireland waters53. Beyond 2020, there is a high potential for
deployment with 40GW possible by 203054.
• The number and scale of projects in the pipeline and the potential development
of the supply chain is capable of bringing significant investment and high quality
jobs across the UK, and becoming a strong source of sustainable economic
growth. For example the recent announcement from Areva for a new offshore
wind manufacturing plant in Scotland, which could deliver 750 jobs and many
more in the supply chain55.
• Government will work with industry and the supply chain, including through
development of a Sector Strategy, to make the most of the economic and
industrial benefits offshore wind can bring to the UK. DECC has worked with the
51
Table ET 6.1 and table ET 5.1, Energy Trends, September 2012
http://www.decc.gov.uk/en/content/cms/statistics/publications/trends/trends.aspx. 52
DECC (2012) Renewable Energy Planning Database https://restats.decc.gov.uk/cms/planning-database/ 53
Estimated by the Crown Estate including Round 1, Round 2, extensions to Rounds 1 and 2, Round 3, Scottish
Territorial Waters and Northern Ireland. 54
Based on data collected for the Review of Generation costs and deployment potential of renewable
electricity technologies in the UK, Arup, October 2011
http://www.decc.gov.uk/assets/decc/11/consultation/ro-banding/3237-cons-ro-banding-arup-report.pdf 55
Scottish Government (2012) Press Release “Energy development opens door to 750 jobs”
http://www.scotland.gov.uk/News/Releases/2012/11/energy-development19112012

UK Renewable Energy Roadmap Update 2012
32
Offshore Wind Developers Forum to identify the quantity and type of investment
capital needed. The CRTF and Crown Estate’s Cost Reductions Pathways
Report also examined the challenges of bringing in new finance.
• For local areas, these investments can have a significant impact. In Wales the
Gwynt y Môr project is a £2bn investment, one of the biggest single private
investment projects ever seen in Wales. The 576MW project will create up to
1,000 high quality jobs and contribute many millions of pounds to the regional
economy of North Wales56.
• In Scotland, with an estimated quarter of Europe's offshore wind potential57,
offshore wind resources are being developed in a sustainable way to deliver
maximum environmental and economic benefits.
Priority actions:
• Drive cost reduction and address barriers to deployment with industry:
Government will work with industry, through the Offshore Wind Programme
Board, to drive cost reduction towards £100/MWh and address areas such as
grid and planning/consenting to enable deployment.
• As part of the wider industrial strategy programme, develop an offshore wind
Sector Strategy: The Government will work with industry - engaging with the
Offshore Wind Programme Board - to develop a Sector Strategy for the offshore
wind industry early in 2013. The aim will be to set out a shared vision and action
plan for the development of the offshore wind sector, supporting its contribution
to economic growth and job creation in the UK. This will build on the
recommendations of the CRTF and support progress toward realising the
developers’ aspiration of at least 50% UK content in the supply chain.
• Innovate to reduce costs: The Low Carbon Innovation Co-ordination Group58 will
continue to work together, investing in excess of £100m in this Spending Review
period, in a number of activities to promote the development of innovative
offshore wind technologies. This includes the establishment of the Offshore
Renewable Energy Catapult centre and the ongoing work of the DECC and
Technology Strategy Board (TSB) Offshore Wind Components Technology
Scheme59, offshore wind feasibility studies and knowledge transfer partnerships,
with a combined budget of £21m, aimed to bring cost-lowering ideas into the UK
56
BBC (2010) Press Release “£2bn offshore windfarm to go ahead off north Wales”
http://www.bbc.co.uk/news/10235242 57
Garrad Hassan & Partners (2001) Scotland’s Renewables Resource
http://www.scotland.gov.uk/Resource/Doc/47176/0014633.pdf & European Wind Energy Association (1999)
Wind Force 10 report http://www.inforse.org/doc/Windforce10.pdf . 58
The Low Carbon Innovation Co-ordination Group (LCICG) brings together the major public sector backed
funding and delivery bodies that are supporting low carbon innovation in the UK.
http://www.lowcarboninnovation.co.uk/ 59
Offshore Wind Component Technologies Development and Demonstration Scheme, 2012,
http://www.decc.gov.uk/en/content/cms/funding/funding_ops/innovation/innov_fund/owctdd_scheme/owct
dd_scheme.aspx

UK Renewable Energy Roadmap Update 2012
33
supply chain.
• UK Green Investment Bank (GIB): Bringing in new investment into offshore wind
remains a key challenge for the industry against a backdrop of disrupted long
term capital markets and constrained bank lending appetite. The GIB has now
been established and was formally launched on 28 November 2012. GIB will
initially seek to catalyse institutional capital into operating wind farms allowing
the new capital to be recycled by owners into incremental construction. In due
course, GIB hopes also to catalyse institutional investment directly into the
construction phase itself.
• Planning and consenting: The Government will ensure our consenting decisions
address ongoing scientific uncertainty over the impact of offshore wind
deployment on nature, including by working with industry to plug priority gaps in
the evidence base and establish a “coping strategy” for consenting decisions
that need to be taken before the evidence base is improved.

UK Renewable Energy Roadmap Update 2012
34
Deployment Pipeline
Figure 6 Capacity of offshore wind projects in the planning pipeline60
2.29 The graph above shows the position of all offshore wind farms that have entered the formal planning system for development (as of end of June 2012 for operating projects and August 2012 for pre-operational projects)61.
2.30 In addition, there are proposals in scoping for more than 30GW of further offshore wind farm capacity (including projects in the Round 3 zones that are at the pre-planning stage). As costs come down and the industry matures this has the potential to make a key contribution to the UK’s longer-term decarbonisation objectives.
60
The operational figure was obtained using the operational baseline 1.3GW (figure 15, UK Renewable Energy
Roadmap (July 2011) http://www.decc.gov.uk/assets/decc/11/meeting-energy-demand/renewable-
energy/2167-uk-renewable-energy-roadmap.pdf ) and increasing by the installed offshore wind capacity as of
end of June 2012 obtained from table 6.1 Energy Trends, September 2012
http://www.decc.gov.uk/assets/decc/11/stats/publications/energy-trends/5627-energy-trends-june-2012.pdf.
The capacity figures for the “under construction, awaiting construction and applications being considered”
stages are obtained from the DECC’s “Renewable Energy Planning Database (REPD) dated 14 August 2012
https://restats.decc.gov.uk/cms/planning-database/. Attrition rates are based on historic consenting rates
taken from the REPD and based on capacity in the pipeline from 2008 to August 2012. 61
It should be noted that the operational capacity in this graph includes both projects that are fully completed
and offshore turbines that were (at end of June 2012) generating electricity in partly-completed
developments. This overlap may represent around 1GW of capacity in both the operational and under
construction portions of the chart.

UK Renewable Energy Roadmap Update 2012
35
Case study: Walney Offshore Wind Farm – streamlining deployment
In November 2011, Walney Offshore Wind Farm began supplying electricity to the grid. This combines the Walney 1 and 2 projects and has a total installed capacity of 367 MW. The wind farm has already set a number of industry records, and has delivered approximately 60 jobs at its new operations centre in Barrow-in-Furness.
DONG Energy, with SSE Renewables, Ampere Equity and PGGM, constructed Walney 2 in the fastest ever time for an offshore wind project; work was completed in just over five months. Normally projects are constructed over a two year period - foundations in year 1, turbines in year 2. However on Walney 1 and 2, a new multi contracting strategy involving direct contracts for everything, from geophysical surveys, monopile design and fabrication, to transportation and installation of turbines meant that array cables, wind turbine generators, and foundations were installed concurrently – so reducing offshore construction time by more than 75%.
As noted by the CRTF, innovative contracting approaches such as this hold lessons for the industry to support bringing costs down. The CRTF recommended that a Common Knowledge Forum of senior industry practitioners is established to share experiences and best practice in contacting models.
Walney also marks a new era in terms of financing, as the first offshore wind project in the UK to be partially backed by institutional investors.

UK Renewable Energy Roadmap Update 2012
36
Onshore Wind
• The UK has some of the best wind resources in Europe, and onshore wind is
one of the most cost-effective large-scale renewable energy technologies. The
Government is committed to onshore wind as part of a diverse energy mix
contributing to our security of supply and carbon reduction targets. Between July
2011 and end of June 2012, onshore wind deployment has increased by over
1GW to a total installed capacity over 5.3GW51.
• Onshore wind provides substantial economic benefits. In 2011 onshore wind
supported more than 8,600 jobs contributing over £500 million to the UK
economy. By 2020 there could be around 11,600 direct and supply chain jobs
rising to around 15,500 total jobs if wider quantifiable impacts are taken into
account62.
• The Government is seeking to remove barriers to the development of
appropriately-sited projects, while giving local communities more influence.
Through the National Planning Policy Framework (NPPF)63, the Government
has delivered reform of the planning system to support growth and give local
communities a stronger voice.
• Results of the DECC Public Attitudes Tracking Survey show that the majority of
the public support the growth of onshore wind in the UK64. With this in mind, the
Government is sympathetic to the concerns of communities about developments
in their areas. We have undertaken a call for evidence on costs and
engagement and benefits65, looking at how communities can have more of a say
over, and receive greater benefit from, hosting onshore wind in their area.
• The Government’s response to the RO consultation66 published in July 2012
announced that support for onshore wind from 2013-17 will be reduced by 10%
to 0.9ROCs.
Priority actions:
• Review community engagement and benefits, and costs of onshore wind:
Complete and respond to the Call for Evidence described above; also update
cost information to confirm whether support levels from 2014 are appropriate.
• Minimise investment risk: Following the Call for Evidence on Power Purchase
62
BiGGAR Economics (2012) Onshore Wind: direct & wider economic impacts Report produced for DECC and
RenewableUK http://www.decc.gov.uk/publications/basket.aspx?filetype=4&filepath=11%2fmeeting-energy-
demand%2fwind%2f5229-onshore-wind-direct--wider-economic-impacts.pdf&minwidth=true#basket 63
DCLG (2012)Policy paper National Planning Policy Framework
http://www.communities.gov.uk/publications/planningandbuilding/nppf 64
DECC (2012) Public attitudes tracking survey
http://www.decc.gov.uk/en/content/cms/statistics/public_att/public_att.aspx 65
DECC (2012) Onshore wind call for evidence
http://www.decc.gov.uk/en/content/cms/consultations/onwind_cfe/onwind_cfe.aspx 66
DECC (2011) Consultation on the Renewables Obligation Banding Review
http://www.decc.gov.uk/en/content/cms/consultations/cons_ro_review/cons_ro_review.aspx

UK Renewable Energy Roadmap Update 2012
37
Agreements (PPA) for independent renewable generators, consider the next
steps to ensure that independent renewable generators can continue to play an
active role in the market. Implement proposed EMR and RO transition measures
to secure long term certainty to 2020 and beyond.
• Overcome radar interference with windfarms: We continue to work through the
Aviation Plan with industry and solution providers to overcome windfarm
interference with aviation systems, following the initial roll out of Air Defence
Radar upgrades. Working with industry, establish a radar replacement
programme for National Air Traffic Services (NATS) and seek to develop
mitigation solutions for Military Air Traffic Control radars.
• Business Rate Retention: Work to allow local authorities, on behalf of their
communities, to retain all business rates from renewable energy developments
in England from April 2013.
• Scottish Islands: Work with the Scottish Government and key stakeholders
through the Scottish Islands Renewables steering group to identify the barriers,
costs, options and value for money of increased deployment of wind and other
renewables in the Scottish Islands.
Deployment Pipeline
Figure 7 Capacity of onshore wind projects in the planning pipeline67
67
Based on historic consenting rates, the capacity shown in green could potentially be lost from the pipeline.

UK Renewable Energy Roadmap Update 2012
38
2.31 The chart Figure 7 shows there was an increase of 1.3GW in operational capacity between January 2011 and end of June 2012. Deployment analysis indicates that there is a healthy pipeline of projects that have entered the formal planning system for development. As of August 2012, there was over 18.2GW of onshore wind capacity in the pipeline although not everything in the pipeline will be consented, and not everything consented will be built. Based on historic consenting rates, at least 2.7GW could be lost from the pipeline68 at the planning stage. The majority of the future deployment will be in Scotland.
2.32 We expect significant attrition at the planning stage, and also at the pre-construction stage, due to a number of factors including project delays or extra costs associated with radar interference. These may not have been captured in the historical attrition rates.
2.33 While we cannot be certain which projects will go forward, the current pipeline is likely to represent the appropriate quantity of deployment to fulfil the central estimated range in the 2011 Renewable Energy Roadmap for onshore wind deployment (around 10-13GW capacity).
2.34 In the Devolved Administrations, the Scottish Government has a target for at least 500MW of renewables installed capacity to be in local or community ownership by 2020. In 2011, there was 147MW installed capacity in local or community ownership. In Wales, alongside operational projects, nearly 1GW of on and offshore wind energy has been consented, including the Pen y Cymoedd wind farm, expected to become operational in 2016.
68
The operational figure was obtained using the operational baseline 4.0GW (figure 11, UK Renewable Energy
Roadmap (July 2011) http://www.decc.gov.uk/assets/decc/11/meeting-energy-demand/renewable-
energy/2167-uk-renewable-energy-roadmap.pdf) and increasing by the installed onshore wind capacity as of
end of June 2012 obtained from table 6.1 Energy Trends, September 2012
http://www.decc.gov.uk/assets/decc/11/stats/publications/energy-trends/5627-energy-trends-june-2012.pdf.
The capacity figures for the “under construction, awaiting construction and applications being considered”
stages are obtained from the DECC’s “Renewable Energy Planning Database (REPD) dated 14 August 2012
https://restats.decc.gov.uk/cms/planning-database/. Attrition rates are based on historic consenting rates
taken from the REPD and based on capacity in the pipeline from 2008 to August 2012.

UK Renewable Energy Roadmap Update 2012
39
Case study: Radar Mitigation - Middlemoor Wind Farm (RWE npower) and
Fallago Rig Wind Farm (EDF Energy Renewables)
As part of the planning consents for the 54MW Middlemoor wind farm in Northumberland and 144MW Fallago Rig wind farm in the Scottish Borders the potential impact of the developments on the air defence radar at Brizlee Wood and national security operations of the Ministry of Defence (MOD) required developers to undertake mitigation.
The developers decided to fund a new wind-farm-friendly air defence radar for the MOD which entailed the replacement of the current radar with a Lockheed Martin TPS-77. Since the agreement between RWE npower renewables, Fallago Rig Windfarm and the MOD was signed, Ridgewind’s 20.5MW Wandylaw wind farm in Northumberland has also benefited from the regional mitigation solution. This has the potential to release other well-sited onshore and offshore wind farms that could otherwise impact on the MOD facility.
Through consultation with the MOD, DECC and others, the Scottish Government were able to impose planning conditions which facilitated the consent of Middlemoor and Fallago Rig wind farms, totalling almost 200MW of renewable energy. Both wind farms are now under construction and will be operational in early 2013.

UK Renewable Energy Roadmap Update 2012
40
Marine Energy
• As marine energy matures as a technology, it has the potential to make a
valuable contribution to our renewable energy mix. A range of studies69 have
suggested that development and deployment of wave and tidal energy devices
could expand through the 2020s with perhaps as much as 27GW by 2050.
• The UK is at the forefront of marine energy development with both large and
small innovative enterprises, our energy resources, extensive offshore expertise,
world leading industrial development and testing facilities, and strong support
from the Government.
• Good progress in the sector continues with the development and testing of wave
and tidal devices across the UK and with large manufacturing companies
making significant investment into technology development during 2012.
• Capitalising on progress to date, it is now vital that industry progresses to deploy
commercial-scale arrays supplying electricity to the grid. In the medium term, the
costs of generation will need to fall substantially to enable marine energy to
compete with other low carbon sources. UK expertise, testing facilities, and the
strength of Marine Energy Parks will support technology development and cost
reduction. Government is working with industry through the UK Marine Energy
Programme Board (MEPB) to identify and tackle wider barriers to large scale
deployment.
• The Government is providing high levels of revenue support under the RO and
capital funding through the Marine Energy Array Demonstrator (MEAD) to de-
risk private sector investment in early arrays.
• In Scotland, marine energy is supported by the Marine Renewables
Commercialisation Fund (MRCF), WATERS70, the £103m Renewable Energy
Investment Fund, and the £10 million Saltire Prize. Wales has a strong resource,
with 1200km of coastline, and accessible infrastructure to support up to 6.2GW
(over 10GW including the Severn Estuary) of estimated generating capacity71.
69
DECC (2011) 2050 Pathways Calculator
http://www.decc.gov.uk/en/content/cms/tackling/2050/calculator_exc/calculator_exc.aspx
PIRC (2010) Offshore Valuation Report http://offshorevaluation.org/downloads/offshore_valuation_full.pdf
Ernst & Young, Black & Veatch (2012) Cost and financial support for wave, tidal stream and tidal range
generation in the UK. A report for Department of Energy & Climate Change and the Scottish Government
http://www.decc.gov.uk/assets/decc/what%20we%20do/uk%20energy%20supply/energy%20mix/renewable
%20energy/explained/wave_tidal/798-cost-of-and-finacial-support-for-wave-tidal-strea.pdf
Low Carbon Innovation Coordination Group (2012) Technology Innovation Needs Assessment Marine Energy:
http://www.carbontrust.com/media/168547/tina-marine-energy-summary-report.pdf 70
Scottish Enterprise Wave and Tidal Energy: Research, Development and Demonstration support 2
(WATERS2)
http://www.scottish-enterprise.com/your-sector/energy/energy-how-we-can-help/energy-funding/Wave-and-
Tidal-Energy-Fund.aspx 71
Welsh Government (2012) Energy Wales: A Low Carbon Transition
http://wales.gov.uk/topics/environmentcountryside/energy/energywales/?lang=en

UK Renewable Energy Roadmap Update 2012
41
Priority actions:
• Manage the risks and costs of innovation: The Low Carbon Innovation Co-
ordination Group72 will invest in excess of £80m (to 2015), in a number of
activities to promote the development of innovative marine technologies,
including DECC’s MEAD and Scotland’s MRCF schemes.
• Secure investment for commercial deployment: Work with UK MEPB members
to understand the potential for cost reduction in wave and tidal in the future to
help inform EMR. Enable dialogue between the marine and finance sectors to
make marine energy projects financeable and to reduce investment risk.
• Ensure cost-effective grid investment and connection: Work with the UK MEPB
to ensure the sector provides evidence to existing work to ensure that the
renewable energy in the Scottish Islands is developed to its efficient potential.
Deployment Pipeline
2.35 Over the last year progress has continued with the pre-commercial development of the wave and tidal stream sector. Marine Current Turbines Seagen 1.2MW tidal turbine installed at Strangford Lough in 2008 continues to generate electricity in to the Northern Irish grid; and there are a number of locations across the UK where other large-scale prototypes have been installed in the past 18 months. Plans for deploying the first arrays of wave and tidal stream devices are also progressing, with a number of 5-10MW projects applying for funding from DECC’s Marine Energy Array Demonstrator and the Scottish Government’s MRCF capital grant schemes. Arrays awarded funding through these two schemes should be operational in the next four years.
2.36 In Scotland at the European Marine Energy Centre (EMEC), recent installations include: Aquamarine Oyster 800kW wave energy device; Andritz Hydro Hammerfest Strom HS1000 1MW tidal turbine device which has been generating electricity into the grid since October 2012. Scottish Power Renewables Pelamis P2 750kW wave device; Finnish company Wello Oy 500kW Penguin wave energy device and Seatricity wave devices, who are deploying at Bilia Croo, Orkney. All of the full-scale testing berths in EMEC have now been contracted, with Kawasaki planning to test their tidal turbine in 2013/14 and Bluewater taking a berth to deploy its BlueTEC floating support structure for tidal turbines in the next year. The Scottish Government is working closely with its partners at EMEC and Highlands and Islands Enterprise to develop a number of options to expand the number of testing berths, which will further enhance Scotland and the United Kingdom’s marine renewables industry.
2.37 In Wales, Marine Current Turbines have submitted an application to deploy a 10MW tidal stream array in the Skerries off Anglesey. The project could be the first tidal array in the UK and, subject to securing planning and financing for the
72
The Low Carbon Innovation Co-ordination Group (LCICG) brings together the major public sector backed
funding and delivery bodies that are supporting low carbon innovation in the UK.
http://www.lowcarboninnovation.co.uk/

UK Renewable Energy Roadmap Update 2012
42
project, MCT and RWE npower Renewables are targeting 2014/2015 for the start of commissioning.
2.38 In South West England, Wave Hub is continuing to attract interest from device developers. , Wave Hub is one of the world’s largest grid connected offshore facility for large scale testing of wave energy devices. It forms a key part of the South West Marine Energy Park and is a major part of the UK’s marine energy assets. Wave Hub is essentially an electrical “socket” mounted on the seabed off Hayle, Cornwall in 50 metres of water into which wave energy devices can be plugged for testing. Ocean Energy Limited is working with Wave Hub, to deploy its first full-size device at the site and has applied for a marine licence for this purpose. The 1MW OE Buoy wave energy converter could be the first machine in the water at the four-berth facility. Ocean Energy has completed three years of prototype testing in energetic sea conditions and is ready to take the next step at Wave Hub with a full-scale, grid connected device. If the testing goes well, deployment of an array could follow. US company Ocean Power Technologies have also signed up to trial a 500kW model of its PowerBuoy machine. In addition, Fabtest in Cornwall has commenced testing of Fred Olsen’s BOLT ‘lifesaver’ wave device. In North East England, on the River Humber the Neptune Proteus tidal stream device has been installed to provide electricity to ‘The Deep’ aquarium in Hull.
2.39 In addition to prototype testing, plans for deploying the sector’s first arrays of wave and tidal stream devices are also progressing, with a number of 5-10MW projects applying for funding from DECC’s MEAD and the Scottish Government’s MRCF capital grant schemes. This is the next vital step in order for the sector to deploy large commercial scale arrays supplying electricity to the grid. Funding awarded through these two schemes should see arrays operational in the next four years.
2.40 In October 2012, the Crown Estate announced the results of the first Northern Ireland Offshore Renewable Energy Leasing Round. Tidal Ventures have been offered development rights for 100MW of tidal stream project at Torr Head and DP Marine Energy Limited/DEME Blue Energy have been offered development rights for an additional 100MW tidal stream projects at Fair Head both off the north coast of Northern Ireland. The development of offshore renewables will contribute to Northern Ireland’s renewable electricity target of 40% by 2020.

UK Renewable Energy Roadmap Update 2012
43
Case study: Northern Ireland, McLaughlin and Harvey
In 2012 McLaughlin and Harvey Limited committed significant investment in researching, developing and marketing an innovative and cost-effective system for installing tidal energy devices, supported by Invest Northern Ireland with part funding from the European Regional Development Fund (ERDF).
The firm’s system under development is designed to help reduce the cost of deploying turbines, which will help make the renewable energy sector as a whole more commercially sustainable.

UK Renewable Energy Roadmap Update 2012
44
Solar PV
• The Government believes that solar PV has the potential to form a significant
part of the renewable energy generation mix.
• Currently the UK has 1.4GW of installed solar PV capacity in operation73.
Analysis indicates the market could bring forward a total of 7–20GW74 75 of solar
PV by 2020 (equivalent 6-18TWh).
• Smaller scale (less than 50kW) solar PV installations, supported through the
FITs scheme, are likely to remain the main driver for the growth in solar PV
capacity. Installations sized greater than 50kW have seen a slower rate of
uptake and up until recently, there has been little deployment activity for those
installations greater than 5MW.
• The solar PV sector has seen a dramatic reduction in costs between summer
2011 and March 2012 with installed costs estimated to have fallen by up to
50%76,77. The ability to deliver further reductions in the installed costs of solar
PV will determine the level of sector growth and the ability for the levelised cost
of solar PV to become competitive with other low-carbon electricity sources. The
Government has introduced a cost-control mechanism for the FITs scheme to
promote a predictable and stable environment conducive to sustainable cost
reduction.
• Solar PV benefits from being easy to install on domestic and commercial
buildings, and on the ground. With 82% public support78 it has a role in
connecting individuals, communities and businesses with future deployment of
renewable energy and the transition to the low-carbon economy.
• Further growth of solar PV generation will present new challenges to grid
balancing but this will be aided by generation used onsite along with potential
improvements in storage technology and active network management.
73
DECC (2012) Central FITs register, data as of end of November 2012, published December 2012
http://www.decc.gov.uk/en/content/cms/statistics/energy_stats/source/fits/fits.aspx Covers solar PV
installations confirmed on the scheme. There may be more in operation. Excludes Northern Ireland and RO. 74
Bottom end of range represents the low scenario from FITs 2a Impact Assessment
http://www.decc.gov.uk/assets/decc/Consultations/FITs-review/4320-feedin-tariffs-review-phase-2a-draft-
impact-asses.pdf plus solar PV uptake under the Solar PV Renewables Obligation Impact Assessment
http://www.decc.gov.uk/en/content/cms/consultations/ro_solarpv/ro_solarpv.aspx#. 75
Top end of the range represents modelling data from National Grid (2012), Solar PV briefing note for DECC
http://www.decc.gov.uk/en/content/cms/consultations/ro_solarpv/ro_solarpv.aspx# 76
Cambridge Economic Policy Associates Ltd and Parsons Brinckerhoff (2011) Updates to the Feed-in Tariff
Model Documentation of Changes for solar PV Consultation
http://www.decc.gov.uk/assets/decc/11/consultation/FITs-comp-review-p1/3365-updates-to-FITs-model-doc.pdf 77
Parsons Brinckerhoff (2012) Solar PV Cost Update http://www.decc.gov.uk/assets/decc/11/meeting-energy-
demand/renewable-energy/4290-solar-pv-cost-update-report--3-feb-2012-.pdf 78
DECC (2012) Public Attitudes Tracker Survey, Wave 2, http://www.decc.gov.uk/assets/decc/11/stats/6410-
decc-public-att-track-surv-wave2-summary.pdf

UK Renewable Energy Roadmap Update 2012
45
Priority actions:
• Solar Strategy: In 2013, we will outline the Government’s strategic approach to
solar PV in more detail building on this Roadmap Update. We will set out a clear
vision for solar PV through to 2020, seeking to provide long-term investor
confidence
• Financial predictability: We published the Government Response to the RO
Solar Consultation on 18 December 201279 and will have the new rates in place
by April 201380. We will also complete the delivery of changes flowing from the
recent comprehensive review of the FITs scheme by April 2013.
• Industry engagement: During Winter 2012, we will establish new structures for
engaging with industry at both Ministerial and official level in order to build
effective partnership working. DECC will also consider how best to obtain more
accurate information on solar PV performance to help give greater confidence to
investors and consumers.
Current Deployment
2.41 Solar PV converts solar radiation into electricity directly. A typical system consists of modules containing a number of solar cells along with a DC to AC inverter.
2.42 The manufacturing processes of solar cells and photovoltaic arrays (and associated equipment) have advanced and reduced their costs considerably in recent years. Solar PV has grown rapidly across the world, albeit from a small base, to a total global capacity of nearly 70GW by the end of 2011, and a total annual output of approximately 80TWh of electricity81. Solar PV is now, after hydro and wind power, the third largest renewable energy source in terms of globally installed capacity82.
2.43 In February 2012, the European Photovoltaic Industry Association ranked the UK solar market as 8th in the world. The UK has less sunshine (and therefore lower load factors) than some other countries; though our climate is similar to that in Germany, where deployment of solar PV is considerably higher (already over 20GW).
2.44 Figure 8 shows the UK map of FITs solar PV deployment: the number of domestic photovoltaic installations per 10,000 households by Local Authority (at
79
DECC (2012) Renewables Obligation Banding Review for the period 1 April 2013 to 31 March 2017:
Government Response to the further consultation on solar PV support http://www.decc.gov.uk/publications/basket.aspx?filetype=4&filepath=11%2fconsultation%2fro-
banding%2f7328-renewables-obligation-banding-review-for-the-perio.pdf&minwidth=true#basket 80
Subject to Parliamentary and State aid approval 81
European Photovoltaic Industry Association (EPIA) (2012) Global Market Outlook
http://files.epia.org/files/Global-Market-Outlook-2016.pdf 82
EPIA (2012) Global Market Outlook for Photovoltaics until 2016
http://www.epia.org/news/publications/global-market-outlook-for-photovoltaics-until-2016/?L=0

UK Renewable Energy Roadmap Update 2012
46
end of September 201283). As at the end of September 2012, the regional data shows the majority of installations are focussed in South West England with 239 installations per 10,000 households (and a total of 55,577 installations). Wales also has a significant level of deployment, at 172 installations per 10,000 households. The East Midlands has the third highest level of deployment with 153 installations per 10,000 households and 29,807 installations in total84.
2.45 Deployment in the UK has grown rapidly since the FITs scheme was established in April 2010 to GW of operational installed capacity by the end of November 201285, with the majority of current PV deployment at smaller scale installations less than 50kW. Larger installations (greater than 50kW) have seen a slower rate of uptake and until recently, there has been very little deployment activity for installations greater than 5MW. This is changing this year, with evidence of substantial activity now underway, including both large commercial rooftops and ground mountd schemes. For example, Lark Energy have recently received planning permission for a new 32MW solar PV project on an old World War II airfield in Leicestershire.
83
DECC (2012) Feed in Tariffs in the UK, Number of domestic solar PV installations, Data as of September 2012,
http://www.decc.gov.uk/assets/decc/11/stats/energy/energy-source/5924-number-of-domestic-photovoltaic-
installations-per-.pdf 84
DECC (2012) Sub-regional Feed-in Tariffs confirmed on the CFR statistics. Data as of September 2012.
http://www.decc.gov.uk/publications/basket.aspx?filetype=4&filepath=11%2fstats%2fenergy%2fenergy-
source%2f5922-subregional-feedin-tariffs-confirmed-on-the-cfr-.xls&minwidth=true#basket 85
DECC (2012) Central FITs register, data as of end of November 2012, published December 2012
http://www.decc.gov.uk/en/content/cms/statistics/energy_stats/source/fits/fits.aspx Covers solar PV
installations confirmed on the scheme. There may be more in operation. Excludes Northern Ireland and RO.
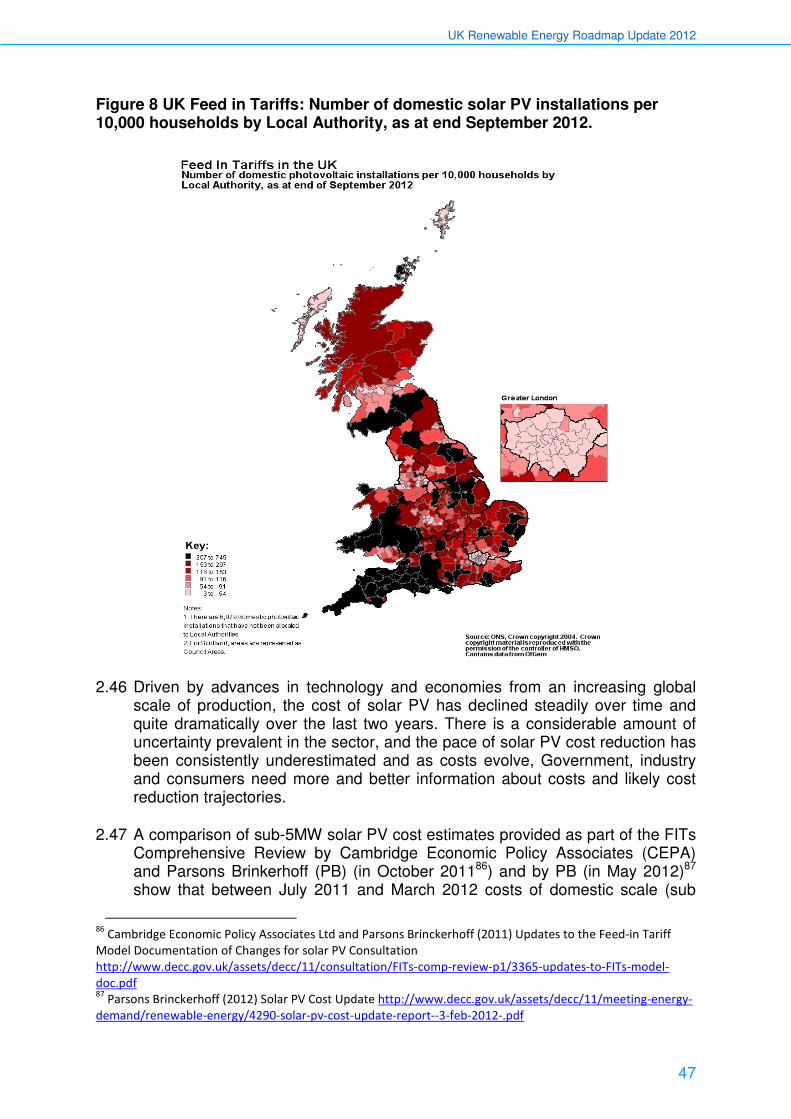
UK Renewable Energy Roadmap Update 2012
47
Figure 8 UK Feed in Tariffs: Number of domestic solar PV installations per 10,000 households by Local Authority, as at end September 2012.
2.46 Driven by advances in technology and economies from an increasing global scale of production, the cost of solar PV has declined steadily over time and quite dramatically over the last two years. There is a considerable amount of uncertainty prevalent in the sector, and the pace of solar PV cost reduction has been consistently underestimated and as costs evolve, Government, industry and consumers need more and better information about costs and likely cost reduction trajectories.
2.47 A comparison of sub-5MW solar PV cost estimates provided as part of the FITs Comprehensive Review by Cambridge Economic Policy Associates (CEPA) and Parsons Brinkerhoff (PB) (in October 201186) and by PB (in May 2012)87 show that between July 2011 and March 2012 costs of domestic scale (sub
86
Cambridge Economic Policy Associates Ltd and Parsons Brinckerhoff (2011) Updates to the Feed-in Tariff
Model Documentation of Changes for solar PV Consultation
http://www.decc.gov.uk/assets/decc/11/consultation/FITs-comp-review-p1/3365-updates-to-FITs-model-
doc.pdf 87
Parsons Brinckerhoff (2012) Solar PV Cost Update http://www.decc.gov.uk/assets/decc/11/meeting-energy-
demand/renewable-energy/4290-solar-pv-cost-update-report--3-feb-2012-.pdf

UK Renewable Energy Roadmap Update 2012
48
4kW) PV fell by 35%, with falls of up to 50% for the largest installations eligible under FITs (250-5000kW). More data relating predominantly to large-scale (i.e. greater than 5MW) ground mounted solar PV installations have recently been provided as part of the RO Banding Review consultation for solar PV (published on 7 September 2012)88 and the Government Response was published on 18 December89.
Technical Deployment Potential
2.48 The Government believes that solar PV has the potential to form a significant part of the UK’s renewable energy generation mix. Figure 9 below shows the range of deployment that could theoretically be accommodated on the system which is dependent on a number of conditions (including interconnection and export capacity, the availability of electricity storage, the amount of on-site usage, the range of possible changes to the generation mix, the level and nature of demand and necessary infrastructure modifications for transmission and distribution networks). At the upper limit, by 2020 solar PV could reach up to 20GW90 and with a potential for 7GW at the lower end (including both large and small-scale). As with other technologies in the Roadmap, these are not targets, and movement towards the top limit of deployment is heavily dependent on decreasing the costs and being able to balance the UK grid network. Innovation in cost-effective storage solutions and grid management could help bring about a step-change in affordability and long-term potential for solar PV in the UK in this context. In the near term, the scope for more cost reductions may exist within installation, commissioning and financing rather than in panel prices.
2.49 Innovation in solar PV panels may also increase with time which may improve performance, and greater learning about site optimisation may also increase outputs and load factor91. Current information shows that across the UK solar
88
DECC (2012) Consultation on proposals for the levels of banded support for solar PV under the Renewables
Obligation for the period 1 April 2013 to 31 March 2017
http://www.decc.gov.uk/en/content/cms/consultations/ro_solarpv/ro_solarpv.aspx 89 DECC (2012) Renewables Obligation Banding Review for the period 1 April 2013 to 31 March 2017:
Government Response to the further consultation on solar PV support http://www.decc.gov.uk/publications/basket.aspx?filetype=4&filepath=11%2fconsultation%2fro-
banding%2f7328-renewables-obligation-banding-review-for-the-perio.pdf&minwidth=true#basket 90
National Grid (2012), Solar PV briefing note for DECC
http://www.decc.gov.uk/en/content/cms/consultations/ro_solarpv/ro_solarpv.aspx#. National Grid have
undertaken new modelling which gives an initial estimate that deployment over 10GW of solar PV would make
balancing the existing grid infrastructure significantly more challenging in its current form. Although about 22
GW of solar PV could theoretically be accommodated on the system it is dependent on a number of conditions
(including interconnection and export capacity, the availability of electricity storage, the amount of on-site
usage, the range of possible changes to the generation mix, the level and nature of demand and necessary
infrastructure modifications for transmission and distribution networks). We have however reduced this
maximum by 10% due to the uncertainty associated with the underlying conditions and the ability to forecast
this limit out to 2020. We therefore consider 20 GW of solar PV (both large and small-scale) to be the
theoretical technical maximum that can be accommodated on the grid by 2020 (subject to the potential
conditions set out above). 91
Load factors are determined by differing levels of radiation across the UK. There is a significant scope for
variance in load factor. Data from FITs for a typical UK installation indicates 9.7% (850 kwh/kwp)
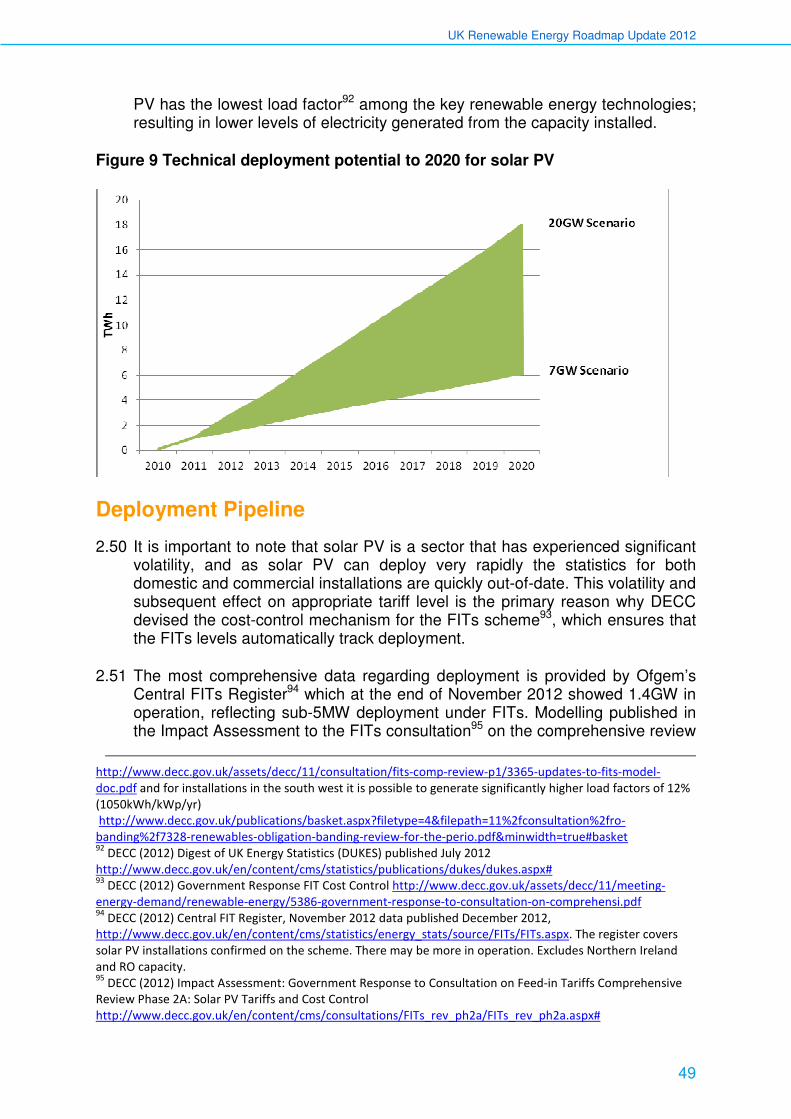
UK Renewable Energy Roadmap Update 2012
49
PV has the lowest load factor92 among the key renewable energy technologies; resulting in lower levels of electricity generated from the capacity installed.
Figure 9 Technical deployment potential to 2020 for solar PV
Deployment Pipeline
2.50 It is important to note that solar PV is a sector that has experienced significant volatility, and as solar PV can deploy very rapidly the statistics for both domestic and commercial installations are quickly out-of-date. This volatility and subsequent effect on appropriate tariff level is the primary reason why DECC devised the cost-control mechanism for the FITs scheme93, which ensures that the FITs levels automatically track deployment.
2.51 The most comprehensive data regarding deployment is provided by Ofgem’s Central FITs Register94 which at the end of November 2012 showed 1.4GW in operation, reflecting sub-5MW deployment under FITs. Modelling published in the Impact Assessment to the FITs consultation95 on the comprehensive review
http://www.decc.gov.uk/assets/decc/11/consultation/fits-comp-review-p1/3365-updates-to-fits-model-
doc.pdf and for installations in the south west it is possible to generate significantly higher load factors of 12%
(1050kWh/kWp/yr)
http://www.decc.gov.uk/publications/basket.aspx?filetype=4&filepath=11%2fconsultation%2fro-
banding%2f7328-renewables-obligation-banding-review-for-the-perio.pdf&minwidth=true#basket 92
DECC (2012) Digest of UK Energy Statistics (DUKES) published July 2012
http://www.decc.gov.uk/en/content/cms/statistics/publications/dukes/dukes.aspx# 93
DECC (2012) Government Response FIT Cost Control http://www.decc.gov.uk/assets/decc/11/meeting-
energy-demand/renewable-energy/5386-government-response-to-consultation-on-comprehensi.pdf 94
DECC (2012) Central FIT Register, November 2012 data published December 2012,
http://www.decc.gov.uk/en/content/cms/statistics/energy_stats/source/FITs/FITs.aspx. The register covers
solar PV installations confirmed on the scheme. There may be more in operation. Excludes Northern Ireland
and RO capacity. 95
DECC (2012) Impact Assessment: Government Response to Consultation on Feed-in Tariffs Comprehensive
Review Phase 2A: Solar PV Tariffs and Cost Control
http://www.decc.gov.uk/en/content/cms/consultations/FITs_rev_ph2a/FITs_rev_ph2a.aspx#

UK Renewable Energy Roadmap Update 2012
50
‘Phase 2a: Solar PV Cost Control’ suggests that we expect to see a deployment of up to 1GW of new capacity (of sub-5MW installations) over the 2012-13 financial year.
Challenges to Deployment and Actions
2.52 DECC has been engaging with industry stakeholders over the past year, throughout the update to the FITs scheme and the RO Banding Review. Ongoing dialogue suggests that there are several ways to encourage the development of solar PV in the UK. DECC will continue to work together with the industry to promote successful and cost effective deployment.
Solar Strategy:
2.53 DECC wants to set out a clear vision for solar through to 2020, and do so in a way which gives industry confidence to invest.
Case study: Met Office Supercomputers
The Met Office has recently installed solar PV on the roof of the Energy Centre at its HQ building in Exeter. In order to accurately predict Britain’s notoriously changeable weather, the Met Office operate three Supercomputers, which are among the UK’s largest. The IBM supercomputer is capable of performing 100 trillion calculations a second. Such a powerful computer requires a large amount of electricity and as a result the Met Office has invested in solar PV to reduce their energy bills and carbon emissions.
The 250kW array is expected to generate in excess of 221MWh of clean electricity annually saving 116 Tonnes of CO2, The array is one of the largest rooftop arrays in the UK, comprising 1000 mono-crystalline solar modules, chosen for their improved efficiency and long life. The sun path was modelled for the year and the solar panels were connected in such a way as to minimise the effects of shading from the guard rails.

UK Renewable Energy Roadmap Update 2012
51
2.54 Action: In 2013, DECC will produce a solar PV Strategy, in which we will outline the Government’s strategic approach to solar PV more fully, building on this Roadmap Update. The Strategy will reflect both Government and industry perspectives as to the main challenges facing the deployment of solar PV. It will consider the scope for small-scale, community-owned, commercial and utility-scale deployment in the UK and identify the barriers to growth that need to be addressed in each case. It will also consider how industry needs to secure cost reductions over time, and how this can best be monitored to inform the UK’s overall strategy, helping to set out the potential for economic benefit for the UK from industry growth. As part of this we will look to identify where we can learn any relevant lessons from overseas, in particular from countries which have larger and more developed solar PV sectors. We will also continue to pay attention to the developments in the global trading marketplace for solar PV. The European Commission has recently initiated an anti-subsidy investigation concerning imports of crystalline silicon photovoltaic modules and key components (solar panels) from China, and the Commission has also opened an anti-dumping investigation into imports of solar panels from China. BIS will monitor these recent developments as the department with responsibility for policy on world trade.
Financial Predictability:
2.55 Over the past year, developers have expressed concern about perceived uncertainty around the level and longevity of Government financial support for solar PV. DECC recognises that for small-scale solar PV the FITs scheme has undergone 18 months of change as we have responded to the consequences of rapid cost reductions. The changes implemented in the Phase 2A comprehensive review on solar PV cost control were designed to provide long- term sustainability for the FITs scheme and better value for money for consumers, allowing customers and businesses to plan their investments with confidence. They were put in place to ensure that solar PV tariffs better reflect solar PV costs, both today and in the future.
2.56 Action: DECC will complete the delivery of changes flowing from the recent comprehensive review of the FITs scheme by April 2013. This includes providing greater investor certainty for solar PV by setting up a pre-accreditation system (that began operation from 1 December 2012) for installations greater than 50kW96.
2.57 DECC aims to create more financial certainty and a more stable environment for solar PV through the RO and through reforms to the electricity market with CfDs for the period beyond March 2017. The solar PV consultation on the RO Banding Review closed on 19 October and the Government Response was published on 18 December97. This set out the decision to establish two
96
DECC (2012) Consultation on Comprehensive Review Phase 2B: Tariffs for non-PV technologies and scheme
administration issues
http://www.decc.gov.uk/en/content/cms/consultations/FITs_rev_ph2b/FITs_rev_ph2b.aspx 97
DECC (2012) Renewables Obligation Banding Review for the period 1 April 2013 to 31 March 2017:
Government Response to the further consultation on solar PV support

UK Renewable Energy Roadmap Update 2012
52
separate bands for solar PV under the RO: one band will be for building-mounted solar PV; the other band will be for all other types of solar PV above 50 kW in size.
2.58 Action: DECC have published the Government Response to the RO Solar Consultation on 18 December 2012, setting out the new rates under the RO for the next four years and DECC will have the new rates in place by April 201398. This will provide the market with the predictability and stability that we recognise the sector needs.
Industry Engagement:
2.59 The effective partnership between industry and Government is invaluable to exchanging sound and credible information. The evidence provided by industry helps DECC to understand the changing face of solar PV and keep track of industry developments.
2.60 Action: As part of the solar PV Strategy, DECC will establish new structures for engaging with industry at both Ministerial and official level to build effective partnership working. We will work to establish advisory groups which can offer support and advice at both Ministerial and official level to government, and harness the expertise in the sector.
2.61 Action: DECC is considering how best to gain access to the data generated through the FITs scheme, such as information on solar PV performance and load factors, in order to help give greater confidence to investors and to provide more information to consumers, researchers and businesses.
Cost Reduction:
2.62 Further cost reduction throughout the manufacture, installation and maintenance of solar PV installations is essential if the industry is to deploy at the scale suggested by our analysis. By learning from overseas experience (for example, Germany and Italy) and in partnership with industry, we will use the coming year to identify where reforms and cost reductions abroad can provide lessons that could be suitable for the UK context in order to drive down costs.
2.63 Action: As part of the solar PV strategy, DECC will consider the best approach to continuing work on cost reduction in order to provide insight as to the key areas that can provide ways to increase cost efficiency. In partnership with industry, DECC will also use the coming year to identify learning from overseas which can be applied to the UK context in order to drive down costs.
Innovation:
2.64 Innovation is key to improving performance and efficiency of mono/ poly crystalline and hybrid panels in order to bring down the cost of production.
http://www.decc.gov.uk/publications/basket.aspx?filetype=4&filepath=11%2fconsultation%2fro-
banding%2f7328-renewables-obligation-banding-review-for-the-perio.pdf&minwidth=true#basket 98
Subject to Parliamentary and State aid approval

UK Renewable Energy Roadmap Update 2012
53
Developing cost-effective storage solutions could also make a step-change in affordability and long-term potential for solar PV in the UK. There are encouraging plans to develop a UK Solar Energy Centre in Cornwall that will be a centre of excellence for the development of solar technology.
2.65 UK Research Councils spent about £10m annually over the last three years on solar energy research. They expect similar annual expenditure till 2014. As part of that, the Engineering and Physical Sciences Research Council (EPSRC) awarded a £4m grant to SUPERSOLAR Solar Energy Hub which is a consortium led by Loughborough University (together with Universities of Bath, Liverpool, Oxford, Sheffield and Southampton) that is aimed at research on new materials and systems performance. SUPERSOLAR also intends to set up a national solar cell efficiency measurement facility for the benefit of the solar PV community in the UK. EPSRC has also set out the SUPERGEN Solar Energy Challenge, a £5M call to support grants that aim to optimise solar systems in order to reduce the cost of solar energy. This will research improvements in solar cell efficiency, overall system performance, and analysis of whole life system costs. This is likely to be awarded in early 2013.
2.66 Action: DECC will work with industry, the Research Councils and other members of the Low Carbon Innovation Coordination Group (LCICG) to understand progress of the research undertaken and the outcomes in order to influence policy developments and encourage deployment by summer 2013.
Network Issues:
2.67 Ensuring that renewable technologies have the opportunity to connect to the network in a timely and affordable way is essential to maintaining the secure electricity supply that we depend on. Connecting increasing levels of solar PV to the distribution network will have an impact on the ability of Distribution Network Operators (DNOs) to manage their operations99. DECC has also participated in Ofgem’s electricity distribution price control review100 to highlight the importance of incentivising DNOs to facilitate the connection of low carbon technologies required to achieve the Government’s carbon targets in a cost effective and timely way.
2.68 Action: DECC will continue to work with Ofgem, National Grid and the electricity distribution companies to consider the impacts of low carbon technologies on electricity distribution networks.
2.69 Action: DECC will continue to work with the industry and the network companies to ensure that proposed solar PV installations have clear sight of the costs and timetables for their grid connection.
99
DECC (2012) Electricity System: Assessment of Future Challenges
http://www.decc.gov.uk/assets/decc/11/meeting-energy-demand/future-elec-network/6099-elec-system-
assess-future-chall-full.pdf 100
Ofgem (2012) RIIO-ED1 (first electricity distribution price control review under the RIIO model)
http://www.ofgem.gov.uk/Networks/ElecDist/PriceCntrls/riio-ed1/Pages/index.aspx
UK Renewable Energy Roadmap Update 2012
54
Renewable Heat
• De-carbonising heat remains a key priority of the Government and in March
2012 DECC published ‘The Future of Heating: A strategic framework for low
carbon heat in the UK101.
• The Renewable Heat Incentive (RHI), a non-domestic scheme launched in
Great Britain in November 2011 is currently the primary tool for delivering our
Heat Strategy and driving the transition to renewable and low carbon heat in the
coming decades.
• In September 2012, two consultations were published to extend the RHI to
additional technologies in the non-domestic sector: ‘RHI: expanding the non-
domestic scheme’102 (closed 7 December 2012) and ‘RHI: air to water heat
pumps & energy from waste’103 (closed 18 October 2012).
• DECC also published a third consultation on proposals for providing longer-term
support for individual households, ‘RHI: proposals for a domestic scheme’ 104
(closed 7 December 2012) and intend to open this scheme in summer 2013.
• In March 2012, DECC announced further support for the domestic sector under
a second phase of the Renewable Heat Premium Payment scheme (RHPP)105,
which runs until March 2013. The RHPP is a one-off grant towards meeting the
costs of installing renewable technologies (solar thermal, air and ground-source
heat pumps and biomass boilers) in homes and consists of a household voucher
scheme, a social landlords competition and a communities scheme.
• In Scotland bioenergy plays an important role in meeting renewable heat targets
by deploying biomass in heat-only or Combined Heat and Power (CHP)
schemes. Separately, the Scottish Government has commissioned research into
Scotland's resources in deep geothermal heat to identify policy options for
development. The results are expected to be published in Spring 2013.
Priority actions:
• Finalise a domestic RHI scheme: The Government Response to the consultation
on the domestic RHI is planned for publication in early 2013, with the scheme
intended to open to applicants in summer 2013.
• Expand the non-domestic RHI: DECC plans to include new technologies (air
source heat pumps and biomass direct air heating) and provide improved
101
DECC (2012) Heat Strategy The future of heating: A strategic framework for low carbon heat
http://www.decc.gov.uk/en/content/cms/meeting_energy/heat_strategy/heat_strategy.aspx 102
DECC (2012) Renewable Heat Incentive: expanding the non-domestic scheme
http://www.decc.gov.uk/en/content/cms/consultations/rhi_exp_nondom/rhi_exp_nondom.aspx 103
DECC (2012) Renewable Heat Incentive: Air to Water heat pumps & Energy from Waste
http://www.decc.gov.uk/en/content/cms/consultations/rhi_heatpumps/rhi_heatpumps.aspx 104
DECC (2012) Renewable Heat Incentive: proposals for a domestic scheme
http://www.decc.gov.uk/en/content/cms/consultations/rhi_domestic/rhi_domestic.aspx 105
DECC (2012) Domestic RHI
www.decc.gov.uk/en/content/cms/meeting_energy/renewable_ener/incentive/dom_rhi/dom_rhi.aspx

UK Renewable Energy Roadmap Update 2012
55
support for technologies currently in the non domestic RHI scheme (including
specific tariffs for biomass and bioliquid CHP and deep geothermal). We are
also proposing to expand the energy from waste eligibility criteria to include
commercial and industrial waste, and introducing support for biogas combustion
above 200kW.
• Air quality regulation: Air quality criteria in the RHI were consulted on during July
2012. DECC plans to implement minimum air quality criteria as a condition of
RHI support. Maximum permitted emissions limits of NOx and particulate matter
to be set for biomass boilers. Compliance can be demonstrated with a certificate
showing the installation has been tested by an accredited test house.
• Investor Confidence: DECC will bring forward the best approach to tackling RHI
tariff reductions to provide greater financial certainty and investor confidence.
This is expected to be in place by April 2013 and will clearly set out in advance
the circumstances under which tariff reductions could occur. DECC are also
considering the responses to the ‘RHI: Providing Certainty and Improving
Performance’ consultation106 which proposed a preliminary accreditation
process to provide assurance to project developers of scheme eligibility and
plans to publish the Government Response in winter 2012/13.
• Strategic framework for heat: Publish a heat policy options paper in early 2013.
106
DECC (2012) Renewable Heat Incentive: providing certainty and improving performance
http://www.decc.gov.uk/en/content/cms/consultations/rhi_cert_perf/rhi_cert_perf.aspx

UK Renewable Energy Roadmap Update 2012
56
Heat Consumption Updates
Figure 10 Annual Renewable Heat Consumption107,108
2.70 In 2011, around 14TWh of heat was generated from renewable sources, a 5% increase on the previous year. Bioenergy for heat production has seen significant growth of 90% since a low point in 2005 and during 2011 grew by 2%107.
Heat Strategy
2.71 The Future of Heating: A strategic framework for low carbon heat in the UK109 was published in March 2012 and sets out the vision for heating our homes, businesses and industry to 2020 and up to 2050. The document explained that by 2050, to meet our long term target, we will need to reduce emissions from buildings to near zero and achieve an up to 70% reduction in emissions (from 2009 levels) from industry, the majority of which are heat related. De-carbonising heat therefore remains a key priority for the Government.
107
DECC (2012) Digest of UK Energy Statistics (DUKES)
http://www.decc.gov.uk/en/content/cms/statistics/publications/dukes/dukes.aspx. GCV - Gross Calorific
Value Basis. 108
This chart show energy measured using Gross Calorific Values; this includes the energy required to remove
the water content of the fuel. When monitoring progress against the Renewable Energy Directive targets, data
are presented using net calorific values, which exclude the energy required to remove the water content. 109
DECC (2012) Heat strategy The future of heating: A strategic framework for low carbon heat
http://www.decc.gov.uk/en/content/cms/meeting_energy/heat_strategy/heat_strategy.aspx

UK Renewable Energy Roadmap Update 2012
57
2.72 We expect natural gas will still be the dominant fuel in supplying heat for buildings, both domestic and commercial, at least until 2030. Over time, heat for buildings is likely to move away from gas to a mix of building-level heat technologies such as heat pumps and, particularly in our cities, low carbon heat delivered through heat networks. Industry will focus initially on more effective use of energy efficiency measures, with the use of biomass where this is appropriate. Such fuel switching is already being promoted through the RHI. Longer term, the deployment of CCS is likely to play a key role, especially where fuel switching is not feasible. There is also potential for electrification of some processes.
2.73 One challenge is to bring renewable heat for homes into the mainstream alongside gas boilers. The Green Deal110 and Smart Meters111 will help to reduce demand for heat and the RHI will help to drive uptake of renewable technologies and develop the supply chain. We expect to see costs of renewable technologies such as heat pumps, biomass boilers and solar thermal fall, making these technologies more affordable and accessible.
Northern Ireland Renewable Heat Incentive
2.74 The Northern Ireland Renewable Heat Incentive (RHI) was launched by the Department of Enterprise, Trade, and Investment (DETI) Minister on 1 November 2012. The Northern Ireland RHI is designed to support the increase of renewable heat levels from 1.7% to 10% by 2020. Given the differences in the Great Britain and Northern Ireland heat markets, a specific approach was taken to consider incentivising the local renewable heat market.
2.75 In May 2012, DETI launched a Northern Ireland Renewable Heat Premium Payment scheme for domestic customers wishing to switch from fossil fuel heating systems to renewable applications. This scheme will support domestic installations whilst consideration is given to a longer term mechanism for this sector.
110
DECC Green Deal http://www.decc.gov.uk/en/content/cms/tackling/green_deal/green_deal.aspx 111
DECC Smart Meters http://www.decc.gov.uk/en/content/cms/tackling/smart_meters/smart_meters.aspx

UK Renewable Energy Roadmap Update 2012
58
Biomass Heat
• Biomass can be used for on-site heating through the burning of solid biomass or
the direct combustion of biogas produced from organic materials or alternatively
to displace natural gas in the gas grid if converted to biomethane. In the longer
term, a premium on energy density in the transport and industrial sectors
suggests some forms of bioresources, namely bioliquids, may be best used as
transport biofuels like aviation or for industrial heating, as it will be valued at a
premium. This may reduce the availability and increase the cost of these
bioresources for space and water heating, although solid biomass and biogas
can still make an important contribution during the transition to decarbonisation.
• In rural areas, biomass heat is likely to be in the form of biomass boilers. In
England, it is estimated that two million tonnes of wood could be supplied to
local energy users, with supply chains also increasing levels of sustainable
woodland management and enhancing woodland biodiversity without affecting
forest carbon stocks. In urban areas, bio-powered industrial facilities are one of
the potential sources for supplying low carbon heat to local heat networks.
• The original proposals for the large-biomass tariff offered under the non-
domestic RHI was reduced from 2.7p/kWh to 1p/kWh as a result of a European
Commission State aid decision. We have issued a call for evidence on the costs
of large biomass (greater than 1MW).
Priority actions:
• Technology Costs: We have consulted on proposals for RHI support of biogas
combustion above 200kWth, as well as a separate tariff to support biomass and
bioliquid Combined Heat and Power (CHP). The Government response is
planned for issue in early 2013 and will provide clarity on biogas, biomass, and
bioliquid CHP support from the RHI. We have also consulted on proposals for a
domestic RHI scheme. The Government response is planned for early 2013.
• Technology Deployment: In response to the slow uptake under the current
large-biomass RHI tariff, DECC has issued a call for evidence to verify the
appropriate tariff level and modelling assumptions to provide a better
understanding of uptake influences.
• Biomass sustainability: DECC proposes implementing minimum biomass
sustainability criteria as a condition of RHI support under both the domestic and
non-domestic schemes. The RHI sustainability criteria would consist of a GHG
lifecycle emissions target and land use criteria.
• Strengthen fuel supply chains: Government will continue to work with private
businesses to deliver the Forestry Commission’s Woodfuel Implementation Plan
in England. This plan aims to significantly increase the area of woodland in
active management, stimulated by increased demand for woodfuel. Government
will also explore opportunities to use energy markets to drive woodland creation
in appropriate areas.

UK Renewable Energy Roadmap Update 2012
59
Ground and Air Source Heat Pumps
• During the last year, incentives to develop ground and air source heat pumps
have been introduced. The strategic framework for heat identified heat pumps,
with their high efficiencies, as an important technology for decarbonising heat, at
the level of individual buildings. In August 2011, the RHPP was set up to support
the renewable heat market as well as monitor performance. The data being
collected on under the scheme is providing important information about
performance issues and their causes. The scheme was extended in April 2012
to a second phase.
• RHI support was introduced for non domestic ground source heat pumps in
November 2011 and a consultation in September 2012 set out proposals for
support of air source heat pumps under the non domestic scheme. A call for
evidence was also launched to test the data and assumptions used to set the
existing support for commercial ground source heat pumps.
• DECC has been working with the industry to further develop the Microgeneration
Certification Scheme (MCS), that sets the technical and installation standard for
heat pumps. In September 2011, new standards were introduced to increase the
reliability of heat pumps and their installation. The consultation on the domestic
RHI scheme proposed how such a scheme would work, including considering
ways of driving innovation and improving heat pump performance.
Priority actions:
• Technology costs: We have consulted on proposals for a scheme to support
renewable heat in the domestic sector including for ground source and air
source heat pumps. We have also consulted on the inclusion of additional
technologies in the non-domestic RHI including air source heat pumps. We aim
to introduce support for the domestic sector and for the additional technologies
in the non-domestic RHI in summer 2013.
• Availability of good quality installers and engineers: The MCS is currently
consulting on the development of competency criteria for installation companies
with the aim of introducing new criteria by spring 2013.
• Demands on the electricity grid: DECC published a document in August 2012112
setting out the challenges the electricity system will face due to changes in the
demand for electricity and the generation mix and exploring how balancing
technologies, such as storage and Demand Side Response, can help balance
the demand for and supply of electricity.
112
DECC (2012) Electricity System: Assessment of Future Challenges Summary
http://www.decc.gov.uk/assets/decc/11/meeting-energy-demand/future-elec-network/6098-electricity-
system-assessment-future-chall.pdf

UK Renewable Energy Roadmap Update 2012
60
Deep Geothermal
2.76 The Government recognises the potential of deep geothermal energy as a source of low-carbon and non-intermittent energy for electricity and/or heat. Deep geothermal heat can be brought up from underground and connected to a heat network to provide space and hot water heating for local developments, or possibly even for whole cities. The UK’s deep geothermal resources include hot aquifers (i.e. subterranean bodies of water) in the North East, Wessex and Cheshire. The UK’s only existing geothermal heat generating station is at Southampton, where an 1,800m borehole taps into the edge of the aquifer under Wessex and provides heat to the Southampton district heat network. The ‘hot dry rocks’ in Cornwall have the greatest potential (at 5km depth) for power projects. The Government has provided grant support to enable the initial development of the sector.
2.77 Deep geothermal electricity generation is eligible for support under the RO and for direct heat use is eligible for support under the RHI. The Government has consulted on the future treatment of deep geothermal heat under the RHI. In the Heat Strategy, deep geothermal was considered to be a source of renewable heat for urban heat networks. The announcement of new geothermal-to-heat network projects in Manchester and in North Tyneside is a welcome development and fits with the Government’s wider ambition for heat.
Case study: The 300th accredited installation on the RHI, NHS Dental Practice
The RHI reached its 300th accreditation in September 2012 with the installation of a biomass boiler at the award winning M&S NHS Dental Surgery in Fort William, Scotland. Taking advantage of the financial incentive provided by the RHI, the Surgery installed a 95kWh biomass boiler to supply heating to their offices. They fitted the wood chip boiler over summer 2012 and have already seen savings.
The biomass boiler replaced an increasingly expensive oil heating system which was proving financially unsustainable and it made good sense to look at a cheaper and more environmentally sustainable heating technology. The fuel is local woodchip which is sourced from sustainable local forestry.

UK Renewable Energy Roadmap Update 2012
61
Renewable Transport
• Domestic transport emissions make up 25% of the UK’s total CO2 emissions
and 21% of total greenhouse gas emissions113. Between 1990 and 2009, GHG
emissions from transport have increased by 13%, whilst there has been a 25%
fall in total GHG emissions. Of these domestic transport emissions in 2009, road
transport made up just over 90%, with car travel accounting for 58% and heavy
goods vehicle and light van traffic accounting for 30%114. Government strategy
to meet our carbon reduction targets in transport includes work in biofuels and
electric vehicles.
• Biofuels play a role in our efforts to tackle climate change but it is crucial that
any biofuels used are sustainable and lead to a reduction in carbon emissions.
Following changes implemented in December 2011, Government incentives
reward only biofuels that meet mandatory sustainability criteria. Double
incentives are now in place for biofuels derived from waste material and
advanced processes. The UK has long called for the key issue of ILUC to be
addressed and welcomes the work undertaken by the European Commission to
bring forward a proposal.
• The market for electric vehicles is in the early stages but good progress has
been made. The Office for Low Emission Vehicles (OLEV) is continuing to
provide financial support for the uptake of ultra-low emission vehicles. By 30
September 2012, 2,451 vehicles had applied for the Plug-in Car and Van grants
(2,311 cars and 140 vans).
• By the end of September 2012, there were around 6,000 charging points in the
UK, with over 2,200 charge points provided by the Plugged-In-Places (PIP)
Scheme. We are encouraged by development within the private sector, with
several organisations installing infrastructure on a national basis.
Priority actions:
• Biofuels: On 17 October the European Commission published a proposal
designed to address ILUC impacts through amendments to the Renewable
Energy Directive and the Fuel Quality Directive. This proposal will be agreed
through the ordinary legislative procedure over the coming year.
• Plug-In Vehicle Infrastructure: The National Charge point Registry (NCR) is live
and available at data.gov.uk, and we have a commitment to review ‘Making the
Connection’ by May 2013.
• Support for innovation: Providing £82m OLEV support for research and
113
Committee on Climate Change (2011) Third Progress report to Parliament
http://hmccc.s3.amazonaws.com/Progress%202011/CCC%20Progress%20Report_Interactive_2.pdf 114
Department for Transport (2011) Transport energy and environment statistics
http://assets.dft.gov.uk/statistics/releases/transport-energy-and-environment-statistics-2011/energy-
2011.pdf

UK Renewable Energy Roadmap Update 2012
62
development which is managed by the Technology Strategy Board. Five
strategic technologies have been identified, although OLEV funding is focused
on 2, 4, and 5 highlighted below:
1. Internal Combustion Engines
2. Energy Storage and Energy Management
3. Intelligent Transport Systems
4. Lightweight Vehicle and Powertrain Structures
5. Electric Machines and Power Electronics
2.78 The Automotive Council technology development roadmap (below) shows how alternative technologies in ultra-low emissions vehicles (ULEVs) are likely to develop over the next 30 years.
Figure 11 Automotive Council consensus technology Roadmap
2.79 The Government has committed £400 million up to 2015 to support ULEVs. This includes funding for a consumer incentive of up to £5,000 for eligible cars and up to £8,000 for eligible vans; £30 million to kick-start the installation of recharging points throughout the UK; and £82 million for research, development and procurement programmes. Work is also underway to encourage UK businesses to seize commercial opportunities in the ULEV sector, and to develop and strengthen the capability of ULEV manufacturing and its associated supply chain in the UK.
2.80 The Scottish Government’s Green Bus Fund has already supported the roll-out of 74 low carbon buses, such as diesel-electric hybrids, to reduce harmful

UK Renewable Energy Roadmap Update 2012
63
vehicle emissions, while the E-cosse partnership brings together Transport Scotland with car manufacturers, power companies, local authorities and WWF Scotland to maximise the opportunities for EVs to become an essential part of Scotland’s greener transport system.
2.81 Both the Scottish Government and Scottish Enterprise support the pioneering Aberdeen Hydrogen Technology Project, which will boost Scotland’s profile as a key hydrogen technology hub and a world-leading investment location for pioneering low-carbon energy and transport systems.
Figure 12 Biodiesel and Bioethanol Fuel Consumption115
Annual Renewable Biofuel Consumption (GCV basis)
0
5
10
15
2006 2007 2008 2009 2010 2011
TW
h Biodiesel
Bioethanol
2.82 The chart shows that there was a decline in the amount of biofuel supplied in 2011 relative to 2010. It is likely that this was due to the difference between mineral oil and vegetable oil prices during the first half of 2011, which made biodiesel relatively more expensive to supply. The Renewable Transport Fuel Obligation (RTFO) has in-built flexibility so that suppliers are able to meet targets at least cost. This can lead to fluctuations in supply from one year to the next as market conditions change.
115
HM Revenue and Customs, (2012) Tax & Duty Bulletins
https://www.uktradeinfo.com/Statistics/Pages/TaxAndDutybulletins.aspx
DECC (2012) Digest of United Kingdom Energy Statistics (DUKES). Annex A Energy and commodity balances,
conversion factors and calorific Values.
http://www.decc.gov.uk/assets/decc/11/stats/publications/dukes/5959-dukes-2012-annex-a.pdf

UK Renewable Energy Roadmap Update 2012
64
Case study: Ultra Low Emission Vehicles
The Government has paved the way for privately funded charging points through the Plugged-In Places (PIP) programme. The Office Low Emission Vehicles offers match-funding to consortia made up of businesses and public sector partners to support the installation of electric vehicle recharging infrastructure in eight areas across the UK. Along with the other elements of support offered by Government, including the plug in car and van grants, we are now seeing private sector investment in public charging infrastructure. This is essential to boost the uptake of plug-in vehicles, which will help towards our environmental and growth aspirations.
The Government funded PIP are developing as well. Although originally membership based, they are also to installing more and more pay-as-you-go charge points into their schemes, alongside negotiating interoperability agreements between themselves and other membership based schemes such as POLAR or neighbouring Local Authority led schemes. In addition to the PIP, there are many private sector organisations investing in recharging infrastructure. Some of the schemes are summarised below.
Chargemaster POLAR: Launched in September 2011, the scheme is subscription based aiming for 4,000 charging points by the end of 2012. So, in each of targeted cities, POLAR will operate around 40 publically available charging bays.
Pod Point: Pay-as-you-go network, launched in September 2012, aiming to have 750 chargers nationwide available on a pay-as-you-go basis by the end of 2012. The PP PAYG network will use SMS text to access charging points, and stop and start charging cycles.
Engenie, Schneider Electric and Roadchef: Pay-as-you-go Rapid Charger network. Launched 30 May 2012, chargepoints capable of recharging vehicles in 20 – 30 minutes. First point installed at Clacket Lane Roadchef services on M25.
Ecotricity and Welcome Break: A free to use network of standard (3 or 7kw) chargepoints and now installing 50kw DC rapid chargers at Welcome Break motorway services. Users are asked to register for a free swipe card.
Zero Carbon World: Charity based organisation. Standard (3 or 7kw) chargeposts, available for free use, no payment or access method required. In a variety of locations, such as roadside service stations, restaurants, hotels.

UK Renewable Energy Roadmap Update 2012
65
Cross-border Energy Trading and Infrastructure 2.83 Last year’s Renewable Energy Roadmap set out our intention to enable the
export and import of renewable energy to secure the greatest benefit for the UK using the flexibility mechanisms in the Renewable Energy Directive116.
2.84 Since then we have issued a Call for Evidence on Renewables Trading, which closed in summer 2012. We are now carrying out detailed analysis of the responses as well as additional information-gathering, and will set out next steps in due course. We have also been working to address some of the potential barriers through the North Seas Countries’ Offshore Grid Initiative (NSCOGI), and are in contact with other EU Member States to understand their plans and potential opportunities in this area. The UK and Republic of Ireland Governments are working together to develop a Memorandum of Understanding covering joint working on renewable energy trading and greater market integration.
2.85 We are still actively working to develop policy to enable directly connected projects to contribute to our renewables targets. As part of that, we are developing our thinking as to the approach we should take to enable non-UK generation to receive CfDs. We have published an outline of our proposed approach in the CfD Operational Framework117.
2.86 Ofgem is undertaking the Integrated Transmission Planning and Regulation (ITPR) project118 to review current arrangements for electricity system planning and delivery to determine whether they are appropriate to achieving a long-term efficient integrated network - onshore, offshore and cross-border. As part of this, the project is considering the regulatory framework for multiple-purpose transmission projects, such as those that may export power from a foreign generation project to GB.
2.87 NSCOGI is considering the same issues as the ITPR project but looking across the countries around the North and Irish Seas. A report outlining the initial findings of NSCOGI and the areas where further work is needed was
116
Directive 2009/28/EC of the European Parliament and of the Council of 23 April 2009 on the promotion of
the use of energy from renewable sources and amending and subsequently repealing Directives 2001/77/EC
and 2003/30/EC Text with EEA relevance , 2009, http://eur-
lex.europa.eu/LexUriServ/LexUriServ.do?uri=OJ:L:2009:140:0016:01:EN:HTML 117
EMR Policy Overview Annex A: CfD Operational Framework, 2012,
http://www.decc.gov.uk/en/content/cms/meeting_energy/markets/electricity/electricity.aspx# 118
Ofgem, Integrated Transmission Planning and Regulation (ITPR), 2012,
http://www.ofgem.gov.uk/Networks/Trans/ElecTransPolicy/itpr/Pages/index.aspx

UK Renewable Energy Roadmap Update 2012
66
submitted to Ministers in November 2012. The final report including results and recommendations was published in December 2012119.
2.88 Part of our approach to trading could include statistical transfer of effort from other Member States. Work on the potential costs and logistics of this is still in early stages right across the EU, and we are keeping it under close review.
2.89 Our aim is for this more detailed work to put us in a better position to make a decision on whether, and if so how and when, it would be right for the UK to make use of the trading provisions within the Renewable Energy Directive.
119
The North Seas Countries’ Offshore Grid Initiative (2012): Presentation of the results and recommendations
Final Report http://www.benelux.int/NSCOGI/index.asp 120
DECC (2012) Electricity System: Assessment of Future Challenges Summary
http://www.decc.gov.uk/assets/decc/11/meeting-energy-demand/future-elec-network/6098-electricity-
system-assessment-future-chall.pdf 121
A number of variables significantly impact on the results: the European generation mix; the amount of DSR
in Europe; electrification of heat and transport; and whether or not the GB electricity system is to be ‘self-
sufficient’.
Case study: The Electricity System and Balancing Technologies
As we seek to transform the UK into a low-carbon economy and meet our 15% renewable energy target by 2020, the GB electricity system will face significant challenges. The generation mix will evolve from one dominated by large power stations providing predictable and mostly flexible electricity to a mix with a significantly greater proportion of variable and less flexible generation.
Demand profiles are expected to change. The level of electricity consumption will increase if expected electrification of heat and transport take place. Daily peaks and troughs may become more extreme. The demand profile may also change as residential demand increases to power cars and heat homes using heat pumps.
There are a number of technologies that can be used to help balance the supply and demand of electricity (demand side response (DSR), electricity storage and interconnection, and flexible generation), and increasingly they are likely to be required, as will smarter networks. These balancing technologies tend to compete for the same markets, although the challenges for delivering them are very different.
Modelling for DECC’s report ‘Electricity System: Assessment of Future Challenges’, published in August 2012120, suggests that the need for a more flexible electricity system appears to crystallise in the 2020s and becomes more so in the 2030s121. The report nevertheless considers it important that we ensure we are facilitating the development of such a system today, and sets out a number of actions. We need to improve our understanding of the ability of the GB system to balance electricity supply and demand in the medium to long term. That means ensuring market arrangements are fit for purpose, supporting

UK Renewable Energy Roadmap Update 2012
67
122
Ofgem (2011) Letter: Preliminary conclusions on the regulatory regime for project NEMO and future subsea
electricity interconnector investment Preliminary conclusions on the regulatory regime for project NEMO and
future subsea electricity interconnector investment
http://www.ofgem.gov.uk/Europe/Documents1/Preliminary%20conclusions%20letter.pdf
the development of key balancing technologies and promoting investment in smarter network infrastructure. The importance of promoting flexibility in the electricity system is explicitly recognised in the opportunity for both electricity storage and DSR to play a fair and equivalent role alongside generation in the Capacity Market proposed as part of EMR.
Action: DECC will revise our in-house system model to incorporate transmission and distribution constraints, and refined modelling of balancing technologies and real-time balancing activities.
The role that both large and small scale technologies play will also need to be considered. Currently only a small percentage of the UK’s generating capacity is delivered through Distributed Generation (DG). Analysis for DECC’s latest impact assessment on the FITs suggests that the uptake of DG may increase dramatically over the next 10 years. This could have implications for the electricity system and potentially the role of Distribution Network Operators (DNOs).
Action: DECC will undertake further work to understand the impact of increasing levels of DG on the electricity system including the roles and responsibilities of the System Operator and DNOs.
There are also a number of potential electricity interconnection projects that may come forward in the coming years, including one to Belgium (Project NEMO). Ofgem, in cooperation with the Belgian energy regulator, is currently exploring the possibility of providing for a regulated “cap and floor” approach to the project, where returns are set within the bounds of a pre-set cap and floor. This would be designed to maintain commercial interests and protect consumers from the cost implications of excessive returns, while offering some protection to developers from the risks associated with constructing and operating an interconnector122.
Action: DECC will further develop an evidence base and analyse the impact on GB under different interconnection scenarios including further exploration of the most appropriate way of developing our interconnection capacity.

© Crown copyright 2012
Department of Energy & Climate Change
3 Whitehall Place
London SW1A 2AW
www.decc.gov.uk
URN 12D/479