RENEWABLE ENERGY IN DISTRICT HEATING AND COOLING · march 2017 a a sector roadmap for remap 2030...
112
March 2017 A Renewable Energy Roadmap RENEWABLE ENERGY IN DISTRICT HEATING AND COOLING A SECTOR ROADMAP FOR REMAP 2030
Transcript of RENEWABLE ENERGY IN DISTRICT HEATING AND COOLING · march 2017 a a sector roadmap for remap 2030...

A
A SE
CTOR
ROA
DMAP
FOR
REM
AP 2
030
– RE
NEW
ABLE
ENE
RGY
IN D
ISTR
ICT
HEAT
ING
AND
COOL
ING
March 2017
A Renewable Energy Roadmap
RENEWABLE ENERGY IN DISTRICT HEATING
AND COOLING
A SECTOR ROADMAP FOR REMAP 2030

Copyright © IRENA 2017
Unless otherwise stated, this publication and material featured herein are the property of the International Renewable Energy Agency (IRENA) and are subject to copyright by IRENA. Material in this publication may be freely used, shared, copied, reproduced, printed and/or stored, provided that all such material is clearly attributed to IRENA. Material contained in this publication attributed to third parties may be subject to third-party copyright and separate terms of use and restrictions.
ISBN XXX (Print)
ISBN XXX (PDF)
About IRENAThe International Renewable Energy Agency (IRENA) is an intergovernmental organisation that supports countries in their transition to a sustainable energy future and serves as the principal platform for international co-operation, a centre of excellence, and a repository of policy, technology, resource and fi nancial knowledge on renewable energy. IRENA promotes the widespread adoption and sustainable use of all forms of renewable energy, including bioenergy, geothermal, hydropower, ocean, solar and wind energy, in the pursuit of sustainable development, energy access, energy security and low-carbon economic growth and prosperity.
AcknowledgementsContributions during the analysis and review were provided by Stefan Holler (Hochschule für Angewandte Wissenschaft und Kunst Hildesheim/Holzminden/Göttingen), Henrik Lund (Aalborg University), Ahmed Abdulla Al Nowais (Tabreed) and Xianli Zhu (UNEP DTU Partnership). IRENA colleagues Francisco Boshell, Dolf Gielen and Takatsune Ito and UNIGE colleagues Jérôme Faessler, Gregory Giuliani, Matteo Lupi and Andrea Moscariello also provided valuable comments.
IRENA is grateful for the generous support of the Federal Ministry for Economic Aff airs and Energy of Germany, which made the publication of this report a reality.
Authors: Martin Christoph Soini, Martin Kumar Patel (UNIGE), Jasper Rigter and Deger Saygin (IRENA)
For further information or to provide feedback, please contact the REmap team: [email protected]
Citation IRENA (2017), Renewable Energy in District Heating and Cooling, a sector roadmap for REmap 2030, International Renewable Energy Agency (IRENA), Abu Dhabi, www.irena.org/remap.
DisclaimerThis publication and the material featured herein are provided “as is”�
All reasonable precautions have been taken by IRENA to verify the reliability of the material featured in this publication� Neither IRENA nor any of its offi cials, agents, data or other third-party content providers or licensors provides any warranty, including as to the accuracy, completeness or fi tness for a particular purpose or use of such material, or regarding the non-infringement of third-party rights, and they accept no responsibility or liability with regard to the use of this publication and the material featured therein�
The information contained herein does not necessarily represent the views of the Members of IRENA, nor is it an endorsement of any project, product or service provider� The designations employed and the presentation of material herein do not imply the expression of any opinion on the part of IRENA concerning the legal status of any region, country, territory, city or area or of its authorities, or concerning the delimitation of frontiers or boundaries�

A sector roadmap for REmap 2030 i
CONTENTS
LIST OF FIGURES ��������������������������������������������������������������������������������������������������������������������������������������������������������������������������� III
LIST OF TABLES�������������������������������������������������������������������������������������������������������������������������������������������������������������������������������V
LIST OF BOXES ��������������������������������������������������������������������������������������������������������������������������������������������������������������������������������V
ABBREVIATIONS ����������������������������������������������������������������������������������������������������������������������������������������������������������������������������VI
EXECUTIVE SUMMARY �������������������������������������������������������������������������������������������������������������������������������������������������������������������1
1� INTRODUCTION TO REMAP ������������������������������������������������������������������������������������������������������������������������������������������������� 9
1�1 IRENA’s REmap programme��������������������������������������������������������������������������������������������������������������������������������������� 91�2 Role of district heating and cooling ������������������������������������������������������������������������������������������������������������������������� 91�3 Approach ���������������������������������������������������������������������������������������������������������������������������������������������������������������������������� 9
2� RENEWABLE DISTRICT HEATING AND COOLING TODAY ������������������������������������������������������������������������������������ 12
2�1 Drivers ��������������������������������������������������������������������������������������������������������������������������������������������������������������������������������� 132�2 Current role �����������������������������������������������������������������������������������������������������������������������������������������������������������������������162�3 Case studies: lessons learned �����������������������������������������������������������������������������������������������������������������������������������23
3� POTENTIAL FOR RENEWABLE DISTRICT HEATING AND COOLING UP TO 2030 ��������������������������������������31
3�1 Reference Case �������������������������������������������������������������������������������������������������������������������������������������������������������������� 323�2 Availability of renewable resources for district heating and cooling �������������������������������������������������������353�3 Cost of renewable district heating and cooling ������������������������������������������������������������������������������������������������363�4 REmap ������������������������������������������������������������������������������������������������������������������������������������������������������������������������������ 403�5 Structural Shift ���������������������������������������������������������������������������������������������������������������������������������������������������������������433�6 Costs, benefits and investment needs������������������������������������������������������������������������������������������������������������������46
4� SYNERGIES BETWEEN VARIABLE RENEWABLE POWER AND DISTRICT HEATING AND COOLING ��������������������������������������������������������������������������������������������������������������������������������������������������������������������������������������������������������50
5� BARRIERS AND OPPORTUNITIES TO RENEWABLE DISTRICT HEATING AND COOLING ��������������������� 52
5�1 General barriers and opportunities ������������������������������������������������������������������������������������������������������������������������535�2 Barriers and opportunities in specific city contexts ����������������������������������������������������������������������������������������58
6� CONCLUSIONS �������������������������������������������������������������������������������������������������������������������������������������������������������������������������62
REFERENCES ����������������������������������������������������������������������������������������������������������������������������������������������������������������������������������64

RENEWABLE ENERGY IN DISTRICT HEATING AND COOLINGi i
ANNEXES
ANNEX 1: APPROACH AND METHODS �������������������������������������������������������������������������������������������������������������������������76ANNEX 2: TECHNICAL PROPERTIES OF DISTRICT ENERGY SYSTEMS ���������������������������������������������������������80ANNEX 3: AVAILABILITY OF RESOURCES ������������������������������������������������������������������������������������������������������������������82ANNEX 4: FUEL COSTS ��������������������������������������������������������������������������������������������������������������������������������������������������������83ANNEX 5: DETAILED COMPOSITION OF REmap, STRUCTURAL SHIFT AND LEVELISED COSTS OF
HEATING AND COOLING PER COUNTRY �����������������������������������������������������������������������������������������������84

A sector roadmap for REmap 2030 i i i
List of Figures
Figure ES1: Current share of final annual heating and cooling demand met by DHC �����������������������������������������2
Figure ES2: Breakdown of fuel use in DHC systems worldwide, 2014 �����������������������������������������������������������������������3
Figure ES3: Share of DHC generated using renewable heat ����������������������������������������������������������������������������������������� 4
Figure ES4: Additional costs and benefits of REmap options �������������������������������������������������������������������������������������� 6
Figure 1: Key factors influencing potential for renewable DHC with REmap ��������������������������������������������������� 11
Figure 2: Share of heat and cooling demand met through district energy systems �������������������������������������16
Figure 3: Usage share of district heat and cooling by sector and application �������������������������������������������������18
Figure 4: Breakdown of heating and cooling energy use today ���������������������������������������������������������������������������20
Figure 5: Current district heating and cooling generation mix in countries selected ����������������������������������20
Figure 6: Changes in demand for heating (left), cooling (right) and district heating and cooling, 2015-2030 ���������������������������������������������������������������������������������������������33
Figure 7: District heating and cooling generation mix in Reference Case in 2030 ���������������������������������������34
Figure 8: Primary bioenergy supply potential for district heat production in 2030 �����������������������������������36
Figure 9: Levelised cost of distribution of hot and cold water in 2030 ������������������������������������������������������������� 37
Figure 10: Levelised cost of decentralised heating and district heating technologies in Germany in 2030 ���������������������������������������������������������������������������������������������������������������������������������������������38
Figure 11: Levelised cost of decentralised heating and district cooling technologies in UAE in 2030 �������������������������������������������������������������������������������������������������������������������������������������������������������39
Figure 12: Mix of district heat and cooling generation under REmap compared to Reference Case �������������������������������������������������������������������������������������������������������������������������������������������������������41
Figure 13: REmap cost supply curve for Germany �������������������������������������������������������������������������������������������������������42
Figure 14: REmap cost supply curve for UAE ���������������������������������������������������������������������������������������������������������������43
Figure 15: Share of district heating in cooling as a fraction of total heating and cooling demand ����������44
Figure 16: Composition of difference between REmap and Structural Shift ����������������������������������������������������44
Figure 17: Cost and benefits of REmap compared to Reference Case ����������������������������������������������������������������46
Figure 18: Cost and benefits of Structural Shift compared to Reference Case ������������������������������������������������47
Figure 19: Average annual investment requirements in 2015-2030 for the Reference Case, REmap and Structural Shift ������������������������������������������������������������������������������������������������������������������������������49
Figure 20: Different types of district energy networks in range of urban environments ���������������������������� 60
Figure 21: Relative cost of labour and materials in 2011 ��������������������������������������������������������������������������������������������� 77
Figure 22: Fuel cost and remuneration for electricity produced in 2015 and 2030 ����������������������������������������83
Figure 23: Levelised cost of heating in China, 2030 ����������������������������������������������������������������������������������������������������85
Figure 24: Levelised cost of heating in Denmark, 2030 ���������������������������������������������������������������������������������������������87

RENEWABLE ENERGY IN DISTRICT HEATING AND COOLINGiv
Figure 25: Levelised cost of heating in Germany, 2030����������������������������������������������������������������������������������������������89
Figure 26: Levelised cost of heating in Poland, 2030 ���������������������������������������������������������������������������������������������������91
Figure 27: Levelised cost of heating in Switzerland, 2030 ����������������������������������������������������������������������������������������93
Figure 28: Levelised cost of heating in Japan, 2030 ����������������������������������������������������������������������������������������������������95
Figure 29: Levelised cost of cooling in Japan, 2030 ����������������������������������������������������������������������������������������������������95
Figure 30: Levelised cost of heating in US, 2030 ����������������������������������������������������������������������������������������������������������97
Figure 31: Levelised cost of cooling in US, 2030 �����������������������������������������������������������������������������������������������������������97
Figure 32: Levelised cost of cooling in Kuwait, 2030 ��������������������������������������������������������������������������������������������������99
Figure 33: Levelised cost of cooling in UAE, 2030 �������������������������������������������������������������������������������������������������������99

A sector roadmap for REmap 2030 v
List of Tables
Table 1: Overview of renewable DHC drivers ��������������������������������������������������������������������������������������������������������������������14
Table 2: Parameters illustrating volumes of heat supply from district heating networks in selected countries ��������������������������������������������������������������������������������������������������������������������������������������������������� 17
Table 3: Parameters illustrating volumes of cooling supply from district cooling networks in selected countries ���������������������������������������������������������������������������������������������������������������������������������������������������18
Table 4: Key policies and regulations for DHC in selected countries ����������������������������������������������������������������������22
Table 5: Summary of additional renewable DHC identified under Structural Shift per country �����������������45
Table 6: Summary of case studies on synergies between variable renewable power and DHC ������������������51
Table 7: Finance barriers and opportunities in renewable DHC �������������������������������������������������������������������������������54
Table 8: Resource barriers and opportunities in renewable DHC ����������������������������������������������������������������������������55
Table 9: Urban environment and existing network barriers and opportunities in renewable DHC ������������56
Table 10: Demand barriers and opportunities in renewable DHC ������������������������������������������������������������������������������ 57
Table 11: Policy and regulatory barriers and opportunities in renewable DHC ����������������������������������������������������58
Table 12: Action areas for different city contexts ������������������������������������������������������������������������������������������������������������ 60
Table 13: Typical technical and operational parameters of district heating systems in countries selected ��������������������������������������������������������������������������������������������������������������������������������������������������80
Table 14: Typical technical and operational parameters of district cooling systems in countries selected ���������������������������������������������������������������������������������������������������������������������������������������������������81
Table 15: Availability of resources �������������������������������������������������������������������������������������������������������������������������������������������82
Table 16: Composition of REmap and Structural Shift scenarios in China ��������������������������������������������������������������84
Table 17: Composition of REmap and Structural Shift scenarios in Denmark ������������������������������������������������������86
Table 18: Composition of REmap and Structural Shift scenarios in Germany ������������������������������������������������������88
Table 19: Composition of REmap and Structural Shift scenarios in Poland ���������������������������������������������������������� 90
Table 20: Composition of REmap and Structural Shift scenarios in Switzerland �������������������������������������������������92
Table 21: Composition of REmap and Structural Shift scenarios in Japan �������������������������������������������������������������94
Table 22: Composition of REmap and Structural Shift scenarios in US �������������������������������������������������������������������96
Table 23: Composition of REmap and Structural Shift scenarios in Kuwait �����������������������������������������������������������98
Table 24: Composition of REmap and Structural Shift scenarios in UAE ����������������������������������������������������������������98
List of Boxes
Box 1: District heating in the Russian Federation ���������������������������������������������������������������������������������������������������������������21

RENEWABLE ENERGY IN DISTRICT HEATING AND COOLINGvi
Abbreviations
°C degrees Celsius
CHP combined heat and power
CO2 carbon dioxide
COP coefficient of performance
DHC district heating and cooling
EUR euro
GJ gigajoule
GW, GWh gigawatt, gigawatt-hour
IEA International Energy Agency
IRENA International Renewable Energy Agency
JHSBA Japan Heat Supply Business Association
km kilometre
kW kilowatt
kWh kilowatt-hour
MW, MWh megawatt, megawatt-hour
m, m2, m3 metre, square metre, cubic metre
t metric tonne
PJ petajoule
REmap roadmap analysis by IRENA showing ways to double renewables in the global energy mix by 2030
SWM Stadtwerke München (Munich utility)
UAE United Arab Emirates
UNEP United Nations Environment Programme
USD US dollar

A sector roadmap for REmap 2030 1
EXECUTIVE SUMMARYMost countries could scale up renewable energy substantially in district heating and cooling�Around the world, a switch to renewable energy sources for centralised heating and cooling can help meet rising urban energy needs, improve efficiency, reduce emissions and provide cost-effective temperature control.
A switch to renewable energy sources for district heating and cooling (DHC) 1 can help meet rising urban energy needs, improve efficiency, reduce emissions and provide cost-effective temperature control� In the right conditions, DHC offers a cost-effective and energy efficient option for residential and commercial buildings� However, DHC supply is currently dominated by fossil fuels, such as coal and gas� There is significant potential to upgrade existing systems and create new networks using solid biofuels, solar2 and geothermal technologies, with significant benefits for energy security, human health and climate change mitigation�
Only a few countries have taken advantage of their renewable resource potential for DHC or created policies to promote further uptake� Those with policies promoting renewable-based district heating include Denmark, Sweden and Switzerland� Denmark, with ambitious decarbonisation policies, and Turkey, which is especially rich in suitable resources, already use high shares of renewables in DHC� Otherwise, renewable DHC still plays a modest role in most countries�
To drive future growth, a better understanding is needed of the potential for renewables in DHC, as well as their costs and benefits. This study examines the current status of renewable DHC systems in nine countries� It quantifies the potential, costs, benefits and investments required to ramp up renewables in these systems to 2030, in line REmap, the global roadmap from the International Renewable Energy Agency (IRENA)� The renewable energy roadmap (REmap) programme charts a pathway double the share of renewables in the world’s energy mix by 2030�
The nine countries examined here – China, Denmark, Germany, Poland, Switzerland, Japan, the United States, Kuwait and the United Arab Emirates (UAE)3 – together accounted for some 40% of the total energy used in DHC across the world in 2015� These countries represent both cold and hot climates, high and low population densities, and various patterns of historic growth in energy demand� They also vary greatly in their current use of DHC, the share of energy supplied by renewables, existing policies and plans for renewable-based DHC, and costs for renewable energy technologies�4 Technology options for each market up to 2030 were assessed by IRENA based on data collected from national experts and other credible third-party resources, such as those from project developers, technology licensors and other relevant stakeholders�
Case studies from 21 projects around the world reveal insights based on actual experience of deploying renewable DHC� These case studies have informed a detailed exploration of barriers, along with policy-making and project development opportunities� Based on this information, the study identifies key action areas for national and city policy makers to scale up renewables in DHC�
1 Throughout this report, DHC is defined as the centralised heating or cooling of water, which is then distributed to multiple buildings through a pipe network�
2 Throughout the report, the solar thermal systems discussed relate to solar thermal installations only� Heat from heat pumps powered by solar photovoltaic (PV) panels is not considered�
3 For each country, either district heating, district cooling or both district heating and cooling is considered� Countries are ordered accordingly throughout the report�
4 For Japan and the US, the potential for renewables in both district heating and district cooling was assessed; for Kuwait and the UAE, district cooling only was assessed; for the others, only the potential for district heating was assessed�

RENEWABLE ENERGY IN DISTRICT HEATING AND COOLING2
While demand for DHC varies widely according to climate, history and population density, the sector already forms a large part of energy use in some countries�Heating and cooling is required throughout the year, but demand depends on climate conditions. In cold climates, home heating in winter accounts for the majority of energy use in buildings� In hot climates, cooling is needed in the summer months, with demand in emerging cities rising fast� In every region, hot water is needed throughout the year� In most countries, these needs are met by decentralised heating or cooling systems, such as boilers or air conditioners, installed in buildings�
Some countries have used centralised DHC systems for many decades. In former Soviet states and across northern Europe, DHC has long been widespread� In Denmark, Poland and parts of Germany, much of the existing building stock is connected to district heating networks� Centralised systems cover up to half of Denmark’s heating demand and nearly a third of Poland’s� In other countries, such as Japan and the US, district heating predominantly serves commercial and industrial users�
Only a few countries use district cooling systems on a large scale� Air conditioners remain the dominant cooling technology everywhere� District cooling systems are becoming more common in some European cities, like Helsinki, Paris and Stockholm� In hot climates, however, district-level systems offer even greater advantages� In the UAE, district cooling has grown to cover more than a fifth of the cooling load�
District systems can be a more efficient and cost-effective way to heat and cool urban areas. The economies of scale and increased generation efficiency associated with centralised production can significantly reduce costs� There is significant potential for DHC to help meet fast-growing energy demand in cities around the world�
Figure ES1: Current share of final annual heating and cooling demand met by DHC
7%
51%
9%
34%
6%
0,4
% 6%
0%
10%
20%
30%
40%
50%
60%
China Denmark Germany Poland Switzerland Japan US
Shar
e of
tota
l dem
and
District heating
4%
4%
0,0
%
23%
0%
5%
10%
15%
20%
25%
Japan US Kuwait UAE
District cooling
Based on IRENA estimates

A sector roadmap for REmap 2030 3
Many countries envisage a growing role for DHC in their energy plans� Today, in most countries, renewables account for only a minor proportion of the energy used in such systems� However, as this study shows, renewables could feasibly supply more than 20% of the energy needed for DHC within a few years, given the right policy and technology choices now�Most DHC energy is currently provided by fossil fuels. Coal, for example, dominates the DHC energy mix in China, while natural gas is predominant in the US� In 2014, only about 5% of total district heat across the world was supplied from renewable energy�
In a few countries, such as Denmark and Switzerland, renewable energy already provides more than 40% of district heat supply. When not based on fossil fuels, most district heating currently relies on waste and biofuels, with more limited roles for geothermal and solar heat� District cooling mostly uses electricity (for compression chillers) and natural gas (for absorption chillers)� Renewable district cooling mainly involves free cooling schemes from nearby rivers, lakes and seawater�
This report examines the potential use of renewable energy in DHC up to 2030, based on three main technology pathways. The baseline “Reference Case” builds on the current national energy plans of each of the nine countries considered� The “REmap 2030” case includes the additional potential for renewables to be scaled up (in line with REmap) within the DHC capacity already planned, excluding any structural changes from decentralised to centralised systems� The third pathway, “Structural Shift”, takes into account the potential for more DHC capacity and assumes all that new capacity can be supplied by renewable energy�
Most country plans foresee growing demand for district heating, but with only a moderate or static share of this coming from renewable energy sources. Germany is an exception, with district heating demand falling by 2030 because of ambitious energy efficiency improvements in the building sector� However, the share of district systems in total heating demand still rises, because the most energy savings are seen in buildings using decentralised systems� In the Reference Case, the renewable share of DHC moderately increases in several countries but is unchanged in others� District cooling use grows in the UAE, in particular� None of the other countries examined has considered renewables for district cooling in existing energy plans�
Figure ES2: Breakdown of fuel use in DHC systems worldwide, 2014
Coal and its products
43.0%
Natural gas43.2%
Oil and its products
4.3%
Nuclear0.2%
Biofuels and waste6.5%
Solar0.0%
Geothermal0.2%
Other2.5%
Source: International Energy Agency (IEA) (2016)

RENEWABLE ENERGY IN DISTRICT HEATING AND COOLING4
All nine countries assessed could increase the use of renewable energy in DHC. This potential was assessed for 16 renewable energy technology options (including solar, natural water, geothermal and biofuel solutions), taking account of technology costs, resource availability, land use and other criteria� Although renewable energy could theoretically satisfy all DHC demand in 2030, the realistic potential for deployment differs from country to country�
Findings for the REmap 2030 case are as follows:
● China: The key market could realise a 24% renewable share in district heat generation, split equally between geothermal, bioenergy and solar� The further expansion of renewable energy is limited by recent additions of coal, which are expected to remain in the system for several decades�
● Denmark: An already high renewable share of 42% could reach 73%� The country will remain a global leader in large-scale solar energy, which can be expanded to meet 13% of total district heat demand by 2030, complemented by geothermal and bioenergy�
● Germany: Despite an overall decline in district heat demand, the expected addition of new heating networks allows the integration of more renewable energy capacity� REmap suggests a shift from bioenergy to geothermal (7% of district heating) and solar heat (6%), thereby diversifying supply to reach a renewable energy share of 34% by 2030�
● Poland: In the expected modernisation of ageing district networks, new coal-fired systems would satisfy just over half of its demand by 2030� Yet with different policies, renewables could contribute approximately a quarter of the total, predominantly through solid and gaseous biofuels�
● Switzerland: High electricity and natural gas prices up to 2030 create a favourable business case for renewable energy� The country’s unutilised biomass resource could play an important role in the fuel
Figure ES3: Share of DHC generated using renewable heat
0%
42%
4%
12%
40%
0% 3%
1%
51%
33%
11%
41%
21%
30%
24%
73%
34%
23%
45%
31%
36%
36%
74%
48%
30%
60%
37%
47%
0%
10%
20%
30%
40%
50%
60%
70%
80%
China Denmark Germany Poland Switzerland Japan US
Shar
e of
Ren
ewab
le E
nerg
y
District heating
0% 2% 0%
0%
0% 2% 0%
0%
31%
36%
12%
49%
37%
47%
20%
69%
0%
10%
20%
30%
40%
50%
60%
70%
80%
Japan US Kuwait UAE
District cooling
Today Reference case 2030 REmap 2030 Structural Shift
Based on IRENA estimates

A sector roadmap for REmap 2030 5
mix by 2030 if biomass supply costs are competitive� Biomass would meet 27% of total district heating energy demand� Geothermal and solar district heating could be expanded further to cover 17% and 2% of total district heating demand, respectively, by 2030�
● Japan: Up to 30% of total DHC generation could be renewable-based by 2030� Bioenergy is expected to be the main resource for district heating, while solar energy and free natural cooling from water bodies will contribute to district cooling�
● US: Electric and absorption heat pumps are already cost-effective, and biomass resources are available in large quantities across the country� According to REmap, the share of renewables in district heating could rise to 36% by 2030� Natural water and solar cooling could contribute 14% and 22% of total district cooling demand, respectively�
● Kuwait: The country has significant potential for renewable-based district cooling, which could reach 12% of total generation, mainly from seawater�
● UAE: Specific policy targets, ample renewable resources and experience with clean technologies point to a promising future for renewable district cooling, which could rise to nearly half of cooling in the country under REmap�
The potential for a structural shift – i.e. adding new renewable-based DHC capacity – varies greatly by country. Denmark, with significant existing capacity, can only accommodate another 5%, while Switzerland could add about 30%� These differences largely reflect the projected penetration of DHC in the Reference Case; in some countries this reaches its limit, whereas in others significant additional potential remains�
The economic rationale for scaling up renewables in DHC becomes particularly compelling when the costs of pollution and carbon dioxide (CO2) emissions are taken into account
Because of economies of scale, DHC is generally more cost-effective than decentralised systems. However, distribution infrastructure (including pipes and substations) constitutes a significant additional investment on top of generation costs� Overall cost-competiveness, therefore, depends partly on whether DHC uses existing networks or new capacity that requires new infrastructure� Centralised generation in existing networks costs 41% less than generation with new, decentralised capacity, analysis shows� Cost-competitive renewable energy options are available in many countries, especially with technologies using low-cost biomass residue as feedstock, and with geothermal heat and solar collectors� For district cooling, renewable options generally remain more expensive than conventional chillers in the countries evaluated, given the expected trends in energy prices to 2030�
The business case for increasing renewables in DHC hinges on technological diversification, as well as taking emissions reduction and health benefits fully into account. The REmap scenario for DHC comes with extra costs� If viewed in economic terms, reductions in carbon emissions and healthcare expenditure (due to avoided air pollution) entail savings, which can be maximised through the use of a diverse mix of renewable energy technologies� Many of these are expected to be more cost-effective by 2030 than their non-renewable counterparts� However, the REmap case, with its forward-looking policy and technology choices, also includes renewable energy technologies that might not yet be strictly cost-effective� In several countries, implementing the technology mix identified in REmap entails higher costs compared to the conventional approach�

RENEWABLE ENERGY IN DISTRICT HEATING AND COOLING6
Increased solid biofuel use, notably, would add to the external costs of local air pollution from DHC systems if technologies fuelled with natural gas are replaced� Solid biofuel use, however, can be complemented with the deployment of other renewable energy and low-carbon technology solutions, such as heat pumps coupled with renewable power or biogas�
Only in Poland would the substitution of non-renewable with renewable district heating unambiguously reduce costs, even without examining externalities� This is mainly due to the assumed potential for cost-effective conversion of coal power plants to biomass� When reduction of costs from air pollution and carbon dioxide emissions is accounted for, REmap offers net savings in China, Denmark and Kuwait, as well as in Poland�
Investments in renewable energy capacity for DHC need to be scaled up significantly to capture the potential in the sector. Under existing (Reference Case) plans and policies, average annual investment in renewable DHC capacity in the nine countries combined amounts to USD 1�4 billion between now and 2030� To achieve the additional renewable energy potential identified in REmap, this would have to increase to USD 9�6 billion per year� The Structural Shift pathway would require significantly higher investments, reaching USD 17�8 billion per year (excluding additional network investments of USD 6�6 billion per year)�
Fulfilling the potential for renewable energy in DHC across the world requires annual investment of USD 90 billion between now and 2030� This represents about 12% of the total annual investment needed to double the share of renewables in the global energy mix� Additional investments in efficiency and DHC system modernisation could further increase the total needed� Those factors, however, are beyond the scope of the present study�
Figure ES4: Additional costs and benefits of REmap options*
-35
-30
-25
-20
-15
-10
-5
0
5
10
15
20
25
30
35
40
Poland China Denmark Kuwait UAE Germany Switzerland Japan US
Cost
and
ben
efit [
USD
/GJ]
Costs and benefits of the REmap scenario
Additional external cost CO2 emissions USD 80/tonne
External cost CO2 emissions USD 20/tonne
Avoided external cost of localpollutants
External cost local pollutantsREmap scenario
Average substitution cost
Total at USD 20/tonne of CO2
Total at USD 80/tonne of CO2
Based on IRENA estimates
* Countries sorted according to rising net cost at USD 20 per metric tonne CO2

A sector roadmap for REmap 2030 7
Optimising system operation, achieving economies of scale, mitigating risks, integrating storage and holistic urban planning are all essential to accelerate the deployment of cost-effective DHC systems
Several key factors strengthen the business case for renewable-based DHC. First, optimised operation can greatly improve the cost-effectiveness of DHC systems� This implies sufficient demand for heating and cooling over the lifetime of a system, so that revenues compensate for high upfront investments� Economies of scale, achieved through larger networks, can also reduce costs� Meanwhile, with emerging technologies, gradual expansion can reduce project risks in comparison to large, one-off investments� As an example, solar district cooling can be achieved through solar thermal collectors to drive an absorption heat pump� Demonstration projects can be a starting point, with the option to expand once technology acceptance is sufficient and commercial viability is established� In many locations, more information is needed about resource availability, especially for geothermal and natural water cooling�
As reliance on solar and wind energy grows, DHC systems will offer increasingly attractive synergies. Mismatches between load patterns and supply from these variable renewable resources, including direct use of solar heat, can already be balanced to a great extent with thermal storage facilities� Storage is expected to become even more integral, with DHC systems coming to play a pivotal role in enabling variable renewable power integration� With power-to-heat solutions (heat pumps, electric boilers), excess electricity generated when there is abundant sun or wind can be used to produce district heat or cooling� This can subsequently be stored (e.g. heat in hot water tanks, or cold in the form of ice)� These applications are only used in a few places today but have significant potential as countries become increasingly dependent on variable renewables�
The introduction of renewable DHC in dense urban environments calls for careful planning. Some renewable energy technologies entail considerable space requirements, which need to be addressed either through smart integration within the city or by using resources outside the city core� For example, solar collectors could be integrated into the urban environment through landfill sites and the rooftops of large commercial buildings� Geothermal wells on the urban fringe can be connected to networks that serve consumers throughout the city� If such solutions can be identified, dense urban areas with existing networks offer good conditions for renewable-based DHC systems� The more customers can share upfront costs, the lower the cost will be for system establishment or conversion�
Cities expanding their DHC networks are especially suitable for renewable DHC. The expansion of existing networks provides the change to optimise design parameters and achieve overall improvements, such as minimisation of the network temperature� New networks provide even more freedom to set the system’s operating parameters, thereby allowing higher shares of renewables� However, new networks come with barriers, too, such as higher investment costs and a limited set of customers�
Areas for action exist at both the national and city levels
While DHC systems may be integral to a country’s energy infrastructure, they are often operated at city level� Both national and city policy makers must play their part for the full potential of renewable energy in DHC to be captured�
National policy makers need to:
● Encourage and facilitate renewable energy adoption in the DHC sector. In some countries, this includes creating a level playing field and improving the business case for renewable energy use in DHC� Countries can also set specific medium- to long-term targets, which are mostly absent at the moment� Setting predictable and realistic targets provides a clear indication to businesses and investors that there is a market for a certain technology� Finally, regulatory changes may be required

RENEWABLE ENERGY IN DISTRICT HEATING AND COOLING8
to capture the full potential of renewables� For example, in some countries, heat production from otherwise curtailed electricity is not possible under current regulations� This limits the opportunities for DHC systems to balance out variable renewable power�
● Expand renewable resource assessments and promote demonstration projects for emerging technologies. The availability and suitability of renewable resources for DHC is often unclear� National resource assessments around key demand centres (e.g. major cities, industrial sites) can be more efficient in terms of time and cost than case-by-case project feasibility assessments� These can include an evaluation of geothermal conditions, the energy potential from water bodies, or the local availability of biomass feedstock� For emerging technologies, such as solar district cooling or power-to-heat applications, demonstration projects have a significant positive effect on investor and customer confidence�
City policy makers need to:
● Develop an understanding of the local renewable resource base, identify demand patterns for heating and cooling, and explore synergies with existing infrastructure. A broad understanding of the local renewable resource base is needed in order to identify the most appropriate technologies� Ideally, such knowledge ought to build on and complement national resource assessments� Local demand patterns for heating and cooling must also be understood in order to determine the viability of renewables to balance energy supply and demand� Where DHC systems are already in place, opportunities can be identified to replace inefficient or polluting fossil fuel plants� The availability of suitable renewable resources may strengthen the business case for new networks to replace conventional decentralised generation� In addition, synergies should be explored with the urban environment and infrastructure� For example, rooftops and urban wasteland might provide suitable sites for solar collectors� Meanwhile, street-level excavations to install DHC network piping may be combinable with other urban infrastructure projects�
● Engage with a broad set of stakeholders. DHC networks often encompass different sectors and stakeholders, including water utilities, municipal waste processers, the power sector and large industrial energy users� Their involvement in planning to increase the share of renewables is vital to ensure a stable and efficient operation of DHC systems� When integrating emerging technologies and novel applications, research institutes can help uncover the unknowns in the project� Other cities and projects can provide valuable insights and expertise� Various city networks provide platforms to share lessons from past successes and mistakes� These include, for instance, the C40 Cities Climate Leadership Group, ICLEI – Local Governments for Sustainability5, the United Nations Environment Programme (UNEP) and the Global Covenant of Mayors for Climate and Energy�
5 Founded in 1990 as the International Council for Local Environmental Initiatives�

A sector roadmap for REmap 2030 9
1�1 IRENA’s REmap programme
The REmap programme aims to encourage accelerated renewable energy development through a series of activities including global, regional and country studies� REmap analysis and activity also informs IRENA publications on specific renewable technologies or energy sectors�
The REmap programme works closely with governmental bodies and other institutions responsible for energy planning and renewable energy development� The analysis relies on broad consultations with energy experts and stakeholders from numerous countries around the world�
Ever since its launch, REmap has been IRENA’s proposal for a pathway to support the United Nations Sustainable Energy for All initiative in its objective to double the global share of renewable energy from 18% in 2010 to 36% by 2030 (UN and World Bank, 2016)� Later, the Paris Agreement was adopted at COP21 in 2015 with a target to minimise the earth’s surface temperature increase to below two degrees Celsius (°C) by 2050� The widespread development of renewables is a critical lever fulfilling this objective�
REmap takes a bottom-up approach to assess how a doubling of the share of renewable energy in the total global final energy mix can be achieved by 2030 compared to the level today� National assessments are carried out to ascertain the potential contribution each country could make to the overall renewable energy share� The first global REmap report, published in 2014, included a detailed analysis of 26 major energy-consuming countries representing around 75% of global energy demand� The REmap programme has since expanded to 40 countries accounting for 80% of world energy use�
The REmap evaluation of the national plans of 40 countries (which could be viewed as the business-as-usual case) suggests that under current conditions and policy approaches, the global share of renewables increases to only 21%� This falls 15 percentage points
short of the target to double the global renewables share by 2030 (IRENA, 2016)�
1�2 Role of district heating and cooling
To double the share of renewable energy in global energy consumption, accelerated deployment is needed across all sectors� This includes end-use sectors, such as buildings, industry and transport, and also transformative sectors, such as power generation and district heating and cooling (DHC)� While renewable power generation has made clear progress and received considerable attention, the role of renewable DHC remains uncertain�
In 2014, renewable district heat represented just 1% of renewable energy use worldwide while the contribution of renewable district cooling was insignificant (IRENA, 2016)� Under REmap, the contribution of renewable district heat to total renewables use would increase to 3% by 2030, amounting to about 3�4 exajoules (EJ) of renewable district heat generation� More than 90% of this potential is represented by bioenergy, and the EU and China account for most of its use�
This study builds on this earlier assessment and provides a detailed analysis of the potential of renewable DHC for a broad set of countries, applications and technologies� It covers both the potential for renewable district heating and the potential for renewable cooling� The latter is growing in importance in several countries around the world� The objective is to provide a comprehensive evaluation of the cost and benefits of renewable DHC and its potential to help achieve the targets in the Paris Agreement�
1�3 Approach
Two complementary approaches form the foundation of this study� First, a large number of case studies6
6 See case studies in separate document at www.irena.org/remap.
1. INTRODUCTION TO REMAP

RENEWABLE ENERGY IN DISTRICT HEATING AND COOLING10
of renewable DHC systems are analysed to extract relevant barriers and opportunities to scaling up deployment (section 2�3)� These cases span a wide range of geographies and technologies to provide a comprehensive overview of what it takes to successfully expand renewable DHC systems�
Second, this study analyses the DHC sector today (section 2�2) and its potential evolution to 2030 (section 3) in nine countries� The choice of the countries considered in the scenarios is motivated by their diverse approach to using DHC systems and the role included for renewables� This is driven by e.g. climate, resource and the historical development of the energy infrastructure�
For each of these countries, the business-as-usual outlook to 2030 is provided first (Reference Case in this study), based on current and planned policies extracted from national energy plans� Next, the additional potential across renewable technologies and applications is estimated (REmap), based on the Reference Case outlook for the DHC network� Thus no additional capacity expansion of DHC infrastructure is assumed in REmap; instead, conventional generation is avoided through the more ambitious expansion of renewable generation� Finally, a Structural Shift scenario is presented, building on REmap, which allows the expansion of existing DHC networks or new networks and is based on renewable generation of heating and/or cooling� Comparing these scenarios thus allows the assessment of the costs and benefits of substituting conventional for renewable DHC generation in the expected energy system in 2030 (REmap)� At the same time, it shows whether there is further potential for substituting decentralised conventional heating/cooling generation with renewable DHC generation (Structural Shift)�
To estimate the potential for renewable DHC technologies by 2030 in these countries, a number of factors were taken into account (see figure 1):
● The current state of DHC in each country is a result both of past and present regulations and policies as well as resource availability� Options for renewable district heating (China, Denmark, Germany, Poland, Switzerland), renewable
district cooling (Kuwait, UAE), or both (Japan, US) are considered in the context of the climate and existing use of centralised energy� The assessment of the current state of DHC networks is based on information gathered from national statistics and meta-analysis of existing networks�
● Future demand for DHC is taken from several national studies, including national energy plans� The outlook for DHC affects the additional renewable energy potential under REmap but not under the Structural Shift scenario, in which decentralised conventional systems are also replaced by renewable DHC�
● To assess the renewable resource availability for DHC, detailed geographical studies were conducted for natural water cooling, geothermal heat, and solar heating and cooling� The assessment of the biomass potential is described in a separate report (IRENA, 2014)� In addition, the competition from other sectors was taken into account� The definition of renewable DHC is limited to renewable heat sources or sinks� Schemes involving the use of renewable electricity for the generation of heat and cooling are not considered renewable� Nevertheless, the electrification of the sector is an important component of REmap�
● Cost data for both centralised and decentralised heating and cooling technologies, the distribution infrastructure and fuels was gathered from various sources� The calculation of average levelised cost values is based on a statistical approach�
● Finally, political and regulatory frameworks in each country have a strong impact on support for renewable DHC� Whether a country already has DHC networks and includes additional opportunities in national energy plans affects the assessment of its realistic renewable DHC deployment potential up to 2030�
A more detailed description of the method and data sources is provided in annex 1�

A sector roadmap for REmap 2030 11
Figure 1: Key factors influencing potential for renewable DHC with REmap
REmap 2030Potential of
renewables in district energy
networks
HC/DHCdemandin 2030

RENEWABLE ENERGY IN DISTRICT HEATING AND COOLING12
2. RENEWABLE DISTRICT HEATING AND COOLING TODAY
CHP) plants� In Germany, almost 90% of district heating systems have CHP plants�
● Coal plays a leading part in the district heating systems in China, Poland, Germany and Denmark, covering between 90% (China) and 24% (Denmark) of heat generation� In other countries, natural gas also accounts for a large share of the mix, such as in the US (73%), Japan, (55%), Germany (45%), and Switzerland (31%)� District cooling is mainly supplied by electricity (with the exception of Japan, where natural gas is also used)�
● Policy efforts to promote DHC systems vary widely by country in terms of size and scope� Strong national frameworks are in place in Denmark and Germany, which regulate and provide support for district heating systems� In China, specific targets for building up district heating are included in the country’s five-year plans� The policy focus in Poland is on renovating the existing infrastructure�
● In other countries, DHC policies tend to be implemented on a subnational level� This is the case in e.g. Switzerland, which subsidises renewable district heating in some cantons� Meanwhile, the Emirate of Abu Dhabi in the UAE set a goal to raise the share of district cooling in total cooling use to 40%�
● A detailed assessment of renewable DHC projects resulted in 21 case studies which yielded specific lessons learned for the main renewable DHC technologies� These were solar heating,7 solar cooling, geothermal heating, biomass, and natural water cooling using cold water from lakes, rivers and the sea� Key success factors identified
7 Throughout the report, the solar thermal systems discussed relate to solar thermal installations only� Heat from heat pumps powered through PV is not considered�
Key points
● The use of renewable DHC is driven by several factors� It has environmental (reduced emissions and air pollution) and systemic benefits (positive impacts on the electric grid, DHC infrastructure and local economy)� It can make use of synergies in the urban context (suitable integration into urban environment; reduced space needs) and can increase energy security (reduced fuel imports, diversification of energy mix)�
● The role of DHC is highly diverse across countries, and its use seems to be more influenced by institutional factors and historic developments than climate conditions�
● In Denmark and Poland, district heating satisfies a major share of the total demand for heat (51% and 34% respectively)� Driven by urbanisation, China has rapidly increased its use of centralised systems in the country’s northern regions� In the other countries assessed, the district heating share ranges between 0�4% (Japan) and 8�6% (Germany)�
● District cooling is primarily used to supply space cooling to commercial buildings� Its deployment is largely independent of the climate and systems can be found across a broad range of latitudes� In the United Arab Emirates (UAE), it covers more than 20% of the total space-cooling load, partly in residential buildings� Strong policies are in place to increase this share in the UAE but district cooling has received limited attention in the other countries assessed�
● Renewable DHC is currently dominated by the use of biomass for district heating� The share of renewable energy in district heating is highest in Denmark (42%) and Switzerland (40%)� In most countries the bulk of district heating is covered by co-generation (combined heat and power, or

A sector roadmap for REmap 2030 13
include optimising network operations, capturing economies of scale, exploiting synergies with the urban environment and addressing the mismatch between energy demand and supply�
DHC is used very differently across countries, regions and cities� It is generally recognised as a viable approach in most of the countries considered, albeit for different reasons� Section 2�1 provides an overview of the key drivers supporting an accelerated uptake in renewable DHC�
District heating is widely used in parts of Europe, North America and Asia� In Europe, it covers 12% of total heat demand (Euroheat & Power, 2015)� In countries in Scandinavia and Central and Eastern Europe, large heat distribution infrastructures were developed during the second half of the 20th century� In these countries, it remains the principal way to provide energy for space and water heating in urban areas� In countries in Western Europe, such as Germany and Switzerland, district heating makes a more modest but nevertheless considerable contribution, and its input into the energy mix has been relatively stable in recent years� In China, district heat is growing due to rapid urbanisation and the potential of district energy to provide cost-efficient heating services, especially to new urban developments�
District cooling is used to provide space cooling to residential and commercial buildings� It can be found in cities with very different climates, such as Stockholm (Sweden) and Manama (Bahrain)� This approach is considered to be rather novel in most countries� However, the UAE, for example, has recognised its potential and put in place specific policies to drive expansion� Section 2�2 provides a detailed assessment of the current role of (renewable) DHC in each country�
Both district heating and district cooling have been primarily based on fossil fuels up until now, with coal and natural gas meeting the bulk of demand� Nevertheless, successful renewable energy projects for centralised heating and cooling have been implemented under a wide range of conditions� This is further discussed in section 2�3, which contains lessons learned for the following resource types: solar (heating and cooling), geothermal, biomass (including municipal solid waste) and natural water cooling� Waste heat from industrial processes and sewage water are not considered renewable in this study�
2�1 Drivers
A number of factors drive the expansion of renewable DHC systems� These vary somewhat between regions and might apply rather differently to different renewable technologies� Nevertheless, they can generally be categorised into environmental benefits, systemic benefits, synergies with the urban environment and increased energy security (see table 1)�
A more detailed description of each of the underlying drivers is provided below, mainly based on the 21 case studies of the renewable DHC projects�
Environmental benefits
● Supports achievement of clean energy targets. Emission targets on a municipal level are the primary driver of many of the transformations described in the case studies� These targets relate specifically to the district energy system (e.g. Munich 8: 100% renewable by 2040) or the whole city (e.g. Copenhagen: CO2 neutrality by 2025)�
● Reduces urban air pollution. The combustion of coal in urban centres in particular is devastating because the impact of air pollution is felt more in places with high population densities� This is exacerbated by inefficient heat generators in many cities of the developing world� For example, this has been reported as the primary motivation for a major upgrade to Hohhot’s heating system�
● Provides fast and cost-effective greenhouse gas emission abatement. Given that it is larger scale than individual heating and cooling facilities, renewable DHC allows faster and cheaper greenhouse gas emissions reduction� One example is the conversion of large coal-fired CHP plants to biomass combustion (e.g. in Copenhagen)�
● Reduces freshwater consumption. Sea and lake water cooling can provide valuable co-benefits because there is less need for cooling towers on the chiller’s condenser side� This is relevant
8 All city names refer to the corresponding case studies available online at www.irena.org/remap.

RENEWABLE ENERGY IN DISTRICT HEATING AND COOLING14
renewable sources provides relief to electricity grids�
● Leverages local resources. The use of local organic waste material in biomass co-generation plants or boilers helps to optimise the local waste handling system and to redirect waste streams to more valuable use� Many of the cities described in the case studies make use of local biomass and attribute great importance to the local origin of the resource (e.g. St Paul, US, Sauerlach near Munich in Germany and Vilnius in Lithuania)� The use of local biomass resources supports the local economy and keeps money circulating within the municipality�
● Economies of scale� While biomass and solar energy can also be employed in an individual building, some approaches using renewables only make sense when implemented at sufficiently large volumes� This includes natural water cooling and deep geothermal heat� Many other technologies can benefit from significant economies of scale, such as large-scale solar
in many arid regions of the world and has been quoted as a driver for the use of seawater in the system in Bahrain Bay, for example�
Systemic benefits
● Provides cross-sectorial benefits. By using surplus wind power for heating, curtailment can be avoided� Similarly, electric boilers are being employed to provide regulating services, given that wind and solar power capacities are being expanded (e.g. Lemgo)� Another beneficial synergy arises from the generation of electricity in district heating co-generation plants� Since heat production and hence electricity generation from CHP are concentrated in winter, this electricity complements the output from PV� CHP plants in Germany receive support partly for this reason (UNEP, 2015a)�
● Reduces pressure on the electric grid. Cooling equipment in individual buildings consumes the bulk of electricity in many countries with hot climates� Hence, demand met through centralised
Table 1: Overview of renewable DHC drivers
Environmental benefits
Environmental drivers are related to the benefits from replacing or avoiding less efficient decentralised heating or cooling equipment and district heating based on fossil fuel�
Clean energy targetsUrban air pollutionFast and cost-effective CO2 emission abatementFresh-water savings
Systemic benefits
District energy interacts with surrounding systems in multiple ways, including the electric grid, the waste sector and the local economy� This can be one motivation for implementing renewable energy schemes� In addition, the properties of district energy itself are beneficial for the use of renewables�
Cross-sectoral benefitsSupport for the electric systemLocal resources and economyScale of demand in district heatingSmoother demand profilesSynergies of connected heating and cooling sourcesAvailability and viability of storage
Synergies with the urban environment
District energy systems are inherently appropriate to urban landscapes: they benefit from and support this environment�
UrbanisationAvoidance of decentralised facilitiesIntegration in urban buildings and infrastructureSmall footprint
Increased energy security
With the exception of biomass, renewable district heating relies primarily on local resources or technologies that use no liquid or solid fuels�
Energy independenceEnergy diversificationPrice stability

A sector roadmap for REmap 2030 15
facilities, as well as biomass boilers and co-generation plants�
● Levels out the energy demand mix� Combining the load profiles of different types of consumers (residential buildings, shops, industrial facilities) evens out the demand pattern� Since many renewable heat sources incur high investment but low running costs, a smooth baseload all year round improves their economics� In addition, some renewable heat sources have limited flexibility: solar heating and cooling is available during the daylight hours of the summer months� If some consumers require heat at all times, such resources are put to better use, and less storage capacity is needed�
● Provides synergies with other sources of DHC generation� Interconnecting a wide range of heat sources allows portfolio costs to be optimised� For example, geothermal heat to satisfy the baseload can be combined with flexible biomass or waste CHP plants to react to more variable demand�
● Allows more cost-effective energy storage� The specific benefits of storage increase sharply with size� Larger hot water tanks benefit from reduced thermal losses and lower investment requirements per unit of capacity� Therefore, since many renewable heat and cooling resources require storage capacity to match their inflexible output to demand, they benefit from the large scale of district energy systems�
Synergies with the urban environment
● In line with global urbanisation trends. The growth of urban centres facilitates the construction of district networks (due to lower integration costs in greenfield environments) and renewable heat sources in particular� This is because it becomes possible to adapt the system’s operating parameters to the new networks� This motivates the construction of district energy systems in expanding systems (e.g. in Munich) or new systems (e.g. in China)�
● Space saved by avoiding the construction of decentralised facilities. The development
of conventional or renewable district energy systems reduces the need for decentralised heating and cooling facilities� This is a general advantage because it saves significant space at the individual building level� Natural water cooling is a prime example� The lack of a need for cooling towers permits highly integrated solutions (e.g. in Paris)�
● Optimal integration in the urban environment. District energy facilities do not need to be integrated into buildings but can make flexible use of urban spaces� This includes both facilities still in operation (integration in urban transport infrastructure e.g. in Paris; large-scale rooftops e.g. in Singapore) and urban wasteland (e.g. a disused urban landfill site in Graz)�
● Reduces geometric footprint. Compared to conventional heating and cooling facilities, many renewable solutions benefit from a particularly small geometric footprint, which allows them to be integrated into urban environments with very low visual impact� This is especially true for geothermal wells (e.g. in Munich) and natural water cooling (e.g. in Paris)�
Increased energy security
● Increases energy security. Renewable heating and cooling options (with the exception of imported biomass) exploit local resources which vary little in price� This is a noticeable advantage in countries which import fossil fuels or have fossil fuel shortages�
● Increases energy diversification. A balanced mix of heating types increases the resilience of the energy system by reducing dependence on a single fuel like natural gas or coal�
● Improves energy price stability. Many renewable DHC systems do not rely on fuel, and their costs are therefore very predictable throughout their lifetime� Local bioenergy resources are less affected by fuel prices on the world markets� This is among the primary reasons for the switch from natural gas to biomass in Lithuania or the introduction of lake water cooling in Geneva�
RENEWABLE ENERGY IN DISTRICT HEATING AND COOLING16
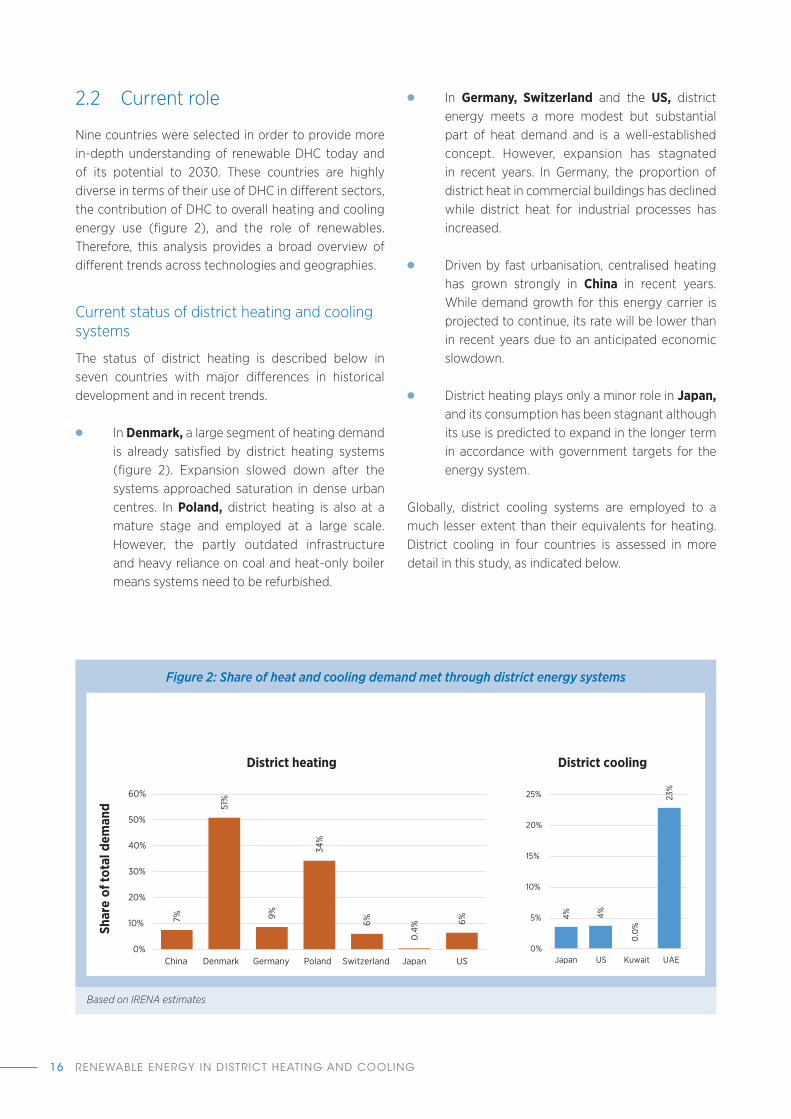
2�2 Current role
Nine countries were selected in order to provide more in-depth understanding of renewable DHC today and of its potential to 2030� These countries are highly diverse in terms of their use of DHC in different sectors, the contribution of DHC to overall heating and cooling energy use (figure 2), and the role of renewables� Therefore, this analysis provides a broad overview of different trends across technologies and geographies�
Current status of district heating and cooling systems
The status of district heating is described below in seven countries with major differences in historical development and in recent trends�
● In Denmark, a large segment of heating demand is already satisfied by district heating systems (figure 2)� Expansion slowed down after the systems approached saturation in dense urban centres� In Poland, district heating is also at a mature stage and employed at a large scale� However, the partly outdated infrastructure and heavy reliance on coal and heat-only boiler means systems need to be refurbished�
● In Germany, Switzerland and the US, district energy meets a more modest but substantial part of heat demand and is a well-established concept� However, expansion has stagnated in recent years� In Germany, the proportion of district heat in commercial buildings has declined while district heat for industrial processes has increased�
● Driven by fast urbanisation, centralised heating has grown strongly in China in recent years� While demand growth for this energy carrier is projected to continue, its rate will be lower than in recent years due to an anticipated economic slowdown�
● District heating plays only a minor role in Japan, and its consumption has been stagnant although its use is predicted to expand in the longer term in accordance with government targets for the energy system�
Globally, district cooling systems are employed to a much lesser extent than their equivalents for heating� District cooling in four countries is assessed in more detail in this study, as indicated below�
Figure 2: Share of heat and cooling demand met through district energy systems
7%
51%
9%
34%
6%
0.4
% 6%
0%
10%
20%
30%
40%
50%
60%
China Denmark Germany Poland Switzerland Japan US
Shar
e of
tota
l dem
and
District heating
4%
4%
0.0
%
23%
0%
5%
10%
15%
20%
25%
Japan US Kuwait UAE
District cooling
Based on IRENA estimates

A sector roadmap for REmap 2030 17
Table 2: Parameters illustrating volumes of heat supply from district heating networks in selected countries
Unit China Denmark Germany Poland Switzerland Japan US
Heat sold PJ 3 182 (2014)
107 (2013)
399 (2014)
344 (2010)
18.3 (2015)
9.0 (2014)
455 (2010)
Installed district heating capacity
MW 462 595 (2013)
30 031 (2014)
49 799 (2014)
56 521 (2013)
2 466 (2013)
4 241 (2013)
89 600 (2011)
Network length
km 187 184 (2014)
29 000 (2013)
20 252 (2014)
16 100 (2013)
1 432 (2013)
672 (DH
and DC together)
(2013)
3 320 (2013)
Number of networks
– Half of all major
cities
394 (2013)
1 342 (2014)
317 (2013)
153 (2013)
136 (DH
and DC together)
(2015)
2 500 estimated, 5 800 (DH
and DC together)
Historic trend
– Near linear growth of 140 PJ per year since
2001
Near linear increase
of 2 PJ per year in
1975-2000 which has flattened
since 2000
Fairly constant
since 2003; increase in industry,
decrease in commercial customers
Small decrease
in capacity 2009-2013
despite pipeline
extensions; heat sales stagnant/
small decline
Constant increase in final
consump-tion of 280
TJ/year since 1978
Stagnant consump-tion since
2000
Connecting about 1% of additional customer
floor space to district heating
Sources: China: National Bureau of Statistics of China (2016), Odgaard (2015); Denmark: Danish Energy Agency (2014), Dansk Fjernvarme (2014); Germany: BMWi (2015), AGFW (2015); Poland: IRENA, Central Statistical Office of Poland (2014); Switzerland: Bundesamt für Energie (2016); Japan: Kainou (2014), JHSBA (2016); US: IRENA, Euroheat & Power (2013), Cooper et al. (2012); multiple countries: Euroheat & Power (2015)
By 2014, the use of district cooling in Japan had declined by 19% since its peak in 2006� This is in line with overall energy efficiency efforts in the country�
● In the US, floor space cooled through district systems is growing� In 2007-2011, between 1�6 million square metres (m2) and 2�3 million m2 of cooling capacity was added each year (Euroheat & Power, 2013)� However, district cooling continues to meet a minor proportion of US demand for total cooling�
● Kuwait has limited experience of centralised cooling solutions so far� The construction of cold water networks has been announced
for individual projects�9 However, there is no information on any systems that may be already operating despite the fact that district cooling is explicitly included in the country’s Building Energy Code of Practice (Al Jandal, 2012)�
● In the UAE, around 23% of cooling demand is satisfied through centralised generation and cold water pipes� The high proportion of centralised cooling in the UAE is due to both the hot climate
9 e.g. in the residential area of Al-Mutlaa (Kuwait Times, 2014) and Sabah Al-Salem Kuwait University City (Kuwait University, 2016)� It is envisaged that these centralised systems will be fuelled by natural gas and electricity�

RENEWABLE ENERGY IN DISTRICT HEATING AND COOLING18
and the country’s push for smart building solutions and unified building codes�
The usage of DHC across sectors also varies greatly among the countries considered (see figure 3)� In Denmark and Poland, district heating is mainly used for residential space heating� By contrast, commercial and
industrial use is also a large part of the mix in China, Germany and Switzerland� This is primarily an outcome of a policy focus in Denmark and Poland directed at large-scale district heat use to provide heat to the majority of households� In the Japan and the US, the mix is dominated by generally smaller DHC networks for commercial applications (e.g. hospitals, military
Table 3: Parameters illustrating volumes of cooling supply from district cooling networks in selected countries
Unit Japan US Kuwait UAEEnergy sold TJ 12 311
(2014)88 972 (2011)
- 114 000*
Installed district cooling capacity
MW 3 960 (2013)
16 234 (2013)
- 10 551 (2013)
Length of district cooling networks
km 672 (DH and DC together)
(2013)
596 (2011)
- 234** (2015)
Number of district cooling networks
– 139 (DH and DC together)
(2014)
5 800 (DH and DC together)
none/ data missing
46** (2015)
Trend: energy sold
- Peak in 2005, decrease thereafter
Steady growth; about 1�9 million m2
connected per year
– Rapid buildout; specific target as share of total
cooling demand in 2030
* Based on installed capacity, 3 000 full-load hours and around 20% of cooling demand (UAE Ministry of Energy, 2015).
** Excluding military infrastructure.
References: Japan: Kainou (2014), JHSBA (2016); multiple countries: Euroheat & Power (2013), Euroheat & Power (2015)
Figure 3: Usage share of district heat and cooling by sector and application
0%
10%
20%
30%
40%
50%
60%
70%
80%
90%
100%
China Denmark Germany Poland Switzerland Japan US
Shar
e of
dis
tric
t hea
ting
dem
and
Households Industry Commercial Space heating Warm water Process heat
0%
10%
20%
30%
40%
50%
60%
70%
80%
90%
100%
Japan US* Kuwait UAE
Shar
e of
dis
tric
t coo
ling
dem
and
Households Industry Commercial
*Based on the breakdown of district heat use and anecdotal evidence; data missing

A sector roadmap for REmap 2030 19
bases, school campuses, downtown commercial and administration centres; Nuorkivi, 2016)� Although some larger city networks do exist in the US, they are not as prevalent as in the European countries selected for this study� Finally, district cooling in the UAE consists largely of commercial applications (e.g. malls and office buildings) although the share of residential users is not insignificant (about a quarter of district cooling demand)�
Finally, technical properties of DHC systems also differ greatly across countries� They have profound implications on both the operation and the economics of systems� Listed below are a few observations of key characteristics� A more comprehensive overview is provided in annex 2�
● Linear heat density describes the ratio of the annual load (in units of energy) and the total length of the network (in metres)� Low linear demand density means that high investment costs per unit of heat for the pipe infrastructure are necessary� This increases the levelised cost of district energy� Linear heat densities are especially high in Denmark, where district heating is used even in smaller towns with low urban density�
● Heat losses are influenced by the quality of the distribution infrastructure and the linear heat density� Generally, when the heat density is low, heat has to be transmitted over longer distances, and losses are higher� This is the case in Denmark, where efforts are being made to reduce heat losses by switching to lower temperatures in distribution networks� Relatively high heat losses are also a concern in China and Poland� However, the situation has improved in Poland in recent years due to targeted renovation measures�
● Storage is an integral part of modern CHP and aligns the production of heat with demand for electricity� Larger storage facilities are combined with solar district heating systems to permit better use of the solar heat in winter� In district cooling systems, storage is needed because of the presence of electric chillers and time-of-use electricity rates� The storage capacity for cooling reported for the US is equal to 62% of generation capacity� In Dubai in the UAE, storage must
represent 20% of design capacity of all new district cooling plants (Government of Dubai, 2010)�
● Steam is generally considered an outdated energy carrier for district heating (except for industrial applications) and has largely been replaced by hot water� For example, the heat supplied through steam-based systems in China has declined since 2004, and the expansion of district heating systems is based on hot water only (Odgaard, 2015)�
Heating and cooling energy mix
In the countries assessed, fossil fuels are still an important source of energy for total heating while cooling is usually powered by electricity (figure 4)� Coal fulfils a large share of heating energy needs in China, Poland and Japan� Natural gas is used more in Germany and the US while in Switzerland petroleum products continue to provide a large proportion of heating energy needs� The share of (direct use) of renewable energy for heating ranges from virtually zero in Japan to 14% in Poland (mainly from bioenergy)� This shows that expanding DHC systems based on renewables could become an important way to reduce fossil fuel combustion for heating�
DHC uses a wide variety of generation sources across countries (figure 5)� The share of renewable resources in most countries is modest, ranging from close to zero in China and Japan to nearly one-third in Denmark� A few observations from each country are outlined below�
● Coal dominates district heating supply in China and Poland and is fuelling boilers and CHP plants� In China, inefficient coal boilers (with 60-65% conversion efficiency) are still common (Odgaard, 2015), and coal provides 90% of total district heating energy� In Poland, the share of coal also amounted to 90% in 2001 but has since been reduced to about 73% due to the increased uptake of biomass and municipal waste (KPMG, 2009)�
● Natural gas and coal are the main inputs in district heating plants in Denmark, Germany and the US� CHP plays a more important role in these countries than in China and Poland� In addition to

RENEWABLE ENERGY IN DISTRICT HEATING AND COOLING20
Figure 4: Breakdown of heating and cooling energy use today*
7%
51%
11%
4%
15%
11%
86%
10% 5% 14%9%
6%
6%
62%
100%
77%
23%18%
6%
44%
23%
12%
37%
31%
32%
6%
6%
30%
17%
34%
9%
12%
57%
9%
0%
10%
20%
30%
40%
50%
60%
70%
80%
90%
100%
China Denmark Germany Poland Switzerland Japan US Kuwait UAE
Shar
e of
tota
l hea
ting
and
cool
ing
dem
and
District energy Electricity Gas Oil-based Coal Renewable energy Others
* Cooling is included for Japan, the US, Kuwait and the UAE.
Sources: Odgaard (2015), DEASTAT2015, German Federal Ministry for Economic Affairs and Energy (2015), ODYSSEE (2013), Swiss Federal Office of Energy (2016), Prognos (2015), Kainou (2014), EIA AEO (2016)
Figure 5: Current district heating and cooling generation mix in countries selected
0%
10%
10%
90% 24%
22% 45% 55% 73%
24% 17%12%
42%
73%
31%
6%
12%
4%
20%
42%
8%18%
7%
32%
30%
40%
50%
60%
70%
80%
90%
100%
China Denmark Germany Poland Switzerland Japan* US
District heating
Biomass Geothermal Solar Nuclear CHPHeat pumps (output) Electricity Waste heat CoalOil Natural gas Waste OtherShare renewable
0%
10%
20%
30%
40%
50%
60%
70%
80%
90%
100%
Japan US Kuwait UAE
District cooling
Free cooling Absorption chiller
Heat pump Compression chiller
Industrial surplus heat Share renewable
Perc
ent a
ge o
f dis
tric
t ene
rgy
gene
rati
on
14%5%
17%
69%
90% 95%
5%
*Japan includes heating and cooling.
No centralised cooling systems are in operation in Kuwait.
Sources: Xiong et al. (2015), Danish Energy Agency (2014), Euroheat & Power (2015), JHSBA (2016), Euroheat & Power (2013), Euroheat & Power (2013), Euroheat & Power (2015)

A sector roadmap for REmap 2030 21
fossil fuels, Denmark relies heavily on municipal waste CHP plants�
● In Switzerland, the most significant source of heat is the combustion of waste material (both organic and based on fossil fuels)� This is complemented by natural gas and waste heat from nuclear power plants�
● Japan makes by far the greatest use of industrial surplus heat, which is used to drive absorption heat pumps for heating and cooling� Similarly, natural gas is used for boilers/CHP plants and to drive heat pumps�
● In the US and UAE, low electricity prices mean electric chillers provide the bulk of centralised cooling power� In Japan, systems fuelled by gas play a more important role� While not included in the official statistics, renewable schemes have been reported for Japan� This notably includes the seasonal storage of snow to cover cooling demand in summer�
Policies and regulations
The viability of DHC systems is greatly influenced by national legislation and in some countries by subnational policies� The policies directly related to DHC in each country examined are shown in table 4�
While most countries implemented policies relating to DHC, Denmark and Germany have the most comprehensive national legislation in this area� In these countries, policies include details on federal support, targets, conditions for connection and customer protection� In other countries, support policies have included low interest loans (Japan), connection obligations (Poland), support for resource assessments (Switzerland), tax exemptions (US), and explicit targets (UAE)� However, specific policies supporting renewable-based DHC systems remain fairly limited in the countries assessed, apart from Denmark, Germany and Switzerland�
Box 1: District heating in the Russian FederationThe Russian Federation operates the largest district heating system across the world today, with three-quarters of citizens connected to a network� In 2007, around 50 000 systems were installed, and there were 17 000 district heating utilities� Municipal centralised heating networks alone amount to 170 000 km (Euroheat & Power, 2013; IEA, 2015b; Lychuk et al., 2012)�
District heat in the Russian Federation supplies both buildings and industry, which accounts for about 35%-45% of district heating demand� A wide range of technologies is used for centralised heat generation, including industrial surplus heat (about 5% of generation) and nuclear heat (0�2%) (Euroheat & Power, 2013; IEA, 2015c)� District heat generation is roughly equally split between heat-alone and CHP systems� The latter are often controlled by the same companies that also control district heating networks – mainly regional electricity producers (Boute, 2012)�
The district heating schemes in the Russian Federation are generally less efficient than in other countries with similar climates� Boiler efficiency in the Russian Federation is around 75% (about 10-15 percentage points less than in Europe or the US) while distribution losses are 20%-25% (about twice as high as e.g. in Poland) (Sargsyan and Gorbatenko, 2008)� This implies a large potential for energy efficiency improvement� The Russian government has stated that 30% of infrastructure urgently requires replacing, with the rest to follow in the near future (Euroheat & Power, 2013; IEA, 2015b; Lychuk et al., 2012)� Efforts to modernise district heating networks are under way� In addition, it is envisaged that these will increase the use of renewable heat sources, particularly from bioenergy�

RENEWABLE ENERGY IN DISTRICT HEATING AND COOLING22
Table 4: Key policies and regulations for DHC in selected countriesCh
ina Five-year plans
Includes targets for additional heating surface to be supplied by biomass, geothermal and solar thermal energy� In addition, there are targets on the proportion of CHP plants (Odgaard, 2015)�
Mapping and exploration for geothermal heat projects (Richter, 2011)�
Support for CHP Promotes the use of renewable CHP plants through feed-in tariffs (IEA, 2016; Nuorkivi, 2016)�
Den
mar
k
Heat Supply ActMunicipalities have the option to enforce connection to the grid; they are required to perform a socioeconomic cost-benefit analysis to assess heating options (Danish Energy Agency, 2015)�
National target: 50% wind power 2020
The role of district heating systems to support the grid integration of wind power has been recognised� Power-to-heat schemes to mitigate variability have been implemented and are subject to expansion (Danish Energy Agency, 2015)�
Financial support for biomass
Feed-in tariffs for biomass CHP; fuel tax exemption for biomass (Danish Energy Agency, 2016b; Danish Energy Agency, 2015)�
EU Energy Efficiency Directive (2012/27/EU)
Binding measures to reach 20% energy efficiency targets by 2020; role of district energy and CHP; requires member states to “carry out a comprehensive assessment of the potential for high-efficiency cogeneration and district heating and cooling”, European Union (2012)� An update proposed in 2016 aims to increase energy efficiency to 30% in 2030 (European Commission, 2016b)�
EU Renewable Energy directive (2009/28/EC)
The proposed 2016 revision of the EU Renewable Energy Directive emphasises the potential role of DHC in the integration of renewables and addresses “non-discriminatory access” to the infrastructure, customer protection, and the potential contribution of heating systems to the integration of renewable power (European Commission, 2016)�
Ger
man
y
Heat and Power Co-generation Act 2016 (known as KWKG)
Subsidies on the construction of district energy networks and thermal storage (KWKG, 2016)�
Renewable Energies Heat Act (EEWärmeG)
Share of renewables in final consumption of heat to rise to 14% by 2020; combines regulations and subsidies (EEWärmeG, 2015; BMWi, 2015b)�
Ordinance on general conditions for district heating (AVBFernwärmeV)
Detailed regulatory framework for the installation of district energy systems and the protection of customers (AVBFernwärmeV, 2010)�
Renewable Energy Sources Act (EEG)
Feed-in tariffs for the production of electricity from biomass CHP (EEG, 2015)�
EU directives on energy efficiency and renewable energy
As above�
Pola
nd
Emissions reduction target District heating emissions to be cut by 90% in 2050 relative to 1990 (Euroheat & Power, 2015)�
Renovation of networks Certificate scheme (Poland Energy Department, 2015)�
Energy efficiency targets
Substitution of boilers by CHP plants by 2020 (Nuorkivi, 2016)�Reduction of heat demand by 20% and 30% in 2020 and 2030 respectively (by improving production, distribution and consumption) (Euroheat & Power, 2015)�
CHP Double electricity from co-generation by 2020 (IEA, 2011)�Regulations Connection obligations (Nuorkivi, 2016)�EU directives on energy efficiency and renewable energy
As above�
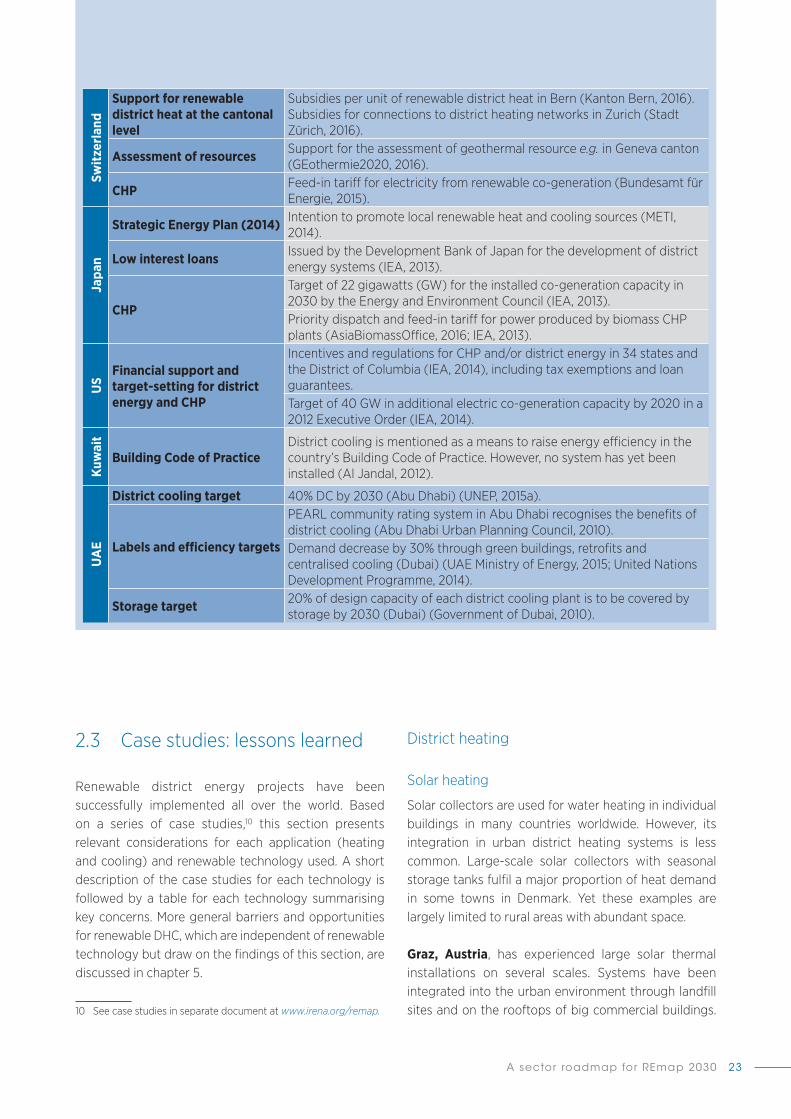
A sector roadmap for REmap 2030 23
2�3 Case studies: lessons learned
Renewable district energy projects have been successfully implemented all over the world� Based on a series of case studies,10 this section presents relevant considerations for each application (heating and cooling) and renewable technology used� A short description of the case studies for each technology is followed by a table for each technology summarising key concerns� More general barriers and opportunities for renewable DHC, which are independent of renewable technology but draw on the findings of this section, are discussed in chapter 5�
10 See case studies in separate document at www.irena.org/remap.
District heating
Solar heating
Solar collectors are used for water heating in individual buildings in many countries worldwide� However, its integration in urban district heating systems is less common� Large-scale solar collectors with seasonal storage tanks fulfil a major proportion of heat demand in some towns in Denmark� Yet these examples are largely limited to rural areas with abundant space�
Graz, Austria, has experienced large solar thermal installations on several scales� Systems have been integrated into the urban environment through landfill sites and on the rooftops of big commercial buildings�
Switz
erla
ndSupport for renewable district heat at the cantonal level
Subsidies per unit of renewable district heat in Bern (Kanton Bern, 2016)� Subsidies for connections to district heating networks in Zurich (Stadt Zürich, 2016)�
Assessment of resources Support for the assessment of geothermal resource e.g. in Geneva canton (GEothermie2020, 2016)�
CHP Feed-in tariff for electricity from renewable co-generation (Bundesamt für Energie, 2015)�
Japa
n
Strategic Energy Plan (2014) Intention to promote local renewable heat and cooling sources (METI, 2014)�
Low interest loans Issued by the Development Bank of Japan for the development of district energy systems (IEA, 2013)�
CHP
Target of 22 gigawatts (GW) for the installed co-generation capacity in 2030 by the Energy and Environment Council (IEA, 2013)�Priority dispatch and feed-in tariff for power produced by biomass CHP plants (AsiaBiomassOffice, 2016; IEA, 2013)�
US
Financial support and target-setting for district energy and CHP
Incentives and regulations for CHP and/or district energy in 34 states and the District of Columbia (IEA, 2014), including tax exemptions and loan guarantees�Target of 40 GW in additional electric co-generation capacity by 2020 in a 2012 Executive Order (IEA, 2014)�
Kuw
ait
Building Code of PracticeDistrict cooling is mentioned as a means to raise energy efficiency in the country’s Building Code of Practice� However, no system has yet been installed (Al Jandal, 2012)�
UA
E
District cooling target 40% DC by 2030 (Abu Dhabi) (UNEP, 2015a)�
Labels and efficiency targets
PEARL community rating system in Abu Dhabi recognises the benefits of district cooling (Abu Dhabi Urban Planning Council, 2010)�Demand decrease by 30% through green buildings, retrofits and centralised cooling (Dubai) (UAE Ministry of Energy, 2015; United Nations Development Programme, 2014)�
Storage target 20% of design capacity of each district cooling plant is to be covered by storage by 2030 (Dubai) (Government of Dubai, 2010)�
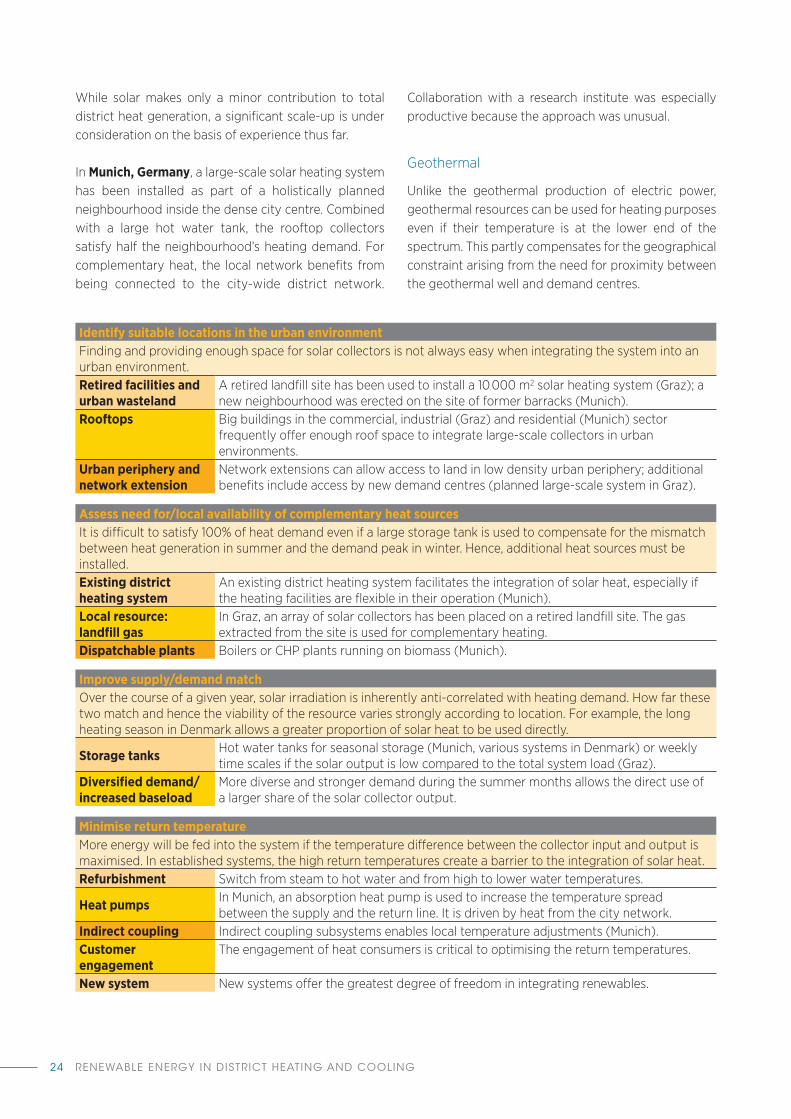
RENEWABLE ENERGY IN DISTRICT HEATING AND COOLING24
While solar makes only a minor contribution to total district heat generation, a significant scale-up is under consideration on the basis of experience thus far�
In Munich, Germany, a large-scale solar heating system has been installed as part of a holistically planned neighbourhood inside the dense city centre� Combined with a large hot water tank, the rooftop collectors satisfy half the neighbourhood’s heating demand� For complementary heat, the local network benefits from being connected to the city-wide district network�
Collaboration with a research institute was especially productive because the approach was unusual�
Geothermal
Unlike the geothermal production of electric power, geothermal resources can be used for heating purposes even if their temperature is at the lower end of the spectrum� This partly compensates for the geographical constraint arising from the need for proximity between the geothermal well and demand centres�
Identify suitable locations in the urban environmentFinding and providing enough space for solar collectors is not always easy when integrating the system into an urban environment�Retired facilities and urban wasteland
A retired landfill site has been used to install a 10 000 m2 solar heating system (Graz); a new neighbourhood was erected on the site of former barracks (Munich)�
Rooftops Big buildings in the commercial, industrial (Graz) and residential (Munich) sector frequently offer enough roof space to integrate large-scale collectors in urban environments�
Urban periphery and network extension
Network extensions can allow access to land in low density urban periphery; additional benefits include access by new demand centres (planned large-scale system in Graz)�
Assess need for/local availability of complementary heat sourcesIt is difficult to satisfy 100% of heat demand even if a large storage tank is used to compensate for the mismatch between heat generation in summer and the demand peak in winter� Hence, additional heat sources must be installed�Existing district heating system
An existing district heating system facilitates the integration of solar heat, especially if the heating facilities are flexible in their operation (Munich)�
Local resource: landfill gas
In Graz, an array of solar collectors has been placed on a retired landfill site� The gas extracted from the site is used for complementary heating�
Dispatchable plants Boilers or CHP plants running on biomass (Munich)�
Improve supply/demand matchOver the course of a given year, solar irradiation is inherently anti-correlated with heating demand� How far these two match and hence the viability of the resource varies strongly according to location� For example, the long heating season in Denmark allows a greater proportion of solar heat to be used directly�
Storage tanks Hot water tanks for seasonal storage (Munich, various systems in Denmark) or weekly time scales if the solar output is low compared to the total system load (Graz)�
Diversified demand/ increased baseload
More diverse and stronger demand during the summer months allows the direct use of a larger share of the solar collector output�
Minimise return temperatureMore energy will be fed into the system if the temperature difference between the collector input and output is maximised� In established systems, the high return temperatures create a barrier to the integration of solar heat�Refurbishment Switch from steam to hot water and from high to lower water temperatures�
Heat pumps In Munich, an absorption heat pump is used to increase the temperature spread between the supply and the return line� It is driven by heat from the city network�
Indirect coupling Indirect coupling subsystems enables local temperature adjustments (Munich)�Customer engagement
The engagement of heat consumers is critical to optimising the return temperatures�
New system New systems offer the greatest degree of freedom in integrating renewables�

A sector roadmap for REmap 2030 25
Optimise the temperature of the district heating networkAs in the case of solar heat, lower water temperature in the network return line allows a greater fraction of the heat content to be extracted from the geothermal hot water�Engagement of consumers The local utility in Munich is encouraging the optimisation of the connected load
so that it can reach lower water temperatures in the network�Separation of supply and demand
Until now, all Ferrara’s district heating plants are separated from the demand centre by a single transmission pipe� This offers more flexibility for adjusting the water temperature before it reaches and after it returns from the customers�
New systems In Ferrara, the district heating network was built for the explicit purpose of making use of the geothermal resource, which allows its design to be optimised�
New subsystem In new subsystems the network temperature can easily be optimised if the connection to the main network is established through a substation (Munich)�
Assess the availability of information on the resource qualityThe assessment of the geothermal resources can be a significant upfront cost with high risks�Past exploration of fossil resources
This kind of information was available in Ferrara before the first geothermal well was developed�
Experience with geothermal heat extraction
The risk involved in the resource assessment at nearby locations is reduced if previous geothermal wells exist (Munich)�
Engagement of other actors (utilities, research etc.)
The participation of a larger consortium spreads the financial burden and risk� This broader perspective provides additional justification to the research (GEothermie2020, 2016)�
Disclose available information
Disclosure of information on geological condition varies between countries� In Italy, relevant information is available on a national level (Ferrara)�
Allocate the necessary spaceThe extraction of geothermal heat requires only small amounts of space when compared to other forms of district heat production� Nevertheless, its integration in an urban environment is not always easy�New neighbourhoods Flexible integration (e.g. districts of Riem and Freiham in Munich)�
Transmission pipe Construction of a 4 km transmission pipe to connect the well to the city centre (Ferrara)�
Small cities The limited extension and low spatial spread of demand in smaller cities facilitates the addition of geothermal plants (Sauerlach near Munich)�
Extensive networks in large cities
The diversity of large networks facilitates the identification of suitable locations within the existing infrastructure; e.g. integration of a well at a central location next to an existing CHP plant (Munich)�
Optimise or adapt to heat demand profilesGeothermal heat is best used to cover baseload� Lack of load in summer might require optimisation�Interconnection Connection to a large network with a diverse mix of customers (Munich)�
Supply mix optimisationAppropriate choice of geothermal capacity and combination with flexible plant e.g. biomass CHP plant in Sauerlach near Munich, municipal waste CHP plant in Ferrara�
Electricity generationUse of medium-enthalpy resources to generate heat and electricity in co-generation (Munich); generation of electricity using an organic Rankine cycle (Ferrara)�
Combination with coolingRerouting the geothermal heat to drive absorption chillers means it can be used in summer for district cooling� This is not the approach of the two cities considered here�
Streamline administrative proceduresTapping into geothermal energy is related to land, mineral and water rights� Governments can facilitate the administrative procedures by lowering the barriers in the case of geothermal heat�

RENEWABLE ENERGY IN DISTRICT HEATING AND COOLING26
The district heating system in Ferrara, Italy, was built to make use of the local geothermal resources� The network connects the historic city centre to the geothermal well on the outskirts of the city� A CHP plant fuelled by waste complements the heating mix�
Munich, Germany, benefits from a wealth of geothermal resources accessed at several locations – mainly in newly built neighbourhoods with new low temperature subsystems�
Biomass: coal conversion and co-firing
Modifying coal plants to permit biomass combustion forms a cost-efficient way to cut emissions� At the
same time, many of the complications arising from integrating biomass capacity in an urban environment can be avoided�
Copenhagen, Denmark, is set to become 100% renewable by 2025� The city’s district heating system meets almost all the heating demand� Several large-scale co-generation plants are being converted to biomass combustion�
Flensburg, Germany, has one of the largest district heating systems in Germany� Small amounts of biomass are being co-fired in the coal plants� While this avoids major investment in conversion, technical constraints cap the share of biomass that can be used�
Determine appropriate depth of conversionThere are a wide range of different schemes for the conversion of coal power plants and co-combustion of biomass� Conversion depths vary widely and depend on the technologies used, fuel availability and cost, as well as funding�Full replacement of boiler and turbine
The conversion can be combined with an extension to the lifetime of the power plant, providing a high degree of flexibility� However, this is rather costly� One example is the Amager CHP plant (Copenhagen)�
Additional infrastructure for biomass handling and logistics
This is a fundamental component of all conversion efforts e.g. large external infrastructure like docks and mills (Copenhagen), or minor internal conveyor systems (Flensburg)�
Small-scale co-combustion Co-combustion without modifications to the plant itself; limited by technical constraints (Flensburg)�
Incremental conversion over several years
Gradual increase in the share of biomass; spreads the investment requirement over a long period of time (Borås)�
Facilitated logisticsThe use of existing coal plants has the advantage of operating in a known environment with established logistical procedures� This is especially relevant in dense urban environments e.g. the CHP plants in Copenhagen are easily accessible from the sea�
Determine availability of low cost biomass resourcesThe cost of biomass differs greatly between countries, and this has profound impacts on the viability of conversion schemes�Abundance of domestic biomass resources
Biomass can be a strategy to achieve cost savings and to reduce energy dependence if local resources are available (Vilnius)�
Lack of domestic biomass resources
Biomass is imported for co-combustion in Flensburg and in Copenhagen� The cost premium of imported resources can be justified by the cost efficiency and speed of coal plant conversion, allowing rapid decarbonisation�
Assess the potential for emissions reductionAs with fuel logistics considerations, choosing to convert a coal plant connected to the district heating systems reduces the uncertainties of the emissions impact on the urban environment�
LocationIn most developed countries, coal power plants are located outside the city centre or equipped with appropriate filtering mechanisms to minimise the impact on local air quality�
Effect on emissions In some cases, biomass has a positive effect on emissions e.g. in Flensburg where small-scale co-combustion led to a reduction in sulphur dioxide emissions�

A sector roadmap for REmap 2030 27
Vilnius, Lithuania, is aiming to lower its dependence on fossil fuels� Investigations show that the switch from natural gas to local biomass generates major cost reductions in Lithuania�
The step-by-step conversion of a 180 MW heating plant in Borås, Sweden, illustrates how the share of biomass can be increased over several years�
Biomass: stand-alone
Despite the difficulties of operating and supplying a plant fuelled by biomass in an urban environment, many systems rely on this resource to some extent� Its main benefit is the combination of operating flexibility with greenhouse gas neutrality and local resource availability�
In St Paul, US, a biomass CHP plant was installed at a central location on the site of an obsolete heating facility� Technical innovations and the strategic location helped to overcome the challenges related to biomass logistics� The plant’s operator attempts to maximise the use of local wood residues to fuel the plant�
In Ulm, Germany, the installation of two biomass-fuelled co-generation plants replaced the bulk of generation based on fossil fuel� Rather like the facility at St Paul, the new plants rely on dedicated wood fuel and local wood waste, which is delivered from a maximum distance of 70 km�
The district heating system in the Olympic Park in London, UK, contains minor amounts of biomass-fuelled
Optimise role in the energy system and find synergies with other resourcesFlexibly dispatchable biomass-fuelled plants could play an important role in the district heating mix� This advantage must be fully exploited�
Baseload
Depending on the relative cost of coal, gas and biomass, the most economical strategy may be to prioritise the operation of the biomass plants so that small renewable capacities provide the bulk of heat (Ulm)� In some cases this requires subsidies�
Complementary to less flexible resources
Since biomass plants are dispatchable, their output can be adjusted to complement less flexible or baseload resources like geothermal heat (e.g. Sauerlach near Munich)�
Assess and streamline resource availabilityIn all the examples discussed here, emphasis is placed on local biomass availability� Urban wood residues serve as the main feedstock�
Complementary resourcesThe availability of residues can be subject to fluctuations� Complementary sources must be identified, and the supply chains established� In St Paul, biomass from other locations within Minnesota are used on these occasions at a cost premium�
Supply chainThe switch to biomass can itself be problematic if local supply chains are immature� In St Paul, management had to streamline the operations of several waste-handling businesses to mobilise sufficient amounts of wood residues�
Local economyWood residues can be found in large quantities in most metropolitan areas� Drawing from this resource allows financial resources to keep circulating in the local economy, in contrast to the acquisition of fossil fuels or to biomass imports�
LogisticsDepending on plant capacity, biomass delivery can become a major logistical challenge� The St Paul and Ulm installations can avoid this problem because they are on the sites of former and existing heating facilities which are well connected to the local road network� Nevertheless, innovative approaches are required in some cases to handle large volumes of fuel�
Raise public acceptanceIntegrating an industrial facility such as a power plant into an urban centre can provoke resistance from the general public� Educational programmes to communicate the purpose and benefits of the facility are thus essential� Aesthetic considerations should be taken into account (London Olympic Park)� In St Paul, the public became more engaged after the launch of an art project which centred on the plant and its integration in the River Balcony infrastructure project (District Energy St Paul, 2016)�

RENEWABLE ENERGY IN DISTRICT HEATING AND COOLING28
capacity in addition to the main natural gas CHP plant� Before the Olympic sports venues were built, it was deemed too risky to use more biomass� However, the system is designed for flexible future expansion�
District cooling
SolarSolar cooling systems consist of an array of thermal collectors whose heat output drives an absorption chiller to provide cooling� In contrast to solar heating systems, the correlation between demand and supply is excellent: high solar irradiation correlates with and contributes to peak cooling loads�
By 2016, solar cooling had not been used in district cooling system� Nevertheless, several systems have been installed to successfully take the cooling load of individual buildings and larger facilities� This technology is readily transferable to centralised cooling approaches�
The case studies describe three of these systems� Two of them (Phoenix, US, and Singapore) were installed on the rooftops of existing buildings (a school and a university)� The third is part of a low-energy building
in Al Ain, UAE� Large-scale solar cooling systems share many of the same key considerations as solar district heating�
Natural water cooling
Cold water from rivers, the sea or lakes is commonly used for space cooling in parts of the world with very diverse climates and demand types� Generally, rejected heat from the buildings connected is transferred to the cold water from the local water body� The effluent is then returned to the water body at a higher temperature� The system typically consists of an inlet pipe which transports the water to a cooling plant� There, the cold water is either injected directly into the district cooling system or coupled to a closed loop network via heat exchangers�
Paris, France, has several large district cooling systems in its dense city core� Cold water is extracted from the river Seine and expelled at a higher temperature� Several cooling stations are integrated in the urban environment� While natural water cooling covers the main part of the load, it is complemented by several conventional industrial-size chillers�
Identify suitable space in the urban environment Existing solar collectors have been installed exclusively on rooftops and serve the cooling demands of a single building or complex of buildings� If they are connected to district cooling systems, they share the same considerations as solar district heating, especially concerning space requirements�
Assess and optimise appropriate complementary cooling capacityThe much greater overlap between cooling demand and supply could diminish the need for auxiliary capacity�Dispatchable plants Efficient chillers can act as complementary plants while minimising demand for
electricity�Natural water cooling Natural water cooling is in principle dispatchable� However, the high upfront investment
cost might make this approach unsuitable as backup capacity�District heating systems
Heat from existing district heating systems can be used to drive absorption heat pumps and thereby provide complementary cooling� This approach has the potential to significantly improve the economics of district heating by raising demand levels in summer�
Improve match between supply and demandThe greater match between solar irradiation and cooling demand means a much bigger share of cooling production can be used directly�
Storage tanks Hot water (and to a lesser extent cold water) storage tanks are an integral part of all the systems described in the case studies�
Mitigate perceived investment riskSolar cooling is fairly new and not widely used� Perception of its risks, as well as a lack of awareness of its economic benefits, work as a considerable barrier to its development� Some innovative business models have been designed to help lower this (Phoenix, US; Singapore) and to allow the construction of demonstration systems�

A sector roadmap for REmap 2030 29
cooling system� Part of the load is covered by seawater using an innovative natural filtering mechanism�
Bahrain Bay (Manama), Bahrain, is a new zone of commercial buildings equipped with a centralised
Assess and minimise impact on the water bodyThe impact of the warm effluent strongly depends on local conditions, including the total volume of the water body, ecological resilience and water flow at the rejection site� Both the temperature and suction flow at the intake can upset the aquatic ecosystem�Pre-assessments Environmental studies are required in all cases and define the parameters within
which the system is allowed to operate� This can lead to restrictions on the maximum temperature of the effluent (Paris), the maximum difference between the effluent and the water body (Paris; Bahrain Bay), and the maximum flow rate at the intake (Geneva)�
Gradual expansion of the project
Incremental expansion of the system allows the impact on the local environment to be studied� Lessons can be learned for future expansion (Geneva)�
Technical mitigation, design of system components
The impact can be minimised by sizing the suction pipe (to limit the suction) and the installation of cooling towers (to restrict the temperature rise) (Bahrain)�
Choose appropriate filtering mechanismsFiltering the water from the natural water body is necessary to maintain the integrity of the technical components in the system�
Basin Many systems use a basin in which the water is collected prior to being pumped to the heat exchangers/heat pumps (Paris) or to the network (Geneva)�
Chemical purification In systems with high demands on water purity, chlorine is used to avoid biofilm formation� The open loop cooling network in Geneva is one example�
Natural filtering The cooling system in Bahrain Bay relies on a natural filtration mechanism through the sand in which the pipe is buried� This avoids the use of chemical purification�
Find synergies with existing infrastructureThe costs and impact of the natural water cooling system, as well as the entire district cooling system, can be lowered by making use of existing infrastructure in the urban environment�Network infrastructure In Paris, major parts of the district cooling network were laid in the sewage system
to avoid the cost of street-level excavation�Inlet pipe By installing a drinking water pipe on the floor of Lake Geneva, detailed information
on the topology was produced� This facilitated the planning of the district cooling inlet pipe�
Lack of visual impactCompared to other cooling solutions (including solar cooling), the visual impact of natural water cooling is negligible� Both the pipe networks and cooling plants can be installed underground or in the water; cooling towers are unnecessary in most cases�
Mitigate upfront investment costNatural water cooling systems may have high upfront investment costs because they have to adapt to a unique environment, and underwater construction works create complications� Identifying anchor loads to guarantee a steady revenue stream is all the more important�
New developments The greenfield construction of a district cooling system can be significantly cheaper than retrofit in an existing urban environment (Bahrain)�
Gradual expansion Starting from a low capacity allows the viability of the scheme to be demonstrated, investment risks reduced, and new customers secured before expanding (Geneva)�
General high demand density
It is essential to choose high demand centres to cover a high load while minimising the need for infrastructure expenditure (Paris city centre; Geneva United Nations district)�
Aggregation of customers Making binding contractual agreements before starting construction meant the operator of the Honolulu system can define a minimum share of capacity demand to be met�

RENEWABLE ENERGY IN DISTRICT HEATING AND COOLING30
However, the contribution from this resource is limited by the high water temperatures at the surface� The project suffered because the construction of several of the buildings connected was delayed due to the economic downturn� As a result, its capacity is severely underutilised�
Geneva, Switzerland, uses water from the bottom of the adjacent lake as a heat reservoir for both cooling and heating� Seasonal variation in the water temperature is low� Cold water is transported to customers and either
used for direct cooling (through a heat exchanger) or as a heat source (using heat pumps to reach higher temperatures)� The system will be expanded significantly during the coming years�
In Honolulu, Hawaii, there is a plan to pump cold seawater from great depths to provide space cooling to the downtown buildings� Given Hawaii’s energy dependence, this approach is expected to generate significant cost savings�

A sector roadmap for REmap 2030 31
Key points
In the business-as-usual outlook to 2030 (the Reference Case), the use of DHC is set to expand in almost all the countries selected� Only in Germany is there a reduction in its use due to an emphasis on energy efficiency improvements� Already large users of district heating, Denmark and Poland are planning the most to expand their share of total heating demand� In the UAE and Kuwait, district cooling is expected to increase greatly�
● In the Reference Case, renewable energy in district heating systems is set to increase in most of the countries selected (Denmark, Germany, Japan, Switzerland, US) – mainly from biomass� However, no countries explicitly consider the potential for renewable district cooling�
● Across all countries assessed, there are sufficient resources – including biomass, geothermal, solar and natural cooling – to significantly scale up renewable energy in DHC by 2030�
● In most countries, several renewable district heating options are cost-competitive with conventional DHC technologies by 2030� To compare these with decentralised generation options, the cost of distribution networks has to be included, which is significant when the density of heating demand is low� Hence, renewable DHC technologies are generally not competitive with decentralised generation�
● The business case for renewable district cooling technologies in 2030 is not likely to be good enough to justify their use to displace conventional generation� Although investment costs are expected to reduce significantly (especially solar DHC), these technologies are not usually competitive when externality reductions are not accounted for�
● Under REmap, the use of renewable energy in DHC by 2030 increases in each country� The share of renewable energy in DHC increases the most in Denmark (to 73% from 51% in the Reference Case), followed by China (to 24% from 1%) and Poland (to 23% from 11%)� This is driven by the dominance of coal in the Reference Case (China, Poland) or ambitious policy targets (Denmark)�
● The use of biomass in REmap increases mainly in China (9% of district heat)� Geothermal heat is constrained in certain countries by the limited geographical coverage of district heating systems� In REmap it makes large contributions in Switzerland (17% of district heat) and Poland (9% of district heat)� The contribution of solar district heating is high in Denmark (13% of district heat) and Poland (10% of district heat)� Electrification is to play an increasingly important role in many countries (about 20% of district heating in Denmark and Germany), mainly due to the expansion of power-to-heat and the use of large-scale heat pumps� However, electricity is not considered renewable in itself in this study�
● Under REmap, additional renewable district cooling options reduce reliance on electric chillers in most countries by 2030� Increased volumes of solar and natural water cooling mean the proportion of renewable energy in district cooling ranges between 49% (UAE) and 12% (Kuwait)�
● Under the Structural Shift scenario, additional renewable DHC substitutes conventional decentralised generation across each country by 2030� It is assumed that demand is met with an appropriate share of biomass, solar and geothermal heat� On the basis of available renewable resources and various other factors, the use of DHC increases by between 5% (Denmark) and 64% (UAE)�
3. POTENTIAL FOR RENEWABLE DISTRICT HEATING AND COOLING UP TO 2030

RENEWABLE ENERGY IN DISTRICT HEATING AND COOLING32
● A comprehensive cost-benefit analysis shows that additional renewable district heating in REmap comes with significant net benefits in China, Denmark and Poland� In China and Poland, this is due to the dominance of coal in the mix (which implies renewables greatly reduce externality costs)� In the other countries considered, the dominance of gas in the mix means externality reductions are lower, and no overall benefit is gained from the additional renewable district heat in REmap� Under REmap, additional renewable district cooling in Kuwait brings net benefits to the country; in the UAE it comes with a small net cost�
● New renewable-based DHC systems displacing conventional decentralised generation (Structural Shift) produce net benefits for China, Denmark, Kuwait and Poland� In other countries, there is no case for them at the national level although some projects in the other countries assessed would probably yield positive net benefits�
● Compared to the Reference Case, overall DHC investment needs under REmap are lower in China, Poland and the US� This is due to reduced investment in coal and gas-fired CHP plants and the choice of a well-diversified mix of renewable capacity� Relative cost advantages range from -31% in China to -3% in Poland� In all countries, the investment in renewable capacity needed to achieve the renewable DHC deployment in REmap is considerably greater than in the Reference Case� In the Structural Shift scenario, additional investment is especially driven by the requirement for new distribution infrastructure�
This chapter provides an outlook for renewable DHC in the nine selected countries� First we present a Reference Case� It shows the business-as-usual development of the energy system, and the role of (renewable) DHC within it across all nine countries in 2030� To improve the understanding of the additional renewable DHC potential beyond the Reference Case, this chapter presents a more in-depth cost assessment (section 3�3) and resource assessment (section 3�2)� Section 3�4 then provides an overview of REmap and how far renewable energy could help avoid conventional generation in planned DHC systems by 2030� Section 3�5 goes beyond
REmap to consider whether there is potential for new DHC systems based on renewables to further substitute decentralised heat/cold generation� Finally, section 3�6 provides an analysis of the costs and benefits for each country and shows the investment required to achieve accelerated deployment of renewable DHC�
3�1 Reference Case
Demand growth in heating and cooling generally is a major factor affecting the future potential of DHC� Two major trends are expected to counteract each other, explaining key differences in the outlook for each country� First, demand for heating and cooling services increases with population growth, urbanisation and improving living standards� Second, the energy intensity of heating and cooling services is decreasing due to stricter building standards and renovation programmes� This improves the efficiency of building envelopes and hence lowers final demand�
The anticipated trends in demand for heating and cooling energy and the role of DHC are shown in figure 6� The top bar chart displays the expected net decline in heating demand in most countries (except for China and Poland) caused by efficiency improvements� In China, for example, steady economic growth and urbanisation exceed expected energy efficiency improvements in both the buildings and industrial sectors, which increases demand for heat (IEA World Energy Outlook, 2015)� Demand for cooling is set to rise in all four countries considered, apart from Japan� A large increase is expected as a result of economic development, population growth and climate change, especially in Kuwait and the UAE (Strategy&, 2012)�
The bar chart in the middle shows that all countries are planning for an expansion in DHC systems use, apart from Germany� In Germany, a decrease of 20% in district heating demand is projected as the expansion of networks does not keep up with demand reduction caused by efficiency improvements (Prognos, 2014)� As demand for DHC declines by just over 10% over the same period, its share in total heating demand rises (figure 6)� On the other hand, overall demand growth for heating in China exceeds the growth in district heating networks, leading to a small decline in their contribution to the heating mix�

A sector roadmap for REmap 2030 33
Figure 6: Changes in demand for heating (left), cooling (right) and district heating and cooling, 2015-2030
-25%
-20%
-15%
-10%
-5%
0%
5%
10%
15%
20%
25%
30%
China Denmark Germany Poland Switzerland Japan US
Heating
-50%
0%
50%
100%
150%
200%
250%
Japan US Kuwait UAE
Cooling
3 530PJ
125PJ
351PJ
513PJ
21PJ
10PJ
516PJ
-20%
-10%
0%
10%
20%
30%
40%
50%
60%
China Denmark Germany Poland Switzerland Japan US
Heating
0%
50%
100%
150%
200%
250%
Japan US Kuwait UAE
Cooling
7.5%
6.7%
50.8
%
70.3
%
8.6%
9.2%
24.5
%
31.6
%
6.0
%
7.9%
0.4
%
0.5
%
6.4%
8.4%
0%10%20%30%40%50%60%70%80%
2015 2030 2015 2030 2015 2030 2015 2030 2015 2030 2015 2030 2015 2030
China Denmark Germany Poland Switzerland Japan US
Heating
3.6%
4.5%
3.8%
5.0
%
0.0
%
15.0
%
22.8
%
27.5
%
0%
5%
10%
15%
20%
25%
30%
2015
2030
2015
2030
2015
2030
2015
2030
Japan US Kuwait UAE
Cooling
Chan
ge in
tota
l dem
and
2015
–20
30Ch
ange
in to
tal d
eman
d 20
15–2
030
Dis
tric
t ene
rgy
shar
e
14PJ
143PJ
90PJ
377PJ
299PJ
2 846PJ
600PJ
1 373PJ
52 754PJ
178PJ
3 790PJ
1 622PJ
265PJ
2 074PJ
6 147PJ
Change in heating and cooling demand*
-25%
-20%
-15%
-10%
-5%
0%
5%
10%
15%
20%
25%
30%
China Denmark Germany Poland Switzerland Japan US
Heating
-50%
0%
50%
100%
150%
200%
250%
Japan US Kuwait UAE
Cooling
3 530PJ
125PJ
351PJ
513PJ
21PJ
10PJ
516PJ
-20%
-10%
0%
10%
20%
30%
40%
50%
60%
China Denmark Germany Poland Switzerland Japan US
Heating
0%
50%
100%
150%
200%
250%
Japan US Kuwait UAE
Cooling
7.5%
6.7%
50.8
%
70.3
%
8.6%
9.2%
24.5
%
31.6
%
6.0
%
7.9%
0.4
%
0.5
%
6.4%
8.4%
0%10%20%30%40%50%60%70%80%
2015 2030 2015 2030 2015 2030 2015 2030 2015 2030 2015 2030 2015 2030
China Denmark Germany Poland Switzerland Japan US
Heating
3.6%
4.5%
3.8%
5.0
%
0.0
%
15.0
%
22.8
%
27.5
%
0%
5%
10%
15%
20%
25%
30%
2015
2030
2015
2030
2015
2030
2015
2030
Japan US Kuwait UAE
Cooling
Chan
ge in
tota
l dem
and
2015
–20
30Ch
ange
in to
tal d
eman
d 20
15–2
030
Dis
tric
t ene
rgy
shar
e
14PJ
143PJ
90PJ
377PJ
299PJ
2 846PJ
600PJ
1 373PJ
52 754PJ
178PJ
3 790PJ
1 622PJ
265PJ
2 074PJ
6 147PJ
*The labels show values in 2030.Change in DHC demand*
-25%
-20%
-15%
-10%
-5%
0%
5%
10%
15%
20%
25%
30%
China Denmark Germany Poland Switzerland Japan US
Heating
-50%
0%
50%
100%
150%
200%
250%
Japan US Kuwait UAE
Cooling
3 530PJ
125PJ
351PJ
513PJ
21PJ
10PJ
516PJ
-20%
-10%
0%
10%
20%
30%
40%
50%
60%
China Denmark Germany Poland Switzerland Japan US
Heating
0%
50%
100%
150%
200%
250%
Japan US Kuwait UAE
Cooling
7.5%
6.7%
50.8
%
70.3
%
8.6%
9.2%
24.5
%
31.6
%
6.0
%
7.9%
0.4
%
0.5
%
6.4%
8.4%
0%10%20%30%40%50%60%70%80%
2015 2030 2015 2030 2015 2030 2015 2030 2015 2030 2015 2030 2015 2030
China Denmark Germany Poland Switzerland Japan US
Heating
3.6%
4.5%
3.8%
5.0
%
0.0
%
15.0
%
22.8
%
27.5
%
0%
5%
10%
15%
20%
25%
30%
2015
2030
2015
2030
2015
2030
2015
2030
Japan US Kuwait UAE
Cooling
Chan
ge in
tota
l dem
and
2015
–20
30Ch
ange
in to
tal d
eman
d 20
15–2
030
Dis
tric
t ene
rgy
shar
e
14PJ
143PJ
90PJ
377PJ
299PJ
2 846PJ
600PJ
1 373PJ
52 754PJ
178PJ
3 790PJ
1 622PJ
265PJ
2 074PJ
6 147PJ
* The labels show values in 2030.Share of district energy as a fraction of total national heating and cooling demand, Reference and REmap caseSource: IRENA estimatesBased on IRENA estimates

RENEWABLE ENERGY IN DISTRICT HEATING AND COOLING34
Denmark and Poland are planning to significantly expand district heating capacity, building on large networks already in existence today (Dyrelund et al., 2010, IRENA, 2015b)� There is also a positive swing in other countries, and a modest expansion in the proportion of district heating in Japan, Switzerland and the US� Finally, centralised cooling is expected to satisfy a larger proportion of demand in both Kuwait and the UAE as it becomes better known and accepted�
In the Reference Case, the share of renewable energy in district heat generation increases in most countries but not all (figure 7)� Below is a summary of the key renewable district heating trends up to 2030 in the Reference Case�
● China: the district heating fraction covered by coal remains constant at around 90%� No increase in renewable energy in district heating was detected in national energy plans or key literature; it is thus expected to remain at zero in the Reference Case for 2030�
● Denmark: demand for district and neighbourhood heating is projected to rise despite a 15% reduction in overall heating energy demand (Dyrelund et al., 2010)� There is a shift
from coal to gas as well as a rise in biomass use, with the share of renewable energy increasing from 32% today to 51% in 2030�
● Germany: biomass is also expected to play a bigger role, accounting for more than one-third of district heat generation in 2030� Together with greater use of natural gas, it cuts the use of coal to 26% from 42% today (Prognos, 2014)�
● Poland: the share of renewables in district heat falls from about 12% today to 8% in 2030� The expected increase in the use of coal offsets the expansion of biomass and geothermal heat (IRENA, 2015b)�
● Switzerland: volumes of district heat are expected to rise (Kirchner et al., 2012)� Heat from municipal waste combustion today represents more than 40% of district heat generation� This share is assumed to decline while the share of renewables (all of which is biomass) is expected to increase from 18% today to 41% in 2030�
● Japan: the reliance on natural gas for district heat persists� The use of biomass is expected to expand somewhat, forming a 21% share of renewables in district heat in 2030� However, DHC
Figure 7: District heating and cooling generation mix in Reference Case in 2030
0%
10%
20%
30%
40%
50%
60%
70%
80%
91%
11%
29%
9%
26%
41% 82%
23%
33% 75%
12%
58%
21%6%
8%
33%
100%
China Denmark Germany Poland Switzerland Japan US
Perc
enta
ge o
f fina
l dis
tric
t hea
t dem
and
District heating
Biomass Solar heating GeothermalOil Natural gas CoalNon-renewable waste Renewable district heat
0%
10%
20%
30%
40%
50%
60%
70%
80%
90%
100%
Japan US Kuwait UAE
Perc
enta
ge o
f fina
l dis
tric
t coo
ling
dem
and
District cooling
OthersElectricity (electric chiller)Natural gas (absorption chiller)
14%
30%41%
51%
69%
17%
99% 95% 95%
5% 5%
Based on IRENA estimates

A sector roadmap for REmap 2030 35
systems continue to play a minor role in Japan, contributing about 0�5% of heating energy and less than 5% of cooling energy�
● US: the decrease in oil use and rise in district heating require additional resources� This gap is filled primarily with heat from biomass� Nevertheless, gas remains a dominant fuel in district heating generation, accounting for nearly 60% of supply�
The composition of district cooling is expected to remain largely unchanged and based on large-scale electric and gas-fired chillers� The potential for renewable energy solutions in district cooling are thus not yet reflected in national energy plans�
3�2 Availability of renewable resources for district heating and cooling
The availability of renewable resources for DHC generation was estimated for 2030 and serves as an important input in the assessment of renewable DHC beyond the Reference Case� Below is a summary of the resource assessment for solar heating and cooling, biomass, geothermal heat, and cooling from lakes, rivers and the sea� More detailed findings are provided annex 3�
Biomass
Most countries possess major volumes of underutilised biomass feedstock potentially available for district heating boilers or co-generation plants�
● Fuelwood is harvested for energy generation� Its high quality and multiple use options make it the most expensive biomass resource�
● Energy crops include all sorts of woody and grassy crops cultivated specifically for direct combustion or fuel generation�
● Agricultural residues are available in large quantities in major farming regions� They include straw from several types of grains as well as stalks and leaves from corn or other locally produced plants�
● Forestry residues are residues removed from logging and dead trees� This resource is underutilised because it is not economical to collect and transport the material in the absence of a market for bioenergy feedstock�
● Organic waste is defined as the organic component of municipal solid waste� Its availability is determined by the number of urban residents, the per capita generation of waste and the typical composition of household waste� In some countries the resource is mainly used for composting�
Figure 8 shows the availability of the different types of biomass feedstock in 2030, taking into account the expected demand for these feedstocks in other sectors (e.g. power generation, industry)� Denmark already makes significant use of biomass for district heating, especially to fuel converted coal power plants� However, much of this fuel is imported from neighbouring countries because the domestic resources are limited� On the other hand, both Japan and Switzerland benefit from large forest resources, and it is likely that these residues will be underutilised� In general, the potential to increase biomass use in district heat generation is significant�
Geothermal heat
In contrast to the geothermal generation of power, the direct utilisation of geothermal energy for heating can involve much lower quality resources� For each of the countries considered, the total geothermal heat potential was estimated using an approach based on GIS data on geothermal heat flows and heat demand density� Abundant geothermal heat is available but resource accessibility is constrained by the limited geographical extension of the urban centres when compared to the country’s total area� Only the heat flow directly beneath or near the district energy system can be accessed� Compared to other renewable resources, the potential is therefore relatively low� Nevertheless, the geothermal heat that is accessible could still satisfy 67% of district heating demand in Denmark�
Solar heating and cooling
Solar heating and cooling development is limited by the availability of ground and rooftop space for installing

RENEWABLE ENERGY IN DISTRICT HEATING AND COOLING36
solar collectors at locations accessible through heating and cooling networks� In most countries, the potential exceeds total demand for district heating/cooling, taking this constraint into consideration� The exception is China (32% of total district heating demand could be met by solar), Germany (67%) and the US (75%)� While insolation varies between countries, the overall availability of the solar resource is not a limiting factor for the potential expansion of its use in renewable DHC�
3�3 Cost of renewable district heating and cooling
The cost of DHC systems can be broken down into two components� First there is distribution cost: the cost of networks (i.e. pipes) and substations to distribute hot and cold water� Secondly, there is the cost of generating the hot/cold water, which varies per generation technology� If renewable DHC technologies are used to replace conventional generation in existing networks, only the generation cost needs to be considered� To assess the viability of substituting decentralised heating/cooling technologies with renewable DHC systems, the distribution cost should also be taken into account� This section first provides an overview of distribution costs across countries and then describes the generation cost and total levelised cost (including both distribution and generation cost) across technologies�
Distribution cost
The aim of constructing DHC networks is to match heating and cooling demand at a certain location through water heated or cooled at a central plant� The associated distribution cost includes both capital expenditure (capex) and operation expenditure (opex) for both the network and substations� The levelised cost of distribution includes both capex and opex and
Cooling from lakes, rivers and the sea
Natural water cooling consists of using cold water from rivers, lakes or the sea as a sink to provide cooling services� Usually, a suction pipe is employed to transport the cold water to a heat exchanger, where it warms up due to waste heat from the district cooling network� The effluent is then discharged in the natural water body (State of Hawaii, 2002)�
The viability of this concept depends on the availability of sufficiently cold water close to the cooling demand centres� Since large cities are generally located near bodies of water, a large share of cooling demand can be covered in this way� The potential for free cooling from natural water bodies is estimated in this study from an analysis of the proximity of populated areas to rivers, lakes and the coastline� To take into account the environmental impact of the warm effluent on small water bodies with limited heat capacity, only major lakes and rivers are included�
In general, the availability of natural water resources greatly exceeds total demand for district cooling in the countries selected� This is because the main urban centres are close to large water bodies� Japan, the US, Kuwait and the UAE all have good access to cold water from rivers, lakes or seas and could theoretically use this to meet all their district cooling demands�
Figure 8: Primary bioenergy supply potential for district heat production in 2030
14%
20%
7%
8%
35%
10%
19%
9%
44%
39%
39%
23%
27%
11%
17%
4%
4%
9%
22%
20%
67%
58%
64%
89%
11%
11 956 PJ
101 PJ
825 PJ
594 PJ
79 PJ
594 PJ
15 289 PJ
0% 10% 20% 30% 40% 50% 60% 70% 80% 90% 100%
China
Denmark
Germany
Poland
Switzerland
Japan
US
Fuelwood Energy crops Residues from agriculture Residues from forestry Biowaste
Share of biomass potential
Based on IRENA estimates

A sector roadmap for REmap 2030 37
provides an indication of the average cost during the lifetime of the systems for the delivery of hot/cold water per energy unit� The estimated distribution cost for DHC in 2030 varies greatly between the countries analysed from just over USD 1 per gigajoule (GJ) in the UAE to more than USD 35/GJ in Denmark (figure 9)�
The cost differences observed in hot/cold water distribution are primarily driven by two factors� First, demand density – the level of consumption per square metre – has a major impact� Higher demand density in densely populated city cores benefits the economics of the network since it allows capex to be spread over a greater volume of consumption� This explains why distribution costs are significantly higher in Denmark than in other countries; it has district heating systems even in environments with low population density� On the other hand, district heating networks in China are mainly used in urban centres with high population density, implying much lower network cost per unit of energy consumed�
The specific application of DHC systems is the other factor explaining distribution cost differences: District heating systems in the US and Japan are at the bottom of the distribution cost range because they mainly consist of integrated, smaller-scale district heating systems in commercial areas� For the same reason, the distribution cost of district cooling is low in Kuwait and the UAE; its integration is mainly expected to be directly with commercial or (densely populated) residential developments�
Generation cost
The generation costs of heating/cooling consist of fixed cost (i.e. investment, operation and maintenance cost) and fuel cost minus the value of the electricity produced in the case of CHP plants�
Investment costs make up the majority of fixed costs and are expected to change little over time due to the maturity of heating technologies� Solar technologies and some types of CHP plants and heat pumps are exceptions, and their cost is expected to decline more significantly up to 2030� On the other hand, it is assumed that decentralised biomass heating will experience a 20% cost increase due to more stringent regulations on emissions in populated centres (Danish Energy Agency, 2013)�
Today, biomass is the main type of renewable energy used in DHC systems� Investment costs of biomass CHP plants are expected to remain higher than their coal-fired equivalents� Expected costs for the former range from USD 4 360 kilowatts (kW) to USD 6 980/kW in 2030, depending on details of the plant design and the fuel used (Danish Energy Agency, 2016a)� Coal CHP plants are expected to require around USD 2 600/kW of capacity – in line with the level today (IEA Energy Technology Systems Analysis Programme, 2010)� Biomass boilers come at a much lower cost (USD 545-1 199/kW) because they are less technically complex (Danish Energy Agency, 2016a, and IRENA, 2015a)� Despite the cost premium, the additional value
Figure 9: Levelised cost of distribution of hot and cold water in 2030
0
5
10
15
20
25
30
35
40
China Denmark Germany Poland Switzerland Japan US
Leve
lised
cos
t [U
SD/G
J]
District heating
0
1
2
3
4
5
6
7
8
Japan US Kuwait UAE
Leve
lised
cos
t [U
SD/G
J]
District cooling
Capex Network Opex Network Capex Substation Opex Substation
Based on IRENA estimates; see Annex 1.

RENEWABLE ENERGY IN DISTRICT HEATING AND COOLING38
from electricity generation means CHP plants remain the dominant form of heat generation from biomass�
Along with investment, fuel costs are the most important cost driver� There are a wide range of different types of biomass fuel, and an equally broad range of expected costs� The cost of municipal waste, for example, is highly dependent on location� Negative values are reported in Switzerland, reflecting the net benefits of final waste disposal� In general, changes in fuel cost to 2030 vary starkly between the countries assessed, ranging from a 300% increase in biomass costs in Poland to a 45% decrease in electricity costs in China (see annex 4)�
The electricity fed into the grid by CHP plants is considered a by-product of heat generation� Its remuneration varies widely across countries because a broad range of policy instruments has been put in
place to support power generation from efficient co-generation� No incentives are assumed to be in place in 2030, with generated power sold at the projected spot market price�
Heating and cooling production facilities are assumed to operate with an annual capacity factor unique to each country� This does not apply to solar heating and cooling technologies because some of their output needs to be discarded during peak production in summer if no seasonal storage is in place� Three different subtypes of solar heating plants are considered in the analysis: two without storage and with varying production/demand match; and one option with seasonal storage tanks�
The detailed assessment of the levelised cost of decentralised heating and district heating technologies in 2030 for Germany is shown in Figure 10� Similar
Figure 10: Levelised cost of decentralised heating and district heating technologies in Germany in 2030
-10 10 30 50 70 90 110
Geotheral, dirct use
Solar district heat, high load match factor
Electric heat pumps,elevated temp.
Coal CHP
Solar district heat, low load match factor
Biomass boilers
Electric heat pumps, ambient temp.
Biomass CHP plants
Biogas boiler
Biowaste CHP
Gas-fired absorption heat pumps
Solar district heat, seasonal storage
Coal boiler to biomass conversion
Coal CHP to biomass conversion
Geothermal + absorption heat pump
Gas boiler
Geothermal with electric heat pump
Natural gas CHPBiogas CHP
Electric boiler
Levelised cost (USD/GJ)
District heating technologies - Germany
Fixed cost Fuel cost Network cost
-10 10 30 50 70 90 110
Decentralised sorption heat pumpsDecentralised coal heating
Decentralised biomass heatingDecentralised electric heat pumps
Decentralised gas heatingDecentralised micro-CHPDecentralised oil heating
Decentralised electric heatingDecentralised solar heating
Decentralised heating technologies - Germany
Based on IRENA estimates

A sector roadmap for REmap 2030 39
Figure 11: Levelised cost of decentralised heating and district cooling technologies in UAE in 2030
0 2 4 6 8 10 12
district cooling electric chiller
Solar district cooling, low temperature
district cooling natural gas fired chiller
Solar district cooling, high temperature
Levelised cost (USD/GJ)
District cooling technologies - UAE
Fixed cost Fuel cost Network cost
0 2 4 6 8 10 12
Commercial chiller
Natural gas absorption chiller
Decentralised cooling technologies - UAE
Based on IRENA estimates
graphs for the other countries evaluated are provided in annex 5� If network costs are ignored, the cost of almost half the heating options in Germany is at around USD 20/GJ� Several renewable options (such as solar and geothermal district heat) have lower cost than this and compete with most decentralised solutions� Organic waste CHP plants deliver heat at a cost of USD 3/GJ, which makes them competitive with almost all the other options even if the district heating infrastructure is added to the cost� The decentralised heating sources with the lowest costs are gas-fuelled heat pumps and coal-fuelled boilers�
Many of the renewable district heating technologies are expected to be cost-competitive in 2030 in Germany, even if ignoring reduced externalities (e.g. carbon emissions and air pollution)� This is not necessarily the case when including network cost� All district heating technologies have higher levelised costs than decentralised gas heating, for example� This implies that substituting conventional generation in district heating networks with renewables is likely to be cost-competitive� However, this is not the case for new networks based on renewables� The numbers differ somewhat for the other countries with district heating technologies but the general indications are similar� Again, reduced externalities are not taken into account here� Section 3�6 shows the overall costs and benefits of increasing renewable DHC including the impact of reduced externalities�
Figure 11 shows a detailed assessment of the levelised cost of decentralised cooling and district cooling technologies in 2030 in the UAE� Assuming relatively low electricity prices, chillers are the most competitive (both in district and decentralised cooling)� Due to the high seawater temperatures, natural water cooling requires either long intake pipes or additional heat pumps to lower the temperature� For solar district cooling, the investment cost is expected to be high, leading to relatively high overall costs� Renewable options thus come at a cost premium compared to conventional alternatives unless externalities are accounted for�
The cost of cooling generation is particularly low in the UAE and Kuwait when compared to Japan and the US� This is mainly due to three factors:
● high demand and favourable capacity factors due to a high cooling load throughout the year
● low cost of labour in the UAE and Kuwait
● relatively low electricity prices in the UAE and Kuwait�
However, decentralised chillers create a major strain on the electric grids in Kuwait and the UAE� This effect can be lowered by solar and seawater cooling, which creates additional value for these resources but has not been considered in this analysis�

RENEWABLE ENERGY IN DISTRICT HEATING AND COOLING40
In general, centralised water heating or cooling can provide cost advantages due to economies of scale� Overhead costs and inefficiencies in the operation and planning can be avoided if several industrial-sized plants are installed instead of a greater amount of small decentralised units� In some cases, this justifies the additional investment in the distribution infrastructure�
3�4 REmap
Under REmap, the total energy generated by DHC systems is the same as in the Reference scenario� However, additional potential is identified for the various renewable energy technologies in these systems, as explained in section 1�3� This increases the share of renewable energy in DHC in all countries assessed (figure 12)� In addition, there is some diversification, which in some cases means a reduction of the biomass share�
Across each country, most of the existing DHC plants are expected to be decommissioned between 2015 and 2030 as they reach the end of their technical lifetimes� The exception is China, where the fleet of heating plants was installed relatively recently� However, REmap does not lead to forced premature retirement in any of the countries, including China� Renewable heat generation capacity is assumed to be substituted by renewable plants of equivalent size� The same holds for plants fulfilling services relevant to other sectors (such as waste incineration)� Below is an overview of the implications for each of the countries assessed�
Various renewable district heating technologies are competitive by 2030 in China� However, due to China’s rapid urban growth during the last decades, many of the heating plants were constructed recently and are expected to remain operational until 2030� This allows many old plants to operate beyond 2030, which in turn limits the potential of renewables for centralised heating� On the basis of resource availability, the total share of renewable district heat with REmap is 24% (837 PJ)� It is composed of roughly equal proportions of geothermal, biomass and solar heat� Electric boilers and heat pumps are employed to some extent to assist with integrating wind power in regions which suffer from restricted connection to the national electric grid�
Denmark is already implementing innovative renewable district energy solutions and converting existing coal
CHP plants to use biomass� However, the limited availability of bioenergy feedstock forms a constraint affecting further expansion� Imports from nearby countries currently compensate for this but as a result of this constraint the biomass share in district heating increases only modestly under REmap to 53% (or 67 PJ) by 2030� This compares with 51% in the Reference Case� In addition, solar and geothermal heat each contribute 17 PJ and 8 PJ respectively� The integration of solar heat is facilitated by the use of district heating in semi-rural environments with lower urban density and higher space availability� The current and future dominance of wind power in the Danish electricity grid provides incentives for using surplus electricity for heat generation� As a result, electric boilers and heat pumps are assumed to play a more important role under REmap� Overall, Denmark continues to have the highest share of renewable energy in district heat in 2030, exceeding 70% under REmap�
Compared to the Reference Case, Germany significantly diversifies renewable energy in district heating, broadening the focus from biomass alone by adding geothermal and solar� The heat contribution from electric boilers and heat pumps also increases� This is partly driven by the increasing volume of variable power capacities and the need for more flexibility in the energy system� In Germany, power-to-heat schemes have been acknowledged as a valid approach in the government’s coalition agreement (Bundesregierung Deutschland, 2013)�
Geothermal is cost-competitive in areas where it is available, while the competitiveness of solar heat is set to improve substantially up to 2030 (figure 13)�11 The substitution cost corresponds to the annualised cost difference (including capex and opex) between the renewable technologies and the most competitive non-renewable alternative� In Germany, this alternative is supplied by large-scale absorption heat pumps� Biowaste CHP, geothermal and the co-combustion of forestry residues in boilers are all competitive by 2030� The other options are not competitive at expected market energy prices but are nevertheless added to the mix� This is explained by the potential overall benefit they could contribute to the energy system
11 The substitution cost for the other countries assessed can be found in annex 5�

A sector roadmap for REmap 2030 41
when reduced externalities are accounted for (further explored in section 3�6)�
The share of coal providing district heat reduces significantly in Poland from more than 80% in the Reference Case to about 56% in 2030 under REmap�
The share of renewables increases to 23%, compared to 11% in the Reference Case� This is mainly due to the addition of forestry residues in converted coal CHP plants and boilers, which is found to be a competitive alternative by 2030� Since district heating systems are widespread in Polish cities, there are good opportunities
Figure 12: Mix of district heat and cooling generation under REmap compared to Reference Case
8,7%
50,6% 53,2%
33,0%
20,6%
8,0% 4,7%
40,7%
26,8%21,2% 19,7%
29,8% 26,8%7,9%
13,4%
6,2%
9,9%
7,7%
6,0%
7,1%
6,2%
7,2%
8,5%
16,7%
3,4%3,4%
4,9%
9,0%
3,1%
3,6%
3,1%
9,4%
29,0%
41,3%28,1%
5,8%
8,1%
33,1%
9,5%
75,1%
29,0%
57,8% 42,1%90,8%
63,0%
10,8%
25,7%
9,7%
81,7% 55,9%
12,0%
5,5%
27,1%
3,9%
19,1% 18,7%
11,2%
22,2%
12,4%18,0%
6,7% 6,9%
22,9%16,9%
0%
10%
20%
30%
40%
50%
60%
70%
80%
90%
100%
Reference REmap Reference REmap Reference REmap Reference REmap Reference REmap Reference REmap Reference REmap
China Denmark Germany Poland Switzerland Japan US
Shar
e of
hea
t gen
erat
ed
District heating
Biomass Solar heating Geothermal Oil
Natural gas Coal Other district heat Waste heat
Electricity Non-renewable waste Renewable district heat
23,4% 21,6%
4,5%
23,2%
7,4% 14,3%
7,6%
26,4%69,0%17,0%
8,9%
5,0%
4,4%
5,0%
17,0%
39,6%
98,9%
49,5%
95,0%
83,5%
95,0%
48,5%
14,0% 12,7%5,7%
0%
10%
20%
30%
40%
50%
60%
70%
80%
90%
100%
Reference REmap Reference REmap Reference REmap Reference REmap
Japan US Kuwait UAE
Shar
e of
coo
ling
gene
rate
d
District cooling
Other district cooling
Electricity (electric chiller)
Natural gas (absorption chiller)
Free cooling
Solar cooling
Renewable district cooling

RENEWABLE ENERGY IN DISTRICT HEATING AND COOLING42
to also incorporate solar (51 PJ) and geothermal heat (44 PJ)�
The high cost of electricity and gas in Switzerland in 2030 make the exploitation of renewable resources highly competitive� Policies for supporting renewable district heating are already in place at the cantonal level� Demonstration projects for geothermal and solar heating have been implemented, and it is expected that geothermal heat will be used at a larger scale by 2030� Residues from forestry are also considered underutilised in Switzerland’s energy system today� Altogether, the renewable energy share in district heat generation increases to 45% under REmap� However, the overall contribution of renewable district heating remains modest in absolute numbers: 3�5 PJ of geothermal heat, 0�4 PJ of solar heat and 5�6 PJ of heat plants fuelled by biomass� This is because district heating meets just 4�7% of total heat demand in 2030�
Despite the limited role of DHC in the US today, significant additional potential for renewable DHC was identified under REmap� A national assessment revealed that biomass is available in large quantities (Perlack et al., 2011), meeting 138 PJ of final district heating demand under REmap� Solar heat (31 PJ) and geothermal heat (18 PJ), which are both competitive at expected market prices in 2030, complement the renewable district heating mix� Natural water and solar cooling have the potential to contribute 20 PJ and 31 PJ to final district cooling consumption� Overall, the share of renewable energy in both district heating and cooling increases to 36% under REmap�
Kuwait and UAE resource conditions are quite similar� However, in Kuwait, the lack of experience and limited policy focus on both conventional and renewable centralised cooling is expected to hold back deployment potential by 2030� In REmap, the share of renewable
Figure 13: REmap cost supply curve for Germany*
Old capacity
New, non-renewable capacity
Biowaste CHP, old networksGeothermal district heating, old networks
Biomass co – combustion in boilers, residues from forestryBiomass boilers, residues from agriculture, old networks
Biomass boilers, forest residues, old networksSolar district heating, old networksSolar district heating, old networks
Biomass boilers, wood fuel, old networksBiomass boilers, energy crops, old networks
Biomass CHP plant, residues from agriculture, old networks
Biomass CHP plant, residues from forestry, old networksBiomass CHP plant, wood fuel, old networks
Biomass CHP plant, energy crops, old networks
0,0% 1,0% 2,0% 3,0% 4,0% 5,0% 6,0% 7,0% 8,0% 9,0%
-15
-10
-5
0
5
10
15
20
25
30
35
0 100 200 300
Share of total heating demand
Subs
titut
ion
cost
[U
SD/G
J]
Energy [PJ]
Biomass Biomass co-combustion Geothermal Solar heating
*substitution costs are calculated on the basis of the least expensive non-renewable centralised heating technology.

A sector roadmap for REmap 2030 43
3�5 Structural Shift
This section explores the options for Structural Shift, in which the overall use of DHC is increased beyond the Reference Case and REmap� For each country, the additional potential for substituting decentralised heating and cooling installations with renewable DHC technologies was assessed� Depending on the country, the additional potential is limited by either the availability of renewable resources or the saturation of the DHC system� Additional potential was identified in each country, increasing the overall share of DHC for heating and cooling (figure 15)�
The magnitude of the renewables contribution, and the type of renewable energy identified for the purpose of further expanding DHC systems, varies significantly by country (figure 16)� The increase in DHC capacity beyond the Reference Case ranges from 5% in Denmark, which already expects a high penetration of district heating, to 64% for the UAE� In the UAE, existing experience in
energy in district cooling increases to 12%, comprising 4 PJ of solar cooling and 7 PJ of cold seawater� Electric chillers are employed to cover the majority of the remainder� Even using conventional district cooling, replacing these chillers would probably make a major improvement to energy efficiency�
Ambitious targets and experience with decentralised cooling are a promising starting point for the UAE� Thus far, the country has made only limited use of solar cooling and has not used seawater district cooling systems at all� However, excellent resource availability and the strain on the electric grid from decentralised cooling are both strong reasons for switching to renewables� Under REmap, almost half the district cooling demand in 2030 is covered by seawater (99 PJ) and solar cooling (87 PJ) even though research shows that both technologies are costly compared to large-scale chillers (see Figure 11)� However, this ignores both the significant benefits to the electric grid and reduced externality costs from carbon emissions and air pollution, for instance�
Figure 14: REmap cost supply curve for UAE
Old capacity
New, non-renewable capacity
Natural district cooling, new networks
Solar district cooling, old networks
Solar district cooling, new networks
Natural district cooling, new networks
0,0% 5,0% 10,0% 15,0% 20,0% 25,0%
0
1
2
3
4
5
6
0 100 200 300
Share of the total cooling demand
Subs
titut
ion
cost
[U
SD/G
J]
Energy [PJ]
Natural water cooling Solar cooling
*substitution costs are calculated on the basis of the least expensive non-renewable centralised heating technology.

RENEWABLE ENERGY IN DISTRICT HEATING AND COOLING44
district cooling, and the additional potential to meet fast growing cooling demand, explains the significant further increase� Table 5 provides the rationale for the additional renewable energy in each of the countries�
Potential thus exists to further expand renewable DHC beyond REmap but the question is whether costs outweigh the benefits� This is explored in the next section�
Figure 16: Composition of difference between REmap and Structural Shift*
38%17% 26% 33%
54% 64%53%
19%
20%27% 6%
43%11%
9%
43%62%
47%61%
25%39%
+19% +5% +26% +10% +38% +10% +20%
0%
20%
40%
60%
80%
100%
CN DK DE PL CH JP USA
Shar
e of
add
ition
al d
istr
ict e
nerg
y de
man
d District heating
Biomass Geothermal Solar heating
24%40%
67%53%
76%60%
33%47%
+10% +20% +10% +64%
0%
20%
40%
60%
80%
100%
JP USA KW UAE
District cooling
Natural cooling Solar cooling
*The percentage values above the bars indicate the difference in district energy generated compared to REmap.
Figure 15: Share of district heating in cooling as a fraction of total heating and cooling demand
7%
51%
9%
34%
6%
0,4
% 6%7%
70%
9%
32%
8%
0,5
% 8%8%
74%
12%
35%
11%
0,5
%
10%
0%
10%
20%
30%
40%
50%
60%
70%
80%
China Denmark Germany Poland Switzerland Japan US
Shar
e of
tota
l dem
and
District heating
4% 4%
0,0
%
23%
5% 5%
15%
28%
5% 6%
17%
45%
0%
5%
10%
15%
20%
25%
30%
35%
40%
45%
50%
Japan US Kuwait UAE
District cooling
2015 Remap/Reference Structural Shift

A sector roadmap for REmap 2030 45
Table 5: Summary of additional renewable DHC identified under Structural Shift per country
Country Additional DHC capacity to Reference
Case 2030
Rationale
China +19% ● Based on the highest projection for district heating generation by IEA World Energy Outlook (2015)�
● Additional resource availability is limited for geothermal heat; more focus on expanding biomass use and solar heat�
Denmark +5% ● Limited by saturation of district heating market� ● Focus on geothermal and solar heat motivated by lack of biomass feedstock
and a dynamic market for large-scale solar heat�Germany +26% ● Given the established role of district heating, further expansion of networks
is conceivable� ● Biomass availability varies by state; intensification of resource use relates to
wood chips and agricultural residues� ● Additional geothermal resources are available close to demand centres� ● Solar heat could be tripled, leading to a 32% use of the potential resource�
Poland +10% ● District heating penetration has been high in the past� ● As heat networks reach less dense urban centres, solar heat can cover a
majority (61%) of the additional load� ● Additional biomass resources (33%) and opportunities to develop geothermal
wells (6%) are also available�Switzerland +38% ● Significant further expansion of capacity is considered feasible�
● Residues from forestry are underutilised; their use is assumed to double (still only amounting to 25% of resource potential)�
● Geothermal heat is doubled, and solar heat increases by 50%, in line with current efforts to increase the use of e.g. geothermal heat in various locations in Switzerland�
Japan +10% ● Limited additional potential due to space limitations and lack of policy focus� ● Additional district heat from forest residues (65%), solar heat (25%) and
geothermal heat (10%) driven by the relative availability of these resources�US +20% ● Due to diverse usage and currently low DHC levels, there are many
opportunities for expansion; a 20% increase is considered conservative� ● Based on resource availability, there is additional biomass (53%), solar heat
(39%) and geothermal heat (9%)� ● The 20% addition in district cooling is generated by solar (60%) and natural
water cooling (40%), which are both unconstrained resources�UAE +64% ● Figure is based on the high end projections by Strategy& (2012) for the share
of district cooling in the UAE in 2030� ● About 53% and 47% of this additional demand is assumed to be met by
natural water and solar cooling – well below the estimated resource potential�Kuwait +10% ● The potential in Kuwait is restricted by lack of experience with centralised
systems thus far as well as limited policy focus� ● One-third of the 10% increase in district cooling generation is met by
seawater, and two-thirds by solar cooling� ● Once this is included, the use of resource potential amounts to 70% for solar
and 9% for natural cooling�

RENEWABLE ENERGY IN DISTRICT HEATING AND COOLING46
3�6 Costs, benefits and investment needs
To assess the cost and benefits of renewable DHC comprehensively, four factors are taken into account�
1. Average substitution cost: this is the difference between the levelised renewable DHC costs and the non-renewable alternatives� It is calculated by first working out the average substitution cost for each technology/country (see annex 5)� These estimates are then weighted on the basis of their contribution to overall additional heat/cold� A negative substitution cost implies that the renewable technology makes a bigger impact on cost reduction than its conventional alternative�
2. Avoided external cost from local air pollutants: the switch to renewables and away from fossil fuel generally avoids local air pollution, which reduces external cost (e.g. on healthcare spending)�
3. Additional external costs from local air pollutants: however, biomass utilisation can make an impact on local air quality, which increases external costs�
4. External costs from carbon emissions: all renewable options are assumed to be free of
carbon once they are operating� Two values are assumed for carbon emissions: USD 20 per tonne CO2 and USD 80 per tonne CO2 for the year 2030�
Aggregating these four impacts provides an indication of the overall cost/benefits of additional renewable DHC for each country under REmap and Structural Shift�
REmap costs and benefits
Figure 17 shows the breakdown and total cost/benefits per country of substituting conventional DHC generation by renewable energy in REmap� In four countries (China, Denmark, Kuwait and Poland) the overall benefits exceed costs� In the remaining countries, costs exceed benefits� This is driven by several factors unique to each country but in general four cases can be distinguished, as explained below�
● China/Denmark/Poland: the external costs associated with the extensive use of coal in China and Poland, and gas in Denmark, are greatly reduced under REmap� In addition, renewable DHC competes closely with conventional alternatives� This compensates for externality costs arising from additional biomass combustion� The overall benefits of additional renewable district heating in these countries under REmap therefore exceed the costs�
Figure 17: Cost and benefits of REmap compared to Reference Case
-35
-30
-25
-20
-15
-10
-5
0
5
10
15
20
25
30
35
40
Poland China Denmark Kuwait UAE Germany Switzerland Japan US
Cost
and
ben
efit [
USD
/GJ]
Additional external cost CO2 emissions USD 80 per tonne
External cost CO2 emissions USD 20 per tonne
Avoided external cost of local pollutants
External cost local pollutants REmapscenario
Average substitution cost
Total at USD 20 per tonne CO2
Total at USD 80 per tonne CO2
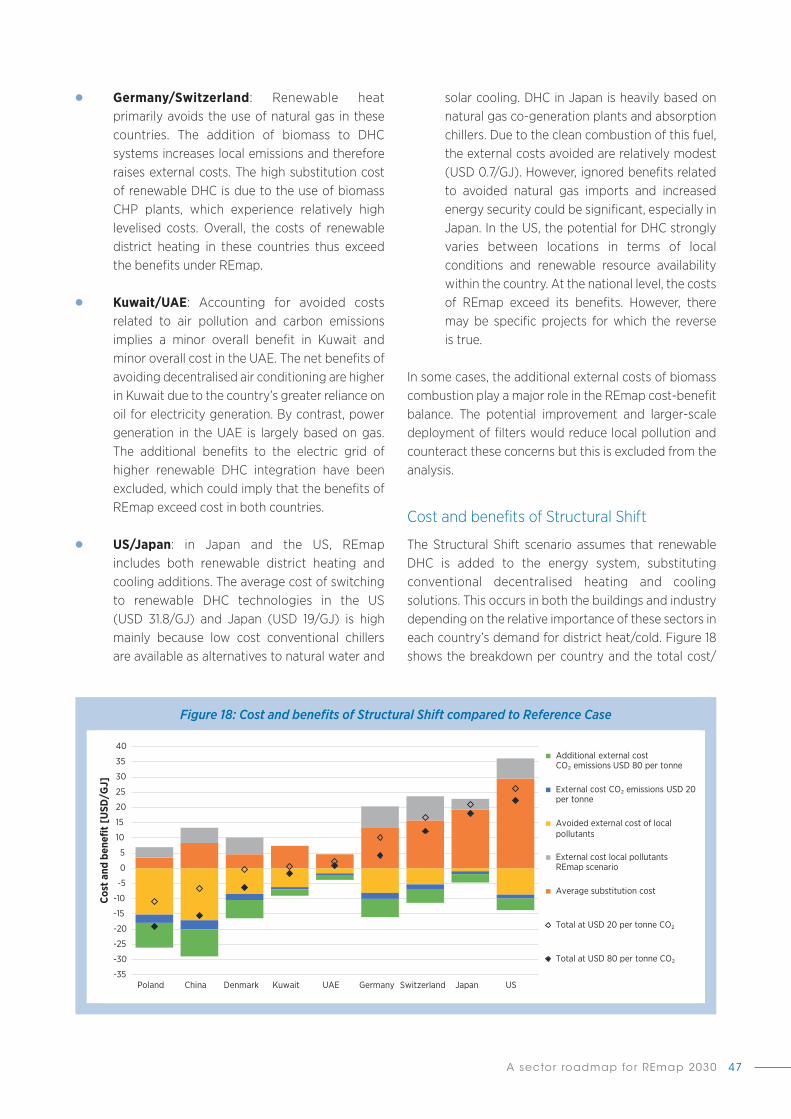
A sector roadmap for REmap 2030 47
● Germany/Switzerland: Renewable heat primarily avoids the use of natural gas in these countries� The addition of biomass to DHC systems increases local emissions and therefore raises external costs� The high substitution cost of renewable DHC is due to the use of biomass CHP plants, which experience relatively high levelised costs� Overall, the costs of renewable district heating in these countries thus exceed the benefits under REmap�
● Kuwait/UAE: Accounting for avoided costs related to air pollution and carbon emissions implies a minor overall benefit in Kuwait and minor overall cost in the UAE� The net benefits of avoiding decentralised air conditioning are higher in Kuwait due to the country’s greater reliance on oil for electricity generation� By contrast, power generation in the UAE is largely based on gas� The additional benefits to the electric grid of higher renewable DHC integration have been excluded, which could imply that the benefits of REmap exceed cost in both countries�
● US/Japan: in Japan and the US, REmap includes both renewable district heating and cooling additions� The average cost of switching to renewable DHC technologies in the US (USD 31�8/GJ) and Japan (USD 19/GJ) is high mainly because low cost conventional chillers are available as alternatives to natural water and
solar cooling� DHC in Japan is heavily based on natural gas co-generation plants and absorption chillers� Due to the clean combustion of this fuel, the external costs avoided are relatively modest (USD 0�7/GJ)� However, ignored benefits related to avoided natural gas imports and increased energy security could be significant, especially in Japan� In the US, the potential for DHC strongly varies between locations in terms of local conditions and renewable resource availability within the country� At the national level, the costs of REmap exceed its benefits� However, there may be specific projects for which the reverse is true�
In some cases, the additional external costs of biomass combustion play a major role in the REmap cost-benefit balance� The potential improvement and larger-scale deployment of filters would reduce local pollution and counteract these concerns but this is excluded from the analysis�
Cost and benefits of Structural Shift
The Structural Shift scenario assumes that renewable DHC is added to the energy system, substituting conventional decentralised heating and cooling solutions� This occurs in both the buildings and industry depending on the relative importance of these sectors in each country’s demand for district heat/cold� Figure 18 shows the breakdown per country and the total cost/
Figure 18: Cost and benefits of Structural Shift compared to Reference Case
-35
-30
-25
-20
-15
-10
-5
0
5
10
15
20
25
30
35
40
Poland China Denmark Kuwait UAE Germany Switzerland Japan US
Cost
and
ben
efit [
USD
/GJ]
Additional external cost CO2 emissions USD 80 per tonne
External cost CO2 emissions USD 20 per tonne
Avoided external cost of local pollutants
External cost local pollutants REmap scenario
Average substitution cost
Total at USD 20 per tonne CO2
Total at USD 80 per tonne CO2

RENEWABLE ENERGY IN DISTRICT HEATING AND COOLING48
benefits of Structural Shift i.e. replacing conventional distributed heating and cooling with renewable energy�
By definition, the Structural Shift substitution costs are always greater than or equal under REmap� This is because any new renewable district DHC capacity competes with both the non-renewable centralised and decentralised alternatives� The avoided external cost depends on the fuel types used in the decentralised heating and cooling facilities� Since gas dominates decentralised heating, replacing its use for heat under REmap creates fewer environmental benefits than replacing centralised coal-based heating, for instance� The remaining difference in the cost-benefit balance is due to the shift towards a higher or lower biomass fraction�
The Structural Shift analysis provides some interesting insights� Firstly, in China, Denmark, Poland and Kuwait a net benefit arises from replacing conventional decentralised cooling/heating generation expected in the Reference Case in 2030 with renewable-based DHC systems� However, the assumed value for carbon emissions in Denmark and Kuwait makes a difference: at USD 20/t CO2 there is a clear benefit while at USD 80/t CO2 benefits and costs are almost identical� In Denmark, the net benefits in the Structural Shift scenario are much lower than in REmap mainly because of the high expected cost of additional networks� New networks in Denmark will mainly be introduced in areas with low population density�
Secondly, the costs of Structural Shift in Germany, Switzerland, Japan, the US and the UAE exceed the benefits just as the costs of REmap exceed its benefits�
It is very likely that plenty of specific projects in these countries will experience net benefits� However, other solutions for decarbonising heating and cooling could be more efficient (e.g. electrification and the decarbonisation of the electricity sector)�
Investment needs
To implement REmap or Structural Shift instead of the Reference Case by 2030, different levels of investment are required� Figure 19 provides an overview of annual investment requirements per country� In some countries (China, Poland, and the US), REmap requires less investment than the Reference Case� This is due to the substitution of relatively expensive coal and gas-fired CHP plants� The diverse mix of renewables combined with efficient electric and absorption heat pumps significantly reduces investment needs� In many cases, the installation of electric boilers and heat pumps is motivated by the availability of surplus renewable electricity� However, electric energy is not considered renewable in this context� Consequently, the cost of non-renewable capacity is higher in Denmark, Germany, and Switzerland under REmap� In Japan, Kuwait and the UAE, the addition of district cooling implies higher investment requirements� Conventional chillers providing capacity in the Reference Case are less capital-intensive than solar and seawater cooling, for example� The need for new network infrastructure under Structural Shift means that in this case the investment requirements consistently exceed those in the Reference Case or REmap� In general, average annual investment in renewable DHC systems has to increase significantly in most countries to achieve REmap�

A sector roadmap for REmap 2030 49
Figure 19: Average annual investment requirements in 2015-2030 for the Reference Case, REmap and Structural Shift*
24,3-7.6
+0.4
0 5 10 15 20 25 30
ReferenceREmap
Structural Shift
Chi
na
2,6+0.7
+2.3
0 1 2 3 4 5 6
ReferenceREmap
Structural Shift
Ger
man
y
1,1+0.4
+0.7
0 0,2 0,4 0,6 0,8 1 1,2 1,4 1,6 1,8 2
ReferenceREmap
Structural Shift
Den
mar
k
9,1-0.3
+1.2
0 2 4 6 8 10 12
ReferenceREmap
Structural Shift
Pola
nd
0,1+0.04
+0.21
0 0,05 0,1 0,15 0,2 0,25 0,3 0,35 0,4
ReferenceREmap
Structural Shift
Switz
er-
land
0,1+0.02
+0.06
0 0,02 0,04 0,06 0,08 0,1 0,12 0,14 0,16 0,18
ReferenceREmap
Structural Shift
Japa
n
4,7-0.5
+1.1
0 1 2 3 4 5 6 7
ReferenceREmap
Structural Shift
US
0,2+0.06
+0.14
0 0,05 0,1 0,15 0,2 0,25 0,3 0,35 0,4
ReferenceREmap
Structural Shift
Kuw
ait
0,5+0.8
+2.2
0 0,5 1 1,5 2 2,5 3
ReferenceREmap
Structural Shift
UA
E
Annual investment 2015-2030 [USD billion/yr]
Non-renewable plants Renewable plants Network
*Positive/negative bar labels for REmap and Structural Shift show the difference to the Reference Case.

RENEWABLE ENERGY IN DISTRICT HEATING AND COOLING50
As variable power sources like solar panels and wind turbines experience ever increasing capacity additions throughout the world, the possibility of using excess power for heating is gaining ground� District heating systems can absorb surplus power through the use of electric boilers and heat pumps� The heat generated can thereby be fed into the grid directly or stored in large-scale hot water tanks for later use� The large scale of district heating makes a key difference to this process, allowing for the participation in the relevant markets for electricity and ancillary services and giving access to a wide pool of customers and demand profiles� Also, larger scales justify the installation of low cost heat storage for buffering on various time scales� The correlation between peak wind power production in winter and heat demand is generally positive� Power-to-heat schemes in district heating networks are especially cost-effective when compared with other approaches, such as batteries or power-to-gas (CE Delft, 2015)�
District cooling could play a similar role where there is high solar power penetration and extensive district cooling systems use� Typical district cooling systems contain major storage capacity to provide relief to the grid while generating ice or cold water during the night� This storage could also facilitate the integration of renewable power for district cooling� However, this concept is not being discussed as a way to help integrate variable power because it is little used�
In theory, electric boilers and heat pumps in district heating systems can be employed in three different applications (Agora Energiewende, 2014)� Their applicability depends strongly on the regulatory framework in the country concerned, as explained below�
● Transmission constraints in the electric grid can inhibit variable power if regions with high concentrations of variable power generators
are insufficiently connected to demand centres� However, the use of this excess energy requires regulations to allow corresponding power purchase agreements�
● Oversupply and limited demand create similar effects as the first point but on the scale of the whole system� In this case, negative electricity prices on the wholesale market can incentivise power-to-heat schemes�
● The provision of regulation services: demand for regulation and other ancillary services is not exclusively linked to the predominance of variable power but increases when wind and solar capacity are added� For countries where otherwise curtailed electricity cannot be bought directly by district energy system operators, regulation services are a particularly important source of revenue for power-to-heat�
Power-to-heat is widely recognised as a valid approach to fostering variable renewables� Its implementation however has been limited to small capacities so far� The case studies below describe three different systems which make use of excess power to some varying degree12�
● Both an electric boiler and electric heat pump are running in the district heating network of Aarhus, Denmark. This is motivated by the country’s ambition to satisfy half its electricity demand using wind power and by its need to add flexible demand to the grid� Wind power meets a large proportion of Denmark’s electricity demand� However, curtailments can largely be avoided thanks to the extensive transmission capacities available to neighbouring countries�
12 See case studies in separate document at www.irena.org/remap.
4. SYNERGIES BETWEEN VARIABLE RENEWABLE POWER AND DISTRICT HEATING AND COOLING

A sector roadmap for REmap 2030 51
Nevertheless, power-to-heat is attractive due to the ubiquity of district heating in Denmark�
● In Lemgo, Germany, an electric boiler was installed for similar reasons� However, the emphasis is more on the provision of ancillary services� The direct utilisation of otherwise curtailed power is not an option under current regulatory conditions in Germany (Agora Energiewende, 2014)� Germany experienced negative electricity prices over 126 hours on 25 days in 2015 (BHKW-Infozentrum, 2016)� This
value is fairly low but experience shows power-to-heat is a viable approach in some regions to adding flexibility to the system�
● In Hohhot, Inner Mongolia, China, excess power is sold by the wind turbine operators directly to the district heating utility� Electric boilers were installed as part of a major retrofit of the city’s heating networks� Inner Mongolia has the bulk of wind turbines installed in China� In 2012, curtailment amounted to 20%-30% of electricity production potential (Windpower Monthly, 2013)�
Table 6: Summary of case studies on synergies between variable renewable power and DHC
Characteristics Drivers Reported barriersAarhus, Denmark
● electric boiler inside existing CHP plant in established district heating system
● electric seawater heat pump in new subsystem (Aarhus Ø)
● availability of thermal storage in the system
● combination with CHP plant to make use of storage and connection with electricity and district heat
● strong targets for wind power expansion
● replacement of heat from oil boilers
● none
Lemgo, Germany
● 5 MW boiler mainly parti-cipating in ancillary markets
● tariff structure: night-time heat production to avoid capacity cost
● participation in ancillary markets
● availability of thermal storage ● Germany: regional transmis-
sion constraints between wind capacity and demand centres
● fees and taxes on electricity ● heat generation competes
with highly efficient gas CHP plants in summer
● cost premium for high voltage grid connection
Hohhot, China
● 50 MW of boilers in refur-bished system
● direct sale of otherwise curtailed wind power to operate electric boilers
● very high curtailment rates ● direct sale of surplus power
is possible ● retrofit initiatives for formerly
highly polluting heating systems
● lack of connection points to high voltage grid caused cost premiums during the installation

RENEWABLE ENERGY IN DISTRICT HEATING AND COOLING52
5. BARRIERS AND OPPORTUNITIES TO RENEWABLE DISTRICT HEATING AND COOLING
to manage the limitations of high operating temperatures in existing networks�
● Demand: knowledge of current and future demand levels is essential for business model development and municipal planning� This is a complex topic requiring regular dedicated assessments and expert input� Existing systems sometimes suffer from demand reduction or insufficient load connection� This can be resolved by network extension and the step-by-step modular expansion of renewable district energy capacity� On a national scale, appropriate connection policies are often valuable�
● Policies and regulations affect the viability of renewable district energy in many ways� Many of these concepts are new and are thus not adopted� In addition, permitting procedures related to land use (solar heating and cooling) and drilling rights (geothermal heat) are sometimes inefficient and need streamlining� The benefits of clean district energy are not sufficiently acknowledged but this has often been overcome through building labels or holistic city emission reduction targets� The support for natural gas and electricity (in the form of subsidies, for example) as well as the local scale of district energy are also potential barriers�
Many barriers and opportunities to renewable DHC depend on the city context, which varies according to level of development (growing, established) and DHC infrastructure (saturated, expanding or new)� A summary of the specific barriers and opportunities relating to the level of DHC development in different city settings is set out below�
● Saturated networks meet the bulk of heating demand in a city� In established cities, the use of
Key points
This chapter gives an overview of the main barriers to the more widespread adoption of renewable DHC� The analysis is primarily based on the case studies summarised in section 2�3� A broad range of barriers and opportunities are identified, some of which are general and some which apply to specific city contexts� General barriers and opportunities can be grouped into five key areas described below�
● Financing forms a major obstacle due to the large upfront investment cost of renewable district heating projects� This is diminished mainly by reducing risk, stabilising demand and identifying appropriate complementary financing sources�
● Resource availability and cost: problems relating to biomass transport logistics and cost must be alleviated by appropriately planning and optimising the supply system, as well as by streamlining the interaction with relevant actors� Given that some renewables have inflexible or variable supply, either storage capacity is required or synergies between heat, cooling and electricity need to be exploited� Engaging experts from appropriate research centres, learning from the experiences of other cities, and demonstration projects are all valuable ways to solving additional problems related to uncertain resource availability and environmental impacts�
● Constraints imposed by the urban environment and the state of the existing network: identifying synergies with the built environment, expanding the network, and holistic demand and resource assessments are key ways to overcome pressure on space in dense cities� Customer engagement, the renovation of existing pipework, and the appropriate design of new subsystems are ways
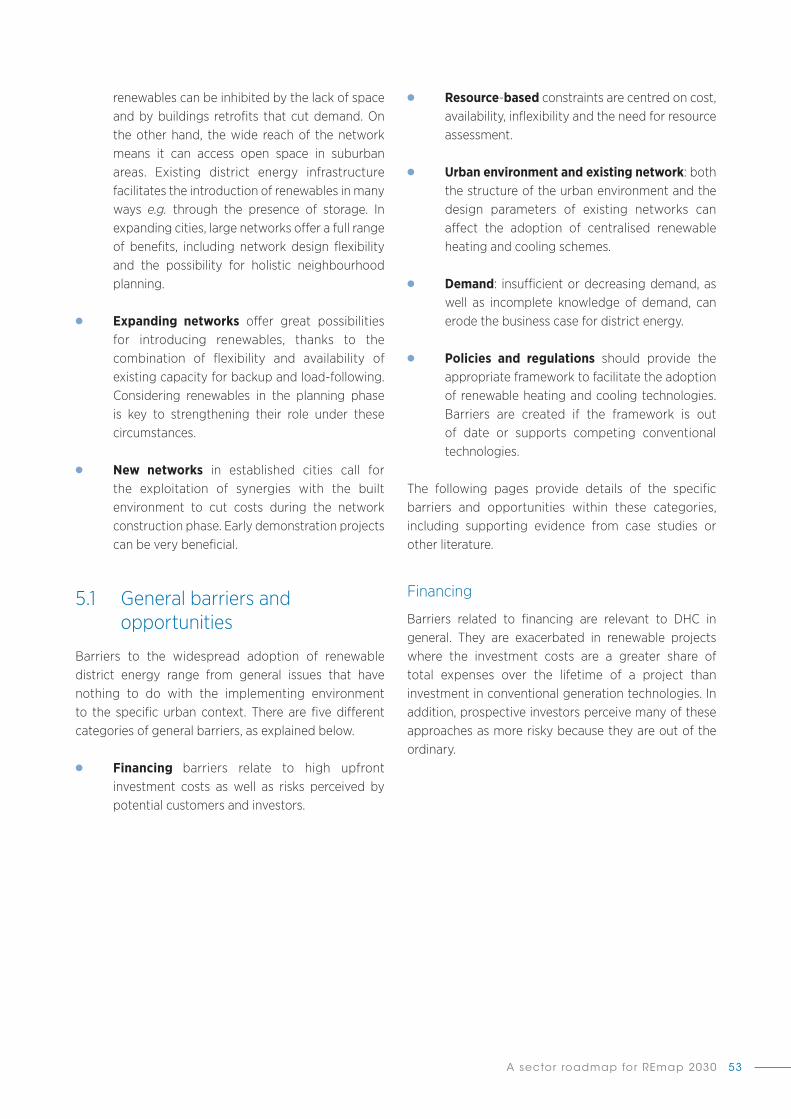
A sector roadmap for REmap 2030 53
renewables can be inhibited by the lack of space and by buildings retrofits that cut demand� On the other hand, the wide reach of the network means it can access open space in suburban areas� Existing district energy infrastructure facilitates the introduction of renewables in many ways e.g. through the presence of storage� In expanding cities, large networks offer a full range of benefits, including network design flexibility and the possibility for holistic neighbourhood planning�
● Expanding networks offer great possibilities for introducing renewables, thanks to the combination of flexibility and availability of existing capacity for backup and load-following� Considering renewables in the planning phase is key to strengthening their role under these circumstances�
● New networks in established cities call for the exploitation of synergies with the built environment to cut costs during the network construction phase� Early demonstration projects can be very beneficial�
5�1 General barriers and opportunities
Barriers to the widespread adoption of renewable district energy range from general issues that have nothing to do with the implementing environment to the specific urban context� There are five different categories of general barriers, as explained below�
● Financing barriers relate to high upfront investment costs as well as risks perceived by potential customers and investors�
● Resource-based constraints are centred on cost, availability, inflexibility and the need for resource assessment�
● Urban environment and existing network: both the structure of the urban environment and the design parameters of existing networks can affect the adoption of centralised renewable heating and cooling schemes�
● Demand: insufficient or decreasing demand, as well as incomplete knowledge of demand, can erode the business case for district energy�
● Policies and regulations should provide the appropriate framework to facilitate the adoption of renewable heating and cooling technologies� Barriers are created if the framework is out of date or supports competing conventional technologies�
The following pages provide details of the specific barriers and opportunities within these categories, including supporting evidence from case studies or other literature�
Financing
Barriers related to financing are relevant to DHC in general� They are exacerbated in renewable projects where the investment costs are a greater share of total expenses over the lifetime of a project than investment in conventional generation technologies� In addition, prospective investors perceive many of these approaches as more risky because they are out of the ordinary�

RENEWABLE ENERGY IN DISTRICT HEATING AND COOLING54
Table 7: Finance barriers and opportunities in renewable DHC
Opportunities Rationale and context Evidence from case studies or other literatureBarrier: high upfront investment costsNational support
Subsidies can play a pivotal role in enabling renewable district energy schemes�
A wide range of national policies to facilitate the implementa-tion of renewable DHC schemes exists around the world (see section 2�2)�
Identification of financing options
The societal value of renewable DHC systems is recognised by many local, governmental and intergov-ernmental institutions� A broad range of financing options is therefore available�
As a result of a loan from the Asian Development Bank, a power-to-heat boiler was installed in Hohhot,13 and the network was refurbished�State-level subsidies covered much of the cost of a solar plant in Graz�A major share of the solar district heating facility cost in Munich was covered by a federal grant�In Munich, the national subsidies for new network infrastruc-ture played a critical role in exploiting geothermal resources through network expansion�
Private sector participation
Attracting private capital and establishing public-private partnerships is a possible strategy for overcoming financial limitations�
A broad range of business models have been designed with varying degrees of private sector involvement for owning and operating district energy systems� This has been discussed by UNEP (2015a) and the International Finance Corporation (2014)�
Synergies with other infrastructure projects
Making use of existing energy infrastructure and other infrastructure projects reduces upfront investment costs�
Combining the construction of new light rail tracks with district energy network extension yielded major cost savings in St Paul�Combining renewable heat sources and existing CHP plants enabled the use of existing storage and connections to electricity and district heating networks in Aarhus�Integrating district cooling pipelines into existing sewage tunnels reduced the cost of the urban distribution infrastruc-ture in Paris�In Graz, a retired urban landfill has been chosen as the site for solar collectors; the landfill gas is used in absorption heat pumps to produce complementary heat�
Stable initial load
Stable demand in the early stages is critical to guaran-teeing steady revenue and justifying upfront cost�
The gradual expansion of capacity in Geneva helped minimise the risk associated with the investment�Integration with new build developments in London and Munich has brought several advantages, such as the availabili-ty of stable anchor load�In Honolulu, contractual agreements which cover sufficient load to create a valid business case were made prior to the construction of the sea water cooling system�
Technical system optimisation
The efficient use of resources and infrastructure greatly affects economic performance
Suboptimal operation of the system erodes the value of the investment� In Munich, the yield of a geothermal well stayed 30% below the expected value because network return temperatures were too high�
Barrier: perception of risk by financing institutions and potential customersDemonstra-tion projects
Demonstration projects enable learning processes and also encourage acceptance by potential customers and finance providers�
Experience of small installations provides valuable input on how to reach the 20% target for solar contribution to the Graz district heating mix� Geneva introduced a pioneering lake water cooling system� Its adoption by other cities in Switzerland is under discussion�
Engagement of research institutes
Many renewable DHC schemes are very innovative and require support from research experts to lower technology risk�
Both the solar heating installation in Munich and the lake water cooling system in Geneva have reportedly benefitted from research expertise�
13
13 See case studies relating to these cities online at www.irena.org/remap.

A sector roadmap for REmap 2030 55
Resources
The local availability of resources benefits most renewable technologies� However, challenges might arise in the case of biomass supply chains�
Table 8: Resource barriers and opportunities in renewable DHC
Opportunities Rationale and context Evidence from case studies or other literature
Barrier: logistical challenges with biomass feedstock supplyStrategic location
Logistics are sometimes difficult but in urban areas a well-judged location for the heating plant alleviates problems�
The biomass plant is close to major road connections in St Paul, which makes it easier to deliver fuel by truck�
Biomass CHP plants in Copenhagen are close to the harbour, allowing biomass imports by ship�
Barrier: high biomass fuel costSupportive policy instruments
Federal policies such as subsidies, feed-in tariffs and carbon taxes often make a major difference to biomass cost-competitiveness�
In Flensburg, the carbon price is considered a critical factor affecting the future viability of district heating based on biomass� The feed-in tariff paid for the electricity from the biomass CHP plants in Ulm is crucial to their competitiveness�In contrast, biomass sourced from in or around Vilnius is less costly than conventional fuel imports�
Supply chain optimisation
Actors managing urban bio waste must be involved in order to reduce fuel costs�
In St Paul, the optimisation of the supply chain maximised the share of biomass sourced from near the urban centre and avoided the cost premium for biomass imported from further away�
Barrier: mismatch between seasonal demand and inflexible supplyAdding storage
Heat storage allows renewable heat generation to be better matched with demand over different time-scales� It is often an integral part of solar systems�
In the Helios project in Graz, heat is buffered on a weekly time scale�In Munich, a seasonal hot water storage tank allows solar heat generated in summer to be used during the colder months�Renewable heat sources integrated into existing CHP plants often benefit from storage capacity (e.g. wind power-to-heat in Aarhus)�
Diversification of demand
A diverse set of customers produces smoother aggre-gate load profiles with a larger baseload component�
Coupling new subsystems to existing networks provides access to a broad range of customers (e.g. solar heat in Munich, heat pumps in Aarhus Ø)�Industrial facilities in particular may require low temperature process heat all year round, which increases the value of renewable heat sources�
Maximise synergies with cooling
In many cases, the heat from renewable sources can be used to provide both heating and cooling services�
An example is the use of solar heat to drive absorption chillers in summer�The water in the district cooling network in Geneva is used for cooling (directly) and heating (through the use of heat pumps) at the same time�
Maximise synergies with electricity infrastructure
For high enthalpy wells, geothermal heat can be used to produce electricity in summer�
There are plans to couple a future geothermal well in Ferrara to an organic Rankine cycle unit to produce electricity in summer�
In Sauerlach near Munich, high enthalpy geothermal heat is used for electricity generation in summer�
Choice of complementa-ry resources
Appropriate combinations of resources mean value of all capacity can be maximised�
In Sauerlach near Munich, this was achieved by combining geothermal heat with flexible CHP plants fuelled by biomass�In Ferrara, geothermal heat was combined with a waste-fired CHP plant�

RENEWABLE ENERGY IN DISTRICT HEATING AND COOLING56
Urban environment and existing network
Lack of space in dense urban environments and operational weaknesses due to suboptimal technical
conditions and poor management in existing networks can obstruct renewables integration in DHC�
Table 9: Urban environment and existing network barriers and opportunities in renewable DHC
Opportunities Rationale and context Evidence from case studies or other literatureBarrier: high space demand for certain renewablesUrban wasteland and obsolete facilities
Within the city core, disused areas and urban wasteland often provide an opportunity to integrate renewables�
An array of ground-mounted solar thermal collectors has been placed on the site of a retired urban landfill in Graz�In St Paul, an old power plant was reused for the installation of a biomass CHP plant�
Existing plants Integration of renewable sources into existing centralised energy infrastructure, notably CHP plants�
In Copenhagen, an electric boiler for power-to-heat generation was incorporated into an existing CHP plant� This has multiple co-benefits, such as existing connections to grids and networks, and auxiliary infrastructure like storage�
Extension of networks
If the network can be extended to the urban periphery, open space becomes available�
In Ferrara, a geothermal well was drilled outside the historic city core and connected to the demand centre through a transmission pipe�
New neighbourhoods
New housing developments offer great design flexibility for integrating renewable energy�
In Munich, large arrays of rooftop solar thermal collectors were incorporated into a high-efficiency housing project and connected to a low temperature network�In Aarhus a new mixed-use neighbourhood is supplied through a heat pump mainly using excess wind�
Opportunities Rationale and context Evidence from case studies or other literature
Barrier: constrained resource availability and lack of resource assessmentsAssessment and disclosure of information
Resource assessments and public disclosure of infor-mation can make a major difference to renewable district energy scheme incubation
The geothermal district energy system in Ferrara significantly benefitted from public information on national geothermal resources�On a local level, collaboration with research institutes has helped lay the foundation for future projects�
Streamline supply
Engagement with relevant actors is key to streamlining biomass supply�
In St Paul, collaboration with waste removal partners to opti-mise the supply chain maximises access to local biomass�
Optimise utilisation
Minimising the water tem-perature in heating networks is crucial to making the best use of renewable resources�
The network return temperature depends on the system’s customers� In Munich, customer engagement programmes have optimised this parameter and raised the yield of geothermal heat�
Barrier: environmental impacts of natural water cooling schemes due to raised effluent temperature Regulations Regulations concerning
water temperature of effluent�
Paris has detailed regulations to limit effluent temperature and both on an absolute level and in terms of difference to the river’s temperature�
Comple-mentary infrastructure
Technical fixes are used in some occasions�
Additional chillers are employed in the cooling system in Bahrain Bay to limit the temperature difference between the effluent and surface seawater�
Demonstra-tion projects
Small-scale projects allow real world impacts to be safely assessed�
The lake water cooling system in Geneva is expanding in several stages, which allows its impact on the local environment to be continuously monitored�

A sector roadmap for REmap 2030 57
Demand
Demand for heating and cooling services drives the installation of distribution infrastructure and generating
capacity� Security of demand is the key factor underlying the economic performance of these assets�
Table 10: Demand barriers and opportunities in renewable DHC
Opportunities Rationale and context Evidence from case studies or other literatureBarrier: reduction of demand in existing networks due to building renovationExpansion and densification
Expansion and densi-fication of the network counteracts reduced demand�
The networks in Munich and Ferrara are greatly expanding, accessing both additional demand and geothermal resources�The centralised heating system at the London Olympic Park was designed with future expansion in mind�
Connection policies
The success in the recruitment of new customers if also deter-mined by connection policies on a national or local scale�
Section 2�3 provides examples of countries with such policies in place�
Barrier: insufficient demand connection in new networks (e.g. Bahrain Bay)Contractual framework
This risk can be minimised by the appropriate choice of contractual frameworks�
In Honolulu, project implementation does not start until customer groups emerge�
Modularity Modular and flexible expansion can counter-act this problem�
Incremental expansion of the lake water cooling system in Geneva�Steady increase of solar share in the Graz system�
Barrier: lack of information on heat/cold demand and trends Demand assessment programmes
Targeted demand assessments of a country or city may help lay the ground for future projects�
A noteworthy example is Amsterdam’s heat mapping initiative (UNEP, 2015a)�
Engagement of research
Capacity building and research engagement can play a key part here�
Opportunities Rationale and context Evidence from case studies or other literatureDetailed assessments
Assess urban heat demand to identify potential close to demand centres�
Some cities (e.g. Amsterdam) have completed studies of local heat demand distributions (UNEP, 2015a)�
Barrier: operational flaws in existing district energy networksCustomer engagement
Network return temperatures strongly depend on the customer-side substation configuration�
In Munich, regulations and incentives were successfully used to lower the network temperature in order to make better use of the local geothermal resources�
Optimisation of new subnetworks
New subsystems can be engineered to fully accept renewables�
In Munich, a new solar-based subsystem was coupled to the city-wide network indirectly to enable the operation at optimised design temperatures�
Refurbishment A major overhaul of the distribution infrastructure is needed in order to reduce the design temperature of outdated systems�
Lack of financing options for network renovation is reported to be a serious problem in former Soviet and Balkan states (Nuorkivi, 2016)�Authorities in Munich decided to expand rather than refurbish the network following a corresponding shift in national subsidies�

RENEWABLE ENERGY IN DISTRICT HEATING AND COOLING58
Policies and regulations
The viability of renewable DHC depends on a broad range of policies either with direct impacts on district
energy or concerning related parts of the energy system�
Table 11: Policy and regulatory barriers and opportunities in renewable DHC
Opportunities Rationale and context Evidence from case studies or other literatureBarrier: unprepared regulatory frameworks and markets Permitting procedures and regulations
Tapping into renewable heat sources may involve major use of public land and resources�
Streamlining application and permitting procedures on a national level can make a significant difference to realising these projects and reduce the risk associated with lengthy bureaucratic procedures�
Scale Operating at a larger scale can help reduce barriers caused by permitting procedures�
The Munich utility SWM obtained rights to draw from geothermal resources across the city�
Acknowledge power-to-heat schemes
Power-to-heat usually lies beyond the current model of electricity markets� These must therefore be adjusted specifical-ly to accommodate it�
In Hohhot, power that is otherwise curtailed is sold directly to the heating system operator�Some countries cannot directly use electricity curtailed because of grid congestion� Hence the electric boilers in Lemgo are primarily used to bid into ancillary markets�
Barrier: insufficient recognition in policies and labelsHolistic emission targets
Holistic emissions reduction tar-gets can stimulate the transition to clean district heating�
Copenhagen: carbon neutrality by 2025�Munich: 100% renewable district heating by the 2040�
Building labels Connecting buildings to district energy networks with partly renewable generation often has no effect on the property energy label�
Appropriate labels can improve perceptions of the benefits of connections (see section 2�3)�
Barrier: strong support for conventional solutions and fossil fuelsReassess subsidies
Reassessing or compensating these policy instruments can increase the share of renewable energy in the market�
5�2 Barriers and opportunities in specific city contexts
DHC systems can be found in cities in all stages of development: from established cities with historic city centres to new holistically planned housing developments emphasising energy efficiency� The type of DHC in these environments is equally varied� It ranges from extensive networks satisfying almost all the heat/cold demand to small systems installed specifically to exploit a local renewable resource� Each of these conditions creates different challenges and requires its own unique approach to making renewable resource use cost-competitive�
State of the urban environment
A distinction is first made between established and growing cities�
Established cities are defined as urban agglomerations of varying size with dense cores� Some include old DHC systems� Demand density is relatively high but open space for constructing facilities with a large footprint may be scarce� Parts of the building stock may be old, which generally creates opportunities for renovation, thereby reducing the density of heating demand� New build is assumed to be limited in these cities�
Growing cities include two different types of urban developments� A new development on the periphery
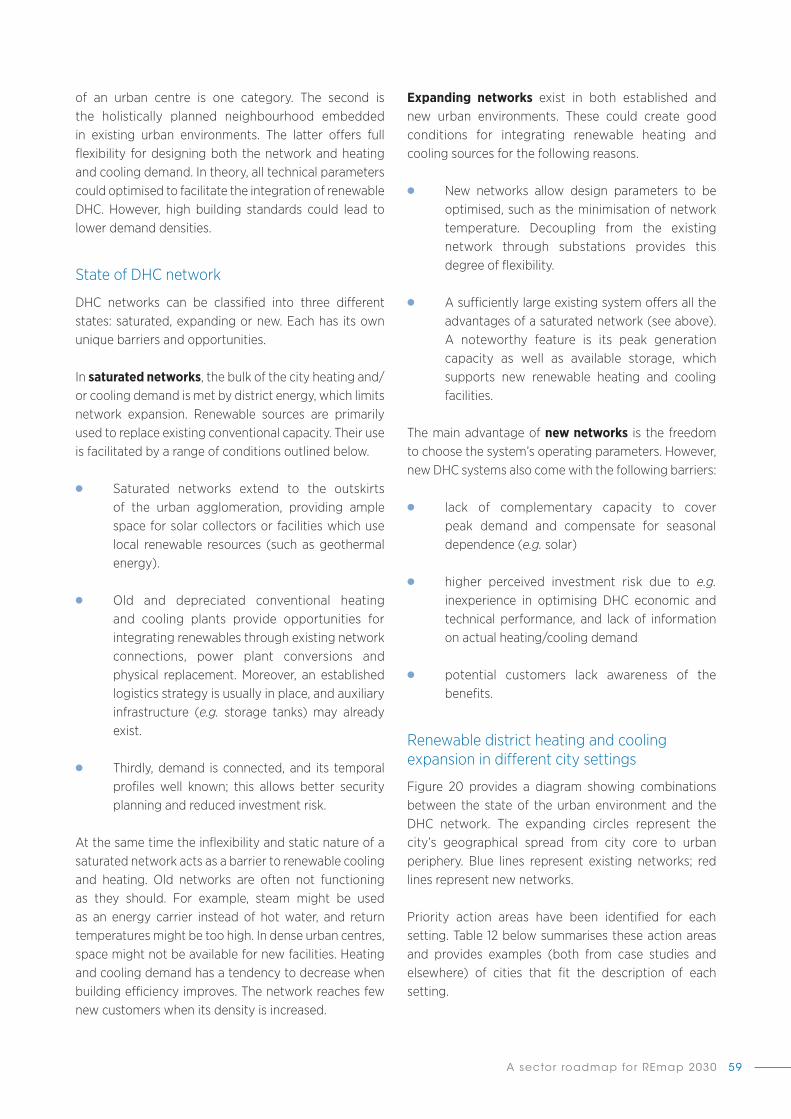
A sector roadmap for REmap 2030 59
of an urban centre is one category� The second is the holistically planned neighbourhood embedded in existing urban environments� The latter offers full flexibility for designing both the network and heating and cooling demand� In theory, all technical parameters could optimised to facilitate the integration of renewable DHC� However, high building standards could lead to lower demand densities�
State of DHC network
DHC networks can be classified into three different states: saturated, expanding or new� Each has its own unique barriers and opportunities�
In saturated networks, the bulk of the city heating and/or cooling demand is met by district energy, which limits network expansion� Renewable sources are primarily used to replace existing conventional capacity� Their use is facilitated by a range of conditions outlined below�
● Saturated networks extend to the outskirts of the urban agglomeration, providing ample space for solar collectors or facilities which use local renewable resources (such as geothermal energy)�
● Old and depreciated conventional heating and cooling plants provide opportunities for integrating renewables through existing network connections, power plant conversions and physical replacement� Moreover, an established logistics strategy is usually in place, and auxiliary infrastructure (e.g. storage tanks) may already exist�
● Thirdly, demand is connected, and its temporal profiles well known; this allows better security planning and reduced investment risk�
At the same time the inflexibility and static nature of a saturated network acts as a barrier to renewable cooling and heating� Old networks are often not functioning as they should� For example, steam might be used as an energy carrier instead of hot water, and return temperatures might be too high� In dense urban centres, space might not be available for new facilities� Heating and cooling demand has a tendency to decrease when building efficiency improves� The network reaches few new customers when its density is increased�
Expanding networks exist in both established and new urban environments� These could create good conditions for integrating renewable heating and cooling sources for the following reasons�
● New networks allow design parameters to be optimised, such as the minimisation of network temperature� Decoupling from the existing network through substations provides this degree of flexibility�
● A sufficiently large existing system offers all the advantages of a saturated network (see above)� A noteworthy feature is its peak generation capacity as well as available storage, which supports new renewable heating and cooling facilities�
The main advantage of new networks is the freedom to choose the system’s operating parameters� However, new DHC systems also come with the following barriers:
● lack of complementary capacity to cover peak demand and compensate for seasonal dependence (e.g. solar)
● higher perceived investment risk due to e.g. inexperience in optimising DHC economic and technical performance, and lack of information on actual heating/cooling demand
● potential customers lack awareness of the benefits�
Renewable district heating and cooling expansion in different city settings
Figure 20 provides a diagram showing combinations between the state of the urban environment and the DHC network� The expanding circles represent the city’s geographical spread from city core to urban periphery� Blue lines represent existing networks; red lines represent new networks�
Priority action areas have been identified for each setting� Table 12 below summarises these action areas and provides examples (both from case studies and elsewhere) of cities that fit the description of each setting�

RENEWABLE ENERGY IN DISTRICT HEATING AND COOLING60
Figure 20: Different types of district energy networks in range of urban environments
Saturated DHC/growing city Expanding DHC/growing city New DHC/growing city
Saturated DHC/established city Expanding DHC/established city New DHC/established city
Table 12: Action areas for different city contexts
Saturated DHC/established cityCase study: Copenhagen; Flensburg
Other examples: Eastern European citiesAction areas
● Renovate and convert: renovate network infrastructure; switch from steam to hot water and reduce water temperatures to facilitate renewables integration� There may be an opportunity to convert existing fossil fuel plants to biomass in a cost-efficient way�
● Densify: the widespread network allows remaining demand to be cost-efficiently connected� Network densification is the main strategy for increasing the load�
● Fill: unused patches within the urban environment allow to implement new renewable heating projects� ● Interconnect: assess the possibility of connecting neighbouring cities together through long transmission
lines (as planned in the Randstad region of the Netherlands, or in North Rhine-Westphalia, Germany)� This allows load diversification, access to potential development sites for renewable heating and cooling sources and access to waste heat sources�
Saturated DHC/growing cityCase studies: Aarhus Ø
Other examples: Tianjin, China (Danish Board of District Heating, 2015)Action areas
● Renovate and convert: despite the additional opportunities for expansion, the existing network still covers the bulk of the connected load� Network renovation and the update of heating and cooling facilities is therefore paramount�
● Expand: growing cities provide additional heating and cooling demand than more static urban environments� New neighbourhoods can be planned holistically and optimised to integrate renewable district energy�
● Decouple: decoupling from the existing network using substations allows new subsystem operations to be appropriately modified for optimal performance�

A sector roadmap for REmap 2030 61
Expanding DHC/established cityCase studies: Ferrara; Paris�
Other examples: Cologne, GermanyAction areas
● Fill: identify synergies with existing plants and synergies with the urban infrastructure to overcome the potential lack of space�
● Decouple: choose different operating parameters for new sections of the network and connect indirectly�Expanding DHC/growing cityCase studies: Munich
Other examples: Dubai, UAE; Beijing, ChinaAction areas
● Expand: establishing district energy while new neighbourhoods are being constructed often allows the optimal integration of renewables�
● Decouple: choose different operating parameters for new sections of the network and connect indirectly� ● Cluster: several district energy systems can be developed in tandem to optimise use of local renewable
energy sources� Connection can be established later e.g. Milan, Italy (UNEP, 2015b)� This can be a viable option if anchor loads are available in new districts�
New DHC/established cityCase studies: Geneva; London (Olympic Park)
Other examples: SingaporeAction areas
● Synergies: exploit multiple services in the facilities to improve economics (district heating + district cooling (lake water in Geneva), district heating + electricity (planned geothermal in Ferrara; geothermal in Sauerlach near Munich); assess the possibility of using existing urban infrastructure to lay the network more cost-effectively (Paris sewage system)�
● Demonstrate: starting with small-scale demonstration projects aiming towards future expansion overcomes or weakens many obstacles related to risk, uncertainty and upfront investment costs� Public buildings can serve as anchor loads�
● Fill: identify suitable urban sites for renewable DHC facilities� ● Expand: even if concerned with only a single urban development project, seek opportunities to expand to
neighbouring demand centres (London Olympic Park)�New DHC/growing cityCase studies: Bahrain
Other examples: Masdar City, Abu Dhabi, UAEAction areas
● Establish: newly built areas provide the opportunity for optimising the scheme, which may make it worth aiming for a high share of district energy at the outset�
● Synergies: exploit the potential for multiple services (e.g. heating and cooling) to improve the business case�

RENEWABLE ENERGY IN DISTRICT HEATING AND COOLING62
It has widely been demonstrated that DHC can be scaled up and has the potential to improve efficiency� However, DHC is very similar to decentralised heating and cooling in that it still largely relies on fossil fuels� The REmap analysis shows that all the countries assessed have significant additional potential for renewable DHC beyond the national energy plan�
In a number of countries, the additional use of renewable DHC is accompanied by net benefits to society mainly from avoided carbon emissions and lower pollution, which reduces health costs� Even without accounting for these externalities, renewable DHC is a cost-competitive option for reducing fossil fuel reliance in many parts of the world�
To scale up renewable DHC several barriers have to be lowered� DHC systems can be fully integrated into the energy system of a particular country but often operate at the city level� To capture the full potential of renewable energy in DHC, both national and city level policy makers have a part to play�
National policy makers have to provide support to facilitate and encourage the adoption of renewable energy in DHC� This includes the measures outlined below�
● Create a level playing field between conventional and renewable heating and cooling options: extensive support for competing fuels like natural gas and electricity forms substantial barriers against the widespread application of renewable district energy schemes� Reducing this support can be the first significant step to inducing change in energy systems�
● Set specific targets for renewable heating and district energy: evidence shows that national targets for renewable district energy are effective when combined with other supportive measures�
● Adjust regulations to allow new renewable heating schemes: targeted regulations are sometimes necessary to connect the load to
the network more easily and to permit novel schemes like power-to-heat�
Next, national policy makers can make more comprehensive reviews of renewable resources and promote demonstration projects for emerging technologies:
● Encourage the implementation of demonstration projects: some existing projects play an important part in raising investor and customer confidence, and in facilitating the more widespread use of a particular approach to renewable district energy� Demonstration projects are an important way to raise awareness and give relevant actors the chance to learn from experience�
● Assess national renewable resource availability: gaining sufficient knowledge of the renewable resources available is essential at the outset� On a national scale, this can be facilitated by national resource assessments and the national disclosure of relevant information�
City-level policy makers should first acquire an understanding of the local renewable resource base, identify heat/cold demand patterns and explore synergies with existing infrastructure:
● Analyse the availability of renewable resources and properties of demand: local renewable resources are key to decarbonising the heating and cooling sector� Project developers need to identify suitable options well before embarking on renewable district energy schemes� This means, for example, evaluating geothermal conditions, water body thermal capacity for cooling or heating, volume and current use of biomass, and space for solar thermal collectors� In addition, good knowledge of heating and cooling demand patterns is essential to assess the viability of renewables and choose the appropriate way to narrow the gap between supply and demand�
6. CONCLUSIONS

A sector roadmap for REmap 2030 63
● Review the existing district energy infrastructure and opportunities to replace the most polluting plants: assess how far the energy system can be steered in a more sustainable direction� If centralised heating or cooling already exists, concentrate on facilities with the potential to replace fossil fuel in heating and cooling generation� Efficiency improvements in the old infrastructure are equally important� Appropriate renewables available locally may justify new networks to replace conventional decentralised facilities�
● Analyse potential synergies with the current energy infrastructure and built environment to minimise district energy investment costs. The existing energy infrastructure and built environment can significantly improve the potential and economics of renewable district energy� Carbon free heating facilities are commonly incorporated into existing sites in an economical way� Similarly, there are abundant opportunities to embed generation and distribution infrastructure into the urban environment� These range from rooftop solar collectors, urban wasteland, sewage pipes and subterranean rail networks to lower the cost of installing district energy networks�
Finally, cities should engage a broad set of stakeholders to scale up renewable DHC in a sustainable and cost-competitive manner:
● Explore the possibility of partnerships with cities or utilities with similar projects to learn from past experience: many renewable district heating projects are in operation around the world serving as examples for cities with reasonably similar conditions� The identification of suitable models and collaboration with relevant stakeholders when undertaking similar schemes is therefore greatly encouraged�
● Cultivate relationships with actors from relevant industries which benefit or facilitate the renewable district energy project: district energy is often entwined with other sectors, such as waste management, the power sector, the petrochemical industry (for geothermal assessments), transport organisations and water utilities� Restructuring the interaction with relevant actors and assessing contact points and potential synergies will make a critical difference to maximising the efficiency of the system�
● Combine projects with research activities: many centralised renewable district energy schemes presented here are unusual as a result of both inexperience and dependence on unique local conditions� Research expertise is the likely source of solutions to these idiosyncrasies�

RENEWABLE ENERGY IN DISTRICT HEATING AND COOLING64
Abu Dhabi Urban Planning Council (2010), “The Pearl rating system for Estidama Community rating system design & construction, Version 1�0”, Abu Dhabi Urban Planning Council, Abu Dhabi, United Arab Emirates, es-tidama.upc.gov.ae/template/estidama/docs/PCRS%20Version%201.0.pdf (accessed on: 24 September 2016)�
AGFW (2015), Energieeffizienzverband für Wärme, Kälte und KWK, „Hauptbericht 2014“, Frankfurt, Germany, www.agfw.de/zahlen-und-statistiken/agfw-hauptbericht/ (accessed on: 24 September 2016)�
Agora Energiewende (2014), “Power-to-Heat zur Integration von ansonsten abgeregeltem Strom aus Erneuerbaren Energien”, study by Fraunhofer Institute for Wind Energy and Energy Systems, (IWES) commissioned by Agora Energiewende, Berlin, Germany, www.agora-energiewende.de/fileadmin/Projekte/2013/power-to-heat/Agora_PtH_Langfassung_WEB.pdf (accessed on: 24 September 2016)�
Al Jandal, S� (2012), “Kuwait’s strategy for energy efficiency and R&D roadmap”, presentation at workshop of United Nations Economic and Social Commission for Western Asia: “Technical & economic aspects for developing energy efficiency (EE) investment projects” and Energy Group Meeting on energy efficiency, Tunis, Tunisia, September 24-26, 2012, css.escwa.org.lb/sdpd/1939/16.pdf (accessed on: 24 September 2016)�
AsiaBiomassOffice (2016), “Japan’s feed-in tariff scheme for renewable energies in FY2015”, New Energy Foundation, Tokyo, Japan, webpage, www.asiabiomass.jp/english/topics/1505_02.html (accessed on: 24 September 2016)�
Asian Development Bank (2014), “Proposed loan: People’s Republic of China: low-carbon district heating project in Hohhot in Inner Mongolia Autonomous Region”, report and recommendation of the President to the Board of Directors, Asian Development Bank, Manila, Philippines, www.adb.org/sites/default/files/project-document/151744/47052-002-rrp.pdf (accessed on: 24 September 2016)�
Asian Development Bank (2016), “Environmental impact assessment: People’s Republic Of China: low-carbon district heating project in Hohhot in Inner Mongolia Autonomous region”, prepared by the Hohhot City Development Investment and Operation Company and the Hohhot Chengfa Heating Company for the Asian Development Bank, Manila, Philippines, April 2016, www.adb.org/sites/default/files/project-document/182506/ 47052-002-eia-3.pdf (accessed on: 24 September 2016)�
AVBFernwärmeV (2010), “Ordinance on general conditions for the supply of district heating”, www.gesetze- im-internet.de/avbfernw_rmev/ (accessed on: 24 September 2016)�
Bahrain Bay (2010), Bahrain Bay Development B�S�C�, “Bahrain Bay Winter 2010 Newsletter”, Manama, Kingdom of Bahrain, doczz.net/doc/3622656/a-new-highlight (accessed on: 10 January 2017)�
BHKW-Infozentrum (2016), „Wie häufig kommen negative Strompreise vor?“, BHKW-Infozentrum GbR, 14 August 2016, webpage, www.bhkw-infozentrum.de/faq-bhkw-kwk/negative-strompreise-wie-haeufig-kommen-negative-strompreise-vor (accessed on: 28 October 2016)�
Schill, R�S� (2010), “Cool, hot and green� District energy St� Paul Inc� relies predominantly on biomass power to heat and cool the majority of downtown St� Paul, Minn� The goal is to replace all fossil fuels in the future”, online article, Biomass Magazine, Grand Forks, ND, US, biomassmagazine.com/articles/1428/cool-hot-and-green (accessed on: 24 September 2016)�
BMWi (2015), Bundesministerium für Wirtschaft und Energie, „Energiedaten: Gesamtausgabe“, Berlin, Germany, webpage, bmwi.de/DE/Themen/Energie/E n e rg i e d a te n - u n d - a n a l ys e n / E n e rg i e d a te n /gesamtausgabe,did=476134.html (accessed on: 24 September 2016)�
BMWi (2015b), Bundesministerium für Wirtschaft und Energie, “Richtlinien zur Förderung von Maßnahmen zur Nutzung erneuerbarer Energien im Wärmemarkt”
REFERENCES
http://www.agora-energiewende.de/fileadmin/Projekte/2013/power-to-heat/Agora_PtH_Langfassung_WEB.pdf

A sector roadmap for REmap 2030 65
(„Guidelines to promote measures for the use of renewable energies in the thermal market“), Bundesanzeiger Verlag GmbH, Cologne, Germany, www.bmwi.de/BMWi/Redaktion/PDF/P-R/richtlinien-zur-foerderung-von-ma_C3_9Fnahmen-zur-nutzung-erneuerbarer-energien-im-waermemarkt,property=pdf,bereich=bmwi2012,sprache=de,rwb=true.pdf (accessed on: 24 September 2016)�
Borås Energi och Miljö (2009), „Our dream – city free from fossil fuels: application – first Global District Energy Climate Awards”, Borås Energi och Miljö, Borås, Sweden, www.districtenergy.org/assets/CDEA/Case-Studies/Boras-Sweden-District-Energy-Climate-Award.pdf (accessed on: 24 September 2016)�
Borås Energi och Miljö (2016), “Ryaverket kraftvärmeverk” („Rya CHP“), Borås Energi och Miljö, Borås, Sweden, webpage, www.borasem.se/webb/o m b o ra s e n e r g i o c h m i l j o /va ra a n l a g g n i n g a r/ryaverketiboras.4.3e4533f2154149006c875471.html (accessed on: 24 September 2016)�
Boute, A� (2012), “Promoting renewable energy through capacity markets: an analysis of the Russian support scheme”, Energy Policy, Vol� 46, July 2012, pp� 68–77, dx.doi.org/10.1016/j.enpol.2012.03.026.
Brasier, J� (2013), “Réseau thermique du centre ville de Genève et de la zone aéroportuaire par l’utilisation de l’eau du Léman” („Thermal network of the city center of Geneva and the airport area by the use of the water of Lake Geneva“), presentation, Chauffage à Distance et de Proximité en Suisse, 12th conference, 24 January 2013, www.fernwaerme-schweiz.ch/fernwaerme-deutsch-wAssets/docs/Fernwaermeforum/Fachtagung-12/Praes_Jean_Brasier_24012013_f.pdf (accessed on: 24 September 2016)�
Bundesamt für Energie (2015), “Swiss Federal Office of Energy: feed-in remuneration at cost”, webpage, www.b f e .a d m i n .c h / t h e m e n / 0 0 61 2 / 0 2 07 3 / i n d ex .html?lang=en# (accessed on: 24 September 2016)�
Bundesamt für Energie (2016), „Schweizerische Gesamtenergiestatistik 2015“ („Swiss total energy statistics 2015“), table, www.bfe.admin.ch/t h e m e n /0 0 52 6 /0 0 5 41 /0 0 5 4 2 /0 0 63 1 / i n d ex .html?lang=de&dossier_id=05071# (accessed on: 24 September 2016)�
Bundesregierung Deutschland (2013), „Deutschlands Zukunft gestalten; Koalitionsvertrag zwischen CDU, CSU und SPD“(“Shaping Germany’s future; Coalition Agreement between CDU, CSU and SPD”), Berlin, Germany, www.bundesregierung.de/Content/DE/_Anlagen/2013/2013-12-17-koalitionsvertrag.pdf?__blob=publicationFile (accessed on: 24 September 2016)�
bz Basel (2014), “Binningen will Einwohner zum Kauf von Fernwärme zwingen” („Binningen wants to force residents to purchase district heating“), online article, Basel, Switzerland, 4 May 2014, www.bzbasel.ch/basel/baselbiet/binningen-will-einwohner-zum-kauf-von-fernwaerme-zwingen-127940581 (accessed on: 24 September 2016)�
CE Delft (2015), “Potential for power-to-heat in the Netherlands”, study commissioned by TenneT Holding B�V�, Delft, the Netherlands, www.cedelft.eu/?go=home.downloadPub&id=1730&file=CE_Delft_3E04_Potential_for_P2H_in_Netherlands_DEF.pdf (accessed on: 24 September 2016)�
CEEQUAL Ltd� (2013), “Olympic Park: DHC network”, Watford, UK, webpage, www.ceequal.com/case-studies/olympic-park-district-heating-and-cooling-network/ (accessed on: 24 September 2016)�
Central Statistical Office of Poland (2014), “Municipal infrastructure in 2013”, stat.gov.pl/download/gfx/portalinformacyjny/en/defaultaktualnosci/3309/1/11/1/municipal_infrastructure_2013.pdf (accessed on: 24 September 2016)�
Choromanski, P� et al. (2009), “Current state of heating and cooling markets in Poland”, a report prepared as part of the Intelligent Energy Europe Programme (IEE) project “Policy development for improving RES-H/C penetration in European Member States (RES-H Policy)”, March 2009, www.res-h-policy.eu/RES-H_Policy_Market-Report-PL_(D3)_english.pdf (accessed on: 24 September 2016)�
City of Aarhus (2016),”Seawater for home heating – project: heat pump in the Port of Aarhus”, Department of Technical Services and Environment, webpage, www.a a r h u s . d k / s i t e c o r e / c o n t e n t / S u b s i t e s /gogreenwithaarhus/Home/Projekter/Havvand-skal-varme-huse-op.aspx?sc_lang=en (accessed on: 24 September 2016)�

RENEWABLE ENERGY IN DISTRICT HEATING AND COOLING66
City of Copenhagen (2015), “Copenhagen Climate Projects annual report 2015”, Copenhagen, Denmark, kk.sites.itera.dk/apps/kk_pub2/pdf/1437_jKjlNNQ38N.pdf (accessed on: 24 September 2016)�
Climespace (2016), “Climespace”, Paris, France, webpage, www.climespace.fr/ (accessed on: 24 September 2016)�
ConstructionWeekOnline�com (2012),”Kuwait warming to district cooling, officials say”, ITP Digital Media Inc�, Dubai, UAE, 2 April 2012, online article, www.constructionweekonline.com/article-16251-kuwait-warming-to-district-cooling-officials-say/ (accessed on: 24 September 2016)�
Cooper, L� and Rajkovich, N� (2012), “An evaluation of district energy systems in North America: lessons learned from four heating dominated cities in the U�S� and Canada”, 2012 ACEEE (American Council for an Energy-Efficient Economy) Summer Study on Energy Efficiency in Buildings, Pacific Grove, US, aceee.org/files/proceedings/2012/data/papers/0193-000354.pdf (accessed on: 24 September 2016)�
COWI (2015),”District heating from cold seawater in Aarhus, Denmark”, COWI A/S, Kongens Lyngby, Denmark, webpage, www.cowi.com/menu/project/industryandenergy/energy/district-heating-from-cold-seawater-in-aarhus (accessed on: 24 September 2016)�
Valentinas, R� (2014), “UAB Vilniaus Energija, Biomass unit in Vilnius CHP-2”, presentation of impact study of the EU Renewable Energy Directive, study visit Lithuania, Vilnius, 15 May 2014, www.eesc.europa.eu/resources/docs/biomass-faci l ity-in-vi lnius---en_web.ppt (accessed on: 24 September 2016)�
Danish Energy Agency (2013), “Technology data for energy plants, Individual heating plants and energy transport”, Danish Energy Agency, Copenhagen, ens.dk/sites/ens.dk/files/Analyser/old_technology_data_for_individual_heating_plants_and_energy_transport_aug2016.pdf (accessed on: 11 January 2017)�
Danish Energy Agency (2014), “Annual energy statistics 2013”, Danish Energy Agency, Copenhagen, https://ens.dk/en/our-services/statistics-data-key-figures-and-energy-maps/annual-and-monthly-statistics (accessed on: 23 March 2016)�
Danish Energy Agency (2015), “Regulation and planning of district heating in Denmark”, Danish Energy Agency, Copenhagen, stateofgreen.com/files/download/1973 (accessed on: 24 September 2016)�
Danish Energy Agency (2016a), “Technology data for energy plants, generation of electricity and district heating, energy storage and energy carrier generation and conversion”, Danish Energy Agency, Copenhagen, h t t p s : //e n s .d k /s i t e s /e n s .d k /fi l e s /A n a l y s e r/teknologikatalog_august_2016_08082016.pdf (accessed on: 11 January 2017)�
Danish Energy Agency (2016b), “Memo on the Danish support scheme for electricity generation based on renewables and other environmentally benign electricity production”, Danish Energy Agency, Copenhagen, https://ens.dk/sites/ens.dk/files/Bioenergi/memo_on_the_danish_support_scheme_for_electr icity_generation_based_on_re.pdf (accessed on: 11 January 2017)�
Dansk Fjernvarme (2014), “District heating benchmarking statistics”, Dansk Fjernvarme, Kolding, Denmark, www.danskfjernvarme.dk/~/media/danskfjernvarme/videnom/aarstatistik/19112014%20benchmarking%202014%20nogletal%20til%20web%20-%202.xlsx (accessed on: 24 September 2016)�
DBDH (2015), “Danish Board of District Heating, Tianjin delegation visits DBDH”, Danish Board of District Heating, Frederiksberg, Denmark, webpage, dbdh.dk/tianjin-delegation-visits-dbdh/ (accessed on: 20 December 2016)�
DESP (2016), “2015 annual report: connecting St Paul”, District Energy St Paul, St Paul, MN, US, www.districtenergy.com/wp-content/uploads/2016/02/Annual-Report-2015-print.pdf (accessed on: 24 September 2016)�
Dettli, R� et al. (2009), „Ausgestaltung einer Einspeisevergütung für erneuerbare Wärme“ („Design of a feed-in tariff for renewable heat“), study commissioned by the Swiss Federal Office of Energy, Bern, Switzerland, www.econcept.ch/uploads/media/893_sb.pdf (accessed on: 24 September 2016)�
DONG Energy (2015a), “Studstrup Power Station reaches milestone in conversion project”, webpage, www.dongenergy.com/en/media/newsroom/news/
http://www.constructionweekonline.com/article-16251-kuwait-warming-to-district-cooling-officials-say
http://www.constructionweekonline.com/article-16251-kuwait-warming-to-district-cooling-officials-say

A sector roadmap for REmap 2030 67
articles/studstrup-power-station-reaches-milestone-in-conversion-project (accessed on: 24 September 2016)�
DONG Energy (2015b),”Electric boilers make energy greener in Aarhus”, webpage, www.dongenergy.com/en/media/newsroom/news/articles/electric-boilers-make-energy-greener-in-aarhus (accessed on: 24 September 2016)�
Dyrelund, A� et al. (2010), “Varmeplan Danmark 2010” (“Heat Plan Denmark 2010”), Aalborg University, Aalborg, Denmark, vbn.aau.dk/ws/files/39039849/Varmeplan_Danmark_2010_Resume.pdf (accessed on: 24 September 2016)�
European Centre for Medium-Range Weather Forecasts (2011), “The ERA-Interim reanalysis: configuration and performance of the data assimilation system”, Quarterly Journal of the Royal Meteorological Society, Vol� 137, Issue 656 (2011), pp� 553-597, dx.doi.org/10.1002/qj.828�
Ecoheat4eu (2011), “Local success stories Sweden”, Euroheat & Power, webpage, ecoheat4.eu/en/Country-by-country-db/Sweden/Local-Success-Stories/ (accessed on: 24 September 2016)�
EEG (2015), “EEG 2015 – German Renewable Energy Sources Act”, www.gesetze-im-internet.de/eeg_2014/BJNR106610014.html (accessed on: 24 September 2016)�
EEWärmeG (2015), “EEWärmeG – German Renewable Energies Heat Act”, www.gesetze-im-internet.de/eew_rmeg/BJNR165800008.html (accessed on: 24 September 2016)�
EIA (2014), “Country analysis brief: Kuwait”, US Energy Information Administration, Washington, D�C�, US, www.eia.gov/beta/international/analysis_includes/countries_long/Kuwait/kuwait.pdf (accessed on: 24 September 2016)�
EIA AEO (2016), “EIA Annual Energy Outlook 2016 with Projections to 2040”, US Energy Information Administration, Washington, D�C�, US, www.eia.gov/forecasts/aeo/ (accessed on:24 September 2016)�
Energie Graz (2016a), „Wärmebereitstellung für die fernwärmeversorgten Objekte im Großraum Graz: Statusbericht 2016“ („Heat supply for the district heating facilities in the Graz area: Status report 2016“), Graz,
Austria, www.graz.at/cms/dokumente/10267850_1618648/56beeee3/W%C3%A4rmebereitstellung%20f%C3%BCr%20die%20fernw%C3%A4rmeversorgten %20Objekte%20im%20Gro%C3%9Fraum%20Graz_Statusbericht%202016_160503.pdf (accessed on: 24 September 2016)�
Energie Graz (2016b), “Was ist Fernwärme? Wie funktioniert sie?”(„What is district heating? How does it work? „), Energie Graz, Austria, webpage, www.energie-graz.at/energie/fernwaerme/dienstleistungen/was-ist-fernwaerme-wie-funktioniert-sie (accessed on: 24 September 2016)�
Energieatlas Bayern (2010), “Energieatlas Bayern Praxisbeispiele – Energieversorgungssystem ‘Solare Nahwärme am Ackermannbogen’” („Energieatlas Bayern Practical Examples – Power Supply System ‘Solar Local Heat at the Ackermannbogen’“), Bayerisches Staatsministerium für Wirtschaft und Medien, Energie und Technologie, Munich, Germany, webpage, www.energieatlas.bayern.de/energieatlas/praxisbeispiele/details,197.html (accessed on: 24 September 2016)�
ENNEREG (2013), “Conversion of natural gas boiler-house to biomass, Garliava, Kaunas Region, Lithuania”, Regions paving the way for a Sustainable Energy Europe, regions202020.eu/cms/assets/Uploads/Resources/130430-LEI-RES-Biofuel-Garliava.pdf (accessed on: 24 September 2016)�
Euroheat & Power (2013), “District heating and cooling – country by country – 2013 Survey”, Brussels, Belgium, www.euroheat.org/publications/country-country-2013/.
Euroheat & Power (2015), “District heating and cooling – country by country – 2015 Survey”, Brussels, Belgium, www.euroheat.org/publications/country-country-2015/.
European Commission (2016), “Proposal for a Directive of the European Parliament and of the Council on the promotion of the use of energy from renewable sources (recast)”, European Commission, Brussels, Belgium, ec.europa.eu/energy/sites/ener/files/documents/1_en_act_part1_v7_1.pdf (accessed on: 16 December 2016)�
European Commission (2016b), “Commission proposes new rules for consumer centred clean energy transition”, European Commission, Brussels, Belgium, webpage, (accessed on: 9 January 2017)�
RENEWABLE ENERGY IN DISTRICT HEATING AND COOLING68
European Union (2012), “Directive 2012/27/EU of the European Parliament and of the Council of 25 October 2012 on energy efficiency”, eur-lex.europa.eu/legal-content/en/TXT/?uri=celex%3A32012L0027 (accessed on: 24 September 2016)�
Ever-Green Energy (2016), “St Paul co-generation efficiency through CHP”, Ever-Green Energy, St� Paul, US, webpage, www.ever-greenenergy.com/project/st-paul-co-generation/ (accessed on: 24 September 2016)�
Faessler, J� et al. (2012), „Valorisation thermique des eaux profondes lacustres: le réseau genevois GLN et quelques considérations générales sur ces systèmes” („Thermal valorization of deep lake water: the Geneva network GLN and some general considerations on these systems“), Archives des Sciences, 2012, Vol� 65, pp� 215-228, archive-ouverte�unige�ch/unige:28925�
Flensburger Tageblatt (2014), “Stadtwerke Flensburg: Düsenantrieb für die Fernwärme” („City Flensburg: nozzle drive for district heating“), sh:z Schleswig-Holsteinischer Zeitungsverlag, Flensburg, Germany, www.shz.de/lokales/flensburger-tageblatt/duesenantrieb- fuer-die-fernwaerme-id8485006.html (accessed on: 24 September 2016)�
Gadd, H� and Werner, S� (2014), “Achieving low return temperatures from district heating substations”, Applied Energy, Vol� 136, 31 December 2014, pp� 59–67, dx�doi�org/10.1016/j.apenergy.2014.09.022.
GeoDH (2015), “Italy, geothermal district heating systems of the municipality of Ferrara”, European Geothermal Energy Council, Brussels, Belgium, geodh.eu/wp-content/uploads/2015/01/IT_Ferrara_GeoDH.pdf (accessed on: 24 September 2016)�
GEothermie2020 (2016), “GEothermie2020 – le programme”, Geneva, Switzerland, webpage, www.geothermie2020.ch/ (accessed on: 24 September 2016)�
University of North Dakota (2016), The Global Heat Flow Database, International Heat Flow Commission of the International Association of Seismology and Physics of the Earth’s Interior; University of North Dakota, US, www.heatflow.und.edu/ (accessed on: 24 September 2016)�
Government of Dubai (2010), “Green building regulations & specifications”, Government of Dubai, Dubai Electricity
& Water Authority, and Dubai Municipality, www.dm.gov.ae/wps/wcm/connect/662c2fc7-03b4-41a5-aad0-c9d1959773a3/Green+Building+Regulations+and+ Speci.pdf?MOD=AJPERES (accessed on: 11 January 2017)�
Gruppo Hera (2013), “Progetto polo energie rinnovabili: per conoscere i motivi della proposta di sviluppo della geotermia a ferrara” (“Project pole renewable energies: to know the reasons for the proposed development of geothermal energy in ferrara”), Gruppo Hera, Bologna, Italy, www.comune.fe.it/attach/superuser/docs/25_07_faqdefgeotetmia_terzoincontro.pdf (accessed on: 3 January 2017)�
Gruppo Hera (2015), “A Ferrara un teleriscaldamento sempre più ‘green’“ („In Ferrara, a growing district heating ‘green’“), Gruppo Hera, Bologna, Italy, webpage, www.gruppohera.it/gruppo/attivita_servisi/business_energia/canale_teleriscaldamento/innovazione/teleriscaldamento_green_fe/ (accessed on: 24 September 2016)�
Gruppo Hera (2015b), “2015 sustainability report”, Gruppo Hera, Bologna, Italy, eng.gruppohera.it/binary/hr_gruppo/download_center/Susta inabi l i ty_report_2015.1461755057.pdf (accessed on: 24 September 2016)�
Hartmann, C� (2013), “Energiewende als Chance – Flexibilisierung im Heizkraftwerk Flensburg” (“Energiewende as an opportunity – Flexibility at the Flensburg heating plant”), Stadtwerke Flensburg, Germany, www.kiwi-kiel.de/fileadmin/user_upload/Presse/PDFs/2013/2013-02-26_Branchenfokus_Hartmann.pdf (accessed on: 3 November 2016)�
HOFOR (2013), „Varmen i København fremtidssikret: HOFOR køber Amagerværket“(„ The heat in Copenhagen for the future: københavns belysningsvæsen buy Amagerværket“), press release, Hofor, Copenhagen, Denmark, www.hofor.dk/pressemeddelse/varmen-i-kobenhavn-fremtidssikret-hofor-kober-amagervaerket/ (accessed on: 24 September 2016)�
HOFOR (2015), „Amagerværket“, HOFOR, Copenhagen, Denmark, website, www.hofor.dk/amagervaerket/vaerket/ (accessed on: 24 September 2016)�
http://www.kiwi-kiel.de/fileadmin/user_upload/Presse/PDFs/2013/2013-02-26_Branchenfokus_Hartmann.pdf
http://www.kiwi-kiel.de/fileadmin/user_upload/Presse/PDFs/2013/2013-02-26_Branchenfokus_Hartmann.pdf
A sector roadmap for REmap 2030 69
Holter C� et al. (2004),„Solaranlagen im Geschoßwohnbau“ („Solar systems in storey apartments“), Arbeitsgemeinschaft Erneuerbare Energie, Gleisdorf, Austria, www.aee.at/aee/index.php?opt ion=com_content&v iew=ar t i c le& id= 448&Itemid=113 (accessed on: 2 November 2016)�
Honolulu Seawater Air Conditioning (2011), “District cooling: Hawaii’s solution and cooling alternative to imported fossil fuels”, Honolulu Seawater Air Conditioning, Honolulu, HI, US, honoluluswac.com/_assets/_pdfs/HSWAC-BrochureNew.pdf (accessed on: 24 September 2016)�
IDEA (2007), “District energy St� Paul – achieving energy independence”, International District Energy Association, Westborough, MA, US, www.districtenergy.org/assets/CDEA/Case-Studies/StPaulDistrict-Energy6-27-07.pdf (accessed on: 24 September 2016)�
IEA (2011), “Energy policies of IEA countries: Poland – 2011 review”, International Energy Agency/OECD, Paris, France, www.iea.org/publications/freepublications/publication/poland2011_web.pdf (accessed on: 24 September 2016)�
IEA (2013), “The IEA CHP and DHC collaborative: CHP/DHC country scorecard: Japan”, IEA/OECD, Paris, France, www.iea.org/publications/insights/insightpublications/IEAJapanScorecardMASTERFINAL draft_060913_AF.pdf (accessed on: 24 September 2016)�
IEA (2014), “The IEA CHP and DHC collaborative: CHP/DHC country scorecard: US”� IEA/OECD, Paris, France, www.iea.org/publications/insights/insightpublications/US_CountryScorecard_FINAL.pdf (accessed on: 24 September 2016)�
IEA (2015a), “Building energy use in China – transforming construction and influencing consumption to 2050”, IEA/OECD, Paris, France and Tsinghua University, Beijing, China, www.iea.org/publications/freepublications/publication/PARTNERCOUNTRY SERIESBuildingEnergy_WEB_FINAL.pdf (accessed on: 1 December 2016)�
IEA (2015b), “Energy efficiency market report 2015: market trends and medium-term prospects”, IEA/OECD, Paris, France, www.iea.org/publications/freepublications/publication/MediumTermEnergyefficie
ncyMarketReport2015-148x199.pdf (accessed on: 1 December 2016)�
IEA (2015c), “World Energy Balances 2015 Edition”, database, IEA/OECD, Paris, France, www.iea.org/statistics/topics/energybalances/ (accessed on: 1 December 2016)�
IEA (2016), “IEA/IRENA Joint Policies and Measures Database: China”, IEA/OECD, Paris, France and International Renewable Energy Agency (IRENA), Abu Dhabi, UAE, www.iea.org/policiesandmeasures/renewableenergy/?country=China (accessed on: 24 September 2016)�
IEA ETSAP (2010), “Technology brief E04: combined heat and power”, IEA Energy Technology Systems Analysis Programme, Paris, France, iea-etsap.org/E-TechDS/PDF/E04-CHP-GS-gct_ADfinal.pdf (accessed on: 18 March 2016)�
IEA SHC (2012),“Singapore – world’s largest solar cooling system up and running”, Solar Update, newsletter of the International Energy Agency Solar Heating and Cooling Programme, Paris, France, www.iea-shc.org/data/sites/1/publications/2012-06-SolarUpdate.pdf (accessed on: 24 September 2016)�
IEA SHC (2016), „Solar heat worldwide, markets and contribution to the energy supply 2014“, AEE Institut für Nachhaltige Technologien (INTEC), Gleisdorf, Austria, and IEA Solar Heating and Cooling Programme, Paris, France, www.iea-shc.org/data/sites/1/publications/Solar-Heat-Worldwide-2016.pdf (accessed on: 10 January 2017)�
IEA (2015), “World energy outlook 2015”, IEA/OECD, Paris, France�
IFEU (2013), „Best Practice Beispiele EE in Fernwärme“ („Best Practice Examples EE in District Heating“), Institut für Energie- und Umweltforschung, Heidelberg, Germany, www.ifeu.de/energie/pdf/Best-Practice-Beispiele_EE_in_Fernwaerme.pdf (accessed on: 24 September 2016)�
Ingeniøren (2014), “Avedøreværket kan nu køre med fuld kraft på træpiller” („Avedøreværket can now run at full power on wood pellets“), Copenhagen, Denmark, ing.dk/artikel/avedoerevaerket-kan-nu-koere-med-

RENEWABLE ENERGY IN DISTRICT HEATING AND COOLING70
fuld-kraft-paa-traepiller-171839 (accessed on: 24 September 2016)�
International Finance Corporation (2014),”Unlocking the potential for private sector participation in district heating”, Washington, DC, US, www.ifc.org/wps/wcm/connect/8fb84a00496e1a08a2c9f2cda2aea2d1/WB+IFC+Private+Sector_web.pdf?MOD=AJPERES (accessed on: 24 September 2016)�
Interreg (2015), “Good Practices Database”, Interreg Europe, Lille, France, www.interreg4c.eu/good-practices/index-page=2&.html (accessed on: 24 September 2016)�
IRENA (2014), “Global bioenergy supply and demand projections: a working paper for REmap 2030”, IRENA, Abu Dhabi, United Arab Emirates, www.irena.org/REMAP/IRENA_REmap_2030_Biomass_paper_2014.pdf.
IRENA (2015a), “REmap 2030 renewable energy prospects for Germany”, IRENA, Abu Dhabi, United Arab Emirates, www.irena.org/DocumentDownloads/Publications/IRENA_REmap_Germany_report_2015.pdf.
IRENA (2015b), “REmap 2030 renewable energy prospects for Poland”� IRENA, Abu Dhabi, United Arab Emirates, www.irena.org/DocumentDownloads/Publications/IRENA_REmap_Poland_paper_2015_ EN.pdf.
IRENA (2016), “REmap: roadmap for a renewable energy future, 2016 edition”, IRENA, Abu Dhabi, United Arab Emirates, www.irena.org/DocumentDownloads/Publications/IRENA_REmap_2016_edition_report.pdf.
JHSBA (2016), “District Heating and Cooling in Japan”, Japan Heat Supply Business Association, Tokyo, Japan, webpage, www.jdhc.or.jp/english/number-of-service-districts/(accessed on: 24 September 2016).
Kainou, K� (2014), “Detailed general energy statistics Japan 2014”, www.enecho.meti.go.jp/statistics/total_energy/xls/stte_2014b.xlsx (accessed on: 24 September 2016)�
Kanton Bern (2016), „Bau-, Verkehrs- und Energiedirektion Kanton Bern, Förderprogramm Energie, Wärmenetze mit erneuerbarer Energie“
(„Building, Transport and Energy Directorate of the Canton of Berne, Energy Promotion Program, Heat Exchangers with Renewable Energy“), webpage, www.b v e . b e .c h / b v e /d e / i n d ex /e n e r g i e /e n e r g i e /foerderprogramm_energie/anlagen/waermenetze.html (accessed on: 11 January 2017)�
Kirchner, A� et al. (2012), “Energy perspectives 2050 Switzerland”, Prognos, Basel, Switzerland, study commissioned by the Swiss Federal Office for Energy, Bern, Switzerland, www.bfe.admin.ch/themen/00526/ 00527/06431/index.html?lang=en (accessed on: 24 September 2016)�
KPMG (2009), “Central and Eastern European district heating outlook”, KPMG Energy & Utilities Centre of Excellence Team, Budapest, Hungary, www.kpmg.com/SK/en/IssuesAndInsights/ArticlesPublications/Publicationseries/Documents/Central%20and%20Eastern%20European%20District%20Heating%20Outlook.pdf (accessed on: 24 September 2016)�
Kraftwirte (2014), “Professionelle Kraft-Wärme-Kopplung (KWK) aus Lemgo” („Professional combined heat and power (CHP) from Lemgo“), Lemgo, Germany, www.kraftwirte.de/wp-content/uploads/2012/08/kraftwirte_referenzblatt_stadtwerke_lemgo.pdf (accessed on: 24 September 2016)�
Kuwait Environment Public Authority (2012), “Kuwait’s initial national communications under the United Nations Framework Convention on Climate Change”, Salwa, Kuwait, unfccc.int/resource/docs/natc/kwtnc1.pdf (accessed on: 24 September 2016)�
Kuwait Times (2014), “Kuwait ponders district cooling systems”, Kuwait Times, 12 November 2014, news.kuwaittimes.net/pdf/2014/nov/12/p04.pdf (accessed on: 24 September 2016)�
Kuwait University (2016), “Sabah Al-Salem Kuwait University City: infrastructure”, webpage, ssuc.ku.edu.kw/en/sabah-al-salem-university-city/infrastructure.html?project=11 (accessed on: 3 November 2016)�
KWKG (2016), “KWKG – German Combined Heat and Power Act”, www.gesetze-im-internet.de/kwkg_2016/BJNR249810015.html (accessed on: 24 September 2016)�

A sector roadmap for REmap 2030 71
Landesregierung Steiermark (2015), „Veröffentlichung einer Ad-hoc-Beihilfe gemäß Artikel 9Z1 in Verbindung mit Anhang III der Verordnung (EU) Nr� 651/2014“ („Publication of an ad hoc aid pursuant to Article 9Z1 in conjunction with Annex III to Regulation (EU) Nr� 651/2014“), Graz, Austria, www.verwaltung.steiermark.at/cms/dokumente/12318076_122517786/792dc6bb/Helios-Ver%C3%B6ffentlichung-Ad-hoc-Beihilfe_SIG.pdf (accessed on: 24 September 2016)�
Liu, D� et al. (2016),”Optimum electric boiler capacity configuration in a regional power grid for a wind power accommodation scenario”, Energies 2016, Vol� 9, 144, dx.doi.org/10.3390/en9030144.
Lund, H� et al. (2014), “4th generation district heating (4GDH): integrating smart thermal grids into future sustainable energy systems”, Energy, Vol� 68, pp� 1-11, dx.doi.org/10.1016/j.energy.2014.02.089.
Lychuk, T� et al. (2012), “Analysis of the Russian market for building energy efficiency (No� PNNL-22110)”, Pacific Northwest National Laboratory, Alexandria, VA, US, www.pnnl.gov/main/publications/external/technical_reports/PNNL-22110.pdf.
Mairie de Paris (2007), “Paris Climate Protection Plan”, Paris, France, www.energy-cities.eu/IMG/pdf/Paris_climate_protection_plan_2007.pdf (accessed on: 24 September 2016)�
Makai (2015), “SWAC – an introduction to seawater air conditioning”, Makai Ocean Engineering, Kailua, HI, US, www.makai.com/brochures/Makai%20Seawater%20Air%20Conditioning%20Brochure%202015_9_17.pdf (accessed on: 24 September 2016)�
McDonald, K� (2013),”District energy delivery models – the concession approach”, Cofely GDF Suez, Paris, France, docplayer.net/11034045-Olympic-park-stratford-energy-schemes-marketing-kevin-mcdonald-district-energy-delivery-models-the-concession-approach.html (accessed on: 24 September 2016)�
McElroy, C� (2014), “Site visit: Bahrain Bay district cooling plant”, ConstructionWeekOnline�com, ITP Digital Media Inc�, Dubai, UAE, 9 April 2014, www.construction weekonline.com/article-27495-site-visit-bahrain-bay-district-cooling-plant/ (accessed on: 24 September 2016)�
METI (2014), “Strategic Energy Plan”, Ministry of Economy, Trade and Industry, Tokyo, Japan, www.enecho.meti.go.jp/en/category/others/basic_plan/pdf/4th_strategic_energy_plan.pdf (accessed on: 24 September 2016)�
NASA Solar (2016), NASA Langley Research Center Atmospheric Science Data Center Surface Meteorological and Solar Energy, web portal supported by the NASA LaRC POWER Project, eosweb.larc.nasa.gov/sse/ (accessed on: 24 September 2016)�
National Bureau of Statistics of China (2016), “China statistical yearbook 2015”, Beijing, China, www.stats.gov.cn/tjsj/ndsj/2015/indexeh.htm (accessed on: 24 September 2016)�
Navigant Consulting and Leidos (2014), “Technology forecast updates – residential and commercial building technologies – reference case”, report prepared for the US EIA, Washington DC, US, www.eia.gov/analysis/studies/buildings/equipcosts/pdf/appendix-a.pdf (accessed on: 24 September 2016)�
Nuorkivi, A� (2016), “District heating and cooling policies worldwide”, Advanced District Heating and Cooling (DHC) Systems, Woodhead publishing series on energy, Cambridge, UK, dx.doi.org/10.1016/B978-1-78242- 374-4.00002-1.
Nussbaumer, T� (2014a), “Sensitivity of system design on heat distribution costs in district heating”, study prepared for the IEA Bioenergy Task 32, Paris, France, and the Swiss Federal Office of Energy, Bern, Switzerland, ieabcc.nl/publications/IEA_Task32_DHS_Cost_Analysis.pdf (accessed on: 24 September 2016)�
Nussbaumer, T� (2014b), “Status report on district heating systems in IEA countries”, study prepared for the IEA Bioenergy Task 32, Paris, France, and the Swiss Federal Office of Energy, Bern, Switzerland, ieabcc.nl/publications/IEA_Task32_DHS_Status_Report.pdf (accessed on: 24 September 2016)�
Odgaard, O� (2015), “China’s quest for new district heating reforms”, Policy Brief, No� 3, www.thinkchina.ku.dk/documents/2015-12-01ThinkChina_PolicyBrief_district heating_and_CHP_in_China.pdf (accessed on: 24 September 2016)�
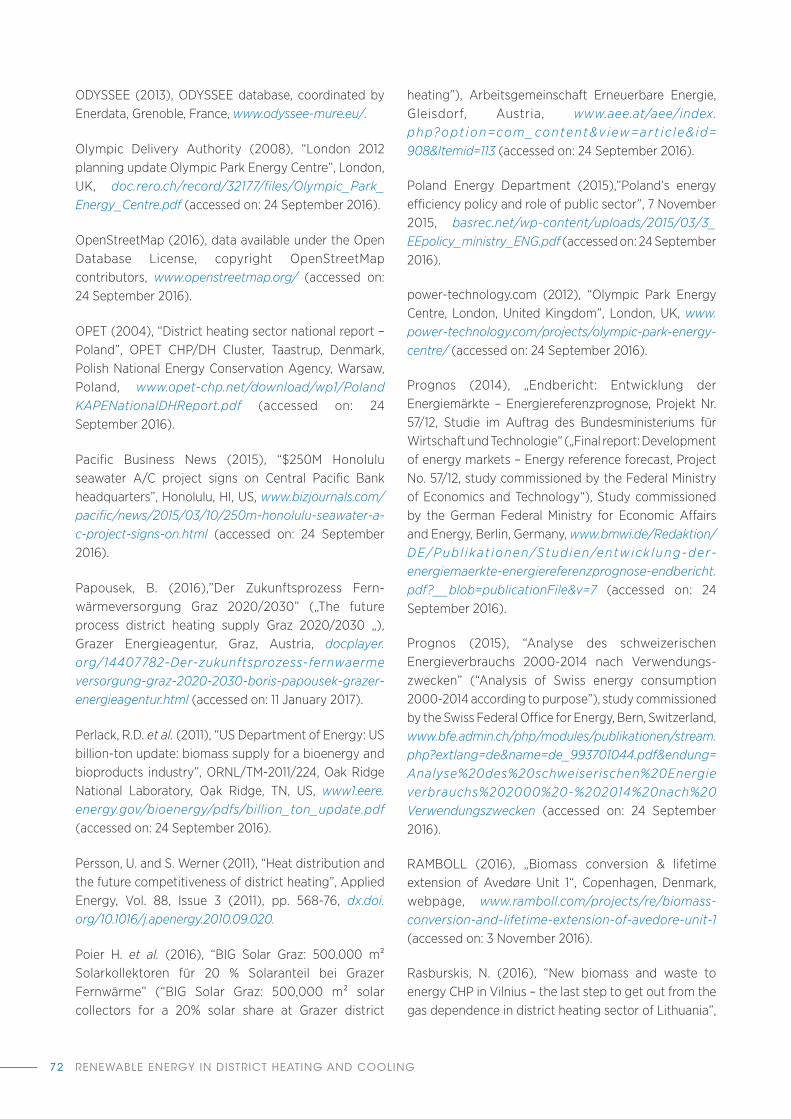
RENEWABLE ENERGY IN DISTRICT HEATING AND COOLING72
ODYSSEE (2013), ODYSSEE database, coordinated by Enerdata, Grenoble, France, www.odyssee-mure.eu/.
Olympic Delivery Authority (2008), “London 2012 planning update Olympic Park Energy Centre”, London, UK, doc.rero.ch/record/32177/files/Olympic_Park_Energy_Centre.pdf (accessed on: 24 September 2016)�
OpenStreetMap (2016), data available under the Open Database License, copyright OpenStreetMap contributors, www.openstreetmap.org/ (accessed on: 24 September 2016)�
OPET (2004), “District heating sector national report – Poland”, OPET CHP/DH Cluster, Taastrup, Denmark, Polish National Energy Conservation Agency, Warsaw, Poland, www.opet-chp.net/download/wp1/Poland KAPENationalDHReport.pdf (accessed on: 24 September 2016)�
Pacific Business News (2015), “$250M Honolulu seawater A/C project signs on Central Pacific Bank headquarters”, Honolulu, HI, US, www.bizjournals.com/pacific/news/2015/03/10/250m-honolulu-seawater-a-c-project-signs-on.html (accessed on: 24 September 2016)�
Papousek, B� (2016),”Der Zukunftsprozess Fern-wärmeversorgung Graz 2020/2030” („The future process district heating supply Graz 2020/2030 „), Grazer Energieagentur, Graz, Austria, docplayer.org/14407782-Der-zukunftsprozess-fernwaerme versorgung-graz-2020-2030-boris-papousek-grazer-energieagentur.html (accessed on: 11 January 2017)�
Perlack, R�D� et al. (2011), “US Department of Energy: US billion-ton update: biomass supply for a bioenergy and bioproducts industry”, ORNL/TM-2011/224, Oak Ridge National Laboratory, Oak Ridge, TN, US, www1.eere.energy.gov/bioenergy/pdfs/billion_ton_update.pdf (accessed on: 24 September 2016)�
Persson, U� and S� Werner (2011), “Heat distribution and the future competitiveness of district heating”, Applied Energy, Vol� 88, Issue 3 (2011), pp� 568-76, dx.doi.org/10.1016/j.apenergy.2010.09.020.
Poier H� et al. (2016), “BIG Solar Graz: 500�000 m² Solarkollektoren für 20 % Solaranteil bei Grazer Fernwärme” (“BIG Solar Graz: 500,000 m² solar collectors for a 20% solar share at Grazer district
heating”), Arbeitsgemeinschaft Erneuerbare Energie, Gleisdorf, Austria, www.aee.at/aee/index.php?opt ion=com_content&v iew=ar t i c le& id= 908&Itemid=113 (accessed on: 24 September 2016)�
Poland Energy Department (2015),”Poland’s energy efficiency policy and role of public sector”, 7 November 2015, basrec.net/wp-content/uploads/2015/03/3_EEpolicy_ministry_ENG.pdf (accessed on: 24 September 2016)�
power-technology�com (2012), “Olympic Park Energy Centre, London, United Kingdom”, London, UK, www.power-technology.com/projects/olympic-park-energy-centre/ (accessed on: 24 September 2016)�
Prognos (2014), „Endbericht: Entwicklung der Energiemärkte – Energiereferenzprognose, Projekt Nr� 57/12, Studie im Auftrag des Bundesministeriums für Wirtschaft und Technologie“ („Final report: Development of energy markets – Energy reference forecast, Project No� 57/12, study commissioned by the Federal Ministry of Economics and Technology“), Study commissioned by the German Federal Ministry for Economic Affairs and Energy, Berlin, Germany, www.bmwi.de/Redaktion/DE/Publ ikat ionen/Studien/entwick lung-der-energiemaerkte-energiereferenzprognose-endbericht.pdf?__blob=publicationFile&v=7 (accessed on: 24 September 2016)�
Prognos (2015), “Analyse des schweizerischen Energieverbrauchs 2000-2014 nach Verwendungs-zwecken” (“Analysis of Swiss energy consumption 2000-2014 according to purpose”), study commissioned by the Swiss Federal Office for Energy, Bern, Switzerland, www.bfe.admin.ch/php/modules/publikationen/stream.php?extlang=de&name=de_993701044.pdf&endung= Analyse%20des%20schweiserischen%20Energie verbrauchs%202000%20-%202014%20nach%20Verwendungszwecken (accessed on: 24 September 2016)�
RAMBOLL (2016), „Biomass conversion & lifetime extension of Avedøre Unit 1“, Copenhagen, Denmark, webpage, www.ramboll.com/projects/re/biomass-conversion-and-lifetime-extension-of-avedore-unit-1 (accessed on: 3 November 2016)�
Rasburskis, N� (2016), “New biomass and waste to energy CHP in Vilnius – the last step to get out from the gas dependence in district heating sector of Lithuania”,

A sector roadmap for REmap 2030 73
Lietuvos Energija, Vilnius, Lithuania, www.lsta.lt/files/events/2061-04-19_LITBIOMA/7_Rasburskis_Nerijus_NBB16.pdf (accessed on: 24 September 2016)�
Richter, A� (2011), “China to pursue ambitious 5-year geothermal district heating plan”, ThinkGeoEnergy, w w w . t h i n k g e o e n e r g y . c o m /china-to-pursue-ambitious-5-year-geothermal-district-heating-plan/.
Sargsyan, G� and Y� Gorbatenko (2008), “Energy efficiency in Russia : untapped reserves”, working paper, The World Bank, Washington DC, US, www.ifc.org/wps/wcm/connect/de1e58804aababd79797d79e0dc67fc6/I F C + E E + i n + R u s s i a + U n t a p p e d + P o t e n t i a l .pdf?MOD=AJPERES (accessed on: 1 December 2016)�
Solar District Heating (2014), “Solar cooling for Desert Mountain Highschool, USA”, Solar District Heating, Solites Steinbeis Research Institute for Solar and Sustainable Thermal Energy Systems, Stuttgart, Germany, solar-district-heating.eu/NewsEvents/News/tabid/68/ArticleId/381/Solar-cooling-for-Desert-Mountain-Highschool-USA.aspx (accessed on: 24 September 2016)�
Sdralevich, C� et al. (2014), Subsidy Reform in the Middle East and North Africa: Recent Progress and Challenges Ahead, International Monetary Fund, Washington, DC, US, www.imf.org/external/pubs/ft/dp/2014/1403mcd.pdf (accessed on: 24 September 2016)�
SEDAC (2016), “Gridded Population Of The World (GPWv4) and Global Rural-Urban Mapping Project (GRUMPv1)”, Center for International Earth Science Information Network – Columbia University, Palisades, NY, NASA Socioeconomic Data and Applications Center, sedac.ciesin.columbia.edu/(accessed on: 24 September 2016)�
SOLID (2013),”Sheikh Zayed Desert Learning Center (SZDLC), VAE”, S�O�L�I�D� Gesellschaft für Solarinstallation und Design mbH, Graz, Austria, webpage, www.solid.at/en/news-archive/2013/153-sheikh-zayed-desert-learning-center-szdlc-vae-en/ (accessed on: 24 September 2016)�
SOLID (2014), „Desert Mountain High School (DMHS), Arizona, USA“, S�O�L�I�D� Gesellschaft für Solarinstallation und Design mbH, Graz, Austria, solid.at/images/pdf/ref_e_DMHS.pdf (accessed on: 24 September 2016)�
SOLID (2015), “SAC system Desert Mountain High School”, S�O�L�I�D� Gesellschaft für Solarinstallation und Design mbH, Graz, Austria, task48.iea-shc.org/Data/Sites/6/documents/events/meeting-08/2015_03_24_schubert_t48dmhs.pdf (accessed on: 24 September 2016)�
SOLID (2016a),”Large solar thermal energy systems for cooling and heating”, IEA Committee on Energy Research and Technology, Experts’ Group on R&D Priority-Setting and Evaluation, Paris, France, www.iea.org/media/workshops/2016/egrdspacecooling/11.HaraldBlazek.pdf (accessed on: 24 September 2016)�
SOLID (2016b), “BIG Solar Graz: Solare Fernwärme in der Stadt 500�000 m² für 20% Solaranteil”, www.aee-intec.at/0uploads/dateien1178.pdf (accessed on: 24 September 2016)�
SOLID (2016c), „Reference project – district heating/CENTRAL“, S�O�L�I�D� Gesellschaft für Solarinstallation und Design mbH, Graz, Austria, www.solid.at/images/pdf/District_heating_english.pdf (accessed on: 2 November 2016)�
Seidler, D� (2015), “Graz: Mekka der Großen Solarwärme” („Graz: Mecca of the Great Solar Heat“), Sonnenenergie, Offizielles Fachorgan der Deutschen Gesellschaft für Sonnenenergie e�V�, Berlin, Germany, February 2015, www.sonnenenergie.de/sonnenenergie-redaktion/SE-2015-02/Layout-fertig/PDF/Einzelartikel/SE-2015-02-s022-Solarthermie-Graz_Mekka_der_grossen_Solarwaerme.pdf (accessed on: 24 September 2016)�
Stadt Zürich (2016), “Replacement of natural gas – frequently asked questions”, webpage, www.stadt-zuerich.ch/gud/de/index/umwelt/energie/ersatz-erdgas-in-zuerich-nord/haeufige-fragen.html (accessed on: 24 September 2016)�
stadt+werk (2013), “Stadtwerke Lemgo: Erste Bilanz bei Power to Heat” („City Lemgo: First record at Power to Heat“), K21 media AG, Tübingen, Germany, 20 February 2013, www.stadt-und-werk.de/meldung_15400_Erste+Bilanz+bei+Power+to+Heat.html (accessed on: 24 September 2016)�
Stadtwerke Flensburg (2016), “Fernwärme” („District heating“), webpage, www.stadtwerke-flensburg.de/fernwaerme.html (accessed on: 24 September 2016)�

RENEWABLE ENERGY IN DISTRICT HEATING AND COOLING74
Stasiunas, V� (2009), “Biomass district heating in Lithuania”, presentation at European Biomass Association (AEBIOM) workshop “Biomass for District Heating and Cooling”, June 22, Brussels, Belgium, www.lsta.lt/files/seminarai/090622_AEBIOM/9%20V%20Stasiunas_090622.pdf (accessed on: 3 January 2016)�
State of Green (2015), “District heating in the Copenhagen region”, webpage, stateofgreen.com/en/profiles/ramboll/solutions/district-heating-in-the-copenhagen-region (accessed on: 24 September 2016)�
State of Hawaii (2002), “Seawater district cooling feasibility analysis for the State of Hawaii”, Department of Business, Economic Development & Tourism; Energy, Resources, and Technology Division, State of Hawaii, US, www.districtenergy.org/assets/pdfs/03Innovative-Energy-Systems-Workshop-Honolulu/swac-full-report.pdf (accessed on: 24 September 2016)�
Strategy& (2012), “Unlocking the potential of district cooling� The need for GCC governments to take action”, Dubai, UAE, www.strategyand.pwc.com/media/file/Unlocking-the-potential-of-district-cooling.pdf (accessed on: 24 September 2016)�
Süddeutsche Zeitung (2010), „Fernwärme in München, Abschied vom ‘Jahrhundertprojekt” („District heating in Munich, saying goodbye to the ‘century project“), Süddeutsche Zeitung, Munich, Germany, 17 May 2010, www.sueddeutsche.de/muenchen/fernwaerme-in-muenchen-abschied-vom-jahrhundertprojekt-1.148746 (accessed on: 24 September 2016)�
Südwest Presse Online (2013), “Biomassekraftwerk II der FUG läuft rund” („Biomass power station II of the FUG is running around“), Südwest Presse Online, Ulm, Germany, 4 April 2013� www.swp.de/ulm/lokales/ulm_neu_ulm/Biomassekraftwerk-II-der-FUG-laeuft-rund; art4329,1930270 (accessed on: 24 September 2016)�
SWM (2015), “Fernwärme und Rücklauftemperatur in modernen Niedertemperaturnetzen” („District heating and return temperature in modern low-temperature networks“), Stadtwerke München, Munich, Germany, www.swm.de/dam/jcr:7821c04d-9a95-44bf-9edb-2792c8c89f28/broschuere-fernwaerme-ruecklauf temperatur.pdf (accessed on: 24 September 2016)�
SWM (2015b), „Öko-Wärme für München Bohrarbeiten für die Geothermieanlage in Freiham gestartet“
(„Eco-heat for Munich Drilling work for the geothermal plant in Freiham started“), Stadtwerke München, Munich, Germany, www.swm.de/dam/jcr:35c92720-fb2b-4055-be52-a772d494dc14/versorgung20150929-bohrstart-geothermie-freiham.pdf (accessed on: 24 September 2016)�
SWM (2016), „Geothermieanlage Schäftlarnstraße: SWM bauen Energie-Standort HKW Süd aus“( „Geothermal plant Schäftlarnstraße: SWM is expanding the HKW Süd energy site„), Stadtwerke München, Munich, Germany, www.swm.de/dam/swm/pressemitteilungen/2016/07/swm20160716-energiestandort-hkw-sued.pdf (accessed on: 24 September 2016)�
Tellus (2016), “Tellus sedimentary basins of the world map”, Robertson (a CGG company), Massy, France, edx�netl�doe�gov/dataset/tellus-sedimentary-basins-of-the-world-map (accessed on: 24 September 2016)�
Thalmann, S� et al. (2013), „Analyse und Optimierung von Fernwärmenetzen: Ist-Analysie von Fernwärmenetzen und Bewertungs-Tool zur Netzoptimierung“(„ Analysis and optimization of district heating networks: actual analysis of district heating networks and assessment tool for network optimization“), commissioned by the Swiss Federal Office for Energy, Bern, Switzerland, www.bfe.admin.ch/php/modules/publikationen/stream.php?extlang= de&name=de_11477087.pdf&endung=Analyse%20und%20Optimierung%20von%20Fernw%E4rmenetzen; %20Ist-Analyse%20von%20Fernw%E4rmenetzen%20und%20Bewertungs-Tool%20zur%20Netz-Optimierung (accessed on: 24 September 2016)�
The Baltic Course (2014), “New biofuel boiler-house in Vilnius expected to cheapen heat cost by 22%”, 3 March 2014, online article, www.baltic-course.com/eng/good_for_business/?doc=88440 (accessed on: 24 September 2016)�
United Arab Emirates Ministry of Energy (2015), “UAE state of energy report 2015”, United Arab Emirates Ministry of Energy, Abu Dhabi, UAE, dcce.ae/wp-content/uploads/2015/06/SOER_2015_BOOK_draft7_171114_pp_V2_LOW1.pdf (accessed on: 24 September 2016)�
UNDP (2014), “State of energy report – Dubai 2014”, United Nations Development Programme (UNDP), New York City, NY, US, www.undp.org/content/dam/rbas/

A sector roadmap for REmap 2030 75
doc/Energy%20and%20Environment/The%20State%20of%20Dubai’s%20Energy%20and%20Its%20Path%20to%20Green%20Economy.pdf (accessed on: 24 September 2016)�
UNEP (2015a), “District energy in cities: unlocking the potential of energy efficiency and renewable energy”, United Nations Environment Programme (UNEP), Nairobi, Kenya, www.unep.org/energy/portals/50177/DES_District_Energy_Report_full_02_d.pdf (accessed on: 24 September 2016)�
UNEP (2015b), “District energy in cities: Milan case study”, United Nations Environment Programme (UNEP), Nairobi, Kenya, unep.org/energy/portals/50177/Documents/MILAN-CASE-STUDY.pdf (accessed on: 24 September 2016)�
USGS (2013), “Preliminary Catalog of the Sedimentary Basins of the US”, US Geological Survey, pubs.usgs.gov/of/2012/1111/ (accessed on: 24 September 2016)�
Vattenfall (2013), “Amagervaerket, Vattenfalls Kraftwerke” (“Amagervaerket, Vattenfalls Power plants”), webpage, web.archive.org/web/ 20130528141423/kraftwerke.vattenfall.de/powerplant/amagervaerket-0 (accessed on: 24 September 2016)�
Viquerat, P� A� (2012), „Utilisation des réseaux d’eau lacustre profonde pour la climatisation et le chauffage des bâtiments; bilan énergétique et impacts environnementaux: Etude de cas: le projet GLN (Genève-Lac-Nations) à Genève“( „Use of deep lake water systems for air conditioning and heating of buildings; Energy balance and environmental impacts: Case study: the GLN project Geneva“), PhD thesis, archive-ouverte�unige�ch/unige:23016�
Veolia Middle East (2016), “An innovative solution to help Bahrain Bay to keep its cool”, webpage, www.
veolia.com/middleeast/our-services/achievements/municipalities/creative-solutions/bahrain-bay-bahrain (accessed on: 24 September 2016)�
Windpower Monthly (2013), “Analysis – Chinese wind curtailments double in 2012”, Windpower Monthly, 26 February 2013, www.windpowermonthly.com/article/1171987/analysis---chinese-wind-curtailments-double-2012 (accessed on: 24 September 2016)�
World Bank (2001), “Lithuania Vilnius district heating project, project appraisal document on a proposed loan”, World Bank, Washington DC, US, documents.worldbank.org/curated/en/785701468757001491/pdf/multi0page.pdf (accessed on: 24 September 2016)�
World Bank (2011), “ICP 2011: international comparison program”, World Bank, Washington, DC, US, siteresources.worldbank.org/ICPEXT/Resources/ICP_2011.html (accessed on: 24 September 2016)�
Xiong et al. (2015), “Heat roadmap China: new heat strategy to reduce energy consumption towards 2030”, Energy, Vol� 81, 1 March 2015, pp� 274-285, dx.doi.org/10.1016/j.energy.2014.12.039.
ZAE Bayern (2010), „Begleitforschung: solare Nahwärme am Ackermannbogen in München, Abschlussbericht („Accompanying research: solar district heating at Ackermannbogen in Munich, final report“)“, Munich, Germany, dx.doi.org/10.2314/GBV:667638997 (accessed on: 24 September 2016)�
Zhang et al. (2015), “Comparison of district heating systems used in China and Denmark”, International Journal of Sustainable and Green Energy, Vol� 4, Issue 3, May 2015, pp� 102-116, http://article.sciencepublishin ggroup.com/pdf/10.11648.j.ijrse.20150403.15.pdf.

RENEWABLE ENERGY IN DISTRICT HEATING AND COOLING76
This study is based on two complementary approaches�
● First, it analyses the existing district energy sector and its potential evolution in nine countries� It visualises two alternative scenarios for the future progress of the district energy sector in these countries�
● Secondly, it assesses a variety of successful renewable district energy projects to sift out the relevant barriers and opportunities arising from this approach�
The countries were selected because they illustrate a range of approaches to district energy on the basis of different climates and infrastructure history�
● In China, district energy represents 7% of the heating market� Centralised heating has experienced strong linear expansion during the last few decades� The system is heavily based on coal and suffers from inefficiencies�
● In Denmark, district heating as a proportion of total heat demand has now climbed to very high levels� Major efforts are under way to decarbonise the systems, which stimulates innovative schemes, such as solar district heating and the large-scale conversion of coal-fired plants to biomass�
● In Germany and Switzerland, district energy is well established and has now penetrated deep into the city infrastructure� On a national scale, however, the contribution to the heat market is fairly low at 9% and 6% respectively�
● Poland has relied intensively on district heating in the past� While half the heat supply consists of centralised generation, the outdated infrastructure needs modernising� This is also the main focus of national district energy policies�
● In Japan, district energy covers a fairly low amount of heating (0�4%) and cooling (3�6%)� District networks are mainly used in commercial buildings�
● The US makes minor use of district energy (6% heating, 3�8% cooling) in a broad range of environments� This includes campuses and other groups of commercial buildings, as well as larger cities�
● In the UAE, district cooling is very established and now accounts for 23% of the market� Policy makers have set targets for future expansion�
● Kuwait has not yet made documented use of centralised cooling�
Current status
The choice of either heating, cooling or both depends on existing use of centralised energy as well as the climatic conditions� The current state is assessed on the basis of information gathered from national statistics and meta-analysis of district energy� This includes information on current policies related to district energy in the countries selected�
Cost
The assessment of fixed and running costs and parameters now and in 2030 is based on cost data from a variety of sources� A broad range of technologies is covered in the Danish Energy Agency’s report “Technology Data for Energy Plants” (Danish Energy Agency, 2016a) as well as in the report “Technology Forecast Updates – Residential and Commercial Building Technologies – Reference Case” prepared for the US Energy Information Administration (Navigant Consulting, 2014)� Levelised cost distribution for every technology and country considered was calculated from a range of input parameters using a Monte Carlo approach�
ANNEXESANNEX 1: APPROACH AND METHODS

A sector roadmap for REmap 2030 77
There are stark differences in the cost of labour and materials in each country� Relative price levels are derived from purchasing power parities provided by the World Bank International Comparison Program (World Bank, 2011), which includes the categories “construction” (labour) and “machinery and equipment” (see figure 21)�
The load factor relates annual energy consumption to peak demand and has a fundamental impact on the economics of the system� It was calculated from the average temperature in each country weighted by local heating and cooling demand� For this purpose, weather data from the ERA-Interim dataset of the European Centre for Medium-Range Weather Forecasts (ECMWF, 2011) was used2011� This was combined with the population data in the Gridded Population of the World (GPW) and Global Rural-Urban Mapping Project (GRUMP) datasets published by the Socioeconomic Data and Applications Center (SEDAC, 2016)�
The diameter-dependent cost of district heating pipes was taken from Nussbaumer et al. (2014a) and weighted appropriately to reflect the diameter distribution for typical systems (Persson et al., 2011)� This cost depends heavily on whether the network pipes are laid in an existing urban environment or as part of a new development� The average of these costs was thus calculated using appropriate weighting factors
dependent on each country’s typical usage of district energy systems, as well as its rate of urbanisation�
Heat production from solar collectors is by its very nature dependent on seasonal factors, and this requires a specific approach to cost assessment: Most output occurs in summer, so a matching factor was necessary to handle differences between solar heat production and heating demand profiles� This was calculated from solar data (ECMWF, 2011) and the individual country’s heat demand profile� In addition, it considers the installation of seasonal hot water storage tanks, which makes solar heat dispatchable, albeit with a cost premium�
Demand and capacity development
Projections of the long-term evolution in district energy use and heating and cooling demand were gathered primarily from national energy plans�
The existing heating and cooling plants connected to district energy systems are assumed to be decommissioned at the end of their technical lifetime, thus allowing new capacity to enter the market� Forced retirements are not considered� The retired capacities are calculated according to average age of currently installed facilities and typical technical lifetime� It is assumed that some types of plants are replaced by
Figure 21: Relative cost of labour and materials in 2011*
0
0,2
0,4
0,6
0,8
1
1,2
1,4
1,6
China Denmark Germany Poland Switzerland Japan US Kuwait UAE
Rel
ativ
e co
st
Labour Material
* US = 1
Source: IRENA estimates based on World Bank (2011)

RENEWABLE ENERGY IN DISTRICT HEATING AND COOLING78
equivalent capacity either because they are fuelled by renewables or because of their relevance in the waste management sector�
Resource availability
Renewable resource availability is assessed on the basis of GIS data� First, a heating and cooling demand map is created based on the national distribution of the population in each country (Socioeconomic Data and Applications Center, 2016) and weighted by heating and cooling degree days (European Centre for Medium-Range Weather Forecasts, 2011)� Starting from this distribution, potentially accessible resources are worked out in places where demand density is high enough to justify DHC networks�
Geothermal heat
For geothermal heat, the resource consists of an underground heat flow reported in the Global Heat Flow Database (2016)� The geographically dispersed data points in this database were interpolated onto a grid� The presence of geological basins serves as a proxy for estimating the accessibility of this resource� Corresponding datasets are available from the Tellus Sedimentary Basins of the World Map (Tellus, 2016) as well as the catalogue of the Sedimentary Basins of the US (USGS, 2013)� While abundant amounts of geothermal heat are available on the national scale, the accessibility of this resource is constrained by the limited geographical reach of urban centres� Total potential was obtained by aggregating heat flow at locations where heat demand density is highest and in places where district heating systems are expected to operate� The networks are thus treated as enabling technologies required to access geothermal heat� In addition, heat flow within a certain radius of the appropriate sites was included in the resource potential�
The potential geothermal share (potential divided by DH demand) of district heating range between 16% in China and 161% in Switzerland (see Annex 3)� These estimates are rather conservative: in reality the resource quality is an important factor driving geothermal district system implementation� Hence, these are more likely to be installed wherever the geothermal resource quality is at its highest�
Natural water coolingThe potential of free cooling from a natural water body is estimated by analysing the proximity of demand centres to rivers, lakes and the coastline� The vector data describing the coastline is retrieved from OpenStreetMap (2016)� The assessment only includes the largest lakes and rivers� Therefore, the limitations imposed by the finite heat capacity of a water body and hence its potential impact on local ecosystems is ignored� It is assumed that any cooling demand sufficiently close to the water can be satisfied�
The selection of potential locations that could be covered by natural water cooling is similar to the selection of geothermal potential� Since the networks give access to the resource, only sites that might be covered by a network according to forecast district cooling penetration are considered�
Cities and hence sites with the highest cooling demand density are generally close to a natural water body� This suggests relatively high potential for this technology, which could cover between 43% (UAE) and 100% (Japan/Kuwait) of district cooling demand�
Solar heating and cooling
In district energy systems, solar irradiation can be put to use in numerous ways for both heating and cooling� Three different options are considered here�
Solar district heating through non-concentrating collectors is assumed to have a typical efficiency of 0�6 for converting radiation energy to heat fed into the grid�
Solar cooling systems consist of solar collectors whose heat output is used to drive an absorption heat pump� These systems can either be driven by low temperature heat (provided by flat plate or evacuated tube collectors) or by high temperature heat (e.g. from parabolic trough collectors)� This determines the type of absorption heat pump used� Single effect chillers can operate with inlet temperatures of 75°C-90°C� However, their coefficient of performance is limited to around 0�6-0�7� If parabolic trough collectors are used to generate higher temperatures of 120°C-160°C, double effect chillers can be employed to provide cooling with a coefficient of performance of 1�2-1�5�

A sector roadmap for REmap 2030 79
In locations with high demand density, it is assumed that 1% of the ground area is available for solar collectors� The same assumption is made for 3% the surrounding area up to a radius of 10 km� A packing factor of 42% is used to express the relationship between the projected collector aperture area and the total occupied ground area� Finally, the collector area is converted to heat and cooling potential using the appropriate solar radiation data (NASA Solar, 2016)�
Using these assumptions, this resource could cover between 32% of district heating demand in China and 496% in Japan�
Biomass
The biomass supply potential is based on previous national assessments� For more details on the methodology and findings see IRENA (2014)�

RENEWABLE ENERGY IN DISTRICT HEATING AND COOLING80
Heat losses are influenced by the intensity of network utilisation (expressed through linear heat density i.e. heat consumed in a single year per unit of distribution pipe length) and the quality of the infrastructure� Danish planners have relied extensively on district heating networks and installed them even in regions with low
ANNEX 2: TECHNICAL PROPERTIES OF DISTRICT ENERGY SYSTEMS
Table 13: Typical technical and operational parameters of district heating systems in countries selected
Unit China Denmark Germany Poland Switzerland Japan USWater tempera-ture supply
°C 115-130 66-115 90-130 130-135 45-110 mainly steam networks
mainly steam networks
Water tempera-ture return
°C 50-80 38-67 30-60 65-70 35-60 mainly steam networks
mainly steam networks
Informa-tion on steam networks
- 15.6% of heat; decreasing since 2010; all new networks based on water
parts of Copen-hagen system operate on steam; there are plans to convert them
10.8% of heat from steam
many old (>35 years) systems in process of renewal
no detailed information; general trend is change to from steam to hot water
majority of systems use steam (up to 170°C)
98.5% of heat from steam
Network heat losses
- 20%-50% 19�8% 13% average 12�4% average 12% low low
Linear heat density
GJ/m per year
17.6 1.2-5 2.34-11.7 12.7 3.6-11.4 34.1 (both district
heating and cooling)
107.0
Network age
volumes more than doubled since the year 2000� Rapid expansion and fairly new networks
average age approx� 24 years; maximum 54
many networks date back to German Democratic Republic (pre-Ger-man reuni-fication); reduction in use in the eastern states, dynamic expansion in the west
long (70-year) history in urban centres; significant modernisa-tion efforts
near-con-stant growth in heat supply since 1980s
most networks built around 1990; the first built around 1970 with a surge after 1985
major expansion induced by 1970s energy crisis; also old systems (19th century)�
Sources: China: Odgaard (2015), National Bureau of Statistics of China (2016); Denmark: Gadd et al. (2014), Danish Energy Agency (2014), Dansk Fjernvarme (2014); Germany: AFGWAFGW (2015); Poland: Euroheat & Power (2015), OPET (2004), Choromanski et al. (2009); Switzerland: Thalmann et al. (2013), Dettli et al. (2009), Bundesamt für Energie (2016); Japan: JHSBA (2016); US: Cooper et al. (2012); multiple countries: Zhang et al. (2015), Nussbaumer (2014b), Euroheat & Power (2013)
demand density� This is reflected in its linear heat densities, which are the lowest of all the countries selected� Hence the country’s progressive move toward low temperature networks also mean they suffer from high heat losses� By contrast, parts of the Chinese district heating infrastructure are in urgent

A sector roadmap for REmap 2030 81
need of maintenance, which is another reason for low distribution efficiency�
The values of linear heat densities (annual distributed heat divided by total network length) vary greatly among each country� Typical values are 10-20 GJ/m per year� The extremes are represented by Denmark at the low end, and Japan and the US at the high end� The US value amounts to 107 GJ/m per year based on reported total district energy demand and total network length� Aggregate information on district energy in the US is scarce� However, it is realistic to assume it has very high heat density because district heating is used on campuses as well as governmental and commercial sites�
The use of steam in DH systems causes greater losses and safety concerns and is generally considered outdated� In many countries, efforts are under way to
modify the existing steam systems and convert them to hot water (Lund et al., 2014)� Consequently, steam plays only a minor role as a heat carrier in the majority of the countries studied� New systems rely exclusively on hot water, with the exception of Japan and the US�
Average linear cooling densities were calculated from the aggregate length of the district cooling systems and the annual load reported� The high values in table 14 are due to the predominance of the commercial sector� This is characterised by the availability of load anchors, and often features holistically designed integrated heating and cooling systems for groups of buildings�
Thermal storage facilities are included in many of the cases described by Japan’s heat supply business association (JHSBA, 2016)� The storage power capacity reported for the US is 62% of total centralised cooling capacity�
Table 14: Typical technical and operational parameters of district cooling systems in countries selected
Unit Japan US Kuwait UAELinear energy density
GJ/m per year
34.1 (2011)
149.3 (2011)
- 487 (2015)
Available DC storage
- part of many of the systems reported by the
JHSBA
10 100 MW - no detailed information;
specific regulations
Age of existing networks
- most networks built around 1990;
the first around 1970 with a surge
after 1985
- - -
Sources: Japan: JHSBA (2016); US: Euroheat & Power (2013); UAE: UNEP (2015a), IRENA

RENEWABLE ENERGY IN DISTRICT HEATING AND COOLING82
ANNEX 3: AVAILABILITY OF RESOURCES
Table 15: Availability of resources*
Unit China Den-mark
Ger-many
Po-land
Switzer-land
Japan US Kuwait UAE
Biomass
PJ 11 956 101 825 594 79 594 15 289% of total heating/cooling demand
339% 81% 235% 116% 378% 5 791% 2 961%
Geo-thermal
PJ 580 84 61 289 34 12 87% of total heating/cooling demand
16% 67% 35% 56% 161% 121% 17%
Solar heating
PJ 1 138 450 470 902 58 51 385% of total heating/cooling demand
32% 360% 67% 176% 274% 496% 75%
Solar cooling
PJ 17 573 24 500% of total heating/cooling demand
126% 402% 26% 132%
Water cooling
PJ 15 101 99 263% of total heating/cooling demand
100% 59% 100% 43%
*The percentage value shows the renewable resource as a fraction of district heating/cooling demand.

A sector roadmap for REmap 2030 83
ANNEX 4: FUEL COSTS
Figure 22: Fuel cost and remuneration for electricity produced in 2015 and 2030
-10
0
10
20
30
40
50
CN DK
DE PL CH JP
USA CN DK
DE PL CH JP
USA CN DK
DE PL CH JP
USA CN DK
DE PL CH JP
USA CN DK
DE PL CH JP
USA
Heating oil Steam coal General biomass Fuelwood Municipal waste
Fuel
cos
t [U
SD/G
J]
2015 2030
2015 2030
2015 2030
0
20
40
60
80
100
120
CN DK
DE PL CH JP
USA KW
UA
E
CN DK
DE PL CH JP
USA KW
UA
E
CN DK
DE PL CH JP
USA KW
UA
E
CN DK
DE PL CH JP
USA KW
UA
E
Electricity (households) Electricity (industry) Natural gas (households) Natural gas (industry)
Fuel
cos
t [U
SD/G
J]
0,00
0,13
0,26
0,40
CN DK
DE PL CH JP
USA CN DK
DE PL CH JP
USA CN DK
DE PL CH JP
USA CN DK
DE PL CH JP
USA CN DK
DE PL CH JP
USA CN DK
DE PL CH JP
USA
Biomass CHP Biomass co-combustion
CHP
Waste CHP Coal CHP Natural gas CHP Micro-CHP
Rem
uner
atio
n el
ectr
icity
[U
SD/k
Wh]

RENEWABLE ENERGY IN DISTRICT HEATING AND COOLING84
ANNEX 5: DETAILED COMPOSITION OF REmap, STRUCTURAL SHIFT AND LEVELISED COSTS OF HEATING AND COOLING PER COUNTRY
China
Table 16: Composition of REmap and Structural Shift scenarios in China
Final district energy demand
(PJ/year)Substitution cost
(USD/GJ)REmap 2030 New coal CHP plants 550�9 -New electric boilers 91�8 -New large-scale absorption heat pumps 18�4 -New large-scale electric heat pumps 45�9 -New natural gas CHP plants 211�2 -Old coal plants 1 671�4 -Old gas plants 103�4 -New large-scale solar collectors 148�5 -3�9New large-scale solar collectors with seasonal storage 131�3 -2�7New geothermal wells 250�3 -1�9New biomass boilers, residues from agriculture 12�6 -1�8New biomass boilers, energy crops 11�2 -2�6New biomass boilers, wood fuel 2�2 6�1New biomass boilers, residues from forestry 0�7 13�4New biomass CHP plants, energy crops 26�2 41�2New biomass CHP plants, residues from agriculture 29�4 42�0New biomass CHP plants, wood fuel 5�1 49�9New biomass CHP plants, residues from forestry 1�6 57�2New biomass in converted coal boilers, wood fuel 218�0 2�1Total/weighted total 3 530.2 2.0Additions, Structural Shift 2030New large-scale solar collectors 148�5 3�5New large-scale solar collectors with seasonal storage 131�3 4�7New geothermal wells 125�1 5�6New biomass boilers, residues from agriculture 38�8 5�6New biomass boilers, energy crops 34�6 4�8New biomass boilers, wood fuel 13�5 13�6New biomass boilers, residues from forestry 4�2 20�8New biomass CHP plants, energy crops 61�0 48�6New biomass CHP plants, residues from agriculture 68�3 49�4New biomass CHP plants, wood fuel 23�9 57�4New biomass CHP plants, residues from forestry 7�4 64�6Total/weighted total 656.6 8.3

A sector roadmap for REmap 2030 85
Figure 23: Levelised cost of heating in China, 2030
-10 0 10 20 30 40 50 60 70 80 90 100 110 120
Electric heat pumps, elevated temp.
Electric heat pumps, ambient temp.
Geothermal, direct use
Electric boilers
Solar district heating, low load match factor
Coal boiler to biomass conversion
Geothermal with absorption heat pumps
Coal CHP
Biogas boilers
Biomass CHP plants
District heating technologies - China
-10 0 10 20 30 40 50 60 70 80 90 100 110 120
Decentralised electric heat pumpsDecentralised electric heating
Decentralised sorption heat pumpsDecentralised coal heatingDecentralised gas heating
Decentralised biomass heatingDecentralised oil heatingDecentralised micro-CHP
Decentralised solar heating
Decentralised heating technologies - China
Fixed cost Fuel cost Network cost
Levelised cost (USD/GJ)

RENEWABLE ENERGY IN DISTRICT HEATING AND COOLING86
Denmark
Table 17: Composition of REmap and Structural Shift scenarios in Denmark
Final district energy demand
(PJ/year)Substitution cost
(USD/GJ)REmap 2030 New electric boilers 11�7 -New large-scale electric heat pumps 11�7 -Old biomass plants 44�3 -Old electric boilers and heat pumps 0�4 -Old geothermal wells 0�1 -Old municipal waste plants 8�4 -Old solar collectors 0�4 -Old waste heat 1�8 -New large-scale solar collectors 0�9 1�8New large-scale solar collectors with seasonal storage 15�6 1�9New geothermal wells 7�6 -1�7New biomass CHP plants, biowaste 5�3 -5�4New biomass in converted coal CHP plants, residues from forestry
8�5 1�0
New biomass in converted coal CHP plants, wood fuel 8�5 2�1Total/weighted total 125.1 0.3Additions, Structural Shift 2030New large-scale solar collectors with seasonal storage 3�9 33�0New geothermal wells 1�3 29�4New biomass boilers, residues from agriculture 0�2 33�7New biomass boilers, wood fuel 0�1 33�7New biomass boilers, residues from forestry 0�1 32�6New biomass CHP plants, residues from agriculture 0�3 67�6New biomass CHP plants, wood fuel 0�2 67�6New biomass CHP plants, residues from forestry 0�2 66�5Total/weighted total 6.3 4.6

A sector roadmap for REmap 2030 87
Figure 24: Levelised cost of heating in Denmark, 2030
Fixed cost Fuel cost Network cost
-10 0 10 20 30 40 50 60 70 80 90 100 110 120
Biowaste CHP
Gas-fired absorption heat pumps
Solar district heating, high load match factor
Coal boiler to biomass conversion
Gas boilers
Solar district heating, low load match factor
Geothermal with absorption heat pumps
Coal CHP
Natural gas CHP
Biomass CHP plants
Levelised cost (USD/GJ)
District heating technologies - Denmark
-10 0 10 20 30 40 50 60 70 80 90 100 110 120
Decentralised biomass heatingDecentralised coal heating
Decentralised sorption heat pumpsDecentralised electric heat pumps
Decentralised micro-CHPDecentralised gas heatingDecentralised oil heating
Decentralised electric heatingDecentralised solar heating
Decentralised heating technologies - Denmark
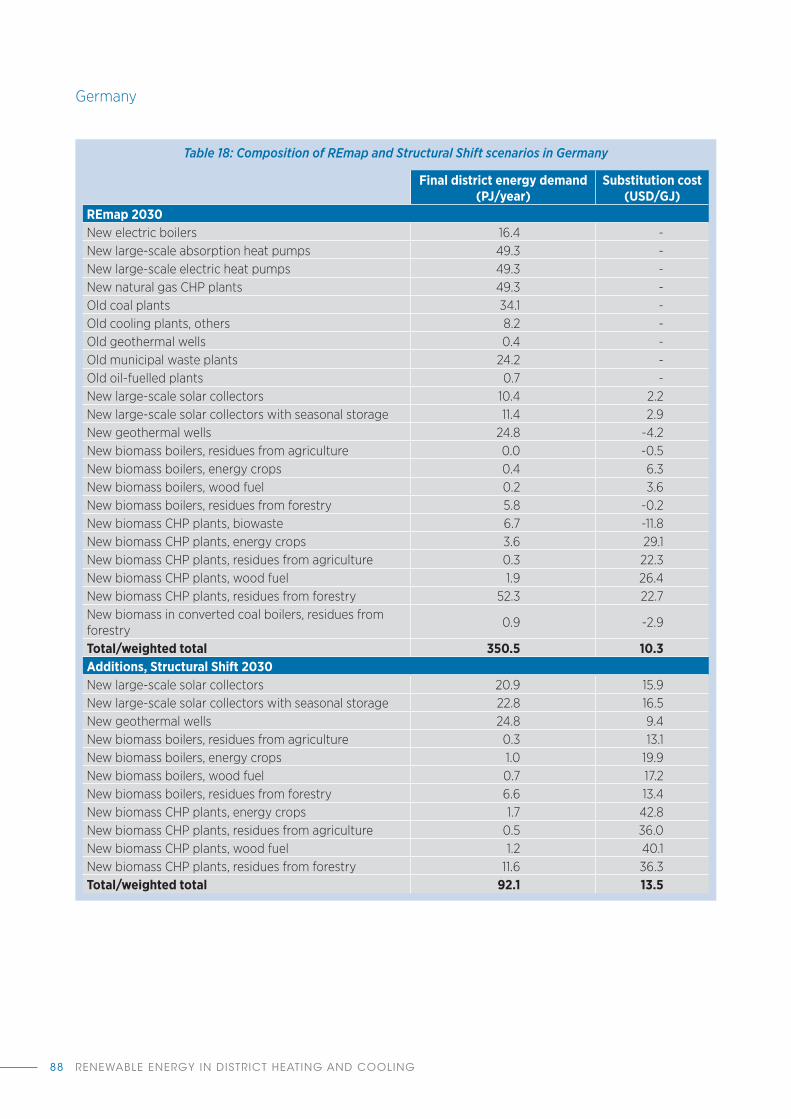
RENEWABLE ENERGY IN DISTRICT HEATING AND COOLING88
Germany
Table 18: Composition of REmap and Structural Shift scenarios in Germany
Final district energy demand
(PJ/year)Substitution cost
(USD/GJ)REmap 2030 New electric boilers 16�4 -New large-scale absorption heat pumps 49�3 -New large-scale electric heat pumps 49�3 -New natural gas CHP plants 49�3 -Old coal plants 34�1 -Old cooling plants, others 8�2 -Old geothermal wells 0�4 -Old municipal waste plants 24�2 -Old oil-fuelled plants 0�7 -New large-scale solar collectors 10�4 2�2New large-scale solar collectors with seasonal storage 11�4 2�9New geothermal wells 24�8 -4�2New biomass boilers, residues from agriculture 0�0 -0�5New biomass boilers, energy crops 0�4 6�3New biomass boilers, wood fuel 0�2 3�6New biomass boilers, residues from forestry 5�8 -0�2New biomass CHP plants, biowaste 6�7 -11�8New biomass CHP plants, energy crops 3�6 29�1New biomass CHP plants, residues from agriculture 0�3 22�3New biomass CHP plants, wood fuel 1�9 26�4New biomass CHP plants, residues from forestry 52�3 22�7New biomass in converted coal boilers, residues from forestry
0�9 -2�9
Total/weighted total 350.5 10.3Additions, Structural Shift 2030New large-scale solar collectors 20�9 15�9New large-scale solar collectors with seasonal storage 22�8 16�5New geothermal wells 24�8 9�4New biomass boilers, residues from agriculture 0�3 13�1New biomass boilers, energy crops 1�0 19�9New biomass boilers, wood fuel 0�7 17�2New biomass boilers, residues from forestry 6�6 13�4New biomass CHP plants, energy crops 1�7 42�8New biomass CHP plants, residues from agriculture 0�5 36�0New biomass CHP plants, wood fuel 1�2 40�1New biomass CHP plants, residues from forestry 11�6 36�3Total/weighted total 92.1 13.5

A sector roadmap for REmap 2030 89
Figure 25: Levelised cost of heating in Germany, 2030
Fixed cost Fuel cost Network cost
-10 10 30 50 70 90 110
Biowaste CHP
Gas-fired absorption heat pumps
Solar district heating, seasonal storage
Coal boiler to biomass conversion
Coal CHP to biomass conversion
Geothermal with absorption heat pumps
Gas boilers
Geothermal with electric heat pumps
Natural gas CHP
Biogas boilers
Levelised cost (USD/GJ)
District heating technologies - Germany
-10 10 30 50 70 90 110
Decentralised sorption heat pumpsDecentralised coal heating
Decentralised biomass heatingDecentralised electric heat pumps
Decentralised gas heatingDecentralised micro-CHPDecentralised oil heating
Decentralised electric heatingDecentralised solar heating
Decentralised heating technologies - Germany
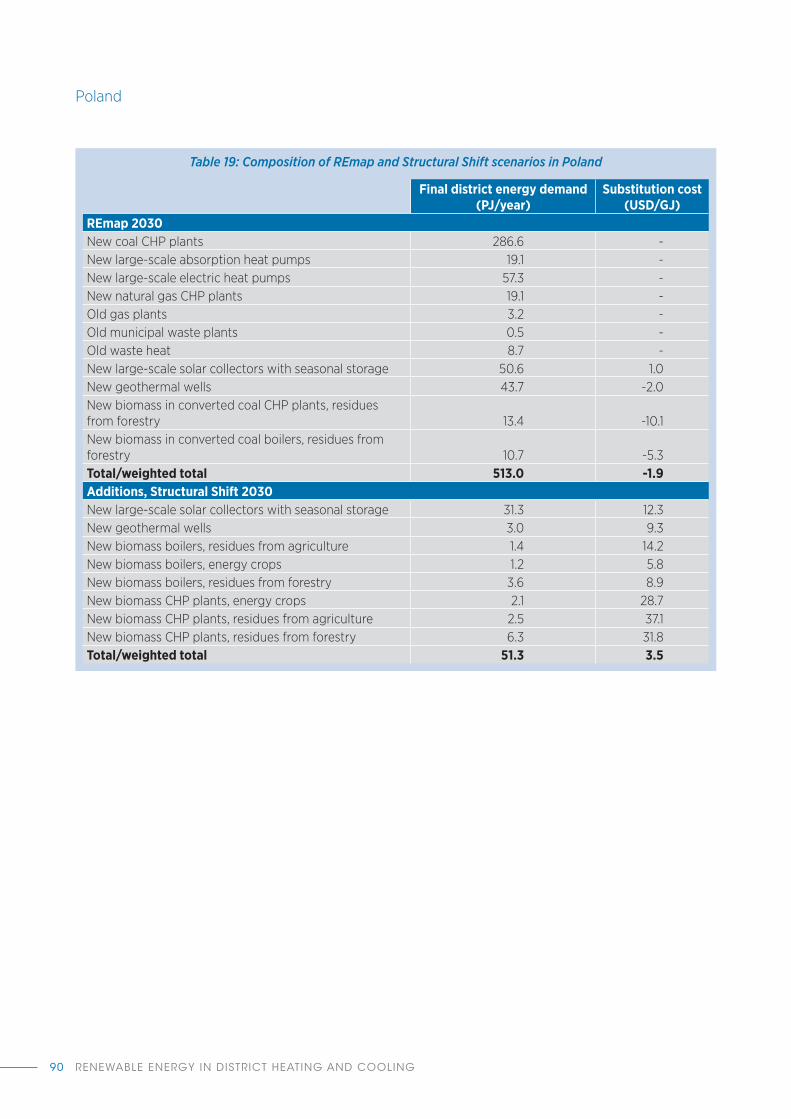
RENEWABLE ENERGY IN DISTRICT HEATING AND COOLING90
Poland
Table 19: Composition of REmap and Structural Shift scenarios in Poland
Final district energy demand
(PJ/year)Substitution cost
(USD/GJ)REmap 2030New coal CHP plants 286�6 -New large-scale absorption heat pumps 19�1 -New large-scale electric heat pumps 57�3 -New natural gas CHP plants 19�1 -Old gas plants 3�2 -Old municipal waste plants 0�5 -Old waste heat 8�7 -New large-scale solar collectors with seasonal storage 50�6 1�0New geothermal wells 43�7 -2�0New biomass in converted coal CHP plants, residues from forestry 13�4 -10�1New biomass in converted coal boilers, residues from forestry 10�7 -5�3Total/weighted total 513.0 -1.9Additions, Structural Shift 2030 New large-scale solar collectors with seasonal storage 31�3 12�3New geothermal wells 3�0 9�3New biomass boilers, residues from agriculture 1�4 14�2New biomass boilers, energy crops 1�2 5�8New biomass boilers, residues from forestry 3�6 8�9New biomass CHP plants, energy crops 2�1 28�7New biomass CHP plants, residues from agriculture 2�5 37�1New biomass CHP plants, residues from forestry 6�3 31�8Total/weighted total 51.3 3.5

A sector roadmap for REmap 2030 91
Figure 26: Levelised cost of heating in Poland, 2030
Fixed cost Fuel cost Network cost
Levelised cost (USD/GJ)
-10 0 10 20 30 40 50 60 70 80 90 100 110
Biowaste CHP
Geothermal, direct use
Coal CHP
Solar district heating, seasonal storage
Biomass boilers
Geothermal with absorption heat pumps
Electric heat pumps, elevated temp.
Electric heat pumps, ambient temp.
Natural gas CHP
Electric boilers
District heating technologies - Poland
-10 0 10 20 30 40 50 60 70 80 90 100 110
Decentralised sorption heat pumpsDecentralised coal heating
Decentralised biomass heatingDecentralised gas heatingDecentralised micro-CHP
Decentralised electric heat pumpsDecentralised oil heating
Decentralised solar heatingDecentralised electric heating
Decentralised heating technologies - Poland

RENEWABLE ENERGY IN DISTRICT HEATING AND COOLING92
Switzerland
Table 20: Composition of REmap and Structural Shift scenarios in Switzerland
Final district energy demand (PJ/year)
Substitution cost (USD/GJ)
REmap 2030New large-scale absorption heat pumps 2�0 -New large-scale electric heat pumps 4�7 -Old cooling plants, others 1�2 -Old geothermal wells 0�0 -Old municipal waste plants 3�5 -Old oil-fuelled plants 0�1 -New large-scale solar collectors 0�2 -8�2New large-scale solar collectors with seasonal storage 0�2 -5�3New geothermal wells 3�5 -7�5New biomass boilers, residues from agriculture 0�3 -5�9New biomass boilers, energy crops 0�1 -1�1New biomass boilers, residues from forestry 1�3 -1�9New biomass CHP plants, energy crops 0�2 37�3New biomass CHP plants, residues from agriculture 0�7 32�5New biomass CHP plants, residues from forestry 3�1 36�4Total/weighted total 21.0 11.4Additions, Structural Shift 2030 New large-scale solar collectors 0�1 4�3New large-scale solar collectors with seasonal storage 0�1 7�2New geothermal wells 3�5 5�1New biomass boilers, residues from agriculture 0�4 6�7New biomass boilers, energy crops 0�1 11�5New biomass boilers, residues from forestry 1�0 10�6New biomass CHP plants, energy crops 0�2 49�8New biomass CHP plants, residues from agriculture 0�8 45�1New biomass CHP plants, residues from forestry 1�8 49�0Total/weighted total 8.0 15.8

A sector roadmap for REmap 2030 93
Figure 27: Levelised cost of heating in Switzerland, 2030
Fixed cost Fuel cost Network cost
Levelised cost (USD/GJ)
-10 0 10 20 30 40 50 60 70 80 90 100 110
Biowaste CHP
Solar district heating, low load match factor
Geothermal, direct use
Biomass boilers
Electric heat pumps, elevated temp.
Electric heat pumps, ambient temp.
Geothermal with electric heat pumps
Gas boilers
Biomass CHP plants
Biogas CHP
District heating technologies - Switzerland
-10 0 10 20 30 40 50 60 70 80 90 100 110
Decentralised biomass heating
Decentralised sorption heat pumps
Decentralised electric heat pumps
Decentralised micro-CHP
Decentralised solar heating
Decentralised heating technologies - Switzerland

RENEWABLE ENERGY IN DISTRICT HEATING AND COOLING94
Japan
Table 21: Composition of REmap and Structural Shift scenarios in Japan
Final district energy demand
(PJ/year)Substitution cost
(USD/GJ)REmap 2030New electric chillers 5�4 -New large-scale absorption heat pumps 3�0 -New large-scale electric heat pumps 1�3 -New natural gas fired chillers 2�3 -Old cooling plants, others 2�8 -Old heating plants, others 1�7 -Old oil-fuelled plants 0�1 -New large-scale solar collectors 0�8 -3�6New geothermal wells 0�3 -0�4New biomass boilers, residues from forestry 0�2 12�5New natural water cooling facilities 0�3 14�2New solar cooling facilities 3�2 15�1New natural water cooling facilities, medium intake pipe 0�4 18�7New natural water cooling facilities, long intake pipe 0�3 23�7New biomass CHP plants, residues from forestry 1�8 40�2Total/weighted total 23.8 19.0Additions Structural Shift 2030New large-scale solar collectors 0�3 -3�6New geothermal wells 0�1 -0�4New biomass boilers, residues from agriculture 0�0 1�2New biomass boilers, residues from forestry 0�2 12�5New natural water cooling facilities 0�1 20�9New solar cooling facilities 1�0 21�7New natural water cooling facilities, medium intake pipe 0�1 25�4New natural water cooling facilities, long intake pipe 0�1 30�4New biomass CHP plants, residues from agriculture 0�0 28�9New biomass CHP plants, residues from forestry 0�4 40�2Total/weighted total 2.4 19.3
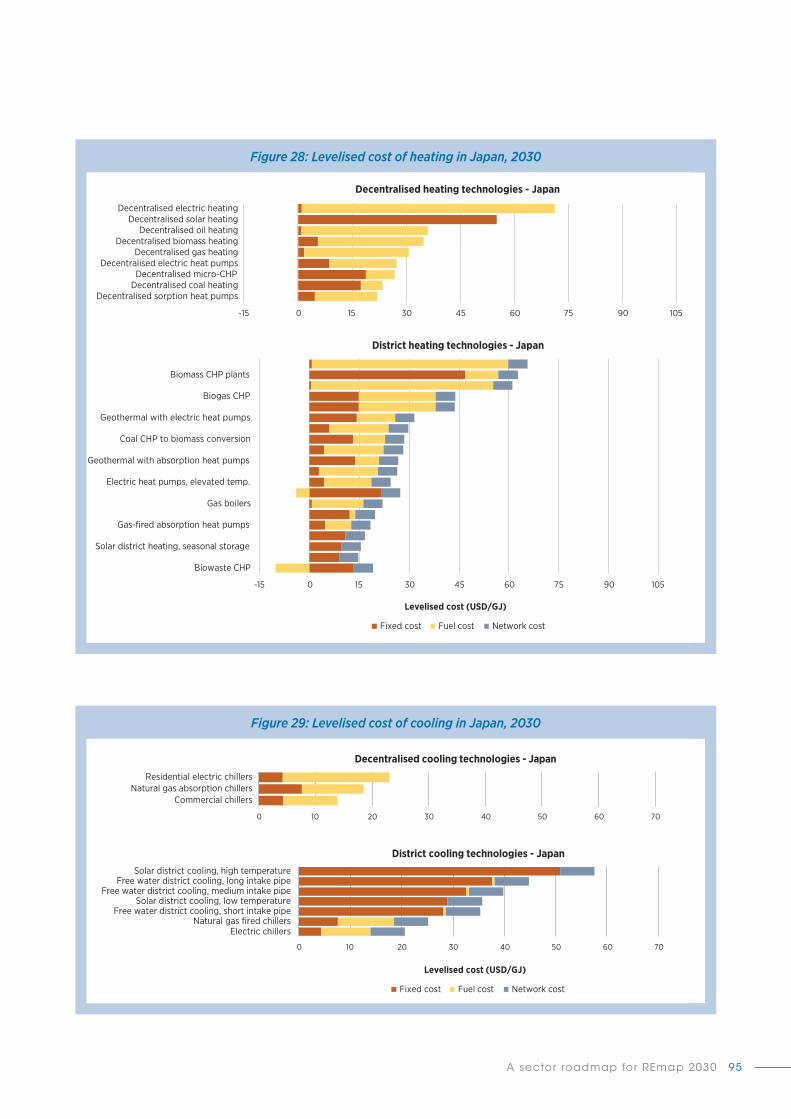
A sector roadmap for REmap 2030 95
Figure 28: Levelised cost of heating in Japan, 2030
Fixed cost Fuel cost Network cost
Levelised cost (USD/GJ)
-15 0 15 30 45 60 75 90 105
Biowaste CHP
Solar district heating, seasonal storage
Gas-fired absorption heat pumps
Gas boilers
Electric heat pumps, elevated temp.
Geothermal with absorption heat pumps
Coal CHP to biomass conversion
Geothermal with electric heat pumps
Biogas CHP
Biomass CHP plants
District heating technologies - Japan
-15 0 15 30 45 60 75 90 105
Decentralised sorption heat pumpsDecentralised coal heatingDecentralised micro-CHP
Decentralised electric heat pumpsDecentralised gas heating
Decentralised biomass heatingDecentralised oil heating
Decentralised solar heatingDecentralised electric heating
Decentralised heating technologies - Japan
Figure 29: Levelised cost of cooling in Japan, 2030
Fixed cost Fuel cost Network cost
Levelised cost (USD/GJ)
0 10 20 30 40 50 60 70
Electric chillersNatural gas fired chillers
Free water district cooling, short intake pipeSolar district cooling, low temperature
Free water district cooling, medium intake pipeFree water district cooling, long intake pipe
Solar district cooling, high temperature
District cooling technologies - Japan
0 10 20 30 40 50 60 70
Commercial chillersNatural gas absorption chillers
Residential electric chillers
Decentralised cooling technologies - Japan

RENEWABLE ENERGY IN DISTRICT HEATING AND COOLING96
US
Table 22: Composition of REmap and Structural Shift scenarios in US
Final district energy demand
(PJ/year)Substitution cost
(USD/GJ)REmap 2030New electric chillers 50�5 -New large-scale absorption heat pumps 217�4 -New large-scale electric heat pumps 93�2 -New natural gas fired chillers 12�6 -Old absorption chillers 0�2 -Old coal plants 6�3 -Old cooling plants, others 10�6 -Old electric chillers 20�0 -Old heating plants, others 8�1 -Old oil-fuelled plants 2�1 -New large-scale solar collectors with seasonal storage 30�8 3�5New geothermal wells 17�6 8�4New biomass boilers, residues from agriculture 8�3 4�0New biomass boilers, energy crops 11�5 12�6New biomass boilers, wood fuel 8�3 5�4New biomass boilers, residues from forestry 13�4 4�6New natural water cooling facilities 7�5 19�7New solar cooling facilities 30�8 21�7New natural water cooling facilities, medium intake pipe 9�9 25�5New natural water cooling facilities, long intake pipe 3�0 31�9New biomass CHP plants, energy crops 26�8 66�3New biomass CHP plants, residues from agriculture 19�3 57�6New biomass CHP plants, wood fuel 19�5 59�0New biomass CHP plants, residues from forestry 31�3 58�3Total/weighted total 659.0 31.8Additions, Structural Shift 2030New large-scale solar collectors with seasonal storage 40�0 3�5New geothermal wells 8�8 8�4New biomass boilers, residues from agriculture 3�3 4�0New biomass boilers, energy crops 8�6 12�6New biomass boilers, wood fuel 1�6 5�4New biomass boilers, residues from forestry 6�2 4�6New natural water cooling facilities 4�2 25�8New solar cooling facilities 17�2 27�8New natural water cooling facilities, medium intake pipe 5�5 31�6New natural water cooling facilities, long intake pipe 1�7 38�0New biomass CHP plants, energy crops 15�2 66�3New biomass CHP plants, residues from agriculture 5�9 57�6New biomass CHP plants, wood fuel 2�7 59�0New biomass CHP plants, residues from forestry 10�9 58�3Total/weighted total 131.8 29.5

A sector roadmap for REmap 2030 97
Figure 30: Levelised cost of heating in US, 2030
Fixed cost Fuel cost Network cost
Levelised cost (USD/GJ)
District heating technologies - United States
Decentralised heating technologies - United States
-10 0 10 20 30 40 50 60 70 80 90 100 110
Gas boilers
Electric heat pumps, elevated temp.
Solar district heating, high load match factor
Coal boiler to biomass conversion
Solar district heating, low load match factor
Biomass boilers
Coal CHP to biomass conversion
Geothermal with electric heat pumps
Coal CHP
Biogas CHP
-10 0 10 20 30 40 50 60 70 80 90 100 110
Decentralised sorption heat pumpsDecentralised gas heating
Decentralised biomass heatingDecentralised electric heat pumps
Decentralised coal heatingDecentralised oil heating
Decentralised electric heatingDecentralised micro-CHP
Decentralised solar heating
Figure 31: Levelised cost of cooling in US, 2030
Fixed cost Fuel cost Network cost
Levelised cost (USD/GJ)
District cooling technologies - United States
Decentralised cooling technologies - United States
0 10 20 30 40 50 60
Electric chillers
Free water district cooling, short intake pipe
Free water district cooling, medium intake pipe
Solar district cooling, high temperature
0 2 4 6 8 10 12 14 16
Commercial chillersResidential electric chillers
Natural gas absorption chillers

RENEWABLE ENERGY IN DISTRICT HEATING AND COOLING98
Kuwait
Table 24: Composition of REmap and Structural Shift scenarios in UAE
Final district energy demand
(PJ/year)Substitution cost
(USD/GJ)REmap 2030New electric chillers 140�0 -New natural gas fired chillers 7�4 -Old absorption chillers 2�2 -Old electric chillers 41�8 -New solar cooling facilities 87�1 3�3New natural water cooling facilities, medium intake pipe 29�7 3�2New natural water cooling facilities, long intake pipe 69�2 4�9Total/weighted total 377.4 3.9Additions, Structural Shift 2030New solar cooling facilities 112�5 4�6New natural water cooling facilities, medium intake pipe 38�3 4�4New natural water cooling facilities, long intake pipe 89�4 6�2Total/weighted total 240.2 4.6
Table 23: Composition of REmap and Structural Shift scenarios in Kuwait
Final district energy demand
(PJ/year)Substitution cost
(USD/GJ)REmap 2030New electric chillers 75�1 -New natural gas fired chillers 4�0 -New solar cooling facilities 4�1 5�5New natural water cooling facilities, medium intake pipe 2�0 5�2New natural water cooling facilities, long intake pipe 4�8 7�8Total/weighted total 90.0 6.5Additions, Structural Shift 2030New solar cooling facilities 3�0 7�6New natural water cooling facilities, medium intake pipe 1�8 7�3New natural water cooling facilities, long intake pipe 4�2 9�8Total/weighted total 9.0 7.4
UAE

A sector roadmap for REmap 2030 99
Figure 32: Levelised cost of cooling in Kuwait, 2030
Fixed cost Fuel cost Network cost
Levelised cost (USD/GJ)
District cooling technologies - Kuwait
Decentralised cooling technologies - Kuwait
0 2 4 6 8 10 12 14 16 18 20
Electric chillersFree water district cooling, short intake pipe
Free water district cooling, medium intake pipeSolar district cooling, low temperature
Free water district cooling, long intake pipeSolar district cooling, high temperature
Natural gas fired chillers
0 2 4 6 8 10 12 14 16 18 20
Commercial chillersResidential electric chillers
Natural gas absorption chillers
Figure 33: Levelised cost of cooling in UAE, 2030
Fixed cost Fuel cost Network cost
Levelised cost (USD/GJ)
District cooling technologies - United Arab Emirates
Decentralised cooling technologies - United Arab Emirates
0 2 4 6 8 10 12
Electric chillers
Solar district cooling, low temperature
Natural gas fired chillers
Solar district cooling, high temperature
0 2 4 6 8 10 12
Commercial chillersResidential electric chillers
Natural gas absorption chillers

RENEWABLE ENERGY IN DISTRICT HEATING AND COOLING100

A sector roadmap for REmap 2030 101

RENEWABLE ENERGY IN DISTRICT HEATING AND COOLING102


w w w. i re n a . o rg
Copyright © IRENA 2017
A SE
CTOR
ROA
DMAP
FOR
REM
AP 2
030
– RE
NEW
ABLE
ENE
RGY
IN D
ISTR
ICT
HEAT
ING
AND
COOL
ING