1 Systems Analysis Advisory Committee (SAAC) Friday March 19, 2004 Michael Schilmoeller John Fazio.
Upload
gordon-randallCategory
view
215download
2
10/4/2002 1
Systems Analysis Advisory Committee (SAAC)
Friday, October 4, 2002Michael Schilmoeller
John Fazio

Northwest Power Planning Council
2
Agenda
• Background• Objectives• Basic Terms and Concepts• The Portfolio Model• Using the Portfolio Model and Other Council
Tools to make Decisions• Milestones for the SAAC Process• Action Items
Northwest Power Planning Council
3
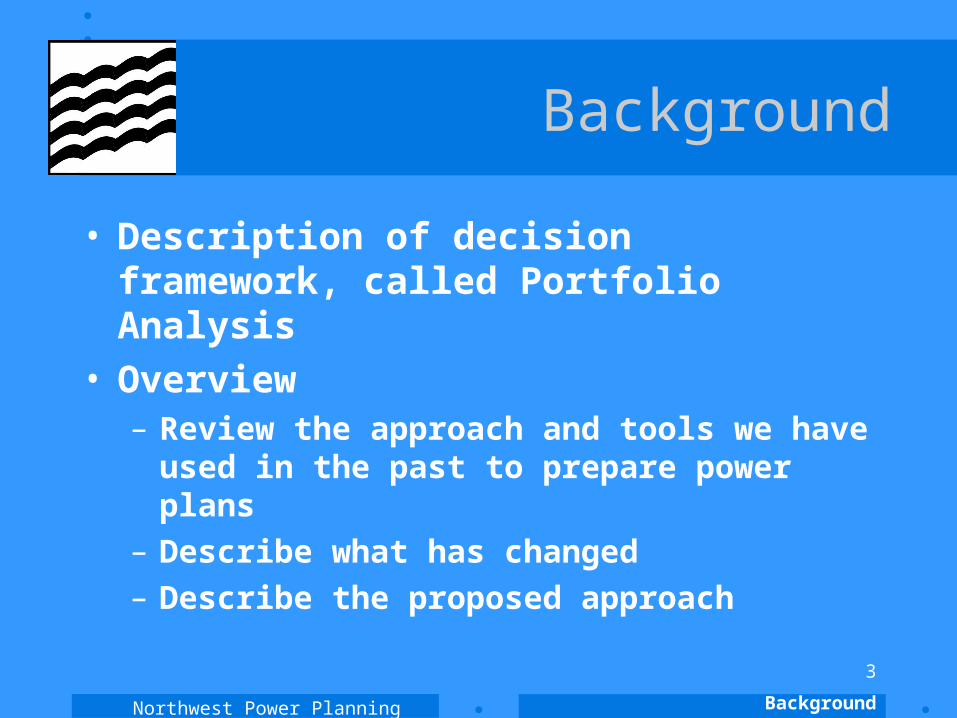
Background
• Description of decision framework, called Portfolio Analysis
• Overview– Review the approach and tools we
have used in the past to prepare power plans
– Describe what has changed– Describe the proposed approach
Background

Northwest Power Planning Council
4
Traditional Resource Planning
• Determine mix of resources (power plants and demand-side measures) that minimize expected cost of meeting requirements
• 20-year or longer time horizon• Regional perspective• Considered uncertainty or variability in
hydroelectric generation, loads, fuel prices, but did not value risk explicitly (Issac)
Background

Northwest Power Planning Council
5
Existing Tools
• Aurora– systems analysis of Western System– market price prediction
• Genesys– reliability assessment focused on NW– addresses uncertainty in loads,
resource availability and hydro energy
Background
Northwest Power Planning Council
6
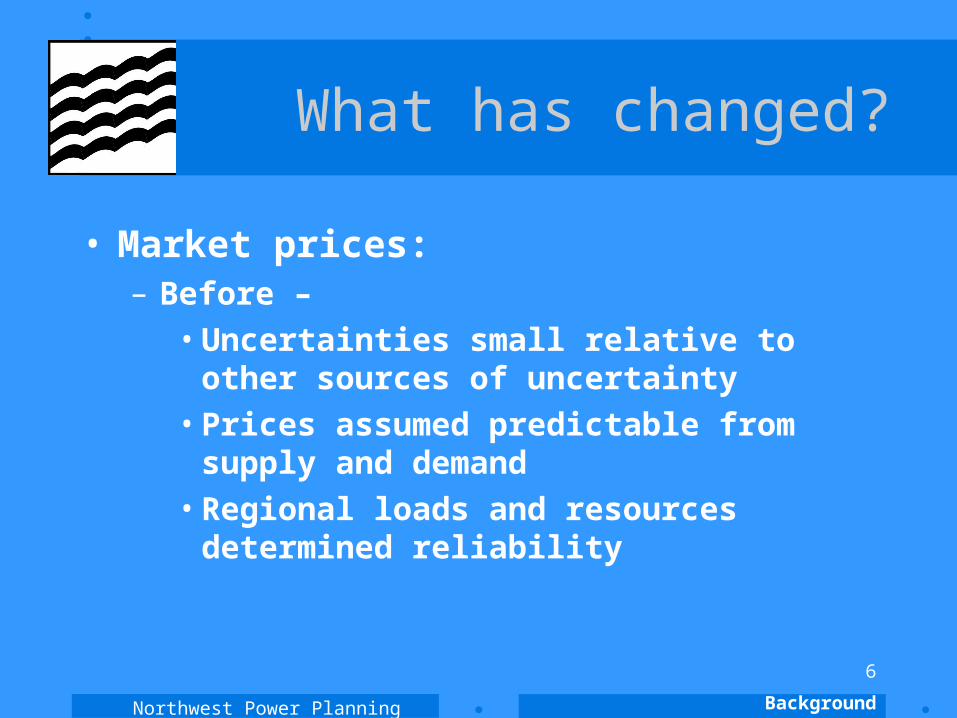
What has changed?
• Market prices: – Before –
•Uncertainties small relative to other sources of uncertainty
•Prices assumed predictable from supply and demand
•Regional loads and resources determined reliability
Background

Northwest Power Planning Council
7
What has changed?
• Market prices: – Now –
• Market prices seen as significantly more volatile, “stickier,” less predictable from supply and demand
• Most utilities exposed to market for part of load• Activities outside the region can be critical to market
price• Reliability can be influenced by credit problems• Available markets provide hedging and risk
management opportunities that are incorporated into capacity addition decisions
• Role of individual participants in the region was de-emphasized. Now we think of behavior as “bottom-up.” Relevance to the energy crisis.
Background

Northwest Power Planning Council
8
Issues in the Fifth Plan
• incentives for generation capacity• price responsiveness of demand• sustained investment in efficiency• information for markets• fish operations and power• transmission and reliability• resource diversity and distributed generation• role of BPA• global change
• lessons learned from 2000-2001
Background

Northwest Power Planning Council
9
Issues in the Fifth PlanThe role of risk
• incentives for generation capacity• price responsiveness of demand• sustained investment in efficiency• information for markets• fish operations and power• transmission and reliability• resource diversity and distributed generation• role of BPA• global climate change
• lessons learned from 2000-2001
Background

Northwest Power Planning Council
10
Issues in the Fifth Plan
Examples• Incentives for resource development
– Energy value of a combustion turbine in traditional analyses is associated with expected generation
– Capacity value is associated with the “insurance value” of the turbine (Important to dealing with hydro uncertainty)
• Price responsiveness of demand– Value depends on the number of hours of market prices
over some relatively high threshold– Exact duration of future market prices at various levels
is unknown
Background

Northwest Power Planning Council
11
Existing Tools
• Aurora– Can test sensitivity to loads, hydro
• Genesys– Detailed analysis of reliability risks associate with hydro
generation, loads, power plant availability
• But,– Both are computationally intensive– Neither is a generalized risk model– Neither can perform cost minimization subject to risk
constraints
Background
Northwest Power Planning Council
12
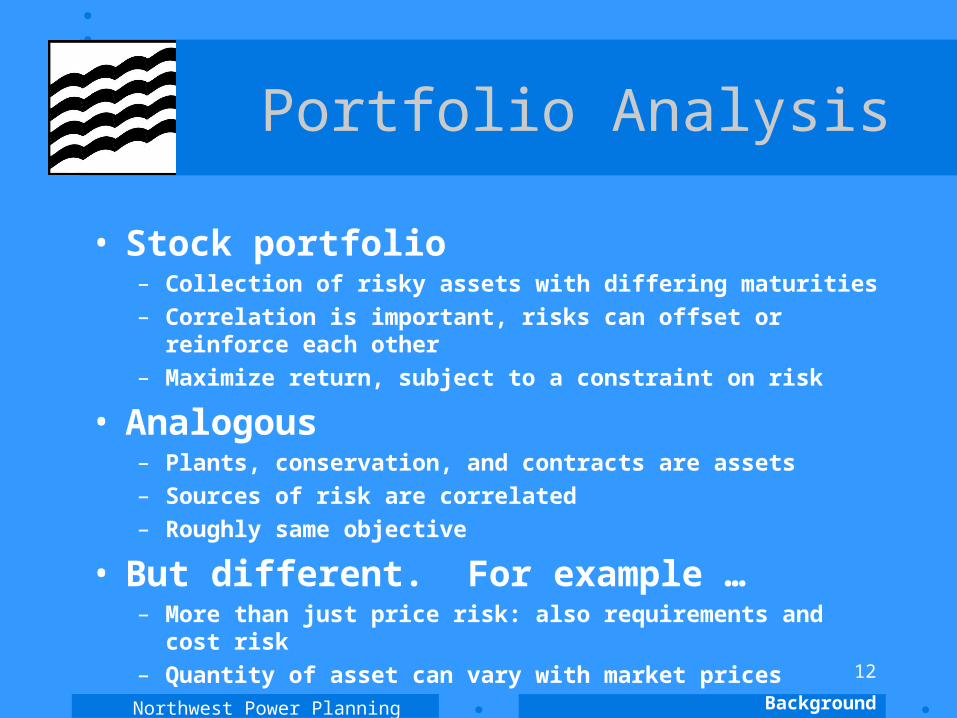
Portfolio Analysis
• Stock portfolio– Collection of risky assets with differing maturities
– Correlation is important, risks can offset or reinforce each other
– Maximize return, subject to a constraint on risk
• Analogous– Plants, conservation, and contracts are assets
– Sources of risk are correlated
– Roughly same objective
• But different. For example …– More than just price risk: also requirements and cost risk
– Quantity of asset can vary with market prices
Background

Northwest Power Planning Council
13
What is a “resource portfolio,” exactly?
Hourly demand
Coal
Buy in Market
Buy in Market
Sell in Market
Gas Fired
Price-driven generation
Hydro
Contracts
Hydro
Total Resources
Year 1Summer Winter
Year 2Summer Winter
Background

Northwest Power Planning Council
14
How do we determine risk for our “portfolio?”
• Choose a set of correlated values for monthly hydro, monthly loads, monthly fuel prices, monthly market prices for electricity, etc., etc.
• Calculate the cost of our portfolio• Return to step 1 as many times as necessary to
obtain a sample distribution that adequately describes the underlying distribution of costs
Background

Northwest Power Planning Council
15
Portfolio Analysis
• Possible measures (“goal”, “objective”)– Minimize expected annual cost, given a fixed
dollar constraint on 10 percent “worst outcomes,” or
– Minimize the variance of rates over a given time frame, or
– Minimize the likelihood of large rate increases, or ….
Background

16
Northwest Power Planning Council
Portfolio Analysis, Example
• Before resource additions: We want minimum expected annual cost, such that the chance of exceeding $25,700 M is less than 10 percent
Frequency Chart ofAnnual System Cost Simulations
$M
Mean = 17500
.000
.011
.022
.033
.044
0
5.5
11
16.5
22
-10000 3750 17500 31250 45000
33%
Good Bad
Risk limit = 25700
…but portfolio analysis tells us we have a problem ….
Background

17
Northwest Power Planning Council
Portfolio Analysis, Example
• After addition of CCCTs, renewables, conservation, price-responsive demand programs, and so forth, our objective is achieved, but at some increase in expected cost
Frequency Chart ofAnnual System Cost Simulations
$M
Mean = 18300
.000
.011
.022
.033
.044
0
5.5
11
16.5
22
-10000 3750 17500 31250 45000
10%
Risk limit = 25700
Good Bad
Background

Northwest Power Planning Council
18
Portfolio Analysis
• Initial questions– Which measures make sense for the region in the short
and long-term?
– What kinds of portfolios would benefit, in terms of risk management, from which measures in the short and long term? How much benefit is there?
• This information provides the rationale for the policy choices necessary to achieve implementation of preferred portfolios
Background
Northwest Power Planning Council
19
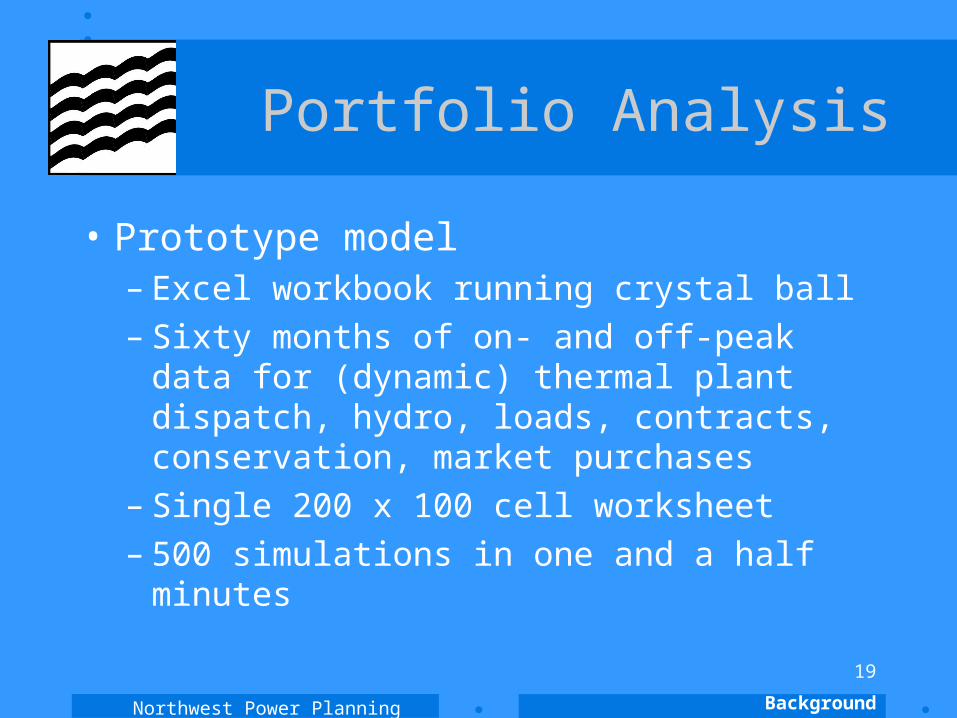
Portfolio Analysis
• Prototype model– Excel workbook running crystal ball– Sixty months of on- and off-peak data for
(dynamic) thermal plant dispatch, hydro, loads, contracts, conservation, market purchases
– Single 200 x 100 cell worksheet– 500 simulations in one and a half minutes
Background

Northwest Power Planning Council
20
Background Summary
• Reviewed the approach and tools we have used in the past to prepare power plans
• Described what has changed• Described the new approach
Background
Northwest Power Planning Council
21
Agenda
• Background• Objectives• Basic Terms and Concepts• The Portfolio Model• Using the Portfolio Model and Other Council
Tools to make Decisions• Milestones for the SAAC Process• Action Items
Objectives
Northwest Power Planning Council
22
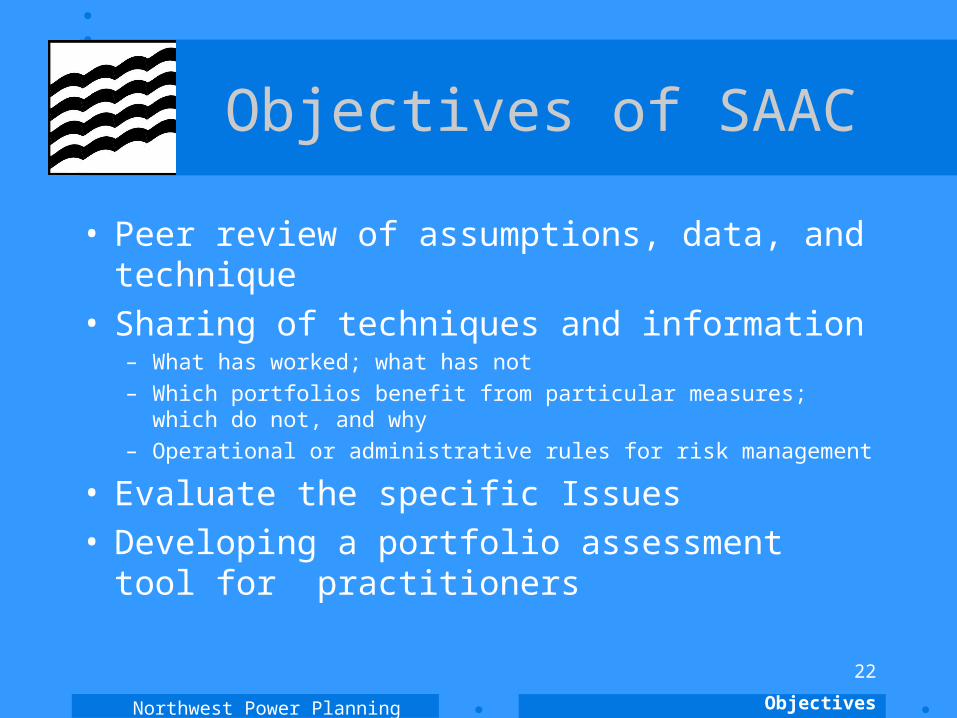
Objectives of SAAC
• Peer review of assumptions, data, and technique• Sharing of techniques and information
– What has worked; what has not
– Which portfolios benefit from particular measures; which do not, and why
– Operational or administrative rules for risk management
• Evaluate the specific Issues• Developing a portfolio assessment tool for
practitioners
Objectives

Northwest Power Planning Council
23
Principles
• Significant to strategic risk issues– “Does this threaten our extinction?”
• Transparency
• Quantitative analysis, but in the service of insight and communication
Objectives

Northwest Power Planning Council
24
Agenda
• Background• Objectives• Basic Terms and Concepts• The Portfolio Model• Using the Portfolio Model and Other Council
Tools to make Decisions• Milestones for the SAAC Process• Action Items
Terms and Concepts
Northwest Power Planning Council
25
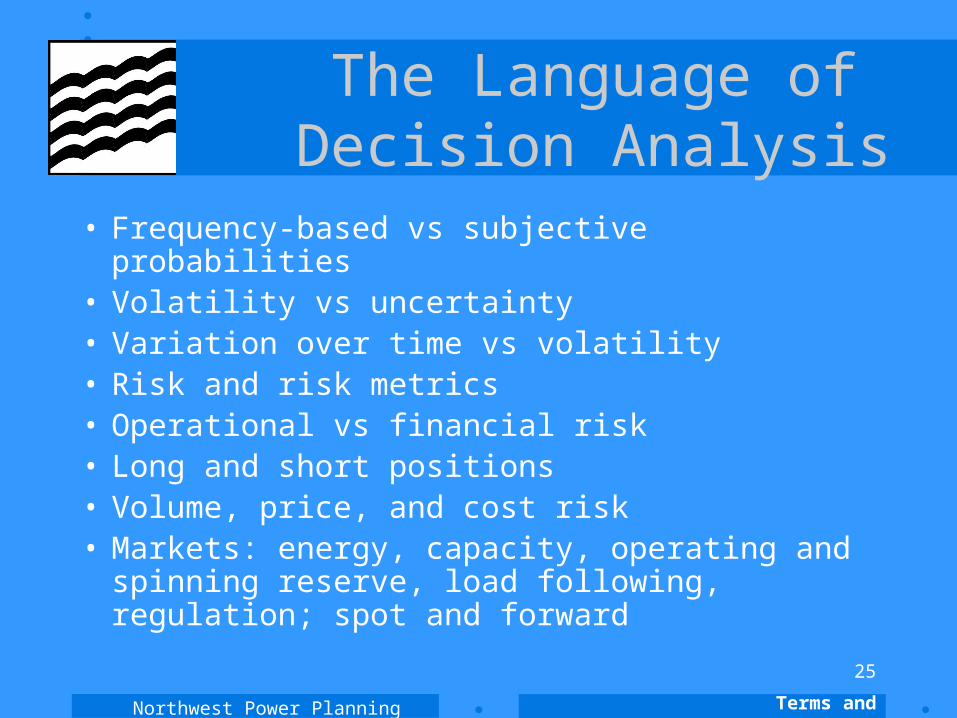
The Language of Decision Analysis
• Frequency-based vs subjective probabilities• Volatility vs uncertainty• Variation over time vs volatility• Risk and risk metrics• Operational vs financial risk• Long and short positions• Volume, price, and cost risk• Markets: energy, capacity, operating and spinning
reserve, load following, regulation; spot and forward
Terms and Concepts

Northwest Power Planning Council
26
Agenda
• Background• Objectives• Basic Terms and Concepts• The Portfolio Model• Using the Portfolio Model and Other Council
Tools to make Decisions• Milestones for the SAAC Process• Action Items
The Portfolio Model

Northwest Power Planning Council
27
What is a “resource portfolio,” exactly?
Hourly demand
Coal
Buy in Market
Buy in Market
Sell in Market
Gas Fired
Price-driven generation
Hydro
Contracts
Hydro
Total Resources
Year 1Summer Winter
Year 2Summer Winter
The Portfolio Model
Northwest Power Planning Council
28
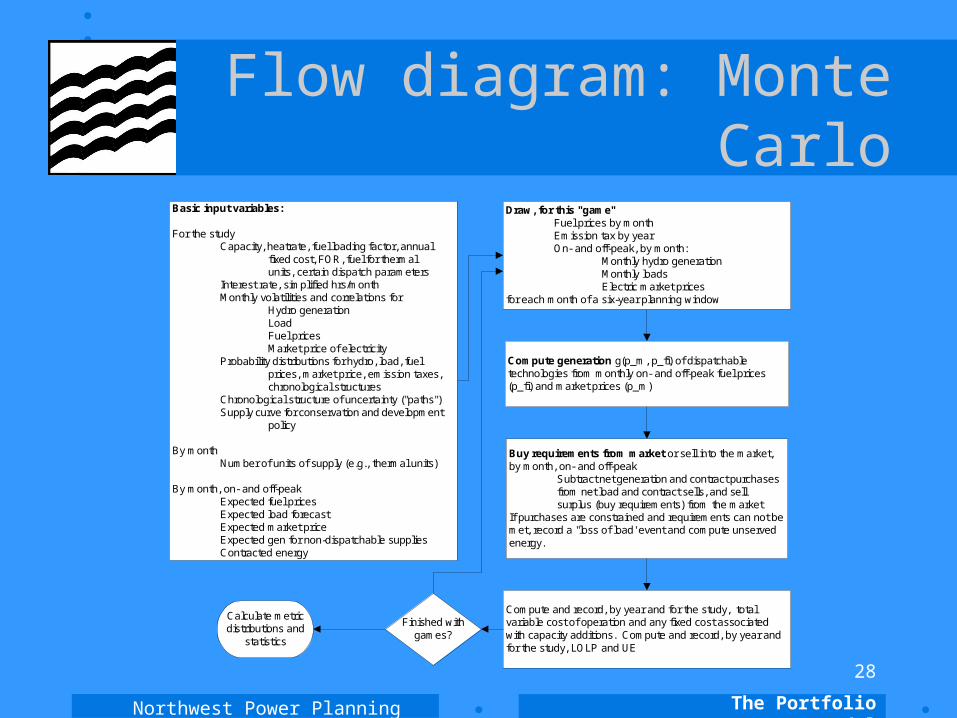
Flow diagram: Monte Carlo
The Portfolio Model
Draw, for this "game"Fuel prices by monthEmission tax by yearOn- and off-peak, by month:
Monthly hydro generationMonthly loadsElectric market prices
for each month of a six-year planning window
Compute generation g(p_m, p_fi) of dispatchabletechnologies from monthly on- and off-peak fuel prices(p_fi) and market prices (p_m)
Buy requirements from market or sell into the market,by month, on- and off-peak
Subtract net generation and contract purchases from net load and contract sells, and sell surplus (buy requirements) from the market
If purchases are constrained and requirements can not bemet, record a "loss of load' event and compute unservedenergy.
Compute and record, by year and for the study, totalvariable cost of operation and any fixed cost associatedwith capacity additions. Compute and record, by year andfor the study, LOLP and UE
Finished withgames?
Calculate metricdistributions and
statistics
Basic input variables:
For the studyCapacity, heatrate, fuel loading factor, annual
fixed cost, FOR, fuel for thermal units, certain dispatch parameters
Interest rate, simplified hrs/monthMonthly volatilities and correlations for
Hydro generationLoadFuel pricesMarket price of electricity
Probability distributions for hydro, load, fuel prices, market price, emission taxes,chronological structures
Chronological structure of uncertainty ("paths")Supply curve for conservation and development
policy
By monthNumber of units of supply (e.g., thermal units)
By month, on- and off-peakExpected fuel pricesExpected load forecastExpected market priceExpected gen for non-dispatchable suppliesContracted energy
Northwest Power Planning Council
29
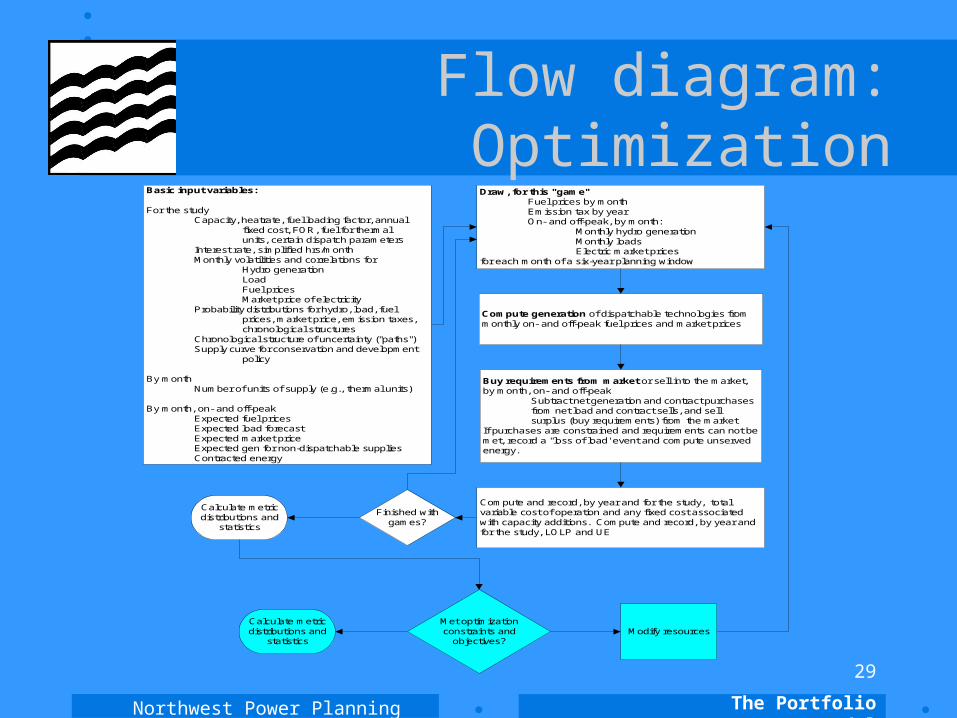
Flow diagram: Optimization
The Portfolio Model
Basic input variables:
For the studyCapacity, heatrate, fuel loading factor, annual
fixed cost, FOR, fuel for thermal units, certain dispatch parameters
Interest rate, simplified hrs/monthMonthly volatilities and correlations for
Hydro generationLoadFuel pricesMarket price of electricity
Probability distributions for hydro, load, fuel prices, market price, emission taxes,chronological structures
Chronological structure of uncertainty ("paths")Supply curve for conservation and development
policy
By monthNumber of units of supply (e.g., thermal units)
By month, on- and off-peakExpected fuel pricesExpected load forecastExpected market priceExpected gen for non-dispatchable suppliesContracted energy
Draw, for this "game"Fuel prices by monthEmission tax by yearOn- and off-peak, by month:
Monthly hydro generationMonthly loadsElectric market prices
for each month of a six-year planning window
Compute generation of dispatchable technologies frommonthly on- and off-peak fuel prices and market prices
Buy requirements from market or sell into the market,by month, on- and off-peak
Subtract net generation and contract purchases from net load and contract sells, and sell surplus (buy requirements) from the market
If purchases are constrained and requirements can not bemet, record a "loss of load' event and compute unservedenergy.
Compute and record, by year and for the study, totalvariable cost of operation and any fixed cost associatedwith capacity additions. Compute and record, by year andfor the study, LOLP and UE
Finished withgames?
Calculate metricdistributions and
statistics
Met optimizationconstraints and
objectives?
Calculate metricdistributions and
statisticsModify resources

Northwest Power Planning Council
30
The 40,000 Foot View
The Portfolio Model
correlations and volatilities
decision variables
interest rate, hours per period
chronological structure of uncertainty
conservation assumptions
conservation calculations
Northwest Power Planning Council
31
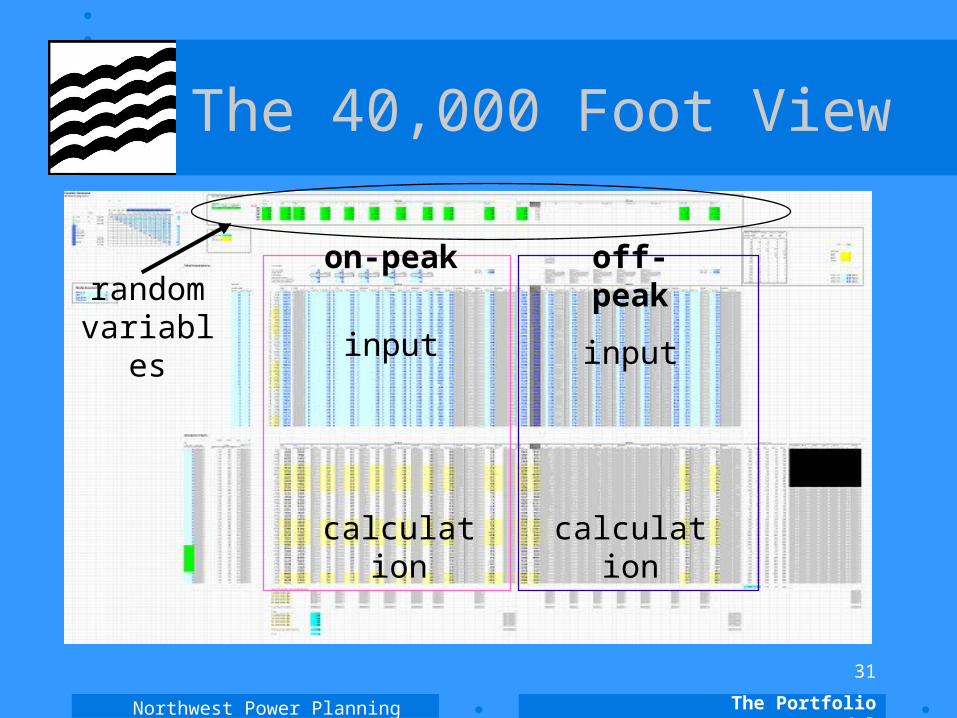
The 40,000 Foot View
The Portfolio Model
input input
calculation calculation
on-peak off-peakrandom
variables

Northwest Power Planning Council
32
The 40,000 Foot View
The Portfolio Model
annual and study cost calculations and metrics

Northwest Power Planning Council
33
The Excel Model
• A Tour
• A Demonstration
• Some Results
• Tour of Crystal Ball
The Portfolio Model
Northwest Power Planning Council
34
Agenda
• Background• Objectives• Basic Terms and Concepts• The Portfolio Model• Using the Portfolio Model and Other Council
Tools to make Decisions• Milestones for the SAAC Process• Action Items
Using Tools to Make Decisions
Northwest Power Planning Council
35
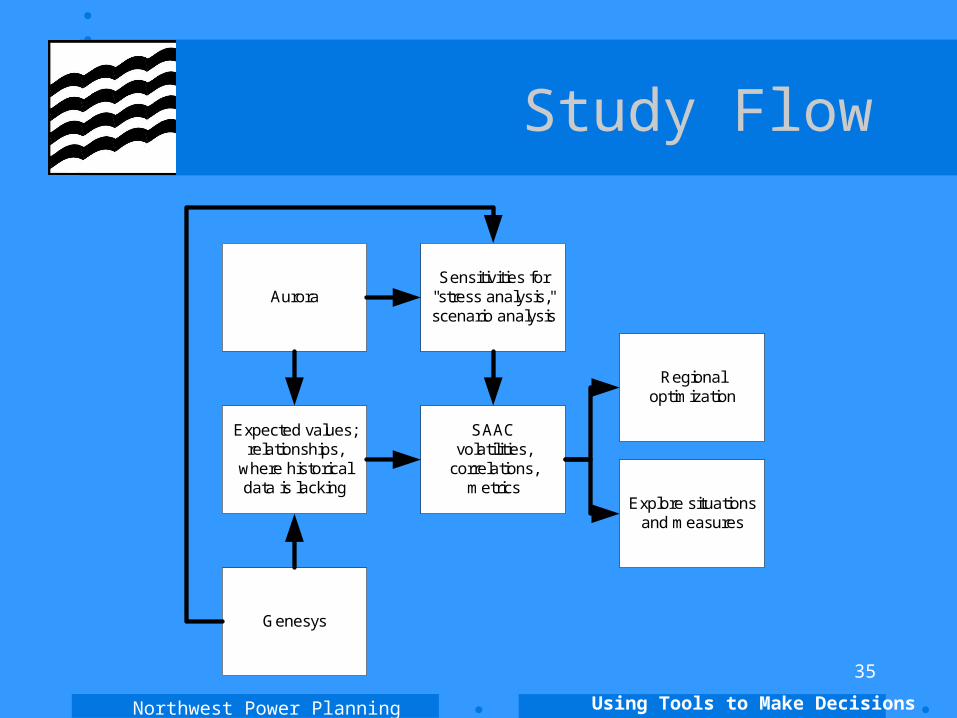
Study Flow
Using Tools to Make Decisions
Expected values;relationships,
where historicaldata is lacking
Aurora
Genesys
Regionaloptimization
Explore situationsand measures
SAACvolatilities,
correlations,metrics
Sensitivities for"stress analysis,"scenario analysis

Northwest Power Planning Council
36
Agenda
• Background• Objectives• Basic Terms and Concepts• The Portfolio Model• Using the Portfolio Model and Other Council
Tools to make Decisions• Milestones for the SAAC Process• Action Items
Outcomes and Milestones

Northwest Power Planning Council
37
SAAC Meetings
• Friday, Oct 4
• Thursday, Oct 24
• Friday, Nov 22
• Thursday, Dec 19
• Thursday, Jan 16
• Thursday, Feb 20
• Thursday, March 20
Outcomes and Milestones

Northwest Power Planning Council
38
Thursday, Oct 24
• Metrics– Candidates and their application
• Representations in the portfolio model– ** Plan Issues **– thermal generation– hydro generation– conservation and renewables– loads– contracts– reliability
Outcomes and Milestones

Northwest Power Planning Council
39
Friday, Nov 22
• Natural gas prices– Sumas, AECO, Rocky mountains– historical and monthly forwards and volatilities– correlations with other variables– subjective forwards
• Hydro generation– historical and monthly forwards and volatilities– correlations with other variables
Outcomes and Milestones
Northwest Power Planning Council
40
Thursday, Dec 19
• Electricity prices– Mid-C, COB– historical and monthly forwards and volatilities– correlations with other variables– subjective forwards
• Loads– historical and monthly forwards and volatilities– correlations with other variables
Outcomes and Milestones

Northwest Power Planning Council
41
Thursday, Jan 16
• Review of risk management problems of 2000-2001– What worked and what did not
• Initial optimization for Region, using all mechanisms
Outcomes and Milestones
Northwest Power Planning Council
42
Thursday, Feb 20
• Identifying “ideal” portfolios for each measure
price responsiveness of demand
traditional supply-side alternatives
sustained investment in efficiency
transmission and reliability
resource diversity and distributed generation
Outcomes and Milestones

Northwest Power Planning Council
43
Thursday, March 20
• Wrap up!!
Outcomes and Milestones

Northwest Power Planning Council
44
Agenda
• Background• Objectives• Basic Terms and Concepts• The Portfolio Model• Using the Portfolio Model and Other Council
Tools to make Decisions• Milestones for the SAAC Process• Action Items
Action Items

Northwest Power Planning Council
45
Action Items for Oct 24
• Be prepared to discuss items
• Locate sources for the kinds of information we will be needing at future meetings
Action Items
Northwest Power Planning Council
46
See you on the 24th!
Fine

Northwest Power Planning Council
47
Probability
• Frequency-based Probabilities– Volatility– A sample of the distribution is manifest
• hydro variability, load, gas price variability within the relevant time period (year); mean is relevant
– Normal variation in gas prices within a year
• Subjective Probabilities– Uncertainty– Only one outcome will manifest– Example: carbon tax, economic recession
Terms and Concepts
Northwest Power Planning Council
48
Risk and Risk Metrics
• Risk is probability of unfavorable outcomes– This definition is not universal
• Risk metrics are how we measure outcomes to determine whether one is worse than the other– Example of one-tailed test
Terms and Concepts
Northwest Power Planning Council
49
Operational and Financial
• Operational Risk
• Financial Risk
Terms and Concepts

Northwest Power Planning Council
50
Price and Volumetric Risk
• Long and Short Positions• Price risk
– potential exposure to unfavorable prices
• Volumetric risk– potential exposure to unfavorable quantities or
positions
• Cost risk– potential exposure to unfavorable costs
Terms and Concepts
Northwest Power Planning Council
51
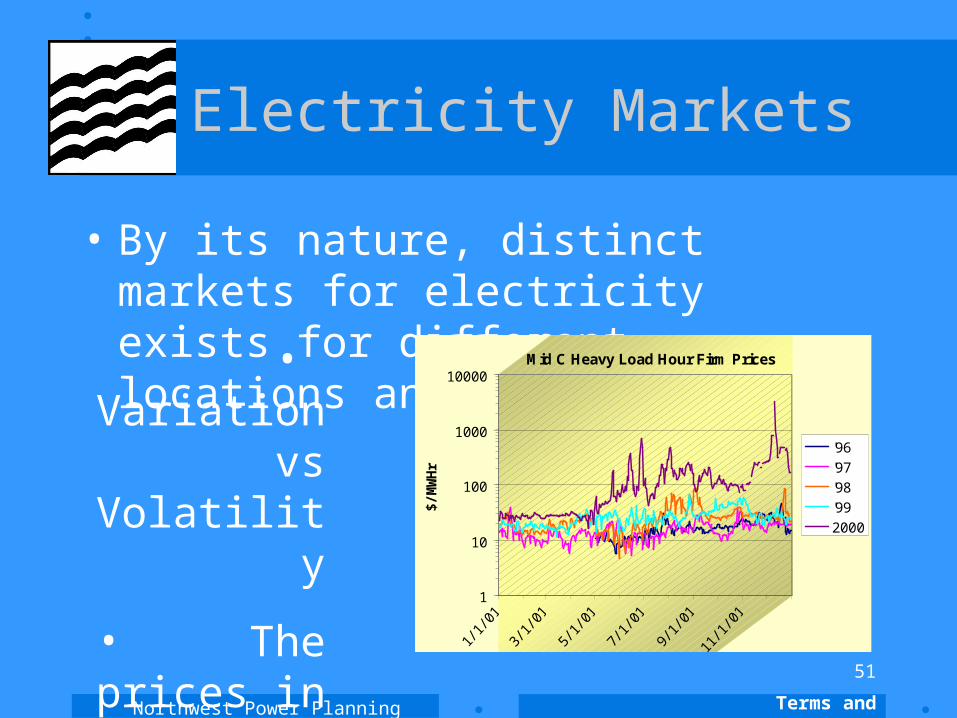
Electricity Markets
• By its nature, distinct markets for electricity exists for different locations and times
Terms and Concepts
Mid C Heavy Load Hour Firm Prices
1
10
100
1000
10000
1/1/
01
3/1/
01
5/1/
01
7/1/
01
9/1/
01
11/1
/01
$/M
WH
r'96
'97
'98
'99
2000
• Variation vs Volatility
• The prices in the figure at the right have NO volatility

Northwest Power Planning Council
52
Electricity Markets
• Different markets exist for– Regulation– Load following– Spinning Reserve– Operating Reserve– other Capacity
Terms and Concepts

Northwest Power Planning Council
53
Electricity Markets
• Different markets exist for– Forwards– Spot (hour-ahead forward?)
Terms and Concepts