10/15/2001 Mark J. Mitchell Team Leader Information and Research Affordability Challenges in the 21...
24
10/15/2001 Mark J. Mitchell Team Leader Information and Research Affordability Challenges in the 21 st Century
-
Upload
meghan-armstrong -
Category
Documents
-
view
214 -
download
0
Transcript of 10/15/2001 Mark J. Mitchell Team Leader Information and Research Affordability Challenges in the 21...

10/15/2001
Mark J. MitchellTeam Leader
Information and Research
Affordability Challenges in the 21st Century

10/15/2001
““To give away money is an easy matter, and in To give away money is an easy matter, and in any man’s power.any man’s power.
The First Financial Aid Administrator?
-- -- AristotleAristotle
But to decide to whom to give it, and how large and But to decide to whom to give it, and how large and when, and for what purpose and how, is neither in when, and for what purpose and how, is neither in every man’s power nor an easy matter.”every man’s power nor an easy matter.”
10/15/2001
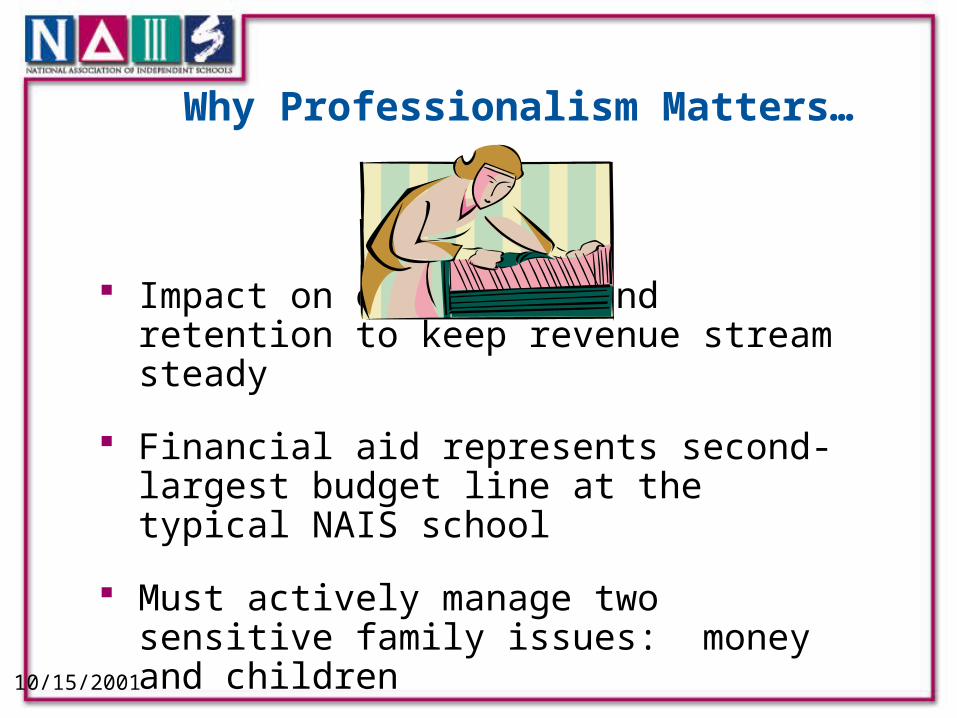
Impact on enrollment and retention to keep revenue stream steady
Financial aid represents second-largest budget line at the typical NAIS school
Must actively manage two sensitive family issues: money and children
Why Professionalism Matters…

10/15/2001
And yet…
Only 77 schools reported they have a full-time financial aid administrator
Median salary for financial aid administrators ranks 20th out of 24 positions gathered for NAIS survey
More than 70% have less than 10 years experience (over half have less than 5 years experience)
Source: NAIS Statistics Volume II, 2000-2001 http://www.nais.org/serve/admin/research/statsvol1/statlinks.html

10/15/2001
1999 NAIS Public Opinion Poll
Public asked to rate accuracy of descriptors of independent Public asked to rate accuracy of descriptors of independent schools and their studentsschools and their students
Tested adjectives commonly used to Tested adjectives commonly used to describe schoolsdescribe schools
– ““Affordable” and “diverse” were least descriptiveAffordable” and “diverse” were least descriptive
Gauged perceptions of the type of students Gauged perceptions of the type of students schools serveschools serve
– Students seen by many as “rich,” “snobby,” “bright,” Students seen by many as “rich,” “snobby,” “bright,” “intelligent”“intelligent”

10/15/2001
Rise in Median Tuition at NAIS Day Schools
0
2000
4000
6000
8000
10000
12000
1955 1960 1965 1970 1975 1980 1985 1990 1995 1998
TuitionIndexed w/ CPI
"Access and Affordability",NAIS
10/15/2001
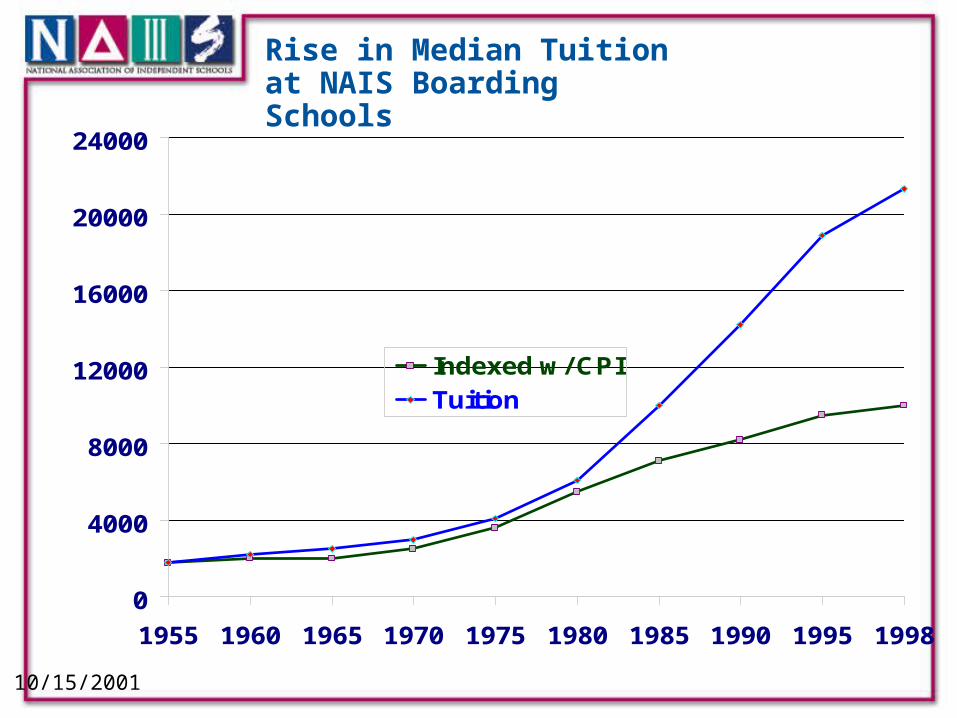
Rise in Median Tuition at NAIS Boarding Schools
0
4000
8000
12000
16000
20000
24000
1955 1960 1965 1970 1975 1980 1985 1990 1995 1998
Indexed w/ CPI
Tuition
"Access and Affordability",NAIS
10/15/2001
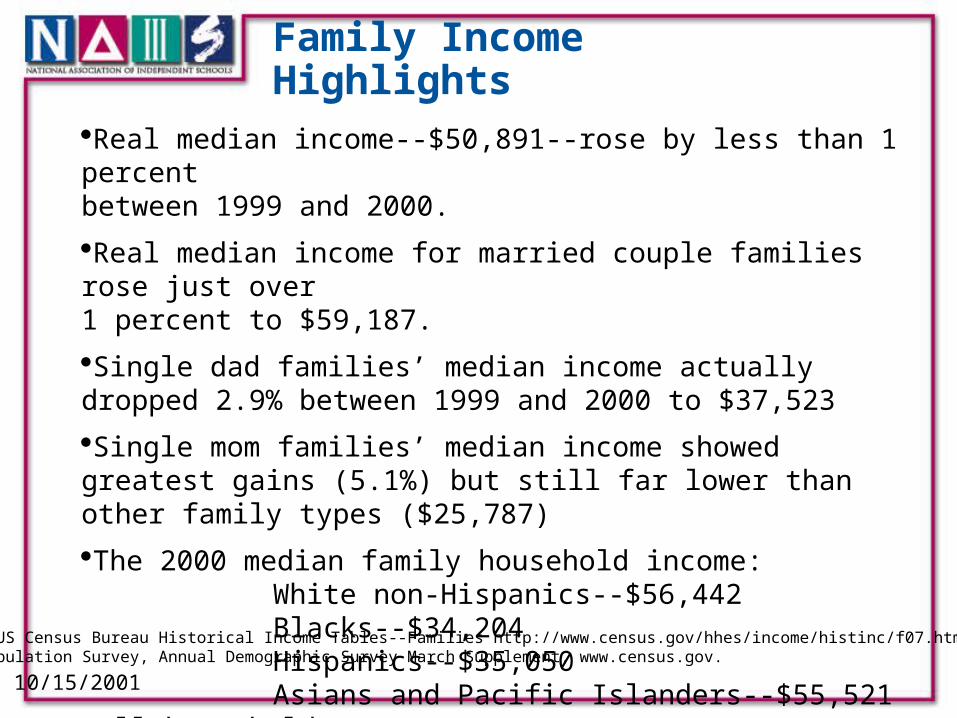
Family Income Highlights
Real median income--$50,891--rose by less than 1 percent between 1999 and 2000.
Real median income for married couple families rose just over 1 percent to $59,187.
Single dad families’ median income actually dropped 2.9% between 1999 and 2000 to $37,523
Single mom families’ median income showed greatest gains (5.1%) but still far lower than other family types ($25,787)
The 2000 median family household income:White non-Hispanics--$56,442 Blacks--$34,204 Hispanics--$35,050Asians and Pacific Islanders--$55,521 (all household
types)Sources: US Census Bureau Historical Income Tables--Families http://www.census.gov/hhes/income/histinc/f07.html and Current Population Survey, Annual Demographic Survey March Supplement, www.census.gov.

10/15/2001
Income Distributionby Household Type
0
10
20
30
40
50
60
White Black Hispanic Single Moms All
Less than 25K 25 - 50K
50 - 75K 75 - 100K
100K or more
Source: Current Population Survey: Annual Demographic Survey, March Supplement, U.S. Census Bureau website

10/15/2001
Population Projection
0
10
20
30
40
50
60
70
1995 2000 2010 2020 2030 2050
White Black Asian Hispanic Native American
Source: Source: American DemographicsAmerican Demographics, Oct. 1996, Oct. 1996
10/15/2001
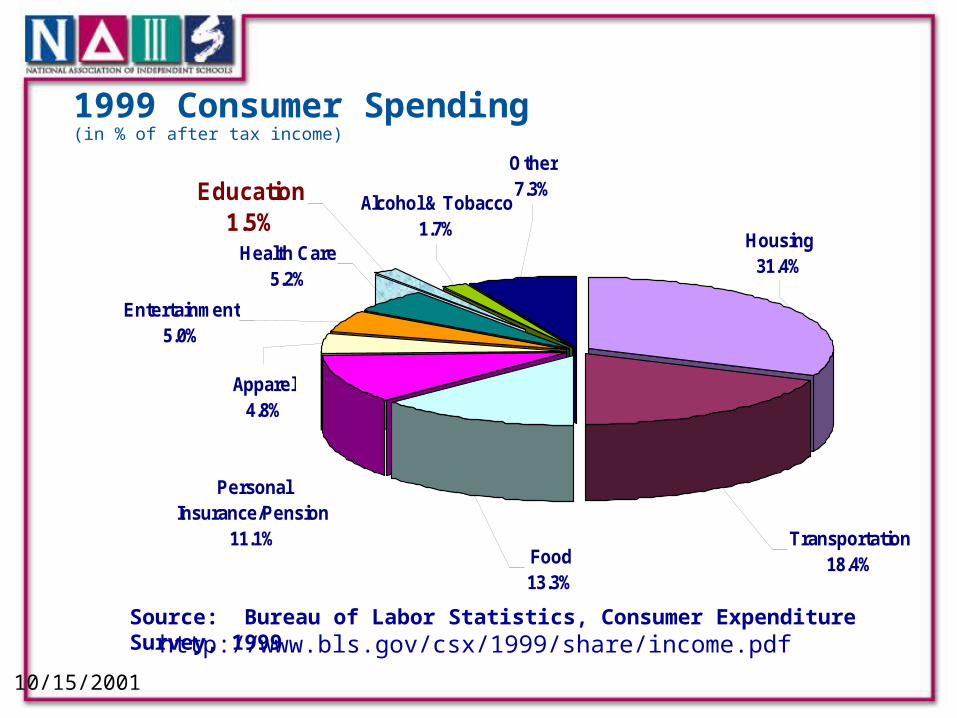
1999 Consumer Spending(in % of after tax income)
Housing31.4%
Alcohol & Tobacco1.7%
Transportation18.4%
Personal Insurance/Pension
11.1%
Apparel4.8%
Food13.3%
Entertainment5.0%
Education 1.5%
Health Care5.2%
Other7.3%
Source: Bureau of Labor Statistics, Consumer Expenditure Survey, 1999 http://www.bls.gov/csx/1999/share/income.pdf
10/15/2001
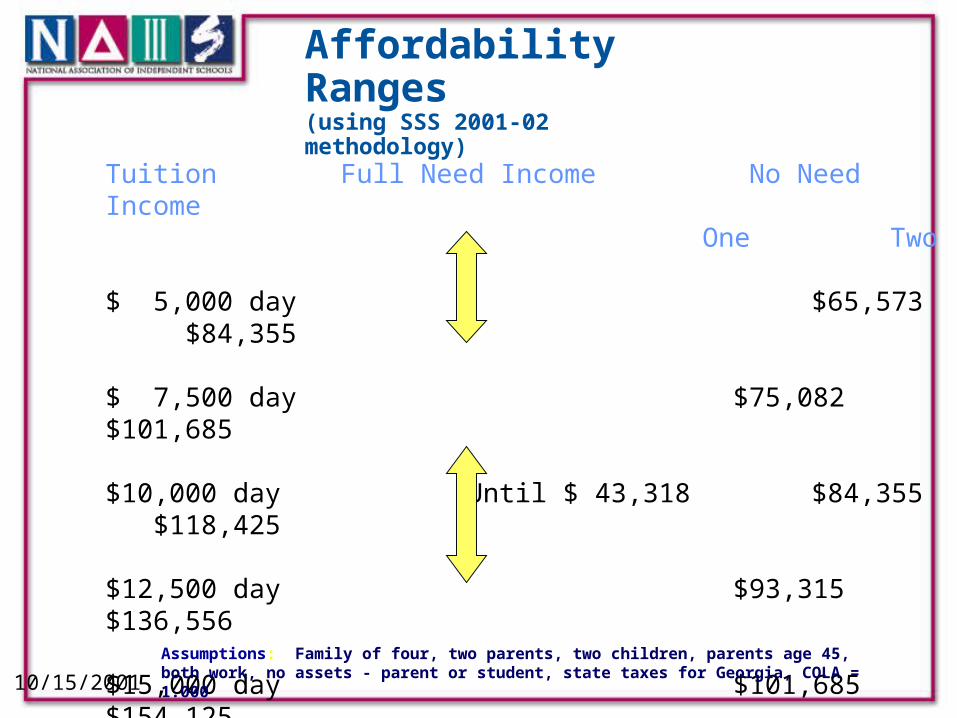
Affordability Ranges(using SSS 2001-02 methodology)
Tuition Full Need Income No Need Income One Two
$ 5,000 day $65,573 $84,355
$ 7,500 day $75,082 $101,685
$10,000 day Until $ 43,318 $84,355 $118,425
$12,500 day $93,315 $136,556
$15,000 day $101,685 $154,125
$20,000 day $118,425 $190,615
Assumptions: Family of four, two parents, two children, parents age 45, both work, no assets - parent or student, state taxes for Georgia, COLA = 1.000

10/15/2001
Income Distribution(U.S. Families)
Under $25KUnder $25K 22.6%22.6%$25K - $50K$25K - $50K 28.3%28.3%$50K - $75K$50K - $75K 21.2%21.2%$75K - $100K$75K - $100K 12.7%12.7%$100K+$100K+ 15.2%15.2%
Source: Current Population Survey: Annual Demographic Survey, March Supplement,
U.S. Census Bureau website

10/15/2001
Shifting Aid Applicant Pool
0
5
10
15
20
25
30
35
0-20K 20-40K 40-60K 60-80K 80-100K 100K +
99-0000-0101-02
Income RangeIncome Range
% o
f F
ilers
% o
f F
ilers
Source: School and Student Service for Financial Aid (SSS) processing system data
10/15/2001
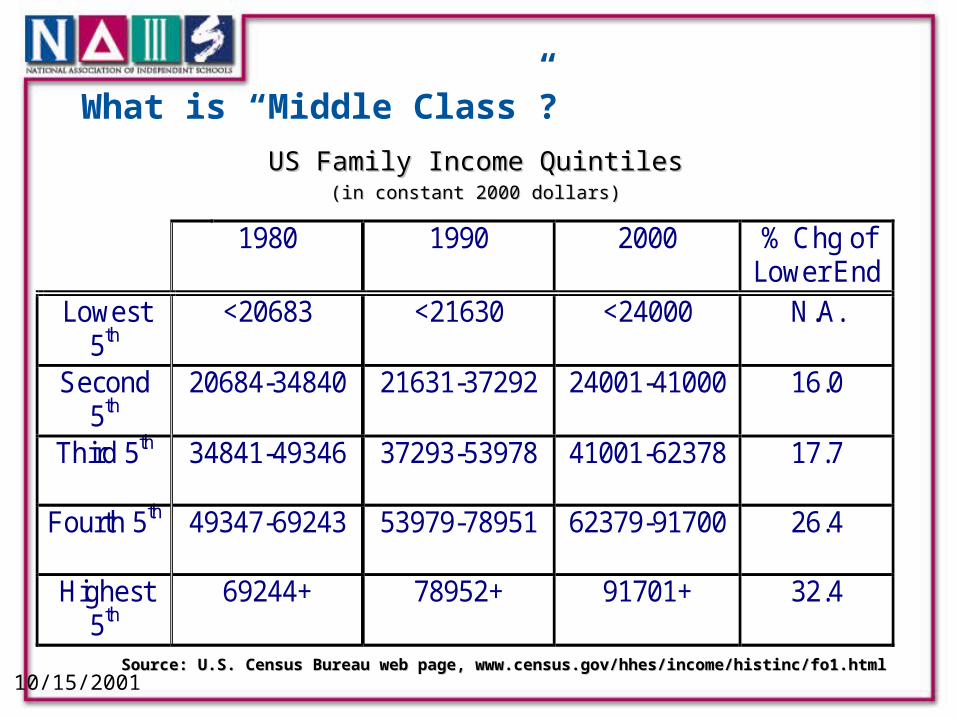
What is “Middle Class”?
1980 1990 2000 % Chg of Lower End
Lowest 5th
<20683 <21630 <24000 N.A.
Second 5th
20684-34840 21631-37292 24001-41000 16.0
Third 5th 34841-49346 37293-53978 41001-62378 17.7
Fourth 5th 49347-69243 53979-78951 62379-91700 26.4
Highest 5th
69244+ 78952+ 91701+ 32.4
US Family Income QuintilesUS Family Income Quintiles(in constant 2000 dollars)(in constant 2000 dollars)
Source: U.S. Census Bureau web page, www.census.gov/hhes/income/histinc/fo1.htmlSource: U.S. Census Bureau web page, www.census.gov/hhes/income/histinc/fo1.html
10/15/2001
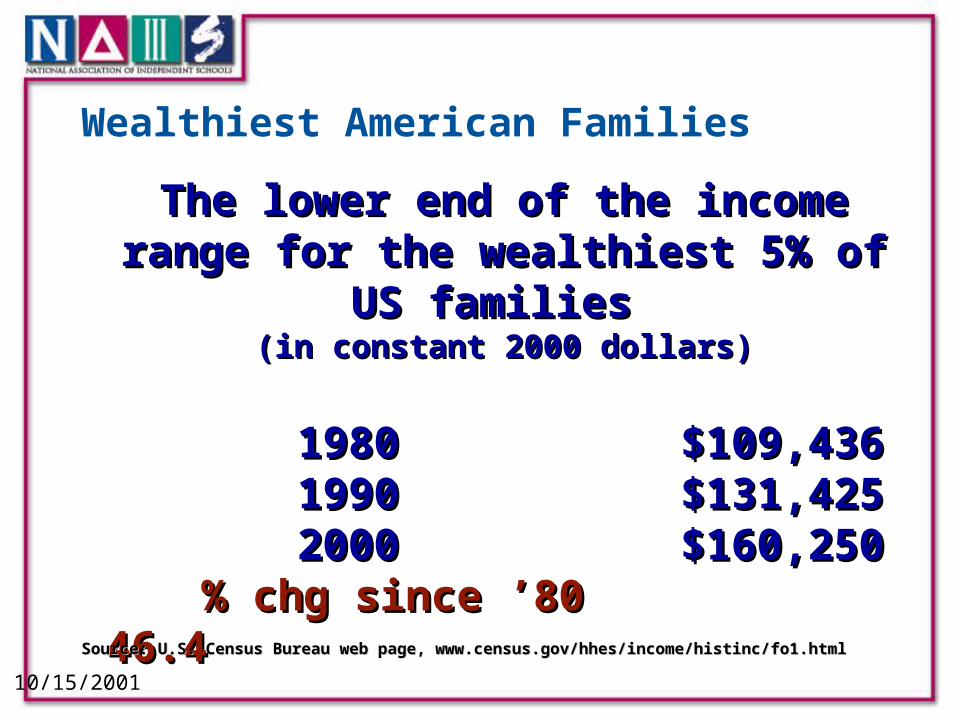
Wealthiest American Families
The lower end of the income range for the The lower end of the income range for the wealthiest 5% of US families wealthiest 5% of US families
(in constant 2000 dollars)(in constant 2000 dollars)
19801980 $109,436$109,43619901990 $131,425$131,42520002000 $160,250$160,250
% chg since ’80 % chg since ’80 46.4 46.4
Source: U.S. Census Bureau web page, www.census.gov/hhes/income/histinc/fo1.htmlSource: U.S. Census Bureau web page, www.census.gov/hhes/income/histinc/fo1.html
10/15/2001
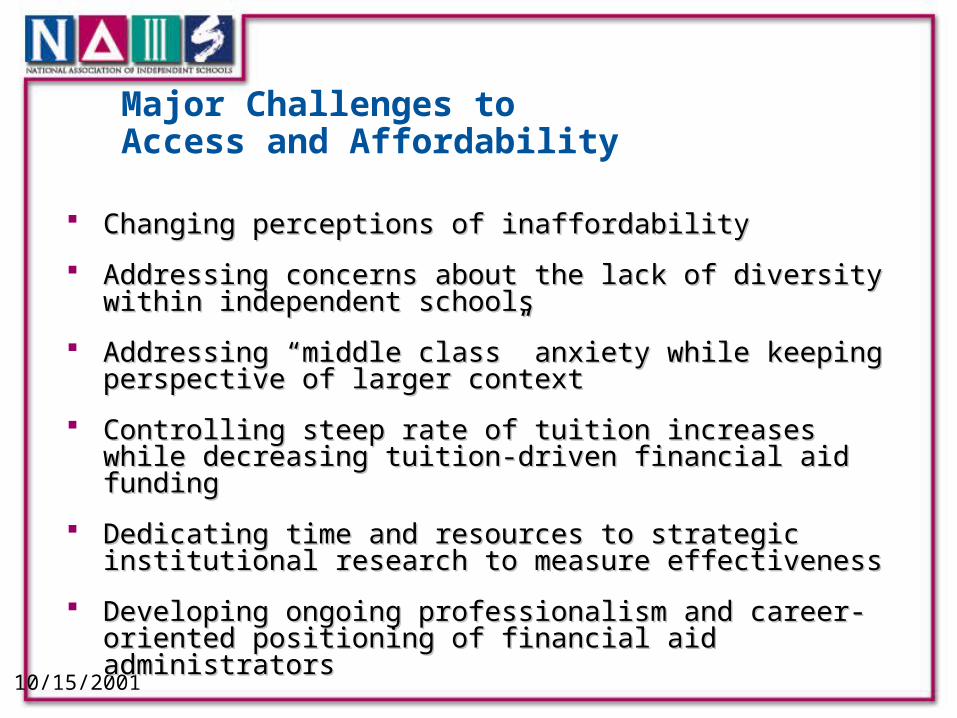
Major Challenges to Access and Affordability
Changing perceptions of inaffordabilityChanging perceptions of inaffordability
Addressing concerns about the lack of diversity within Addressing concerns about the lack of diversity within independent schoolsindependent schools
Addressing “middle class” anxiety while keeping Addressing “middle class” anxiety while keeping perspective of larger contextperspective of larger context
Controlling steep rate of tuition increases while decreasing Controlling steep rate of tuition increases while decreasing tuition-driven financial aid fundingtuition-driven financial aid funding
Dedicating time and resources to strategic institutional Dedicating time and resources to strategic institutional research to measure effectiveness research to measure effectiveness
Developing ongoing professionalism and career-oriented Developing ongoing professionalism and career-oriented positioning of financial aid administratorspositioning of financial aid administrators
10/15/2001
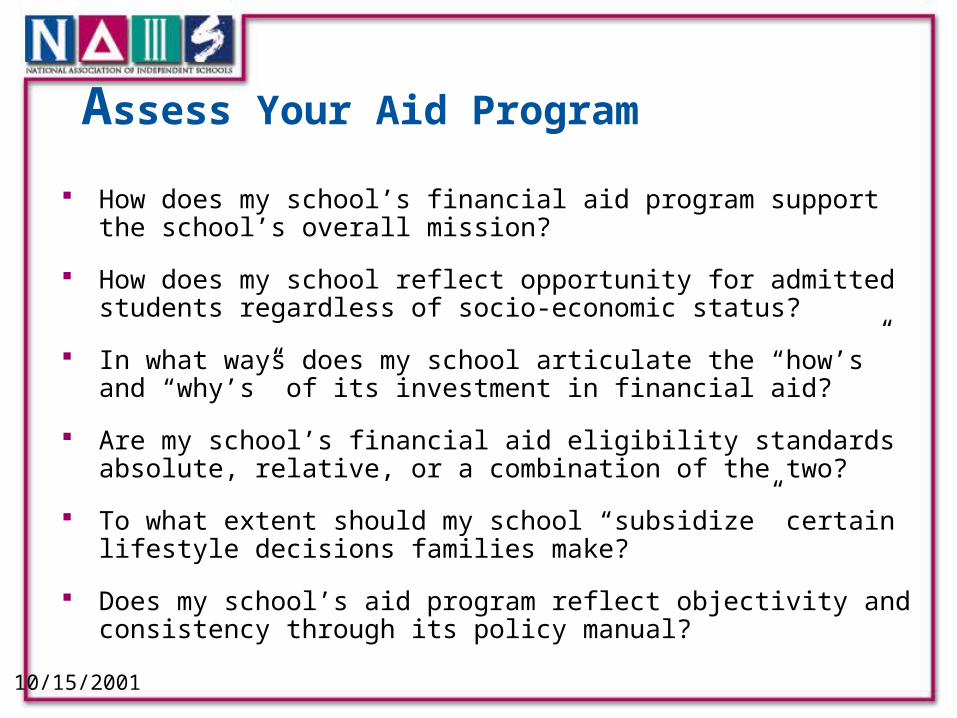
Assess Your Aid Program How does my school’s financial aid program support the school’s
overall mission?
How does my school reflect opportunity for admitted students regardless of socio-economic status?
In what ways does my school articulate the “how’s” and “why’s” of its investment in financial aid?
Are my school’s financial aid eligibility standards absolute, relative, or a combination of the two?
To what extent should my school “subsidize” certain lifestyle decisions families make?
Does my school’s aid program reflect objectivity and consistency through its policy manual?
10/15/2001
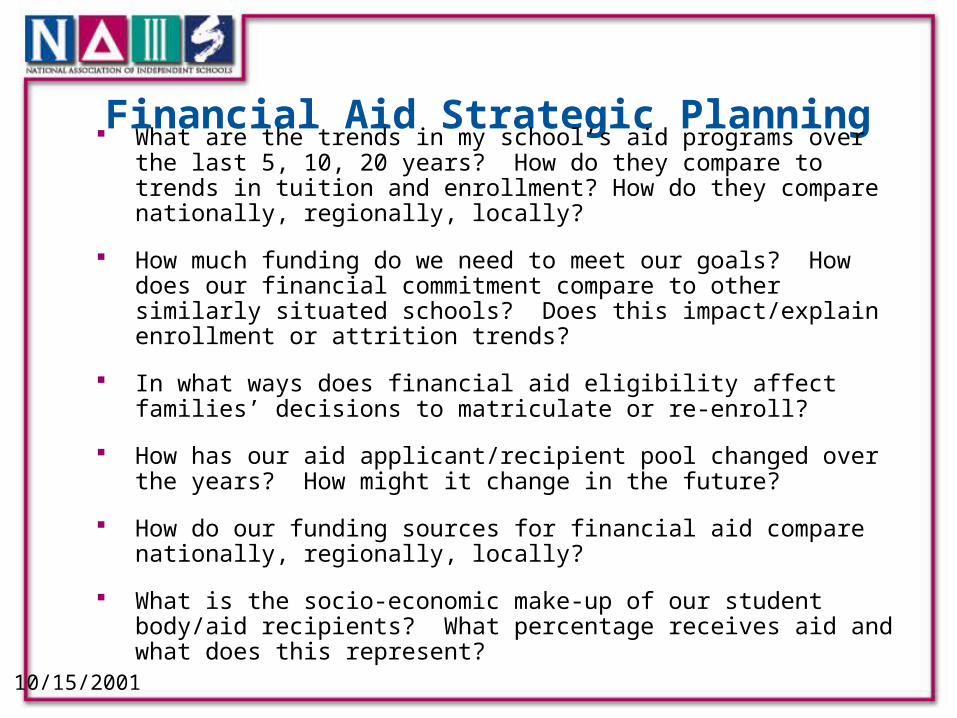
Financial Aid Strategic Planning What are the trends in my school’s aid programs over the last 5, 10, 20
years? How do they compare to trends in tuition and enrollment? How do they compare nationally, regionally, locally?
How much funding do we need to meet our goals? How does our financial commitment compare to other similarly situated schools? Does this impact/explain enrollment or attrition trends?
In what ways does financial aid eligibility affect families’ decisions to matriculate or re-enroll?
How has our aid applicant/recipient pool changed over the years? How might it change in the future?
How do our funding sources for financial aid compare nationally, regionally, locally?
What is the socio-economic make-up of our student body/aid recipients? What percentage receives aid and what does this represent?

10/15/2001
Average Award Levels
0
1000
2000
3000
4000
5000
6000
7000
8000
1988 1989 1990 1991 1992 1993 1994 1995 1996 1997 1998 1999 2000
Avg
Aw
d--
Need
Base
d
Need No Need
10/15/2001
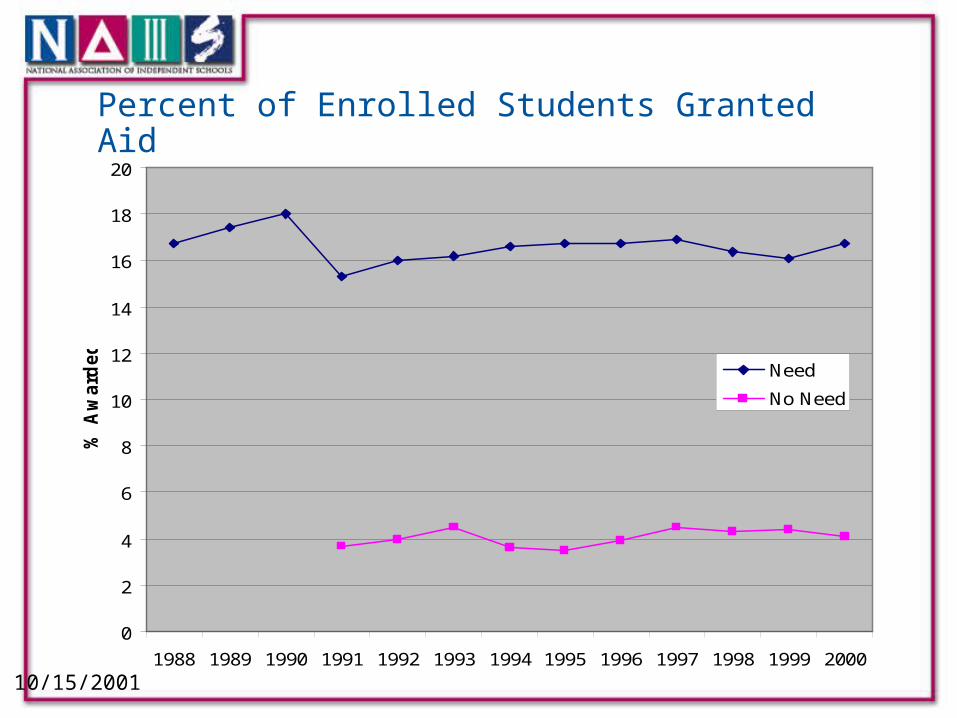
0
2
4
6
8
10
12
14
16
18
20
1988 1989 1990 1991 1992 1993 1994 1995 1996 1997 1998 1999 2000
% A
ward
ed
Need
No Need
Percent of Enrolled Students Granted Aid
10/15/2001
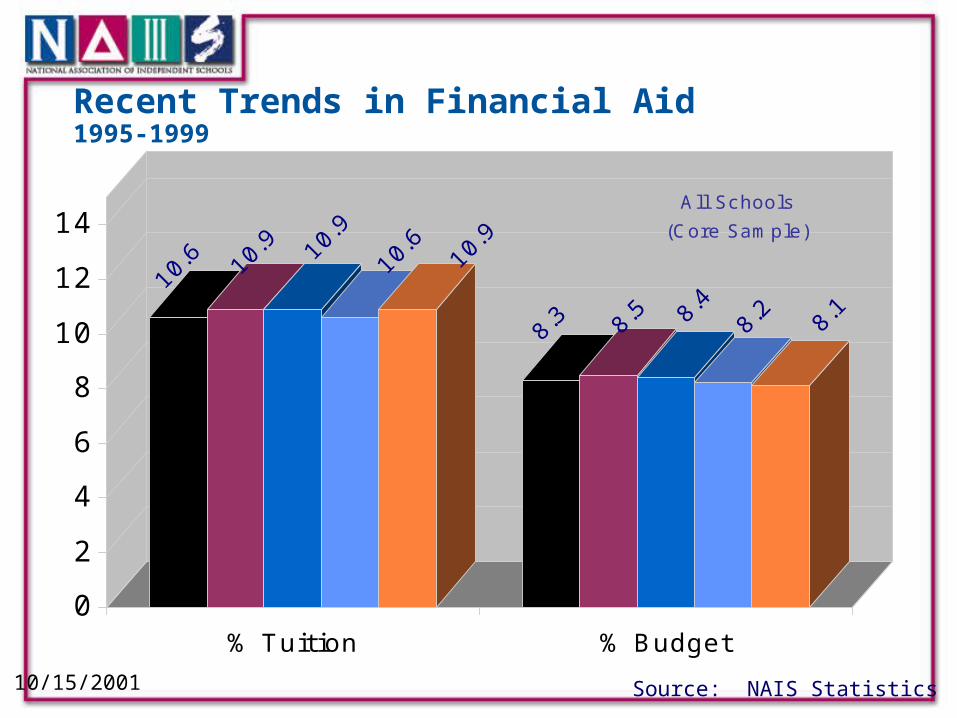
Recent Trends in Financial Aid1995-1999
10.6
10.9 10.
9
10.6
10.9
8.3 8.5 8.48.2 8.1
0
2
4
6
8
10
12
14
% Tuition % Budget
All Schools
(Core Sample)
Source: NAIS Statistics

10/15/2001
Resources for Support, Information
Professional development workshops, conferences
Financial Aid Administration for Schools, 2nd Edition
NAIS statistics
Sample materials shared by schools
Scholarship providers directory
Education Financing Resources List
Fee waiver suppliers
State, regional financial aid groups

10/15/2001
““It is less important to redistribute It is less important to redistribute wealth than it is to redistribute wealth than it is to redistribute opportunity.” opportunity.”
-- Arthur H. Vandenberg-- Arthur H. Vandenberg
In the face of these challenges, always remember The Big Picture: