10 February 2010 - TodayIR · A/P Turnover Days Cash Cycle Days Inventory Turnover Days 11. 0 3,000...
27
FY2009/10 Third Quarter Results Announcement 10 February 2010
Transcript of 10 February 2010 - TodayIR · A/P Turnover Days Cash Cycle Days Inventory Turnover Days 11. 0 3,000...

FY2009/10 Third Quarter Results Announcement
10 February 2010

This presentation may contain certain projection and forward-looking statements that involve risks,
uncertainties and assumptions. If the risks or uncertainties ever materialize or the assumptions prove
incorrect, the results of Digital China may differ materially from those expressed or implied by such
forward-looking statements and assumptions. All statements other than statements of historical fact are
statements that could be deemed forward-looking statement, including but not limited to any projections
of revenue, margins, expenses, charges, earnings or other financial items; any statements of the plans,
strategies, and objectives of management for future operations, including execution of any restructuring
plans; any statements concerning the expected development, performance or market share relating to
products or services; any statements of expectation or belief; and any statements of assumptions
underlying any of the foregoing. Risks, uncertainties and assumptions include macroeconomic and
geopolitical trends and events; execution and performance of contracts by suppliers, customers and
partners; employee management issues; the challenge of managing asset levels, including inventory;
the difficulty of aligning expense levels with revenue changes; expectations and assumptions relating to
the execution and timing of workforce restructuring programs.
In addition, statistical and other information relating to the PRC and the technology industry contained in
this presentation have been compiled from various publicly available official or unofficial sources
generally believed to be reliable. However, the quality of such source materials cannot be guaranteed.
Moreover, statistics derived from multiple sources may not be prepared on a comparable basis.
Disclaimer
2

AGENDA
Business Overview
Financial Review
Business Review by Segments
Services
Supply Chain Services
Systems
Distribution
Company Outlook
Management Remarks
3
Business Overview
4
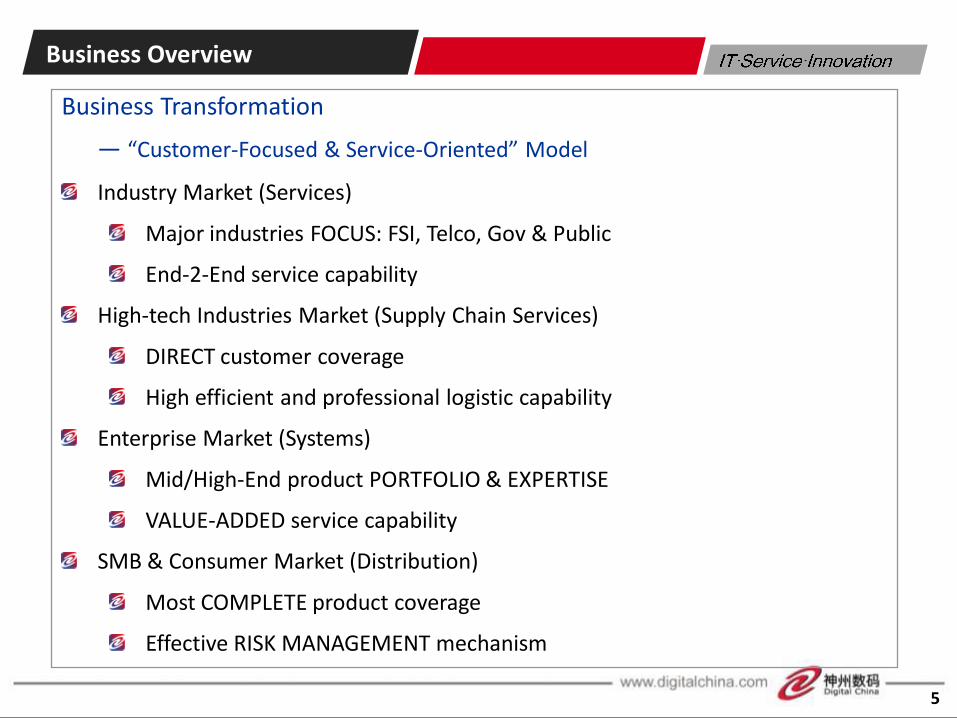
Business Transformation
— “Customer-Focused & Service-Oriented” Model
Industry Market (Services)
Major industries FOCUS: FSI, Telco, Gov & Public
End-2-End service capability
High-tech Industries Market (Supply Chain Services)
DIRECT customer coverage
High efficient and professional logistic capability
Enterprise Market (Systems)
Mid/High-End product PORTFOLIO & EXPERTISE
VALUE-ADDED service capability
SMB & Consumer Market (Distribution)
Most COMPLETE product coverage
Effective RISK MANAGEMENT mechanism
Business Overview
5

Financial Review
6
Financial Highlights
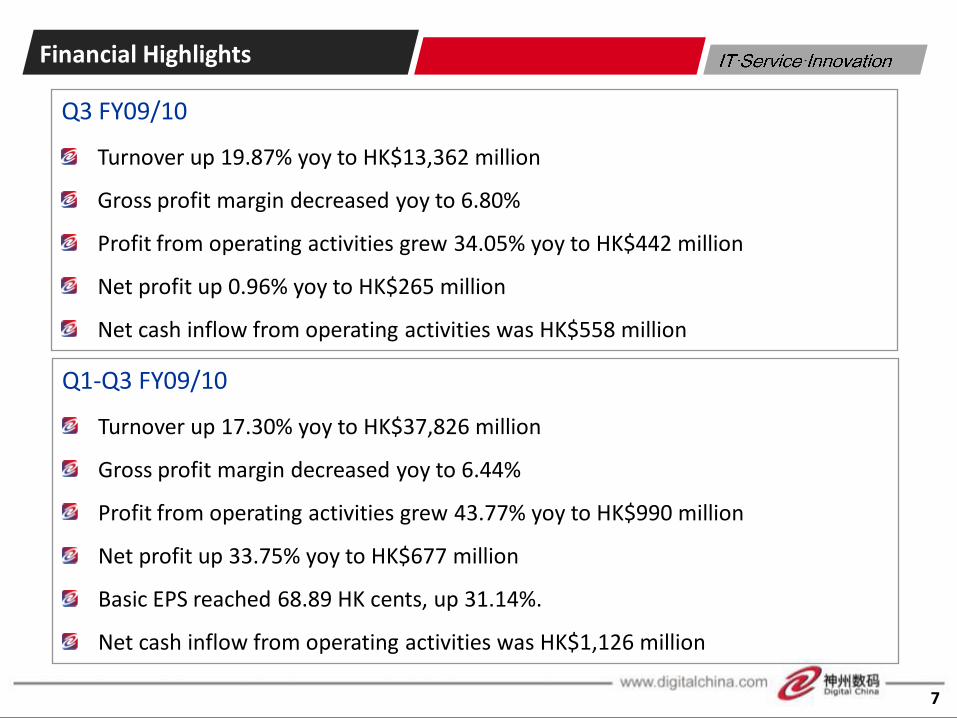
Q3 FY09/10
Turnover up 19.87% yoy to HK$13,362 million
Gross profit margin decreased yoy to 6.80%
Profit from operating activities grew 34.05% yoy to HK$442 million
Net profit up 0.96% yoy to HK$265 million
Net cash inflow from operating activities was HK$558 million
7
Q1-Q3 FY09/10
Turnover up 17.30% yoy to HK$37,826 million
Gross profit margin decreased yoy to 6.44%
Profit from operating activities grew 43.77% yoy to HK$990 million
Net profit up 33.75% yoy to HK$677 million
Basic EPS reached 68.89 HK cents, up 31.14%.
Net cash inflow from operating activities was HK$1,126 million

Income Statement Highlights
HK$ millionFY2009/10
Q1-Q3
FY2009/10
Q3
FY2008/09
Q1-Q3
FY2008/09
Q3
Turnover 37,826 ↑17.30% 13,362 ↑19.87% 32,249 11,147
Gross profit margin (%) 6.44 ↓49 bps* 6.80 ↓14bps* 6.93 6.94
Other income and gains 469 ↑42.35% 227 ↑63.50% 329 139
Operating expenses 1,914 ↑2.04% 693 ↑19.06% 1,876 582
Profit from operating activities 990 ↑43.77% 442 ↑34.05% 689 330
Net profit 677 ↑33.75% 265 ↑0.96% 506 262
Basic EPS (HK cents) 68.89 ↑31.14% - - 52.53 -
As of 31 December 2009
As of 31 December 2008
ROE 16.71% 16.83%
ROA 4.14% 4.23%
Current Ratio 1.36x 1.41x
Quick Ratio 1.10x 1.09x
Capital Expenditure (HK$ million) 52 64
8
* bps=basic points

Segment Breakdown
HK$ million
Distribution Systems Supply Chain Services Consolidated
09/10
Q1-Q3
Y-o-Y
change
09/10
Q1-Q3
Y-o-Y
Change
09/10
Q1-Q3
Y-o-Y
Change
09/10
Q1-Q3
Y-o-Y
Change
09/10
Q1-Q3
Y-o-Y
change
Revenue 17,034 ↑17.3% 10,849 ↑7.7% 6,650 ↑87.6% 3,293 ↓19.8% 37,826 ↑17.3%
Gross Profit 727 ↑14.4% 975 ↑4.9% 225 ↑53.4% 508 ↓3.0% 2,436 ↑9.0%
Gross Profit Margin (%) 4.27% ↓11 bps 8.98% ↓14 bps 3.39% ↓75 bps 15.44% ↑267 bps 6.44% ↓49 bps
Other Income
and Gains0.4 ↓99.2% 13 ↓79.6% 0.2 ↓91.1% 75 ↑139.8% 469 ↑42.4%
Operating expenses (553) ↑19.0% (660) ↓2.8% (162) ↑61.0% (400) ↓16.7% (1,914) ↑2.0%
EBIT 188 ↓13.5% 317 ↑1.6% 61 ↑35.7% 188 ↑140.7% 990 ↑43.8%
Finance Costs (93) ↓31.4%
Tax (157) ↑87.6%
Net profit 677 ↑33.8%
Distribution
727
30%
Systems
975
40%
FY09/10 Q1-Q3 Gross Profit: HK$ 2,436 million
HK$ millionServices
508
21%
9
Supply Chain
Services
225
9%
Distribution
636
28%
Systems
929
42%
FY08/09 Q1-Q3 Gross Profit: HK$ 2,235 million
HK$ millionServices
524
23%
Supply Chain
Services
147
7%
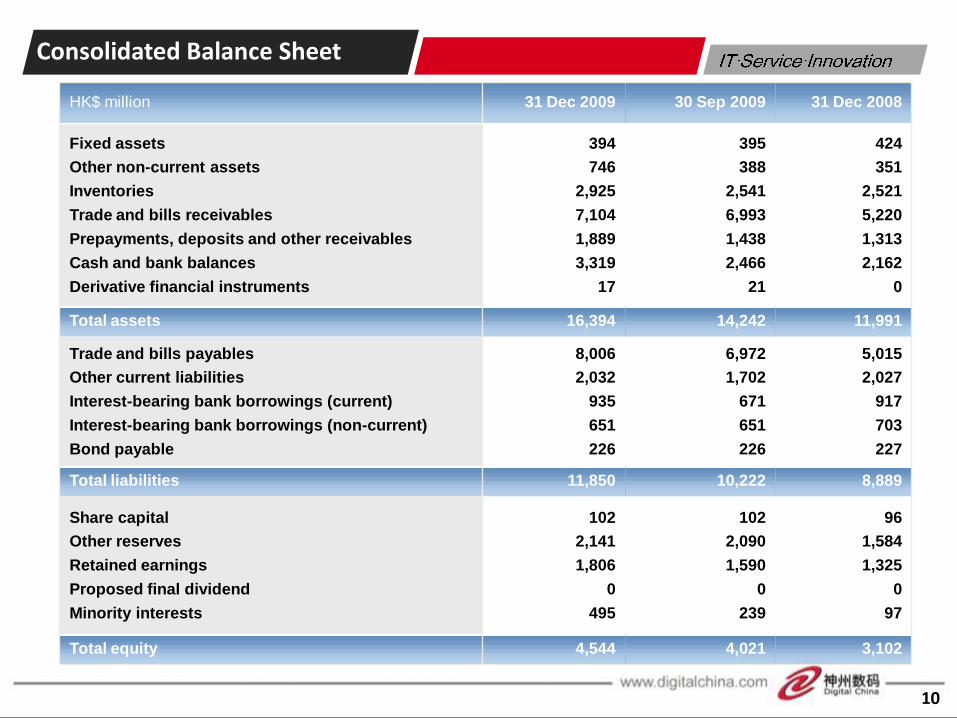
Consolidated Balance Sheet
HK$ million 31 Dec 2009 30 Sep 2009 31 Dec 2008
Fixed assets
Other non-current assets
Inventories
Trade and bills receivables
Prepayments, deposits and other receivables
Cash and bank balances
Derivative financial instruments
394
746
2,925
7,104
1,889
3,319
17
395
388
2,541
6,993
1,438
2,466
21
424
351
2,521
5,220
1,313
2,162
0
Total assets 16,394 14,242 11,991
Trade and bills payables
Other current liabilities
Interest-bearing bank borrowings (current)
Interest-bearing bank borrowings (non-current)
Bond payable
8,006
2,032
935
651
226
6,972
1,702
671
651
226
5,015
2,027
917
703
227
Total liabilities 11,850 10,222 8,889
Share capital
Other reserves
Retained earnings
Proposed final dividend
Minority interests
102
2,141
1,806
0
495
102
2,090
1,590
0
239
96
1,584
1,325
0
97
Total equity 4,544 4,021 3,102
10

Turnover Days for the Group
26.94 22.89
16.79
FY07/08 Q1-Q3 FY08/09 Q1-Q3 FY09/10 Q1-Q3
30.25
37.60
47.40
FY07/08 Q1-Q3 FY08/09 Q1-Q3 FY09/10 Q1-Q3
21.30 22.85 19.31
FY07/08 Q1-Q3 FY08/09 Q1-Q3 FY09/10 Q1-Q3
35.89 37.64
44.88
FY07/08 Q1-Q3 FY08/09 Q1-Q3 FY09/10 Q1-Q3
A/R Turnover Days
Cash Cycle DaysA/P Turnover Days
Inventory Turnover Days
11

0 3,000 6,000 9,000
Toshiba
AMD
INTEL
Asus
Acer
Lenovo
IBM
DELL
Cisco
HP
Concentration Analysis
% of the Group’s total procurement
Purchase from Top 10 Suppliers accounted for 70% of the Group’s total procurement
20%
9%
9%
8%
6%
6%
6%
2%
2%
2% HK$ million
12
Business Development
New Initiatives:- Ensure the successful delivery of key projects within major accounts
- Active involvements in the "master purchase" opportunities to guarantee market leadership
- Grasp the year-end spending season to support the growth
- Further expansion into the retail outlets

Segment Review:
Industry Market (Services)
13

Services Segment FY09/10 Q1-Q3
Turnover decreased by 19.75%
Gross profit margin up to 15.44%
Net profit achieved HK$188 million
Launched Core banking system in Jinshang Bank
Issued Citizen Card in Wuxi City
Awarded the BPO contract for Jinzhong Bank
HK$ million
FY2009/10 Q1-Q3 Services Business:HK$3,293 million
Others10%
Finance18%
Telecom50%
Gov’t22%
BU Quarterly Revenue
14
0
500
1000
1500
2000
FY08/09 Q1 Q2 Q3 Q4 FY09/10 Q1 Q2 Q3

Digital China banking industry total solution ModelB@nk 2.0
Software Infrastructure(Middle Ware, Database, Operation System)
ESB & Financial Service Definition
Data Integration Platform & Financial Data Model
MB Finteractive MB Finnovator MB FintelligenMB Fusion
GL
Co
ntrib
utio
n
Man
agem
ent
Acco
un
ting
PB
OC
CB
RC
SAFE
Risk Management
Finance & Performance
Regulatory
Core BankingTreasu
ry
Trade Fin
ance
Loan
Dep
osit
Paym
ent
Financial Product & Service
Interm
ediate
Bu
siness
Card
Cash
M
anagem
ent
Loan
We
alth
Marketing & Sales
CRM
Loyalty
ECIF
integratio
n
con
tract
Cu
stom
er Service
Marketin
g
Sales
Channel Integration
Multi-Chanel Platform
Bank & Corp. Direct Link
VIP
E-Banking
Intern
et
Mo
bile
ATM
Branch
Teller
Payment Gateway
CNAPS CUP SWIFT
Teleph
on
e
Customer Value Case Banking Solutions
Cred
it
ALM
Op
eration
15

Customer Value Case Telecom Solution
B2B
Integratio
n P
ortal
CorpServiceProducts
CorpCustomer
ISPCustomerService
Gateway / Integrated Business Portal / ISP Systems
3rd PartySolution
Unified Business Support Portal
Concerted Network
Data Integration Portal
BSS A
pp
lication
Pro
cess Integratio
n P
ortal
Operation Analysis System
Billing & Settlement
CRM
HR & KnowledgeManagement
Gateway & Monitoring
Ma
na
gem
ent
Info
rmat
ion
Sys
tem
Quality Control
Complaints
Settlement
Channel Mgt
Product Mgt
Customer Service
Mobile/Fixed-line/Broadband ServiceBOSS/BSS
16

0 100 200 300 400 500
State Taxation
CDB
CNPC
CCB
PICC
China Telecom
Alibaba
China Mobile
Zhongjie
China Unicom
Customer Analysis
HK$ million1.48%
1.95%
2.59%
2.84%
4.20%
4.60%
4.67%
14.63%
11.34%
8.63%
Sales to Top 10 Customers accounted for 36.51% of Services Business’s revenue
% as of Services Business’s revenue
Sales to Top 10 Customers accounted for 56.93% of Services Business’ revenue
17

Segment Review:
High-tech Industries Market(Supply Chain Services)
18

Supply Chain Services Segment FY09/10 Q1-Q3
One-stop supply chain services, comprising logistics, business flow, capital flow and information flow
Targeting IT manufacturers, major vertical account customers, and other high-value products manufacturers
Revenue up 87.58% to HK$6,650 million
FA grew up 85.43%, CES with 100.95%
FY09/10 Q1-Q3 Supply Chain Services Business:HK$6,650 million
Others3%
CES26%
FA71%
19
Distribution
Supply ChainServices
Distribution
Before
Now
Segment Review:
Enterprise Market (Systems)
20

Systems Segment FY09/10 Q1-Q3
Turnover increased by 7.71% yoy.
Effective business expansion into Key Regional Clients, turnover increased by 52.99% yoy
Product-based services revenue sustained a “faster than industry-average” growing trend
Awarded China Development Bank’s Video Conference Solution
Digital China awarded with Petrol China’s Management System for gas station
Others 20%
Packagedsoftware
11%
Storageproducts
16%
Networkingproducts
30%
Unix servers23%
FY09/10 Q1-Q3 Systems Business: HK$10,849 million
21

Segment Review:
SMB & Consumer Market (Distribution)
22

Distribution Segment FY09/10 Q1-Q3
Turnover grew 17.26% yoy
Aggressive expansion into 4th-6th tier cities, turnover increased 70% yoy
Cooperated with BlackBerry
Notebook grew 52% yoy, PC Servers with 49%
Over 400 “@PORT” franchise retail outlets
NotebookComputers
38%
Others 1%
Consumer ITProducts
11%
Accessories9%
Peripherals14%
DataProjectors
2%
PC Servers15%
DesktopComputers
10%
FY09/10 Q1-Q3 Distribution Business:HK$17,034 million
23

Company Outlook
24

-To steer all the business segments to fulfill the pre-set objectives, and ensure a healthy and stable growing year
-To fully leaverage all business initiatives to strengthen the leadership both in marketshare and in major business segments
- Will monitor the opportunities as well as the challenges brought by the macro economic trends, and lay out a practical & comprehensive business plan for further development in the coming year.
Company Outlook
25

26

27