1 Using the Minimum Standards in Nutrition 2.4 Terre des Hommes - Afghanistan photo.
51
1 Using the Minimum Standards in Nutrition 2.4 Terre des Hommes - Afghanistan photo
-
Upload
clarence-haynes -
Category
Documents
-
view
217 -
download
0
Transcript of 1 Using the Minimum Standards in Nutrition 2.4 Terre des Hommes - Afghanistan photo.

1
Using the Minimum Standards in Nutrition2.4
Terre des Hommes - Afghanistan photo

2
Food Security, Nutrition, and Food Security, Nutrition, and Food Aid : Why One Food Aid : Why One
Chapter?Chapter?
Big Topic overallBig Topic overall Food logistics and nutrition/health departments Food logistics and nutrition/health departments
in NGOs are often separatein NGOs are often separate But, the components are so intertwined, But, the components are so intertwined,
they they must must be considered togetherbe considered together
and
NUTRITION FOOD AID
and
FOOD SECURITY
3
Food Security, Nutrition and Food Aid
Nutrition Assessment & Analysis
Food Security Assessment & Analysis
NutritionFood Security Food Aid
General support
Correction of malnutrition
Food aidplanning
Food aidmanagement
General food security
Primary production
Income & Employment
Foodhandling
Supply chainmanagement
Distribution
Rationplanning
Appropriate& Acceptable
Quality& Safety
Moderate
Severe
Micronutrient
Allgroups
At-riskgroups
Access to markets
See page 106

4
Food Security and Food Aid is Food Security and Food Aid is about...about...
Markets Logistics Livelihood/Employment Displacement Large Populations Rations: Dry food Warehouses Distribution
FAO photo

5
Nutrition is about…..Nutrition is about….. Therapy Children “under-fives” Targeted “intra-family” Wet Foods, special
foods Focused on immediate
recovery, health outcomes
Micronutrients Diseases stemming from
nutrient deficiencies
UN photo

6
“Where people are at risk of malnutrition, programme decisions are based on a demonstrated understanding of the causes, type, degree and extent of malnutrition, and the most appropriate response.”
Assessment and analysis standard 2: nutrition
UNICEF photo

7
nutrition (or malnutrition)nutrition (or malnutrition)
AVAILABILITY(FOOD volume,Storage, irrigation,Climate, rainfall,Seeds, drought,Harvest manpower)
ACCESS(Trade, $, Infrastructure, Merchants, Borders,Government policies,Subsidies, incentives,War zones, battle lines)
BIO-UTILIZATON(Caretaker behavior, knowledge, family structure, hookworms, hygiene, cuisine patterns, micronutrient synergy or antagonism…)

8
Formal and non-formal institutions, political and Ideological superstructure, economic
Structure, potential resources
( please see page 136 of the 2004 Edition)
InadequateHousehold food
security
InadequateMaternal and
Child care
Insufficient Services and unhealthy
environment
Inadequate dietary intake Disease
Malnutrition and death

9
“The nutritional needs of the population are met”
General nutrition support standard 1: all groups
UNHCR eCentre photo
( please see page 137 of the 2004 Edition)
10
“The nutritional and support needs of identified at –risk groups are met”
General nutrition support standard 2: at risk groups
UNICEF photo
( please see page 140 of the 2004 Edition)

11
Bell curve of population wt/ht Bell curve of population wt/ht (or any anthropometric measure we use)(or any anthropometric measure we use)
An International Yardstick,
using U.S. NCHS growth as standard
Most nutritional assessment deals with this...

12
Common Nutritional Assessment Indexes: Weight for Height
WEIGHT HEIGHT
Salter Scale Collapsable Measure

13
Height,…..or
Weight
...Length Height for Weight Wall Chart
Weight for Height Chart

14
For any bell curve, a For any bell curve, a “Z”“Z” value or score is, value or score is, simply, the number of standard deviations simply, the number of standard deviations
away from the middle (the average or mean)away from the middle (the average or mean)
-3 Z -2Z -1Z 0Z +1Z +2Z +3Z

15
Measure Adult Malnutrition Measure Adult Malnutrition using “BMI” - Body Mass using “BMI” - Body Mass
IndexIndex
02468
101214161820
BMI
SEVE mild normal
BMI == weight / ht2

16
Weight for Height AdvantagesWeight for Height Advantages
Case Management:Case Management: Wt/Ht allows us Wt/Ht allows us to monitor a child’s improvement to monitor a child’s improvement from day to day or week to week from day to day or week to week with more visible precisionwith more visible precision
Demonstration:Demonstration: We want to We want to promote such use of “growth promote such use of “growth monitoring” as part of MCH monitoring” as part of MCH programs everywhere.programs everywhere.

17
Remember: Remember: Anthropometric measures Anthropometric measures
are not malnutrition...are not malnutrition...
UNHCR, WFP, CARE use wt/htUNHCR, WFP, CARE use wt/ht ICRC, ACF, Save the Children use ICRC, ACF, Save the Children use
MUACMUAC Save UK uses the population mean Save UK uses the population mean
and not subpopulationsand not subpopulations

18From RNIS publication 22, December 1997
What is the definition of “malnutrition” being used n this report? Are there other definitions?
19
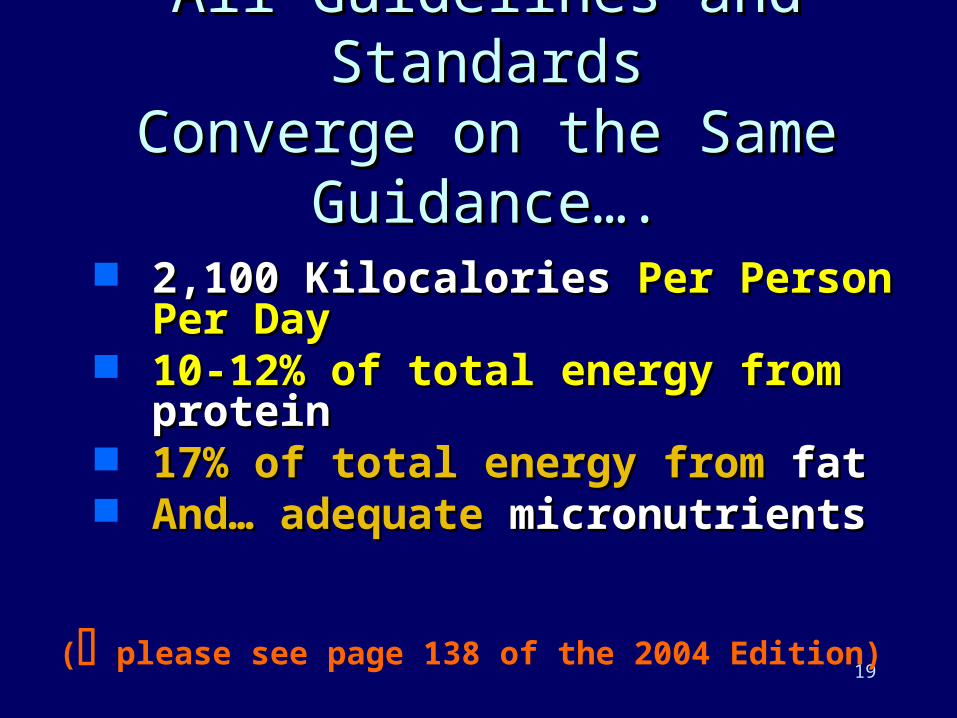
All Guidelines and All Guidelines and StandardsStandards
Converge on the Same Converge on the Same Guidance….Guidance….
2,100 Kilocalories2,100 Kilocalories Per Person Per Person Per DayPer Day
10-12% of total energy from 10-12% of total energy from proteinprotein
17% of total energy from 17% of total energy from fatfat And… adequate And… adequate
micronutrientsmicronutrients
( please see page 138 of the 2004 Edition)

20
Individual Need for Individual Need for CaloriesCalories
Some people need 1,000 kcal/day?Some people need 1,000 kcal/day? Some people need 5,000 kcal/day?Some people need 5,000 kcal/day? What does the distribution depend What does the distribution depend
on?on? What does the distribution look likeWhat does the distribution look like

21
Who have the greatest Who have the greatest needs per capita per day needs per capita per day
in kcals?in kcals?
1. Lactating women1. Lactating women 2. Pregnant women2. Pregnant women 3. People doing heavy physical 3. People doing heavy physical
activityactivity 4. People living in severe cold 4. People living in severe cold
weatherweather

22
Kilocalories per gram Kilocalories per gram of food constituentsof food constituents
4
4
9
0
0
0
0 2 4 6 8 10
Carbohyd
PROTEIN
FAT/OIL
WATER
SALT
ROUGHAGE

23
So, What is the major Food So, What is the major Food Item?Item?
Grain (staple). Typically:
– wheat, wheat, – maize, (corn) maize, (corn) – rice, rice, – sorghum or sorghum or – a flour.a flour.
24
Okay, Let’s design a Okay, Let’s design a general ration using...general ration using...
Foods that are available to usFoods that are available to us Foods that are reasonably Foods that are reasonably
inexpensiveinexpensive Foods that won’t spoil quicklyFoods that won’t spoil quickly Foods that are moderately Foods that are moderately
acceptableacceptable Foods that achieve nutrition Foods that achieve nutrition
objectivesobjectives

25
SUGAR
CANNED FISH
RICE LENTILS
OIL SALT
Exercise – the foods below will be distributed as a complete ration, mark on your glasses, how full each should be of each commodity for one person for one day.
? ? ?
26
SUGAR
CANNED FISH
RICE LENTILS
OIL SALT
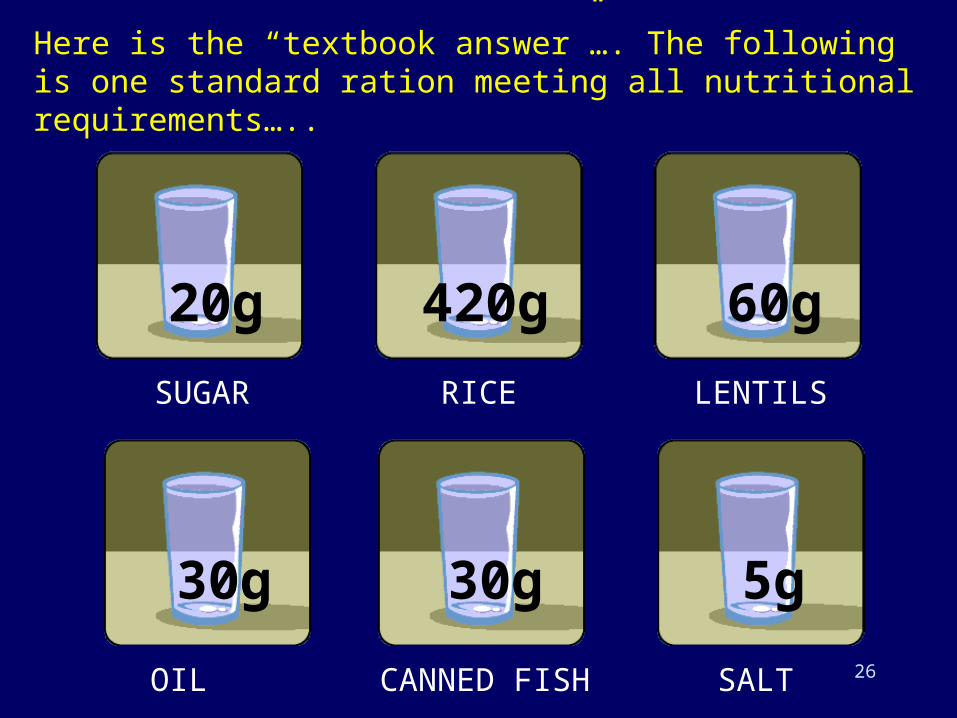
Here is the “textbook answer”…. The following is one standard ration meeting all nutritional requirements…..
420g20g 60g
30g30g 5g
27
What is a typical What is a typical complement to a grain complement to a grain that adds protein to the that adds protein to the
overall diet?overall diet?
Beans, lentils, pulses, Beans, lentils, pulses, groundnutsgroundnuts
And what else?And what else?

28
Ration by Kilocalories ConsumedRation by Kilocalories Consumed

29
Let’s Design a Ration…Let’s Design a Ration…
2020SugarSugar
2525Vegetable OilVegetable Oil
5050PulsesPulses
5050Corn-Soy-Blend (unimix)Corn-Soy-Blend (unimix)
400400RiceRice
Grams Grams (/person/day)(/person/day)
CommodityCommodity Kcal?
TOTALS?:
Use the table… APPROXIMATE NUTRITIONAL VALUES OF VARIOUS FOOD COMMODITIES PER 100 GRAMS

30
“Moderate malnutrition is addressed”
Correction of malnutrition standard 1: moderate malnutrition
Boston University - photo
Q. How is moderate malnutrition defined? How is it measured?
31
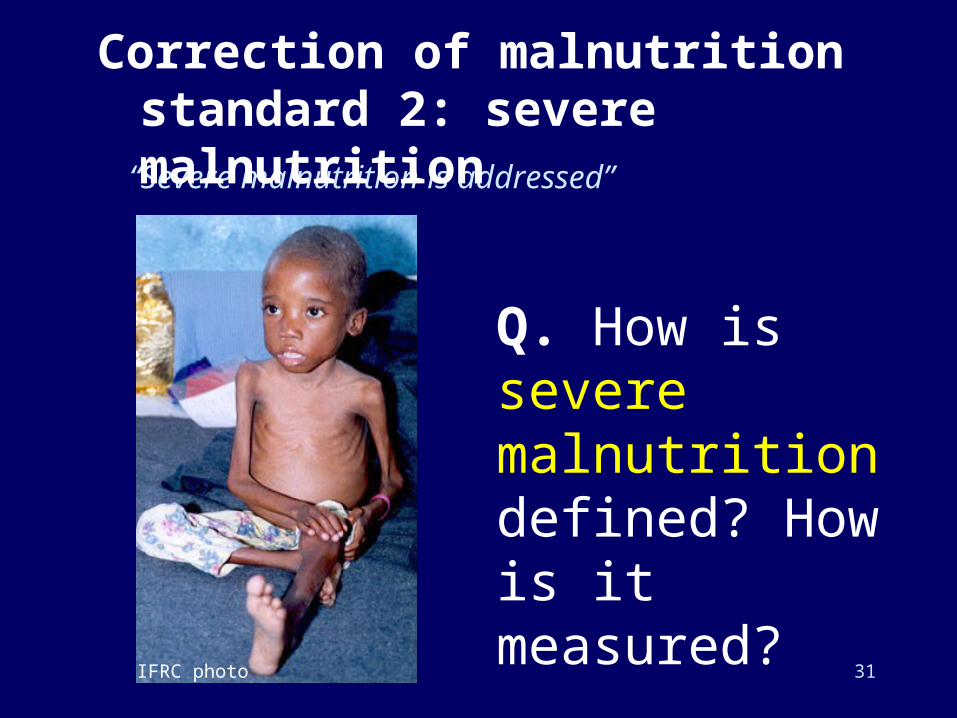
“Severe malnutrition is addressed”
Correction of malnutrition standard 2: severe malnutrition
Q. How is severe malnutrition defined? How is it measured?
IFRC photo
32
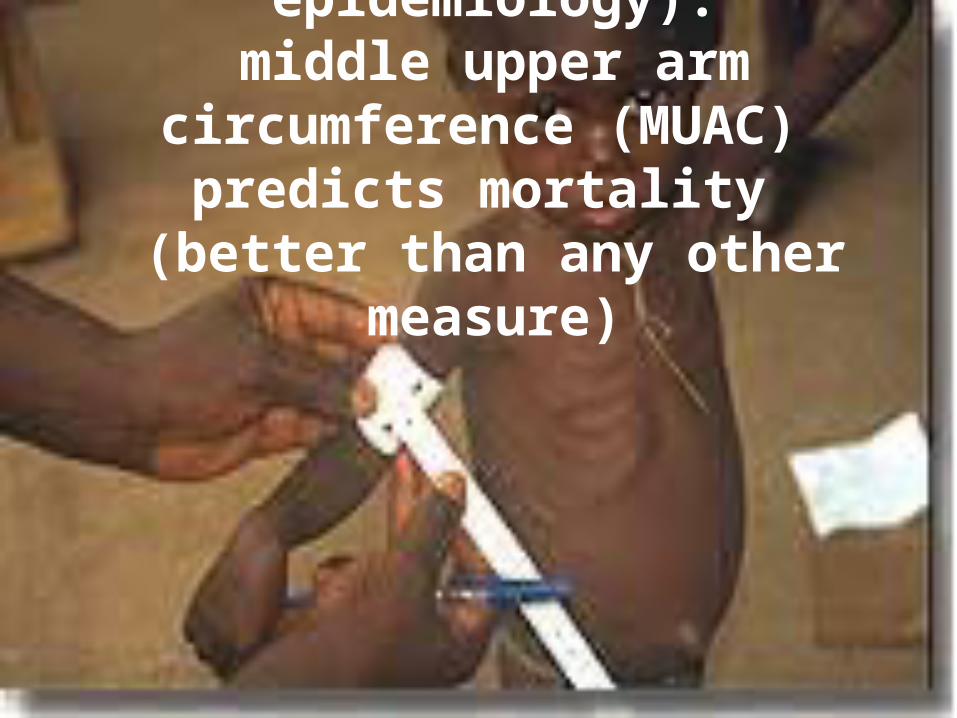
Principle (clinical epidemiology):middle upper arm circumference
(MUAC) predicts mortality
(better than any other measure)

33
Arm Circumference Arm Circumference and Weight-for-and Weight-for-
Height are Height are roughlyroughly equivalent in their equivalent in their
diagnostic and diagnostic and prognostic values.prognostic values.

34
Children with very low wt/htChildren with very low wt/htTherapeutic onsite (observed) feeding
8+ hours/day
-3Z WfH

35
Children with low wt/htChildren with low wt/htSupplementary feeding
4-6 hours/day
-2Z WfH

36
Criteria for TFP & SFPCriteria for TFP & SFP
W/H < 70% or edema
(< minus 3 Z-scores)
W/H = 70-79% (< minus 2 Z-scores)
Supplementary
Feeding
Program
Therapeutic
Feeding
Program
W/H < 70% (< minus 3 Z-scores)
W/H 85%
( minus 1.5 Z-scores)
•W/H 75%•Appetite restored•Free of disease
Return to SFPReturn to SFP
Exit from Exit from programprogram
Return to TFPReturn to TFP

37
Total Malnutrition Moderate Malnutrition Severe Malnutrition
Children6.0-59.9months
Children5-9.9years
Adults20.0-59.9years
< -2 Z scores WFHor
80% median WFHor
< 12.5 cm MUACor
nutritional oedema
-3 to<-2Z scores WFHor
70%- 80% median WFH
or11 to < 12.5 cm MUAC
< -3 Z scores WFHor
<70% median WFHor
< 11.0 cm MUACor
nutritional oedema
< -2 Z scores WFHor
<80% median WFHor
nutritional oedema
-3 to<-2Z scores WFHor
70%- 80% median WFH
< -3 Z scores WFHor
<70% median WFHor
nutritional oedema
BMI < 17 or
nutritional oedema
16 to < 17 BMI See critical issues note p. 185

38
What are the most Important What are the most Important Things Given in Supplementary Things Given in Supplementary
and Therapeutic Feeding?and Therapeutic Feeding? Regular, hot, sweet, fluid Regular, hot, sweet, fluid
meals (typically in the form meals (typically in the form of porridge or milk, with of porridge or milk, with crackers)crackers)
Personal Personal A t t e n t i o nA t t e n t i o n

39
supplementary feedingssupplementary feedings- contact with children allows:- contact with children allows:
MebendazoleMebendazole– De-wormsDe-worms– Demonstration-effect, Demonstration-effect,
(wins parents (wins parents compliance)compliance)
– Reduces MalabsorptionReduces Malabsorption

40
Visualizing some of the indicators…
Assessment and analysis:“Before conducting an anthropometric survey, information on the underlying causes of malnutrition is analysed and reported, highlighting the nature and severity of the problems, and those groups with the greatest nutritional and support needs.”
“The opinions of the community and other stakeholders on the causes of malnutrition are considered”
“International anthropometric survey guidelines, and national guidelines consistent with these, are adhered to for determining the type, degree and extent of malnutrition”
( please see page 115 of the 2004 Edition)

41
General nutritional support standard 1: all groups
Some indicators:
• There is access to a range of foods -staple (cereal or tuber), pulses (or animal products) and fat sources – that meet nutritional requirements.
• There is access to vitamin A, C and iron-rich or fortified foods or appropriate supplements
• There is access to iodized salt for the majority (>90%) of households
• No cases of scurvy, pellagra, beri-beri or riboflavin deficiency
( please see pages 137 & 138 of the 2004 Edition)

42
Basic indicator - Children suffering from malnutrition

43
General nutrition support standard 2: at-risk groups
Some indicators:
• Infants under 6 months are exclusively breastfed or, in exceptional circumstances, have access to an adequate amount of an appropriate breast milk substitute
• Pregnant and breastfeeding women have access to additional nutrients and support
• Community based systems are in place to ensure appropriate care of vulnerable individuals
( please see pages 140 & 141 of the 2004 Edition)
44
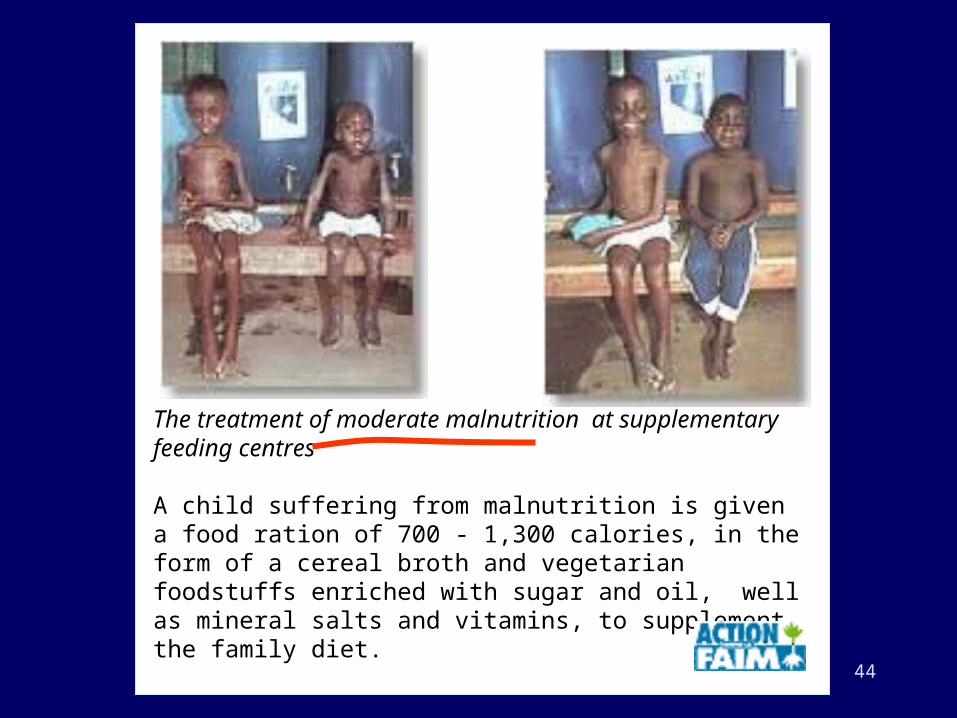
The treatment of moderate malnutrition at supplementary feeding centres
A child suffering from malnutrition is given a food ration of 700 - 1,300 calories, in the form of a cereal broth and vegetarian foodstuffs enriched with sugar and oil, well as mineral salts and vitamins, to supplement the family diet.
45
Correction of malnutrition standard 2: severe malnutrition
Some indicators:
• Proportion of exits from a therapeutic feeding programme who have died is < 10%, recovered is > 75%, and defaulted is <15%
• proportion of exits from therapeutic feeding programme who have died is < 10%,defaulted < 15%
• Coverage is > 50% in rural areas, > 75% in urban areas and > 90% in camp situations
• there is a mean weight gain of 8 kg per person per day
• Discharge criteria include non-anthropometric indices such as: good appetite; no diarrhea, fever, parasitic infestation or other untreated illness
• Nutrition worker to patient ratio is at least 1:10

46
Severely malnourished child, 2yrs old. 5.5 k - early August, 1999, cannot walk or sit up.
August 20, 7.4 k
September 15, 9.8 kcan walk again,
October, healthy again, out of the programme
How a TFP is supposed to work.
Photos USAID

47
Correction of malnutrition standard 3: micronutrient malnutrition
Some indicators:• all clinical cases of deficiency diseases are treated
according to WHO micronutrient supplementation protocols
• Procedures are established to respond efficiently to micronutrient deficiencies to which the population may be at risk
• Health staff are trained in how to identify and treat micronutrient deficiencies to which the population is most at risk

48
Micronutrient deficiency indicator - Bitot’s spots, caused by Vitamin A deficiency

49
Pellagra
Pellagra is caused by Niacin (vitamin B3) deficiency. The condition can be fatal. Good sources of Niacin include groundnuts, fish, meat and pulses.
Pellagra is sometimes called the described by the ”3 D" disease: Dermatitis, Diarrhoea, and finally Dementia. In extreme cases a fourth can occur - Death
The disease takes 2-3 months to fully develop symptoms.
Photo: P. Delchevaleriehttp://www.ennonline.net/fex/10/fa12.html

50
http://www.ennonline.net/fex/10/fa12.html

51
1 Assessment and Analysis
2 General Nutritional Support to the Population
3 Nutritional Support to Those Suffering From Malnutrition
SUMMARY: The 3 Main areas of the Sphere Standards relating to nutrition are critical - particularly in emergency nutrition programmes.
1 Understand (common standards)
2 Provide enough food for everyone to remain healthy
3 If that fails, implement programmes to treat the malnourished