Steve Heminger Executive Director, MTC AMPO Annual Conference Oct. 2 - 5, 2007.
Upload
lena-farnumCategory
view
215download
1
1
The Bay Area Toll Authority —Back to the Future?
The Bay Area Toll Authority —Back to the Future?
Steve HemingerSteve HemingerExecutive DirectorExecutive Director
Steve HemingerSteve HemingerExecutive DirectorExecutive Director

2
Back to the Future?Back to the Future?
California Toll Bridge Authority
Separate from the California Division of Highways – predecessor of Caltrans

3
Bay Area’s NetworkBay Area’s Network The Metropolitan Transportation
Commission (MTC) is the regional transportation planning organization for the San Francisco Bay Area 400 miles of carpool lanes 1,400 miles of highway 19,000 miles arterial streets 7,000 miles of transit routes
4
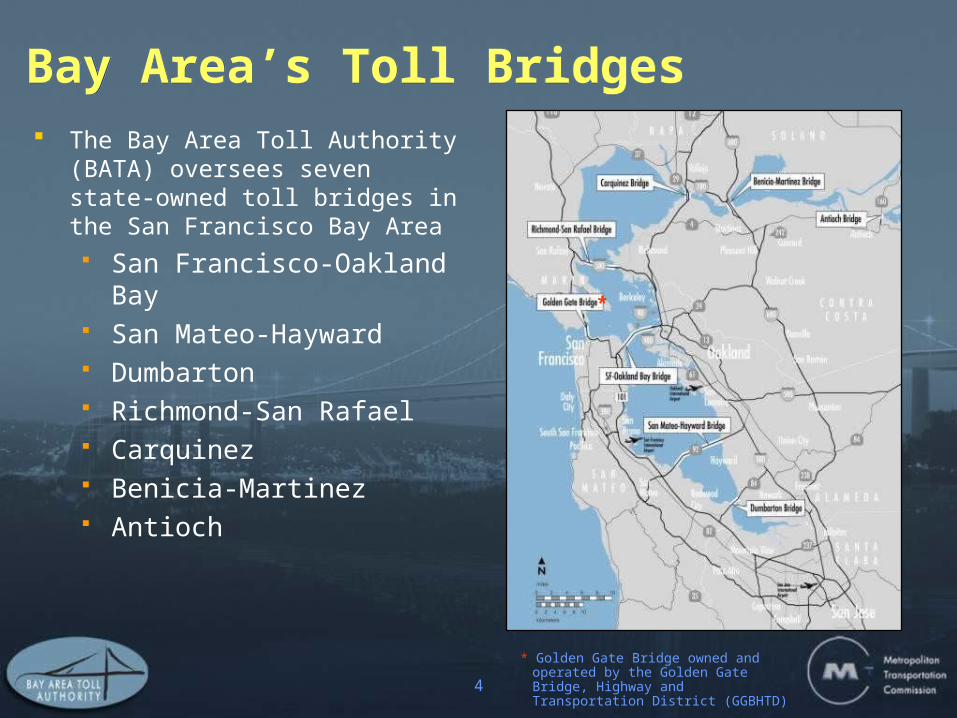
Bay Area’s Toll BridgesBay Area’s Toll Bridges The Bay Area Toll Authority (BATA)
oversees seven state-owned toll bridges in the San Francisco Bay Area San Francisco-Oakland Bay San Mateo-Hayward Dumbarton Richmond-San Rafael Carquinez Benicia-Martinez Antioch
*
* Golden Gate Bridge owned and operated by the Golden Gate Bridge, Highway and Transportation District (GGBHTD)
5
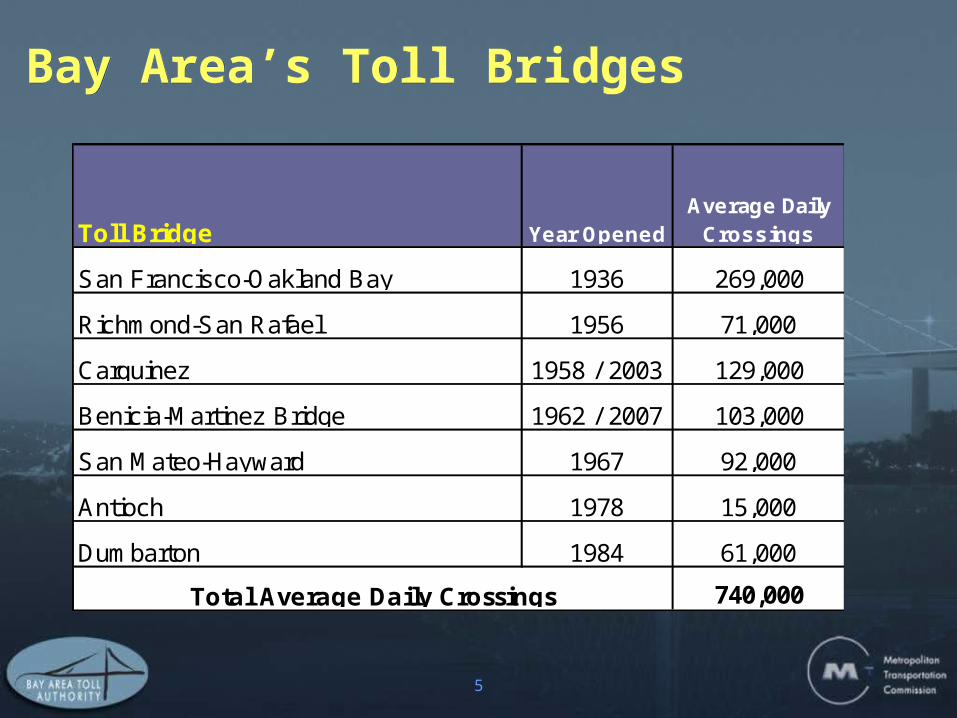
San Francisco-Oakland Bay 1936 269,000
Richmond-San Rafael 1956 71,000
Carquinez 1958 / 2003 129,000
Benicia-Martinez Bridge 1962 / 2007 103,000
San Mateo-Hayward 1967 92,000
Antioch 1978 15,000
Dumbarton 1984 61,000
740,000Total Average Daily Crossings
Toll BridgeAverage Daily
CrossingsYear Opened
Bay Area’s Toll Bridges Bay Area’s Toll Bridges
6
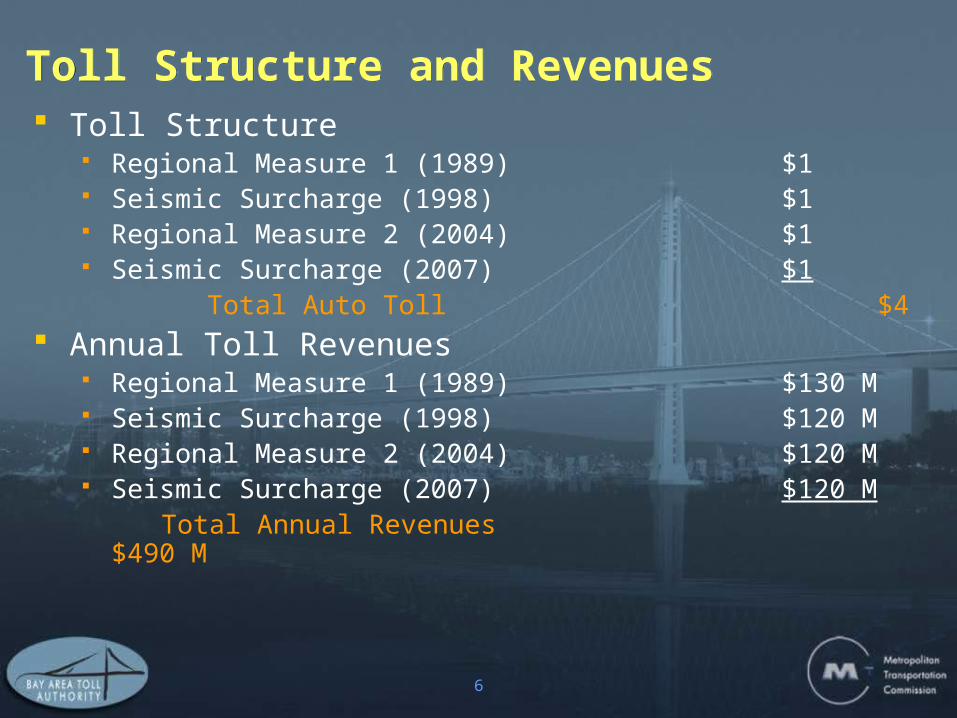
Toll Structure and RevenuesToll Structure and Revenues Toll Structure
Regional Measure 1 (1989) $1 Seismic Surcharge (1998) $1 Regional Measure 2 (2004) $1 Seismic Surcharge (2007) $1
Total Auto Toll $4 Annual Toll Revenues
Regional Measure 1 (1989) $130 M Seismic Surcharge (1998) $120 M Regional Measure 2 (2004) $120 M Seismic Surcharge (2007) $120 M Total Annual Revenues $490 M

7
EarthquakesEarthquakes 1989 Loma Prieta
6.9 Magnitude 60 miles from SF
8
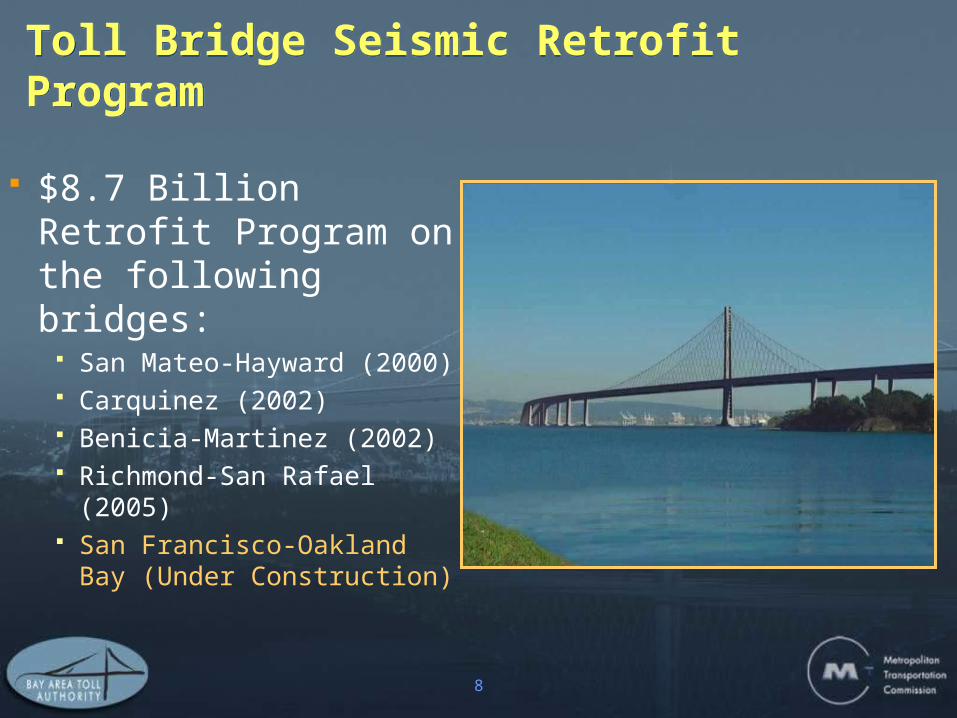
$8.7 Billion Retrofit Program on the following bridges:
San Mateo-Hayward (2000) Carquinez (2002) Benicia-Martinez (2002) Richmond-San Rafael
(2005) San Francisco-Oakland Bay
(Under Construction)
Toll Bridge Seismic Retrofit ProgramToll Bridge Seismic Retrofit Program

9
Seismic Retrofit Program StatusSeismic Retrofit Program Status
Seismic Retrofit Projects-AB144 Budget
(7/2005)
Current Forecast Budget
(4/2008)
Variance
San Francisco-Oakland Bay Bridge East Span Replacement
5,487 5,722 235
San Francisco-Oakland Bay Bridge West Approach Replacement
429 471 42
San Francisco-Oakland Bay Bridge West Span Seismic Retrofit
308 308 0
Richmond-San Rafael Bridge Seismic Retrofit 914 825 -89
Benicia-Martinez Bridge Seismic Retrofit 178 178 0
Eastbound Carquinez Bridge Seismic Retrofit 114 114 0
San Mateo-Hayward Bridge Seismic Retrofit 164 164 0
Other Costs 192 192 0
Program Contingency 900 712 -188
Total (in $ millions) 8,685 8,685 0
10
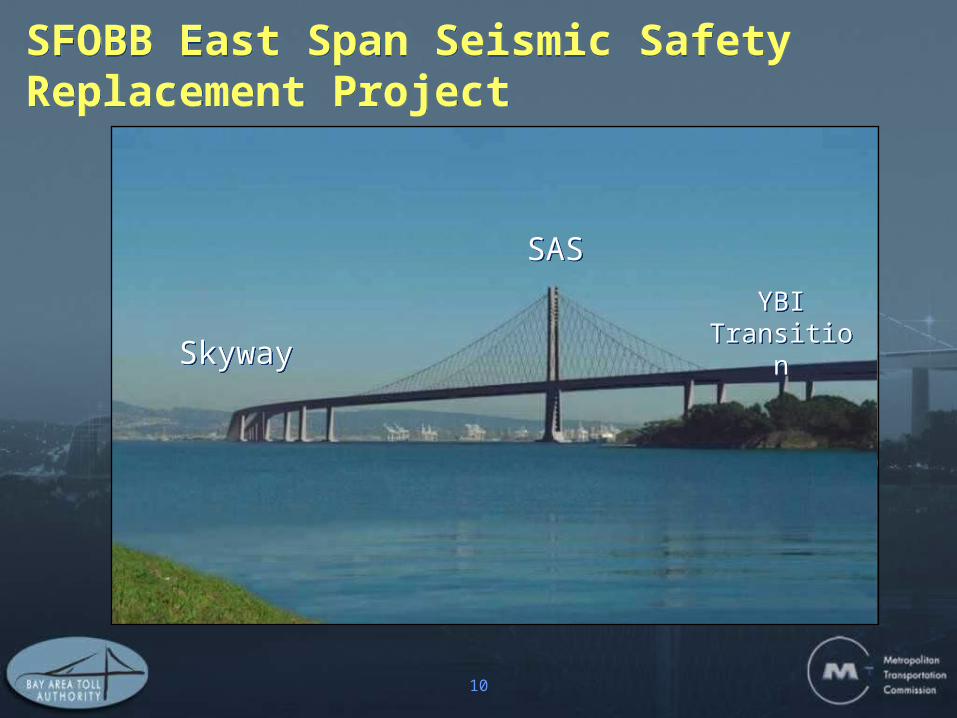
SFOBB East Span Seismic Safety Replacement ProjectSFOBB East Span Seismic Safety Replacement Project
SkywaySkyway
SASSAS
YBI Transition
YBI Transition

11
SFOBB East Span Seismic Safety Replacement ProjectSFOBB East Span Seismic Safety Replacement Project
Segment YBI SAS Skyway Oakland

12
Oakland Touchdown ContractOakland Touchdown Contract

13
Oakland Touchdown ContractOakland Touchdown Contract

14
SkywaySkyway

15
SAS E2/T1 FoundationsSAS E2/T1 Foundations

16
SAS T1 Tower FoundationSAS T1 Tower Foundation

17
SAS ContractSAS Contract

18
SAS ContractSAS Contract

19
Yerba Buena Island – Labor Day 2007Yerba Buena Island – Labor Day 2007

20
Yerba Buena Island Detour ContractYerba Buena Island Detour Contract
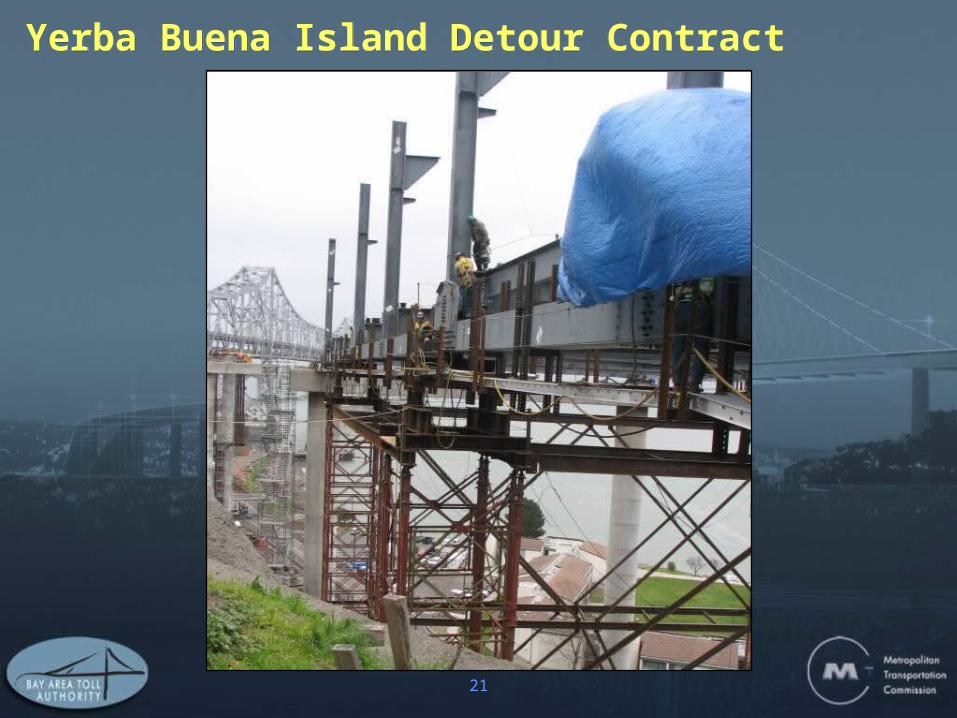
21
Yerba Buena Island Detour ContractYerba Buena Island Detour Contract

22
SFOBB West Approach ProjectSFOBB West Approach Project

23
SFOBB West Approach ProjectSFOBB West Approach Project

24
AccountabilityAccountability AB 144 established the Toll Bridge Program Oversight Committee,
composed of Director of the California Department of Transportation (Caltrans), and the Executive Directors of the California Transportation Commission (CTC) and the Bay Area Toll Authority (BATA), to be accountable for delivering the SRP.
WILL KEMPTONDirector
California Department of Transportation
STEVE HEMINGERExecutive Director
Bay Area Toll Authority
JOHN F. BARNA, JR.Executive Director
California TransportationCommission

25
$2.4 Billion Congestion Relief and Capital Improvement Program including:
Regional Measure 1 ProgramRegional Measure 1 Program
San Mateo-Hayward Bridge Widening (2003) New Carquinez Bridge (2004) Richmond-San Rafael Bridge Trestle Replacement (2005) Richmond-San Rafael Bridge Deck Overlay (2006) New Benicia-Martinez Bridge (2007) I-880/SR-92 Interchange Reconstruction (Construction)

26
Regional Measure 1 Program StatusRegional Measure 1 Program Status
Regional Measure 1 Toll Bridge Projects
Current Approved Budget
(4/2008)
Current Forecast Budget
(4/2008)
Variance
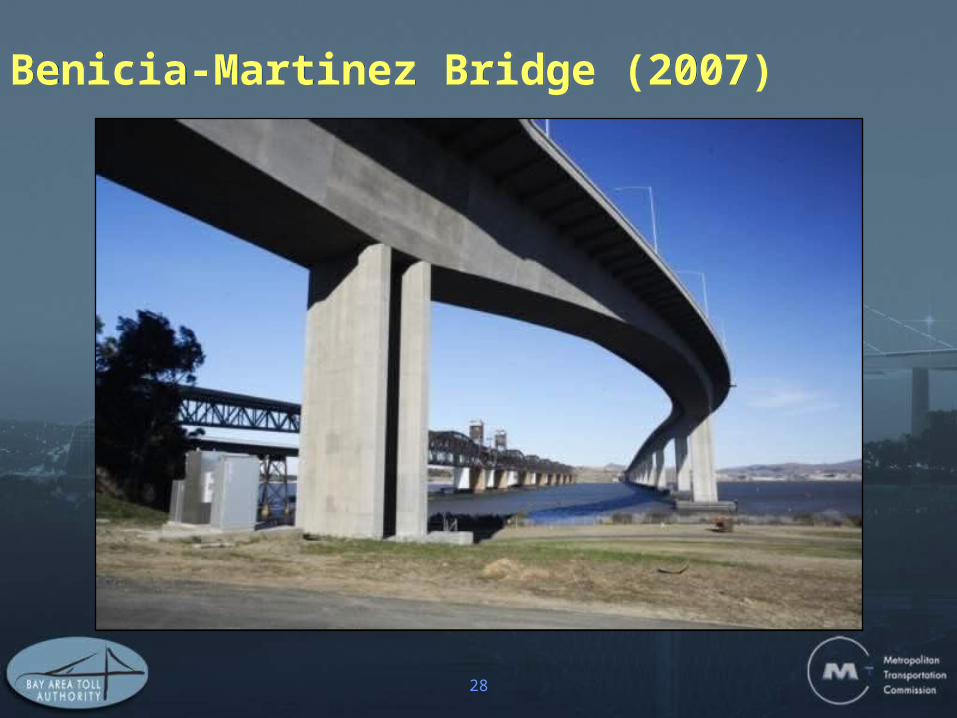
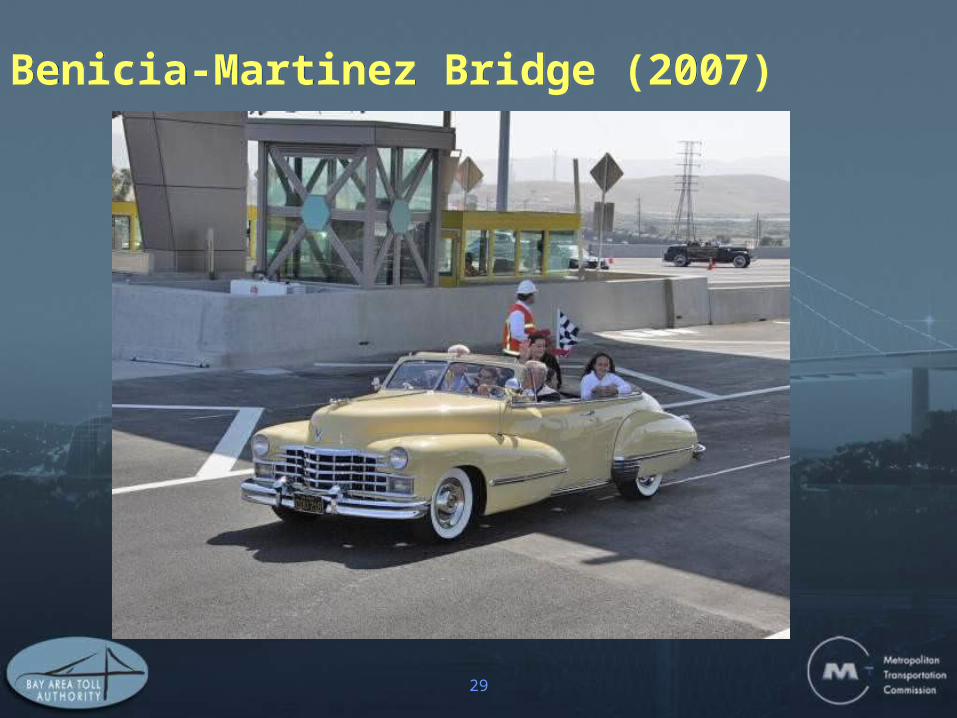
New Benicia-Martinez Bridge 1,274 1,274 0
Interstate 880/State Route 92 Interchange Reconstruction
245 245 0
New Al Zampa (Carquinez) Bridge 528 518 -10
Richmond-San Rafael Bridge Rehabilitation 102 97 -5
Richmond-San Rafael Bridge Overlay 25 25 0
San Mateo-Hayward Bridge Widening 218 212 -6
Bayfront Expressway (SR 84) Widening 36 36 0
Other Projects 10 10 0
Total (in $ millions) 2,438 2,417 -21

27
New Carquinez Bridge (2003)New Carquinez Bridge (2003)
28
Benicia-Martinez Bridge (2007)Benicia-Martinez Bridge (2007)
29
Benicia-Martinez Bridge (2007)Benicia-Martinez Bridge (2007)

30
880/92 Interchange Project880/92 Interchange Project

31
Regional Measure 2Capital Project ProgramRegional Measure 2Capital Project Program
ProjectFunding
(in $ millions)
Ferry Programs $197
Bus Programs $157
Transbay Terminal $150
BART Tube Seismic $143
Dumbarton Rail $135
Interstate 80/680 Improvements $100
E-BART Extension $96
BART-Warm Springs $95
Interstate 580 Corridor $65
Caldecott Tunnel 4th bore $51
The RM2 funding program is primarily
oriented towards transit alternatives
RM2 provides partial funding to
projects, balance provided by project
sponsor
If funding or project fails, BATA can
reallocate funding to different project
in the same bridge corridor

32
Regional Measure 2 Operating ProgramRegional Measure 2 Operating Program
RM2 provides a key source of
funding for a variety of new transit
services
Operating cost payments are
subordinated to debt service
Project
Annual Funding Cap
(in $ millions)
Regional Express Bus (S) 7.4
Alameda Ferry 7.2
Dumbarton Rail 6.2
Regional Express Bus (N) 3.9
Albany Ferry 3.6
South SF Ferry 3.4
Vallejo Ferry 3.1
Water Transit Administration 3.0
AC Transit 3.0
Muni Metro 2.5
Golden Gate 2.4
Owl Bus 2.1
Napa Transit 0.4

33
BATA’s Debt PortfolioBATA’s Debt Portfolio Current BATA debt portfolio is $5.2 billion
$2.3 billion fixed rate debt
$2.9 billion variable rate debt
The weighted cost of the entire “AA” portfolio is $ 4.20%, as of May 2008
BATA’s goal to deliver the entire $12 billion toll construction program within the $4.00 toll structure
Debt Principal(in $ millions)
%
Fixed 2,300 44%
Variable 2,900 56%
Total Debt 5,200

34
BATA’s Efficient CreditBATA’s Efficient Credit
BATA ALL IN DEBT COSTSMay 2008
-1.00%
0.00%
1.00%
2.00%
3.00%
4.00%
5.00%
6.00%
7.00%
8.00%
5/24
/200
1
7/24
/200
1
9/24
/200
1
11/2
4/20
01
1/24
/200
2
3/24
/200
2
5/24
/200
2
7/24
/200
2
9/24
/200
2
11/2
4/20
02
1/24
/200
3
3/24
/200
3
5/24
/200
3
7/24
/200
3
9/24
/200
3
11/2
4/20
03
1/24
/200
4
3/24
/200
4
5/24
/200
4
7/24
/200
4
9/24
/200
4
11/2
4/20
04
1/24
/200
5
3/24
/200
5
5/24
/200
5
7/24
/200
5
9/24
/200
5
11/2
4/20
05
1/24
/200
6
3/24
/200
6
5/24
/200
6
7/24
/200
6
9/24
/200
6
11/2
4/20
06
1/24
/200
7
3/24
/200
7
5/24
/200
7
7/24
/200
7
9/24
/200
7
11/2
4/20
07
1/24
/200
8
3/24
/200
8
5/24
/200
8
RESET DATE
RA
TE
S
PRO FORMA TARGET
ROLLING AVERAGE ALL IN COSTS
RBI BENCHMARK

35
BATA’s Strong CreditBATA’s Strong Credit
Rating Outlook
Fitch AA- Stable
Standard and Poor’s AA Stable
Moody’s Aa3 Stable

36
FasTrak® Electronic Toll Collection SystemFasTrak® Electronic Toll Collection System

37
Strong FasTrak® Account GrowthStrong FasTrak® Account Growth
Total Number of Active Bay Area FasTrak Accounts
12
8,6
86
15
1,5
13
17
0,2
09
18
5,1
37
19
4,1
13
20
4,6
65
23
1,6
10
24
5,6
44
25
3,5
16
26
4,5
03
27
7,3
51
28
5,4
87
29
5,9
62
31
7,2
97
37
5,1
11
38
4,4
72
39
6,0
89
41
2,7
16
42
7,4
40
45
5,8
19
48
6,7
74
51
3,5
79
53
9,2
37
57
4,5
76
63
2,9
75
64
5,9
39
69
9,7
37
72
7,1
30
75
2,2
86
0
100,000
200,000
300,000
400,000
500,000
600,000
700,000
800,000
Ma
r-0
1
Jun
-01
Se
p-0
1
De
c-0
1
Ma
r-0
2
Jun
-02
Se
p-0
2
De
c-0
2
Ma
r-0
3
Jun
-03
Se
p-0
3
De
c-0
3
Ma
r-0
4
Jun
-04
Se
p-0
4
De
c-0
4
Ma
r-0
5
Jun
-05
Se
p-0
5
De
c-0
5
Ma
r-0
6
Jun
-06
Se
p-0
6
De
c-0
6
Ma
r-0
7
Jun
-07
Se
p-0
7
De
c-0
7
Ma
r-0
8

38
Increasing FasTrak® UsageIncreasing FasTrak® Usage
Peak Period FasTrak Usage on State-Owned Bridges
0%
5%
10%
15%
20%
25%
30%
35%
40%
45%
50%

39
Expanding FasTrak® OptionsExpanding FasTrak® Options

40
Regional HOT NetworkRegional HOT Network HOT Network introduces
pricing; revenue pays to expand carpool lane and express bus systems
Demonstration HOT lanes in Alameda, Santa Clara Counties
40

41
Regional HOT Network StudyRegional HOT Network Study HOT network could:
Help manage HOV lanes Reduce delay and emissions Be phased in by 2025 Pay for itself over 30-years, freeing up STIP revenue
Must be approached as a regional network
New institutional arrangements required for governance and revenue pooling

42
Unfinished BusinessUnfinished Business
Dumbarton and Antioch Bridge Retrofits Bike/Pedestrian Access – 2 ½ bridges to go Regional Measure 3 Open Road Tolling Asset Ownership?