1 Regional Portfolio Model and Direct Use of Gas Assessment Michael Schilmoeller NW Power and...
31
1 Regional Portfolio Model Regional Portfolio Model and Direct Use of Gas and Direct Use of Gas Assessment Assessment Michael Schilmoeller Michael Schilmoeller NW Power and Conservation NW Power and Conservation Council Council for the for the Regional Technical Forum Regional Technical Forum Tuesday, June 29, 2010 Tuesday, June 29, 2010
-
Upload
loraine-higgins -
Category
Documents
-
view
215 -
download
1
Transcript of 1 Regional Portfolio Model and Direct Use of Gas Assessment Michael Schilmoeller NW Power and...

1
Regional Portfolio Model and Regional Portfolio Model and Direct Use of GasDirect Use of Gas
AssessmentAssessment
Michael SchilmoellerMichael SchilmoellerNW Power and Conservation CouncilNW Power and Conservation Council
for thefor theRegional Technical ForumRegional Technical ForumTuesday, June 29, 2010Tuesday, June 29, 2010

2
OverviewOverview
• Goals of the study• Principles of the fuel-switching
evaluation• The role of the Regional Portfolio Model
(RPM)• Preliminary findings
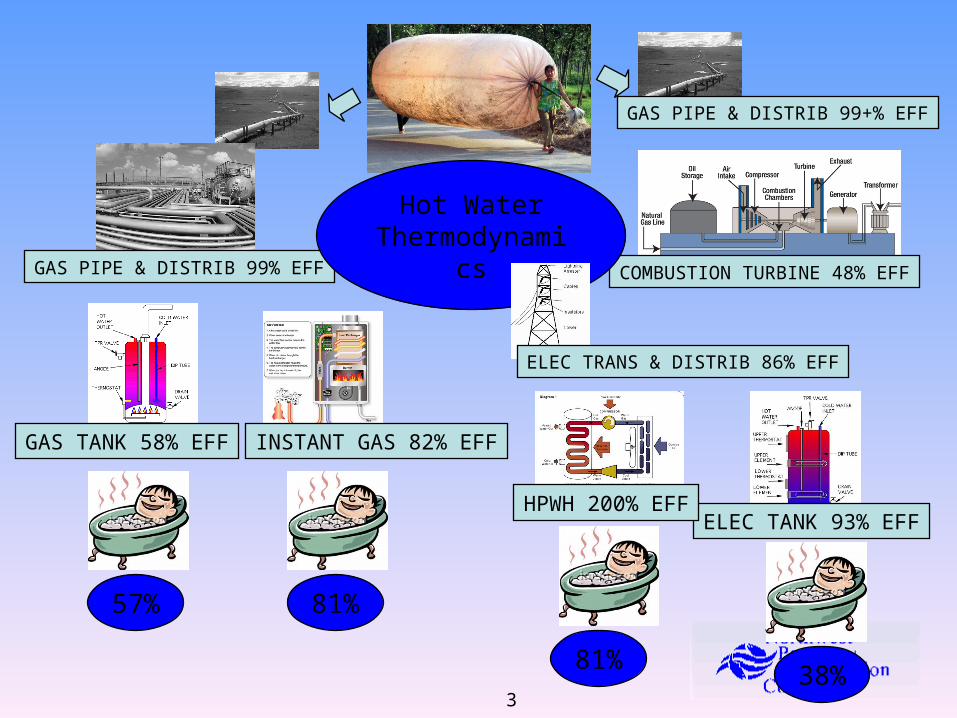
3
GAS TANK 58% EFF INSTANT GAS 82% EFF
ELEC TANK 93% EFFHPWH 200% EFF
GAS PIPE & DISTRIB 99% EFF COMBUSTION TURBINE 48% EFF
GAS PIPE & DISTRIB 99+% EFF
57% 81%
81%38%
Hot Water Thermodynamic
s
ELEC TRANS & DISTRIB 86% EFF
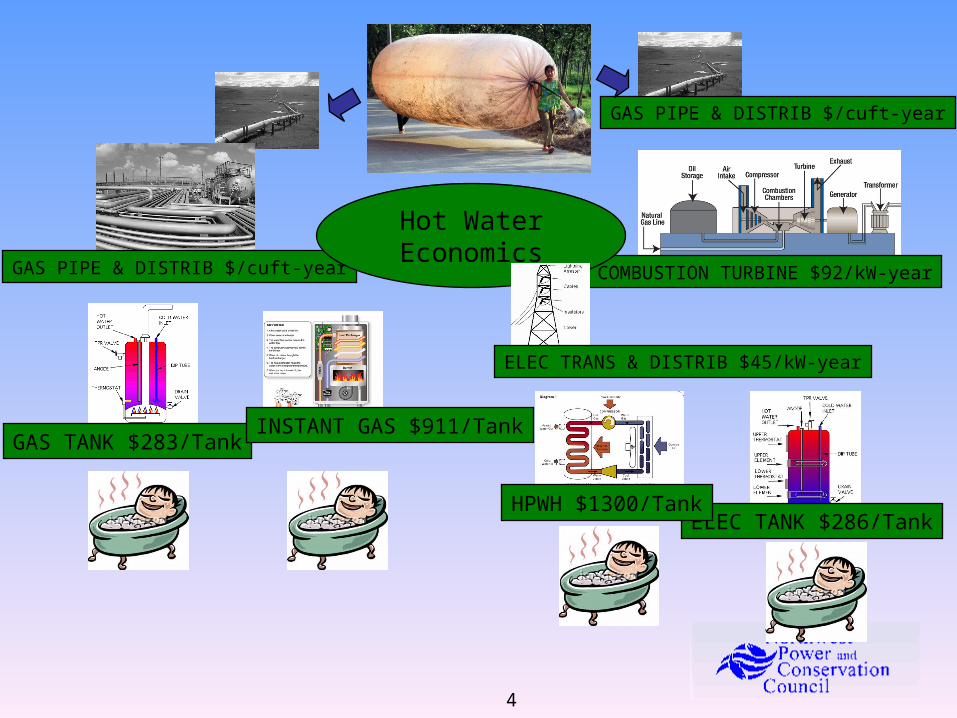
4
GAS TANK $283/TankINSTANT GAS $911/Tank
ELEC TANK $286/TankHPWH $1300/Tank
GAS PIPE & DISTRIB $/cuft-year COMBUSTION TURBINE $92/kW-year
GAS PIPE & DISTRIB $/cuft-year
Hot Water Economics
ELEC TRANS & DISTRIB $45/kW-year
5
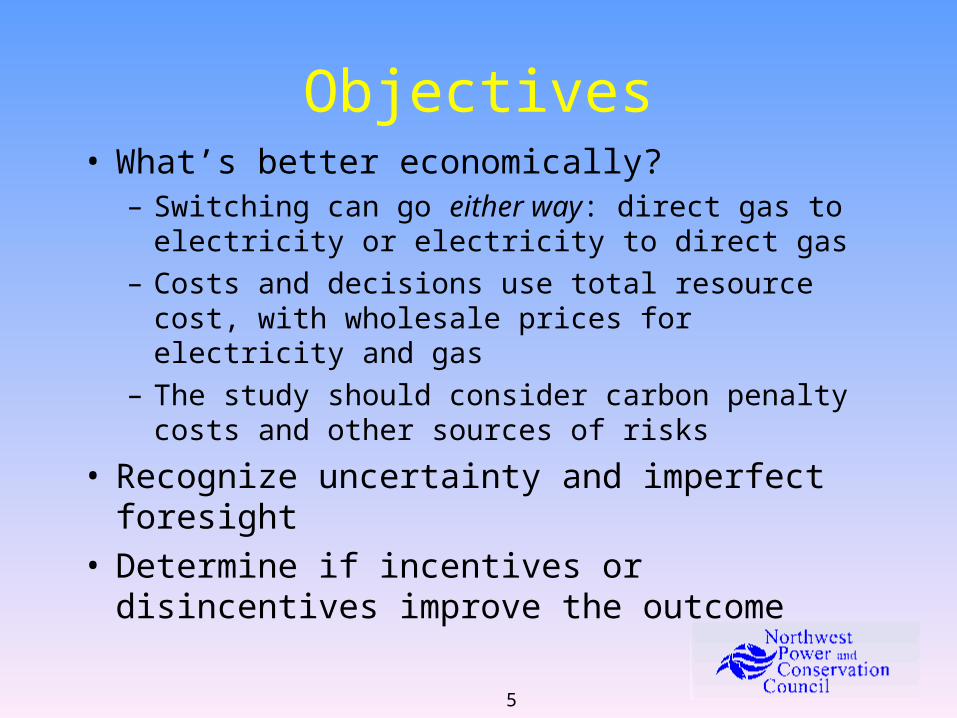
Objectives• What’s better economically?
– Switching can go either way: direct gas to electricity or electricity to direct gas
– Costs and decisions use total resource cost, with wholesale prices for electricity and gas
– The study should consider carbon penalty costs and other sources of risks
• Recognize uncertainty and imperfect foresight• Determine if incentives or disincentives
improve the outcome

6
Key Assumptions• Limited to existing construction of new
residential and commercial buildings
• Assume that energy requirement per household for heating is fixed (price insensitive), but seasonal
• Assume that a fixed portion of existing stock turns over each year, which limits the potential
7
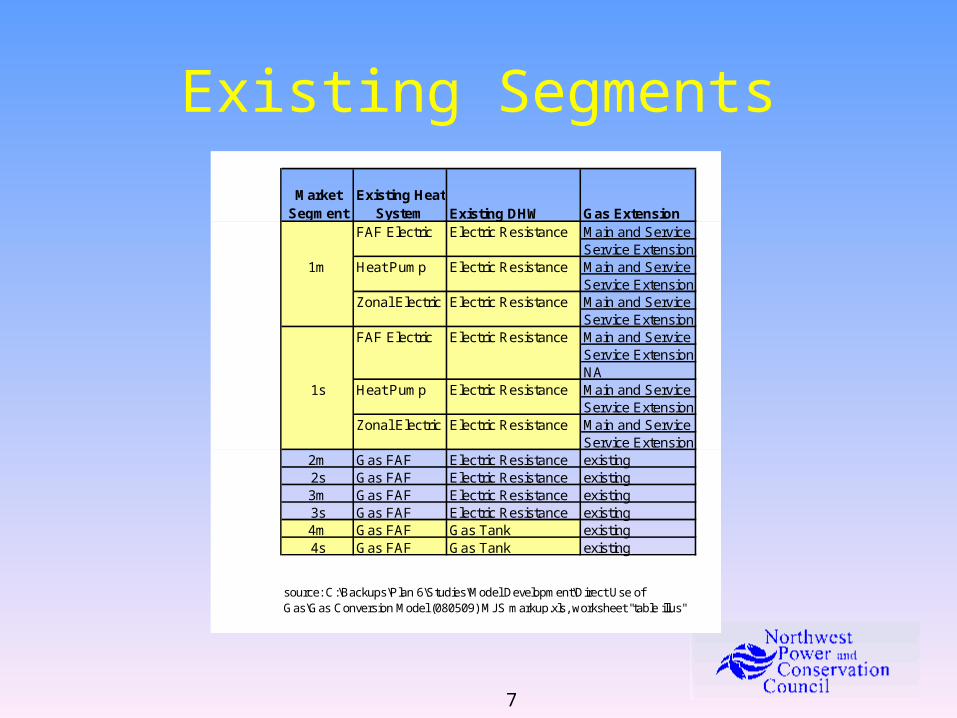
Existing Segments
Market Segment
Existing Heat System Existing DHW Gas Extension
FAF Electric Electric Resistance Main and ServiceService Extension
1m Heat Pump Electric Resistance Main and ServiceService Extension
Zonal Electric Electric Resistance Main and ServiceService Extension
FAF Electric Electric Resistance Main and ServiceService ExtensionNA
1s Heat Pump Electric Resistance Main and ServiceService Extension
Zonal Electric Electric Resistance Main and ServiceService Extension
2m Gas FAF Electric Resistance existing2s Gas FAF Electric Resistance existing3m Gas FAF Electric Resistance existing3s Gas FAF Electric Resistance existing4m Gas FAF Gas Tank existing4s Gas FAF Gas Tank existing
source: C:\Backups\Plan 6\Studies\Model Development\Direct Use of Gas\Gas Conversion Model (080509) MJS markup.xls, worksheet "table illus"

8
Conversion Options
Retrofit Heating SystemFAF
Electric Heat Pump Gas FAFGas
Hydronic Gas/HP Hybrid
Retrofit DHW
source: C:\Backups\Plan 6\Studies\Model Development\Direct Use of Gas\Gas Conversion Model (080509) MJS markup.xls, worksheet "table illus"
Ele
ctri
c R
esis
tan
ce
Gas
Tan
k
HP
WH
Inst
ant
Gas
Gas
Tan
k
Inst
ant
Gas
Gas
Tan
k
Inst
ant
Gas
HP
WH
Ele
ctri
c R
esis
tan
ce
Gas
Tan
k
HP
WH
Inst
ant
Gas
9
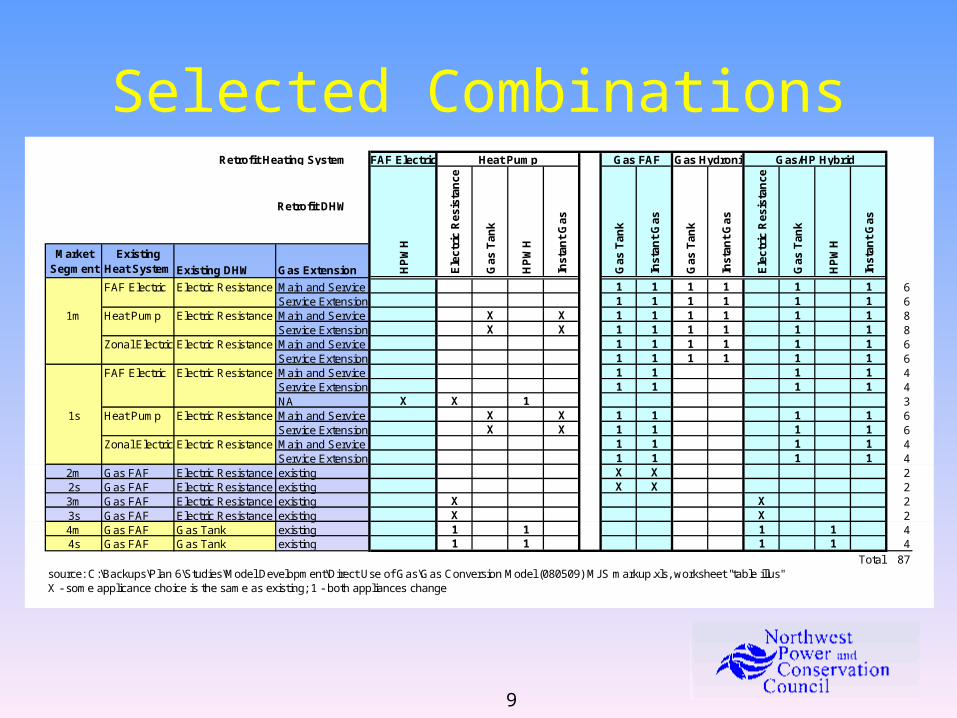
Selected CombinationsRetrofit Heating System FAF Electric Heat Pump Gas FAF Gas Hydronic Gas/HP Hybrid
Retrofit DHW
Market Segment
Existing Heat System Existing DHW Gas Extension
FAF Electric Electric Resistance Main and Service 1 1 1 1 1 1 6Service Extension 1 1 1 1 1 1 6
1m Heat Pump Electric Resistance Main and Service X X 1 1 1 1 1 1 8Service Extension X X 1 1 1 1 1 1 8
Zonal Electric Electric Resistance Main and Service 1 1 1 1 1 1 6Service Extension 1 1 1 1 1 1 6
FAF Electric Electric Resistance Main and Service 1 1 1 1 4Service Extension 1 1 1 1 4NA X X 1 3
1s Heat Pump Electric Resistance Main and Service X X 1 1 1 1 6Service Extension X X 1 1 1 1 6
Zonal Electric Electric Resistance Main and Service 1 1 1 1 4Service Extension 1 1 1 1 4
2m Gas FAF Electric Resistance existing X X 22s Gas FAF Electric Resistance existing X X 23m Gas FAF Electric Resistance existing X X 23s Gas FAF Electric Resistance existing X X 24m Gas FAF Gas Tank existing 1 1 1 1 44s Gas FAF Gas Tank existing 1 1 1 1 4
Total 87source: C:\Backups\Plan 6\Studies\Model Development\Direct Use of Gas\Gas Conversion Model (080509) MJS markup.xls, worksheet "table illus"X - some applicance choice is the same as existing; 1 - both appliances change
Ele
ctri
c R
esis
tan
ce
Gas
Tan
k
HP
WH
Inst
ant
Gas
Ele
ctri
c R
esis
tan
ce
Gas
Tan
k
HP
WH
Inst
ant
Gas
Inst
ant
Gas
Gas
Tan
k
Gas
Tan
k
Inst
ant
Gas
HP
WH
10
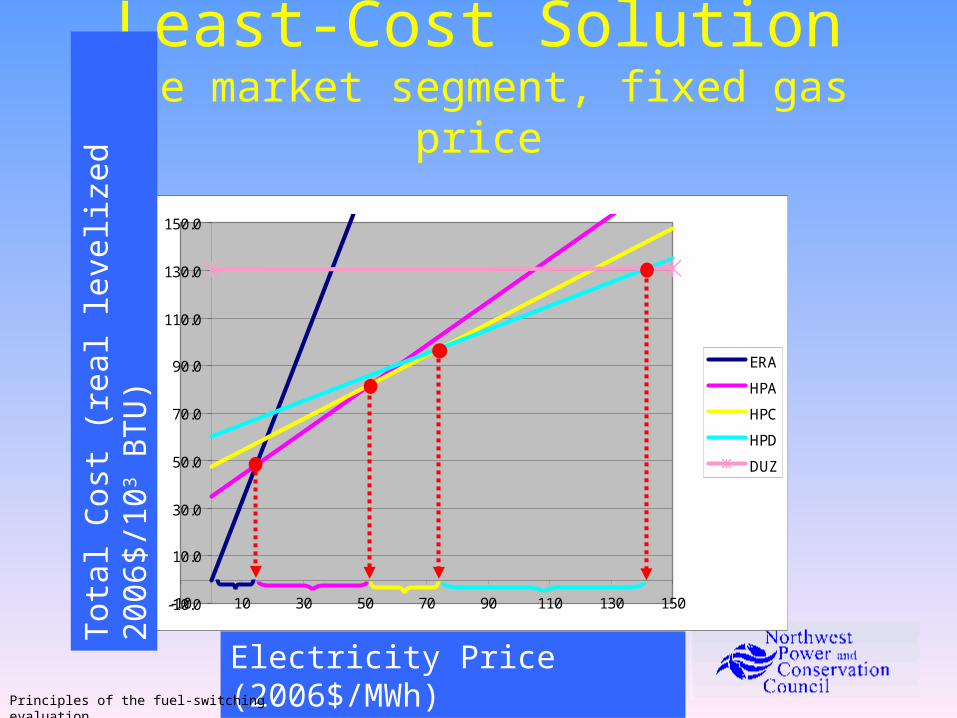
-10.0
10.0
30.0
50.0
70.0
90.0
110.0
130.0
150.0
-10 10 30 50 70 90 110 130 150
ERA
HPA
HPC
HPD
DUZ
Least-Cost Solutionone market segment, fixed gas price
Tota
l C
ost
(re
al le
veliz
ed
20
06
$/1
03
BTU
)
Electricity Price (2006$/MWh)Principles of the fuel-switching evaluation

11
Optimal Program Tableone market segment
MC Electric
MC Gas -$ 10$ 20$ 30$ -$ Program 73 No Conversion Program 71 Program 71
1$ Program 73 No Conversion Program 71 Program 712$ Program 73 Program 73 No Conversion Program 713$ Program 73 Program 73 Program 73 Program 714$ Program 73 Program 73 Program 73 Program 735$ Program 73 Program 73 Program 73 Program 736$ Program 73 Program 73 Program 73 Program 737$ Program 73 Program 73 Program 73 Program 738$ Program 73 Program 73 Program 73 Program 739$ Program 73 Program 73 Program 73 Program 73
source: Illustrating DUG 100606.xls, segment 2m-3m
Optimal Program
Principles of the fuel-switching evaluation
12
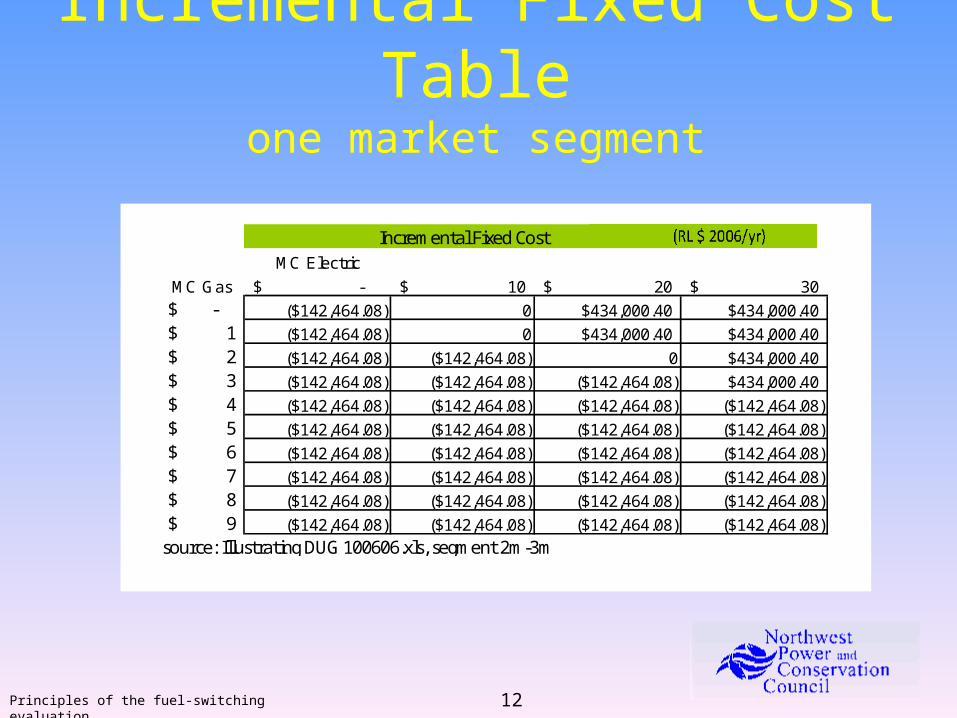
Incremental Fixed Cost Tableone market segment
Principles of the fuel-switching evaluation
MC Electric
MC Gas -$ 10$ 20$ 30$ -$ ($142,464.08) 0 $434,000.40 $434,000.40
1$ ($142,464.08) 0 $434,000.40 $434,000.402$ ($142,464.08) ($142,464.08) 0 $434,000.403$ ($142,464.08) ($142,464.08) ($142,464.08) $434,000.404$ ($142,464.08) ($142,464.08) ($142,464.08) ($142,464.08)5$ ($142,464.08) ($142,464.08) ($142,464.08) ($142,464.08)6$ ($142,464.08) ($142,464.08) ($142,464.08) ($142,464.08)7$ ($142,464.08) ($142,464.08) ($142,464.08) ($142,464.08)8$ ($142,464.08) ($142,464.08) ($142,464.08) ($142,464.08)9$ ($142,464.08) ($142,464.08) ($142,464.08) ($142,464.08)
source: Illustrating DUG 100606.xls, segment 2m-3m
Incremental Fixed Cost
13
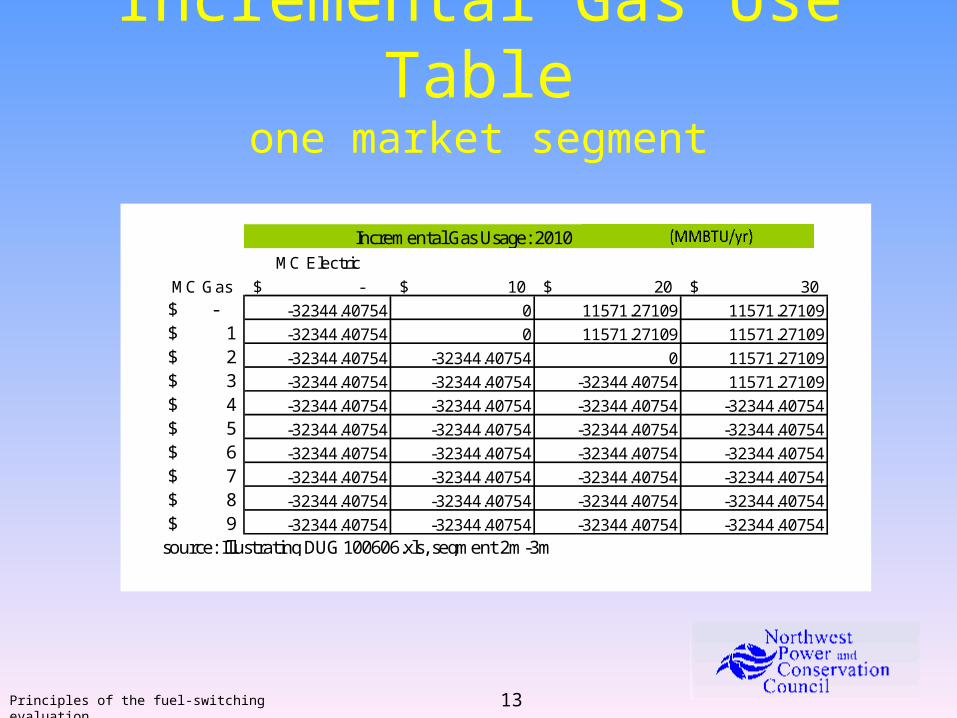
Incremental Gas Use Tableone market segment
Principles of the fuel-switching evaluation
MC Electric
MC Gas -$ 10$ 20$ 30$ -$ -32344.40754 0 11571.27109 11571.27109
1$ -32344.40754 0 11571.27109 11571.271092$ -32344.40754 -32344.40754 0 11571.271093$ -32344.40754 -32344.40754 -32344.40754 11571.271094$ -32344.40754 -32344.40754 -32344.40754 -32344.407545$ -32344.40754 -32344.40754 -32344.40754 -32344.407546$ -32344.40754 -32344.40754 -32344.40754 -32344.407547$ -32344.40754 -32344.40754 -32344.40754 -32344.407548$ -32344.40754 -32344.40754 -32344.40754 -32344.407549$ -32344.40754 -32344.40754 -32344.40754 -32344.40754
source: Illustrating DUG 100606.xls, segment 2m-3m
Incremental Gas Usage: 2010
14
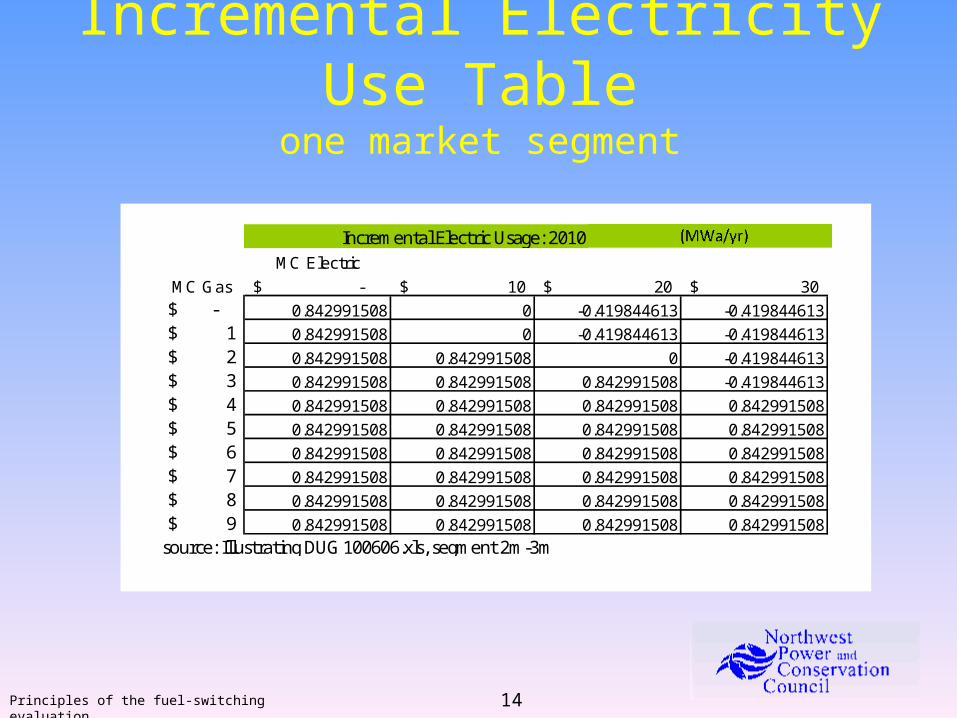
Incremental Electricity Use Tableone market segment
Principles of the fuel-switching evaluation
MC Electric
MC Gas -$ 10$ 20$ 30$ -$ 0.842991508 0 -0.419844613 -0.419844613
1$ 0.842991508 0 -0.419844613 -0.4198446132$ 0.842991508 0.842991508 0 -0.4198446133$ 0.842991508 0.842991508 0.842991508 -0.4198446134$ 0.842991508 0.842991508 0.842991508 0.8429915085$ 0.842991508 0.842991508 0.842991508 0.8429915086$ 0.842991508 0.842991508 0.842991508 0.8429915087$ 0.842991508 0.842991508 0.842991508 0.8429915088$ 0.842991508 0.842991508 0.842991508 0.8429915089$ 0.842991508 0.842991508 0.842991508 0.842991508
source: Illustrating DUG 100606.xls, segment 2m-3m
Incremental Electric Usage: 2010

15
Roll Up Incr. Fixed Costacross all market segments
(RL $ 2006/yr)
MC Gas MC Electric ($/MWh $2006)
($/MMBTU $2006) -$ 10$ 20$ 30$ -$ ($81,728,682.12) 0 $11,728,451.70 $12,570,529.19
1$ ($81,728,682.12) ($81,586,218.04) $11,728,451.70 $11,728,451.702$ ($81,728,682.12) ($81,728,682.12) ($78,027,511.96) $11,728,451.703$ ($81,728,682.12) ($81,728,682.12) ($81,728,682.12) $11,728,451.704$ ($81,728,682.12) ($81,728,682.12) ($81,728,682.12) ($81,728,682.12)5$ ($81,728,682.12) ($81,728,682.12) ($81,728,682.12) ($81,728,682.12)6$ ($81,728,682.12) ($81,728,682.12) ($81,728,682.12) ($81,728,682.12)7$ ($81,728,682.12) ($81,728,682.12) ($81,728,682.12) ($81,728,682.12)8$ ($81,728,682.12) ($81,728,682.12) ($81,728,682.12) ($81,728,682.12)9$ ($81,728,682.12) ($81,728,682.12) ($81,728,682.12) ($81,728,682.12)
source: Illustrating DUG 100606.xls, segment 2m-3m
Incremental Fixed Cost
Principles of the fuel-switching evaluation

16
Roll Up Incr. Gas Usageacross all market segments
(MMBTU/yr)
MC Gas MC Electric ($/MWh $2006)
($/MMBTU $2006) -$ 10$ 20$ 30$ -$ -7181960.834 0 311812.4594 323473.9025
1$ -7181960.834 -7149616.427 311812.4594 311812.45942$ -7181960.834 -7181960.834 -6307790.717 311812.45943$ -7181960.834 -7181960.834 -7181960.834 311812.45944$ -7181960.834 -7181960.834 -7181960.834 -7181960.8345$ -7181960.834 -7181960.834 -7181960.834 -7181960.8346$ -7181960.834 -7181960.834 -7181960.834 -7181960.8347$ -7181960.834 -7181960.834 -7181960.834 -7181960.8348$ -7181960.834 -7181960.834 -7181960.834 -7181960.8349$ -7181960.834 -7181960.834 -7181960.834 -7181960.834
source: Illustrating DUG 100606.xls, segment 2m-3m
Incremental Gas Usage: 2010
Principles of the fuel-switching evaluation
17
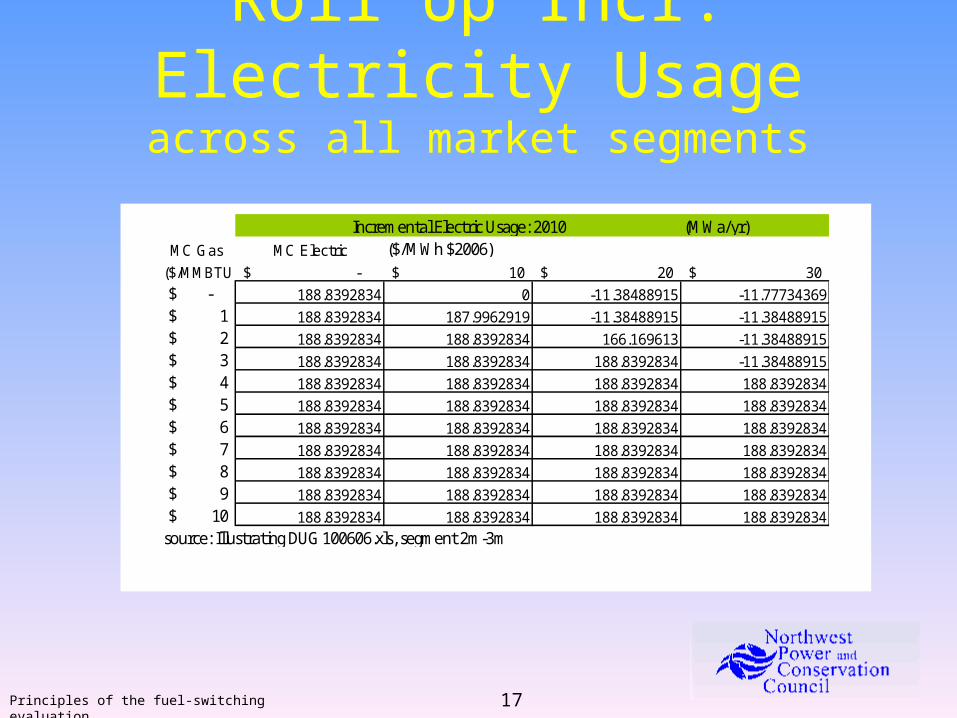
Roll Up Incr. Electricity Usageacross all market segments
(MWa/yr)
MC Gas MC Electric ($/MWh $2006)
($/MMBTU $2006) -$ 10$ 20$ 30$ -$ 188.8392834 0 -11.38488915 -11.77734369
1$ 188.8392834 187.9962919 -11.38488915 -11.384889152$ 188.8392834 188.8392834 166.169613 -11.384889153$ 188.8392834 188.8392834 188.8392834 -11.384889154$ 188.8392834 188.8392834 188.8392834 188.83928345$ 188.8392834 188.8392834 188.8392834 188.83928346$ 188.8392834 188.8392834 188.8392834 188.83928347$ 188.8392834 188.8392834 188.8392834 188.83928348$ 188.8392834 188.8392834 188.8392834 188.83928349$ 188.8392834 188.8392834 188.8392834 188.8392834
10$ 188.8392834 188.8392834 188.8392834 188.8392834source: Illustrating DUG 100606.xls, segment 2m-3m
Incremental Electric Usage: 2010
Principles of the fuel-switching evaluation

18
OverviewOverview
• Goals of the study• Principles of the fuel-switching
evaluation• The role of the Regional Portfolio Model
(RPM)• Preliminary findings
19
How the NWPCCHow the NWPCCApproach DiffersApproach Differs
• No perfect foresight, use of decision criteria for capacity additions
• Likelihood analysis of large sources of risk (“scenario analysis”)
• Adaptive plans that respond to futures
Role of the RPM
20
Special TermsSpecial Terms
• Futures: aspects of the future we cannot control, combinations of uncertainties
• Plans: actions or policies that we can control
Role of the RPM

21
Sources of UncertaintySources of Uncertainty• Fifth Power Plan
– Load requirements– Gas price– Hydrogeneration– Electricity price– Forced outage rates– Aluminum price– Carbon allowance cost– Production tax credits– Renewable Energy Credit
(Green tag value)
• Sixth Power Plan– aluminum price and
aluminum smelter loads were removed
– Power plant construction costs
– Technology availability– Conservation costs and
performance
Role of the RPM
22
Excel Spinner Graph Model
• Represents one plan responding under each of 750 futures
• Illustrates “scenario analysis on steroids”
Role of the RPM

23
The Least-Risk PlanDirect Use of Gas study L814a
and efficient frontier11,765 plans evaluated
Expected Outcomes (NPV $2006 M)
Wo
rst
Ou
tco
mes
(N
PV
$20
06 M
)
Role of the RPM

24
Representationoff-peak formulas not shown
Role of the RPM
1
2
234
6 85
7109

25
Evaluation
Role of the RPM
26
OverviewOverview
• Goals of the study• Principles of the fuel-switching
evaluation• The role of the Regional Portfolio Model
(RPM)• Preliminary findings
27
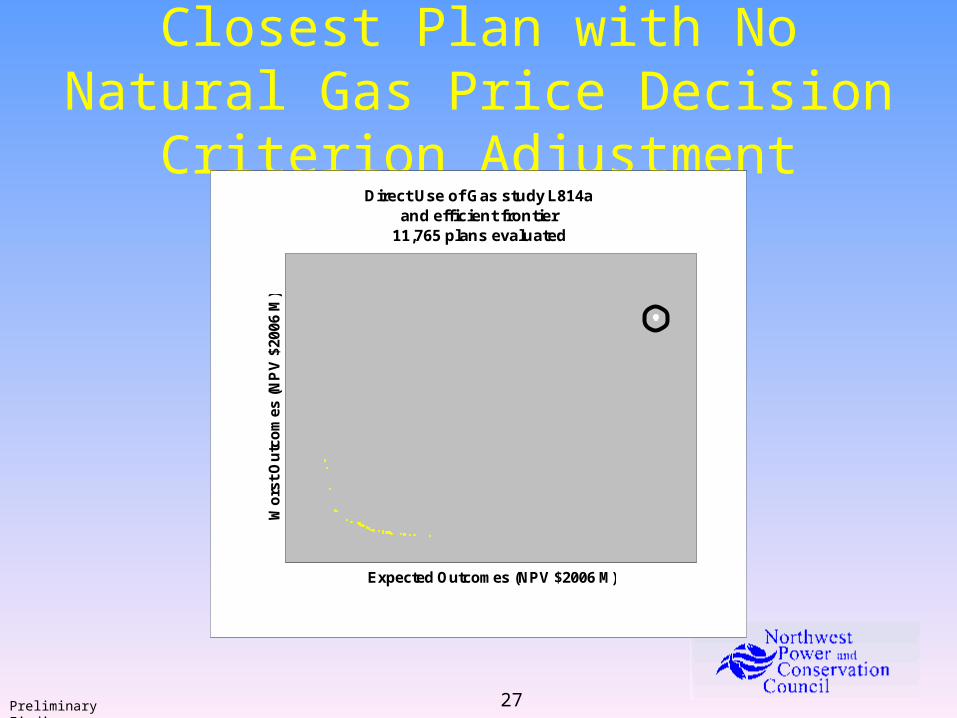
Closest Plan with No Natural Gas Price Decision Criterion Adjustment
Direct Use of Gas study L814aand efficient frontier
11,765 plans evaluated
Expected Outcomes (NPV $2006 M)
Wo
rst
Ou
tco
mes
(N
PV
$20
06 M
)
Preliminary Findings
28
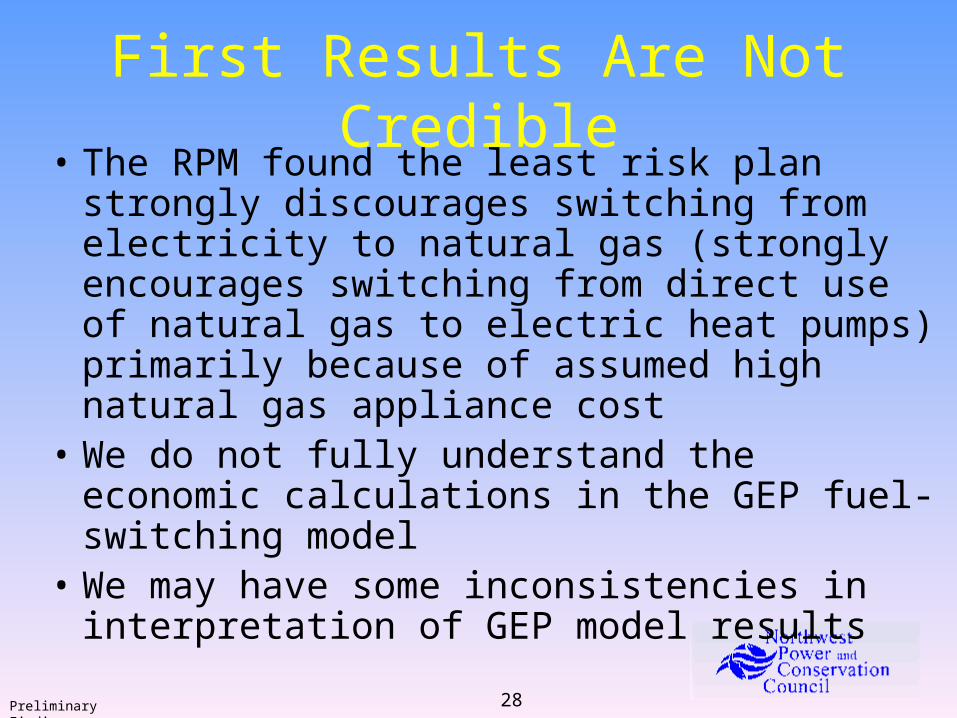
First Results Are Not Credible• The RPM found the least risk plan strongly
discourages switching from electricity to natural gas (strongly encourages switching from direct use of natural gas to electric heat pumps) primarily because of assumed high natural gas appliance cost
• We do not fully understand the economic calculations in the GEP fuel-switching model
• We may have some inconsistencies in interpretation of GEP model results
Preliminary Findings
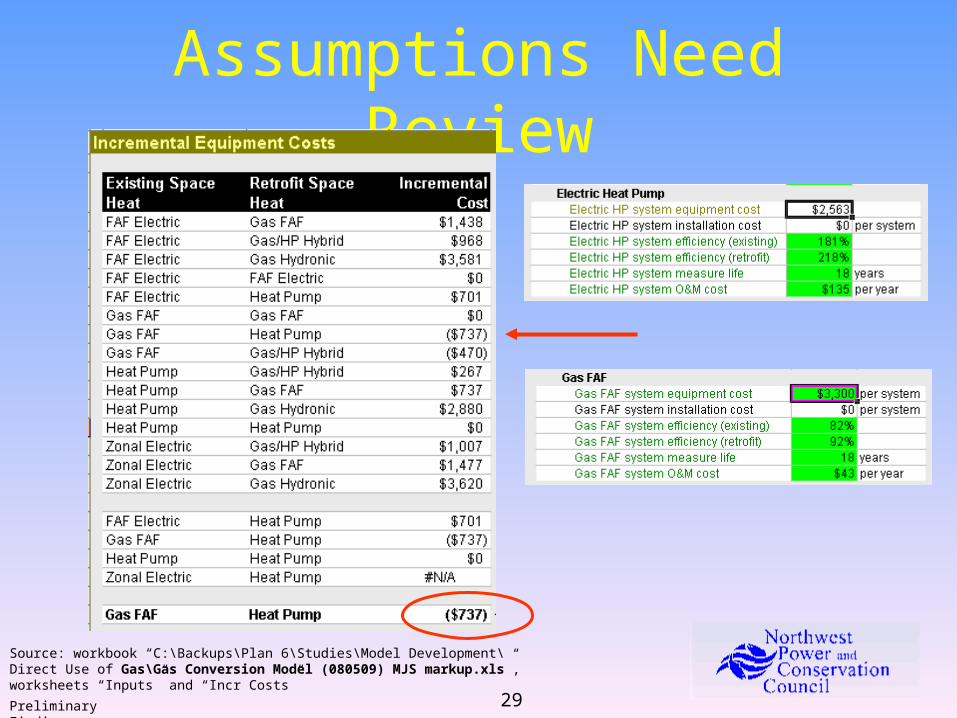
29
Assumptions Need Review
Preliminary Findings
Source: workbook “C:\Backups\Plan 6\Studies\Model Development\Direct Use of Gas\Gas Conversion Model (080509) MJS markup.xls”, worksheets “Inputs” and “Incr Costs”

30
Schedule
• Indication of pieces of study that participants want to review (Today)
• June 29, August 3, and possibly September 28 RTF meetings
• Conservation Resource Advisory Committee (CRAC) meeting on policy implications in September?
• Presentation of results to the Power Committee of the Council (September?)
Preliminary Findings

31
Research Is Full of SurprisesResearch Is Full of Surprises
More information about the Council and its work:
www.NWCouncil.org
This presentation, including the spinner graph:
http://www.nwcouncil.org/dropbox/NWPCC-DUG-100629.zip