1 Oklahoma State Regents for Higher Education Student Preparation Team Cindy Brown [email protected]...
61
1 Oklahoma State Regents for Higher Education Student Preparation Team Cindy Brown [email protected] Dan Craig [email protected] October 2005
-
Upload
kevin-logan -
Category
Documents
-
view
218 -
download
1
Transcript of 1 Oklahoma State Regents for Higher Education Student Preparation Team Cindy Brown [email protected]...

1
Oklahoma State Regents for Higher Education
Student Preparation Team
Cindy Brown [email protected] Craig [email protected]
October 2005

2
Economic Development Employment
Education

3
Education is workforce
preparation.

4
Skill Level ChangesSkill Level Changes
Unskilled
60%
Skilled
20%
Professional
20%
Skilled
65%
Unskilled
15%
Professional
20%
1950 1997
National Summit on 21st Century Skills for 21st Century Jobs

5
Increasing international Increasing international competition:competition:
By 2010, if current trends continue, more than 90 percent of all scientists and engineers in the world will be living in Asia.
South Korea, with one-sixth of our population, graduates as many engineers as the United States.

6
Increasing reliance on and reduced Increasing reliance on and reduced availability of foreign talent to availability of foreign talent to work in the United States:work in the United States:
More than 50 percent of all engineering doctoral degrees awarded by U.S. engineering colleges are to foreign nationals.
However, security concerns in the United States are reducing the number of foreign students, while competition for this talent from other countries and the opportunity to return to their home countries to work is increasing.

7
Alarming domestic trends:
The number of engineering degrees awarded in the United States is down 20 percent from the peak year of 1985.
Although U.S. fourth graders score well against international competition, they fall near the bottom or dead last by 12th grade in mathematics and science, respectively.

8
More than 50 percent of the current science andengineering workforce is approaching retirement. It must be replaced by a largerpool of new talent from a more diverse population.

9
Transition 1In Oklahoma, for every 100 ninth grade students, 73 graduate four years later.
0 10 20 30 40 50 60 70 80 90 100
Oklahoma
U.S. Average
Top State (NJ)

10
Transition 2Of the 73 high school graduates, 36 immediately enter college.
0 10 20 30 40 50 60 70 80 90 100
Oklahoma
U.S. Average
Top State (NJ)

11
Transition 3Of the 36 who enter college, 23 are still enrolled in sophomore year.
0 10 20 30 40 50 60 70 80 90 100
Oklahoma
U.S. Average
Top State (NJ)

12
Transition 4Thirteen (13) go on to graduate within 150% time, with either an associate’s degree within three years or a bachelor’s degree within six years.
0 10 20 30 40 50 60 70 80 90 100
OklahomaU.S. Average
Top State (MA)

13
Oklahoma is better than the national average in the high school graduation rate of 9th graders;
however, OK lags behind the nation in the percent of students who enter, persist, and graduate from college.

14
College begins in Kindergarten

15
State Regents Update
College Admission 2006-2007Concurrent enrollmentPortalSB982ACEEPAS

16
College Admision
Option 1 OU – 24 AND 3.0 or top 50% OSU – 24 USAO – 21 Regionals – 20 Community – no minimum

17
College Admision
Option 2 OU –3.0 AND top 25% OSU – 3.0 AND top 33% USAO – 2.85 AND top 50% Regionals – 2.7 AND top 50% Community – no minimum
18
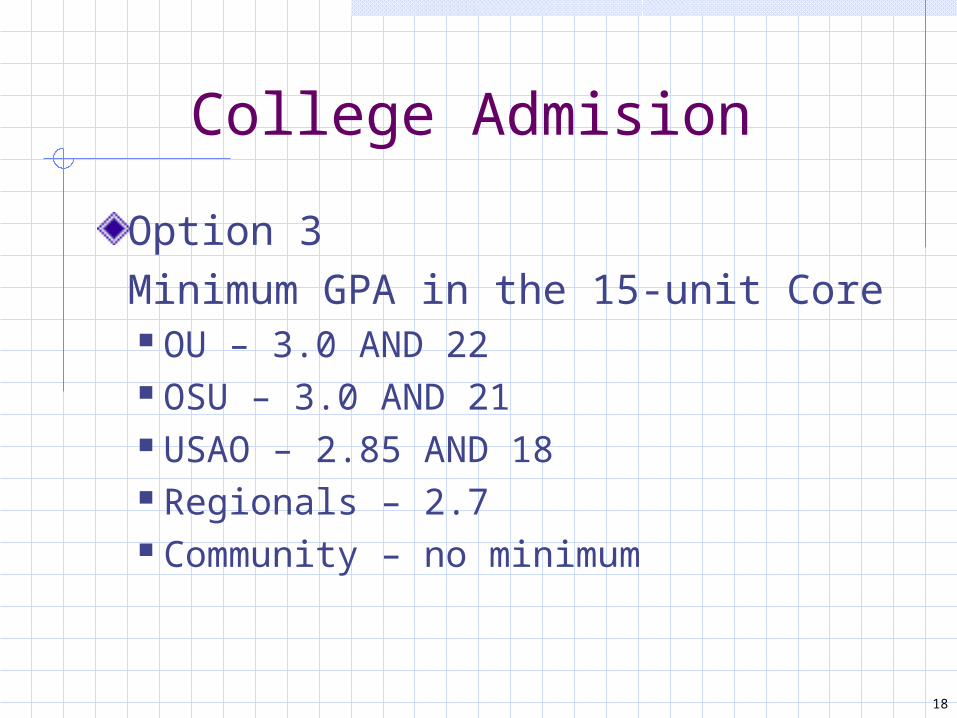
College Admision
Option 3Minimum GPA in the 15-unit Core OU – 3.0 AND 22 OSU – 3.0 AND 21 USAO – 2.85 AND 18 Regionals – 2.7 Community – no minimum

19
College Admision
Right-to-Try OpportunitiesConcurrent Enrollment of H.S. students Admission Standards Tuition Waivers for Seniors (SB
982)6 hours each semesterPilot study

20
Colleges&
Universities
OSRHE
School Counselors
Student Information
Portal
Other Agencies
ACT
Students(& Parents)
CareerTechCenters

21
Student Information
Portal
StudentsStudents
FAFSA and OHLAP applications
Career interest assessment dataCareer interest assessment data
High School courses taken
Student portfolio
Student profile data
Financial aid planning
Academic/Admission information
Career information
Virtual campus tours
Test preparationTest preparation
ACT assessmentACT assessment
OHLAP status and remindersOHLAP status and reminders
Student and Portal Interaction
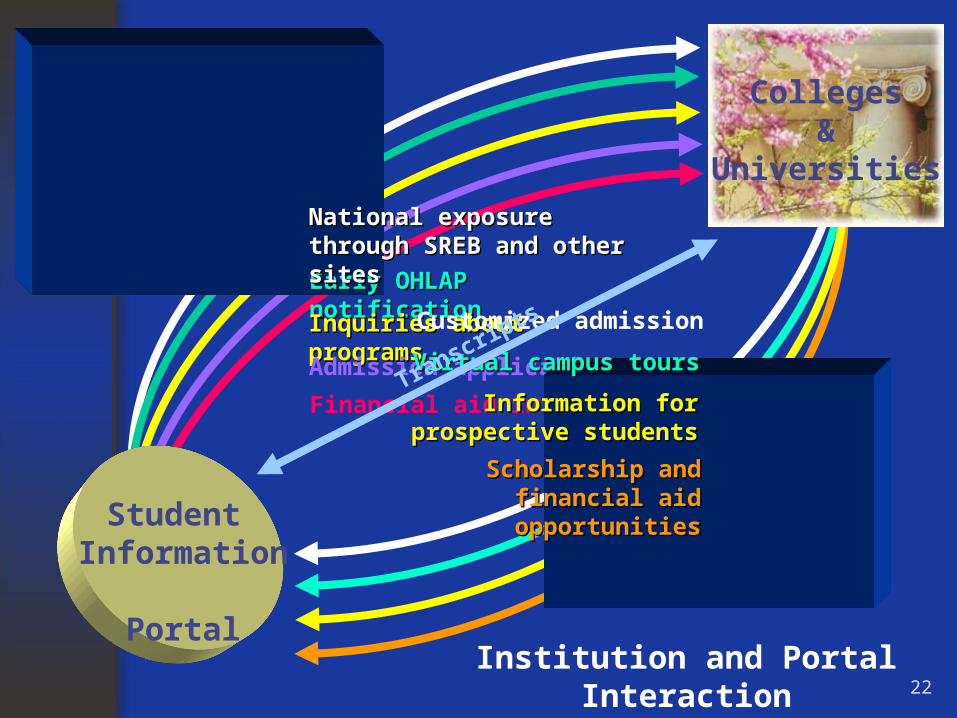
22
Early OHLAP notificationEarly OHLAP notification
Inquiries about programsInquiries about programs
Admission applications
Financial aid information
National exposure through National exposure through SREB and other sitesSREB and other sites
Virtual campus toursVirtual campus tours
Information for Information for prospective studentsprospective students
Scholarship and financial Scholarship and financial aid opportunitiesaid opportunities
Customized admission
Student Information
Portal
Transcripts
Colleges&
Universities
Institution and Portal Interaction

23
Colleges&
Universities
OSRHE
School Counselors
Student applicatio
ns
inquiries
Marketing to
more
students
GEAR UP and customized
student information
OHLAP applications,
inquiries and data
Notification and inquiries
Student preparationStudent
Information Portal
Other Agencies
ACT
Students(& Parents)
Co
mp
reh
en
siv
e
pla
nn
ing
to
ols
CareerTechCenters
Inte
rest
s, p
rep
arat
ion
an
d n
eed
s
Inquiries and registrationsACT, EPAS, WorkKeys
Career and program
info
Applications and inquiries
Labo
r m
arke
t
Wor
kfor
ce in
fom
atio
n

24
SB 982
Achieving Classroom Excellence Act of 2005
aka ACE

25
ACE
Oklahoma Mathematics Improvement Program
Purpose: improve student mastery of PASS for 6th grade math through Algebra I by enhancing teachers’ mastery of subject matter content and process skills.

26
ACE - Oklahoma Mathematics
Improvement Program continued. . .
Teacher stipend of $1,000 for completing professional development (approved by State Board of Education) and passing middle-level/intermediate mathematics Subject Area Test. Mathematics Academies Customized Higher Education Courses Small Learning Community Lesson Studies
10 middle schools with low student achievement provided mathematics laboratory

27
ACE
Beginning in 2009-2010, 8th graders shall demonstrate mastery in reading and mathematics. Satisfactory or advanced on CRT Others will be provided remediation
by supplementary services including Summer academy, Tutoring, Online
coursework, Other IEP students exempt unless in IEP

28
ACEBeginning with 9th graders of 2008-2009, shall demonstrate mastery in 4 of 6 subject areas to receive a diploma. All 6 will be core academic subjects Two of the 4 required EOI shall include Algebra
I, or the additional math test decided by ACE TF, and English II. (the additional math test shall be equal to or greater than Algebra I)
Students not passing will be provided remediation and retake
Two additional EOI shall be determined by legislature based on recommendations of ACE TF
IEP students exempt unless provided for in IEP
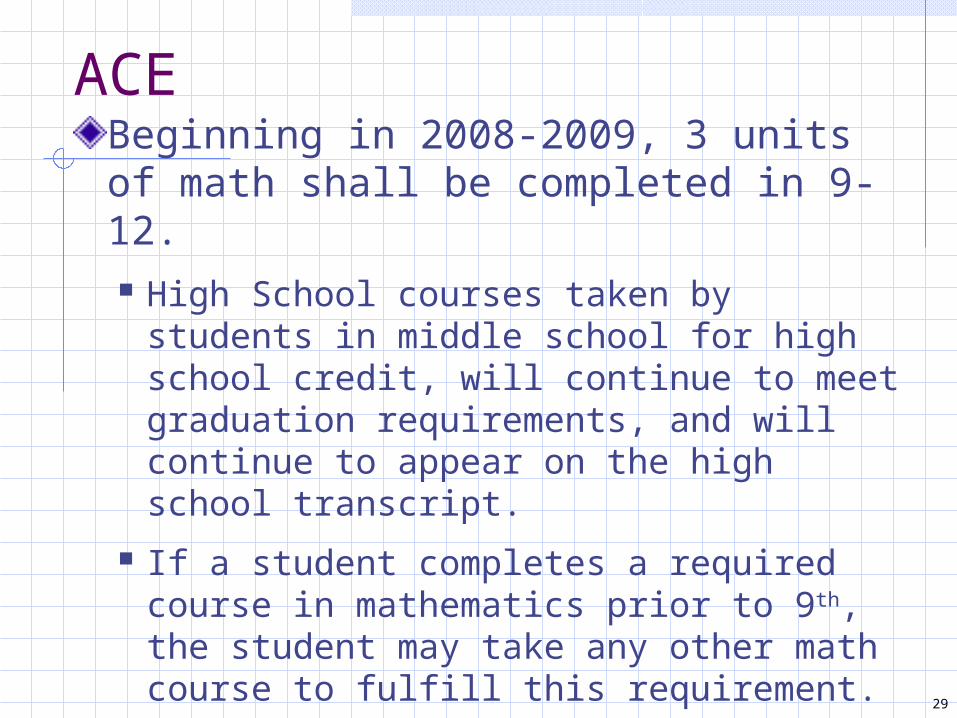
29
ACEBeginning in 2008-2009, 3 units of math shall be completed in 9-12. High School courses taken by students
in middle school for high school credit, will continue to meet graduation requirements, and will continue to appear on the high school transcript.
If a student completes a required course in mathematics prior to 9th, the student may take any other math course to fulfill this requirement.

30
ACEBeginning with 9th graders of 2006-2007, all students shall complete a college preparatory curriculum. 4 units of English 3 units of laboratory science 3 units of mathematics 3 units of history and citizenship skills 2 units of same foreign or non-English language or
2 units of computer technology 1 additional unit selected from above or career and
technology courses approved for college admission 1 unit of fine arts or speech
31
ACE
Beginning in 2011-2012, all districts will provide a full six-hour day of kindergarten
Concurrent enrollment Eligible high school seniors receive 6
hours tuition waiver each semester.

ACE Task Force 32
ACE Task Force Mission
“study testing requirements for eighth-grade students and high school students”
“shall study, hold public hearings and make recommendations”
regarding eighth grade and high school students on 13 items

ACE Task Force 33
ACE Task Force Mission
1. Subjects to be included for demonstration of mastery;
2. Additional end-of-instruction tests to be developed;
3. Benchmarks and cut scores for assessments;

ACE Task Force 34
ACE Task Force Mission
4. Optional methods to demonstrate subject matter mastery;
5. Alternatives for English language learners and special needs students;
6. Exceptions that may be needed;

ACE Task Force 35
ACE Task Force Mission
7. Intervention strategies;
8. Remediation options;
9. Consequences for students;
10. Review of other states’ experiences;
11.Development of an action plan to implement recommendations;

ACE Task Force 36
ACE Task Force Mission12.Information to provide to
teachers, parents and students, that will emphasize this initiative as a tool to improve student success; and
13.Funding necessary to implement recommendations.

ACE Task Force 37
ACE Task Force Objective
The ACE Task Force “shall present a written report of findings and recommendations to the Legislature and the Governor by December 31, 2005.”

38
Data-Driven Decision Making
What is our reality?
What are we doing well?
What are our students not learning?
What must we do differently?
39
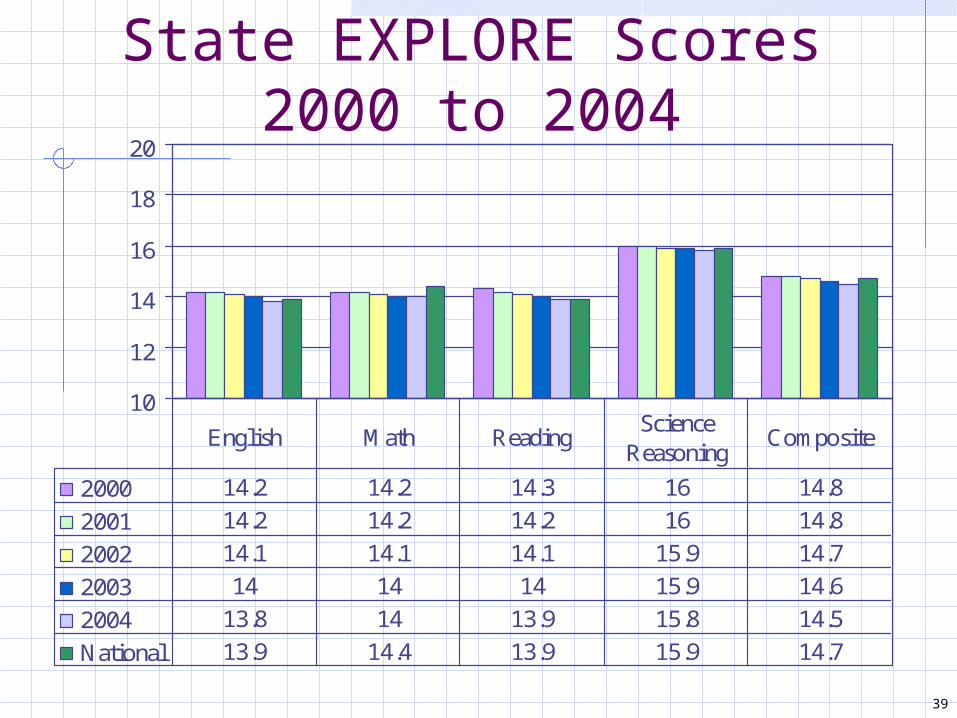
State EXPLORE Scores2000 to 2004
10
12
14
16
18
20
2000 14.2 14.2 14.3 16 14.8
2001 14.2 14.2 14.2 16 14.8
2002 14.1 14.1 14.1 15.9 14.7
2003 14 14 14 15.9 14.6
2004 13.8 14 13.9 15.8 14.5
National 13.9 14.4 13.9 15.9 14.7
English Math ReadingScience
ReasoningComposite

40
Oklahoma African American EXPLORE Scores
0500
1000150020002500300035004000
2000 2840
2001 3063
2002 3171
2003 3479
2004 3806
n
10
15
20
2000 13
2001 12.9
2002 12.9
2003 12.9
2004 12.6
composite

41
Oklahoma American Indian EXPLORE Scores
0
1000
2000
3000
4000
5000
6000
2000 4116
2001 4422
2002 4708
2003 4702
2004 5342
n
10
15
20
2000 14
2001 14
2002 13.9
2003 13.9
2004 13.9
composite

42
Oklahoma Total HispanicEXPLORE Scores
0
500
1000
1500
2000
2500
3000
3500
2000 2158
2001 2330
2002 2630
2003 2809
2004 2944
n
10
15
20
2000 13.4
2001 13.3
2002 13.2
2003 13.2
2004 13.1
composite

43
Oklahoma CaucasianEXPLORE Scores
0
5000
10000
15000
20000
25000
30000
2000 23439
2001 24132
2002 23015
2003 22623
2004 22508
n
10
15
20
2000 15.7
2001 15.7
2002 15.6
2003 15.6
2004 15.3
composite

44
State PLAN Scores 2000 to 2004
10
15
20
2000 16.7 16.6 16.4 17.7 17
2001 16.5 16.5 16.4 17.6 16.9
2002 16.3 16.4 16.3 17.5 16.7
2003 16.4 16.5 16.5 17.5 16.8
2004 16.2 16.5 16.4 17.7 16.8
National 16.1 16.3 15.8 17.4 16.5
English Math ReadingScience
ReasoningComposite
45
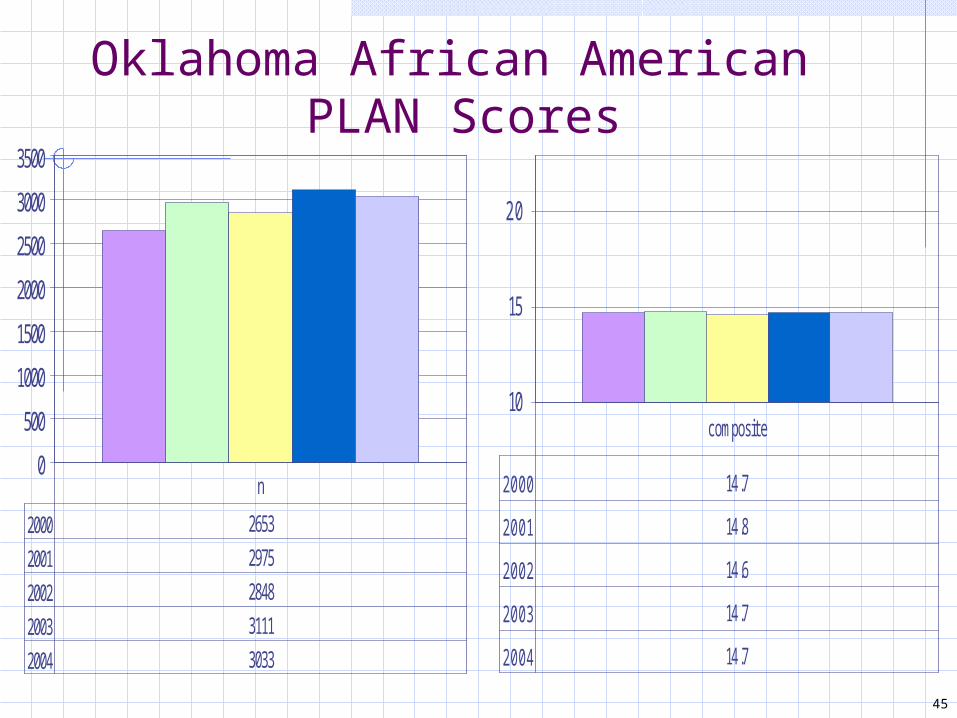
Oklahoma African American PLAN Scores
0
500
1000
1500
2000
2500
3000
3500
2000 2653
2001 2975
2002 2848
2003 3111
2004 3033
n
10
15
20
2000 14.7
2001 14.8
2002 14.6
2003 14.7
2004 14.7
composite

46
Oklahoma American Indian PLAN Scores
0
1000
2000
3000
4000
5000
2000 3865
2001 4069
2002 4203
2003 4406
2004 4630
n
10
15
20
2000 16.2
2001 15.9
2002 15.9
2003 16
2004 16.1
composite

47
Oklahoma Total HispanicPLAN Scores
0
500
1000
1500
2000
2500
2000 1571
2001 1796
2002 1922
2003 2190
2004 2307
n
10
15
20
2000 15.4
2001 15.3
2002 15.1
2003 15.2
2004 15.3
composite

48
Oklahoma CaucasianPLAN Scores
0
5000
10000
15000
20000
25000
30000
2000 23439
2001 24132
2002 23015
2003 22623
2004 22508
n
10
15
20
2000 17.6
2001 17.5
2002 17.4
2003 17.6
2004 17.5
composite
49
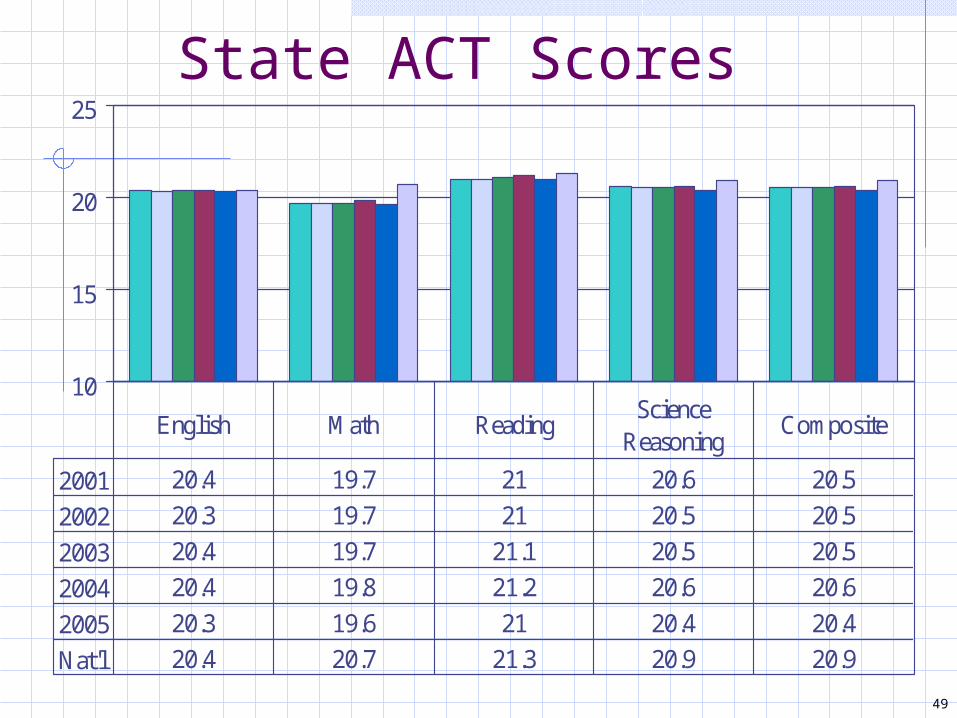
State ACT Scores
10
15
20
25
2001 20.4 19.7 21 20.6 20.5
2002 20.3 19.7 21 20.5 20.5
2003 20.4 19.7 21.1 20.5 20.5
2004 20.4 19.8 21.2 20.6 20.6
2005 20.3 19.6 21 20.4 20.4
Nat'l 20.4 20.7 21.3 20.9 20.9
English Math ReadingScience
ReasoningComposite
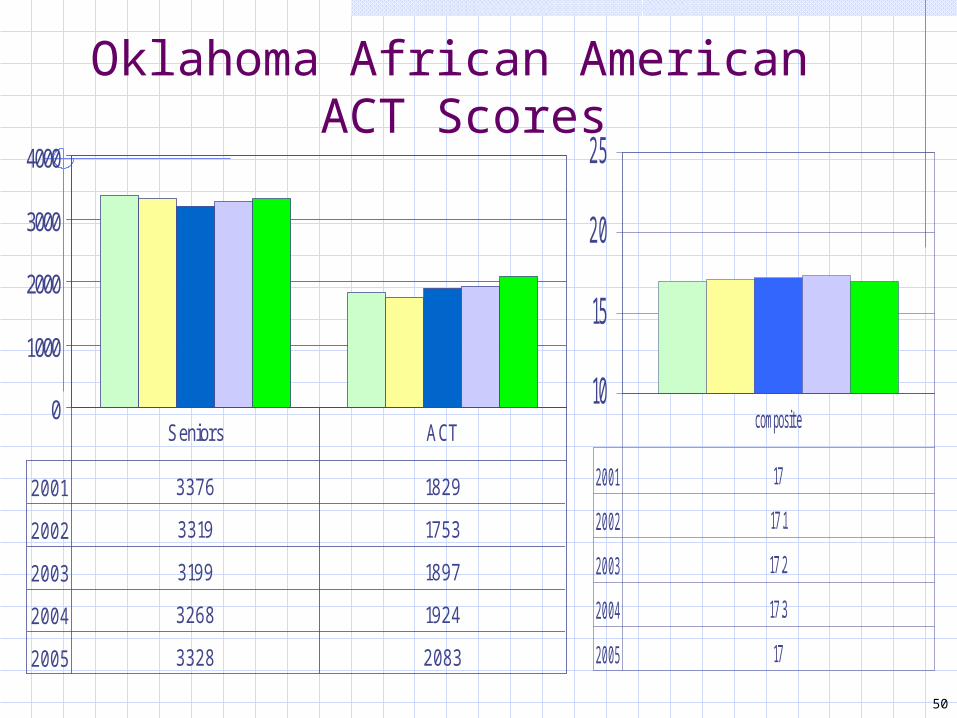
50
Oklahoma African American ACT Scores
0
1000
2000
3000
4000
2001 3376 1829
2002 3319 1753
2003 3199 1897
2004 3268 1924
2005 3328 2083
Seniors ACT
10
15
20
25
2001 17
2002 17.1
2003 17.2
2004 17.3
2005 17
composite

51
Oklahoma American Indian ACT Scores
0
2000
4000
6000
8000
2001 6045 2948
2002 6292 2946
2003 6246 2988
2004 6409 3115
2005 6591 3155
Seniors ACT10
15
20
25
2001 19.5
2002 19.4
2003 19.4
2004 19.6
2005 19.3
composite

52
Oklahoma Total HispanicACT Scores
0
500
1000
1500
2000
2001 1381 868
2002 1475 895
2003 1598 934
2004 1633 921
2005 1832 1144
Seniors ACT
10
15
20
25
2001 19.1
2002 18.7
2003 18.8
2004 19.1
2005 18.3
composite

53
Oklahoma Total CaucasianACT Scores
0
5000
10000
15000
20000
25000
30000
2001 28540 19706
2002 27565 18814
2003 26753 18821
2004 26202 18114
2005 25903 17481
Seniors n
10
15
20
25
2000 21
2001 21
2002 21.1
2003 21.2
2004 21.1
composite

54
Percentage of ACT Students taking Core by Ethnic Group
0%
25%
50%
75%
100%
1999 48% 47% 69% 53% 49% 56%
2000 49% 46% 67% 54% 52% 50%
2001 47% 45% 66% 54% 47% 53%
2002 51% 46% 70% 54% 49% 47%
2003 55% 52% 75% 61% 51% 65%
2004 58% 58% 77% 66% 63% 60%
Afr. Am. Am. Ind. As. Am. Cauc. Mex. Am. Hispanic

55
Core Curriculum/ACT Score Study
for Oklahoma21.7
21.5
22.2
20.9
21.7
20.620.6
21.2
19.8
20.4
18.919.1
19.5
18.0
18.6
17.0
18.0
19.0
20.0
21.0
22.0
23.0
English Math Reading Science Reas Composite
Core or MoreCore or More
TotalTotal
Less than Less than CoreCore
Core Curriculum:Core Curriculum: 4 Units – English4 Units – English3 Units – Math3 Units – Math3 Units – Social 3 Units – Social StudiesStudies3 Units – Nat. Sciences3 Units – Nat. Sciences
Source: 2004 ACT High School Profile - OklahomaSource: 2004 ACT High School Profile - Oklahoma

56
College Credit for AP in Oklahoma
www.okhighered.org/student-center/jrhigh-highscl/earncredit.shtml

57
Oklahoma’s Promise (OHLAP)
OHLAP Enrollment Requirements
• Students must enroll during the 8th, 9th, or 10th grade
• Family income may not exceed $50,000 at the time of enrollment (income is not reconsidered at a later date)

58
0
10
20
30
40
50
60
70
estimated FRL 57 58 52 48 44
# signed up 6 5 2 16 23 23 28 21 19
# completing 4 4 2 14 18
# using 04-05 1 2 1 13 16
2000 2001 2002 2003 2004 2005 2006 2007 2008
A High School OHLAP Statisticsby graduation year

59
Requirements for OHLAP Scholarship Eligibility
• Complete 17-unit core curriculum based on college admission requirements
• Graduate from high school (home schooled students are not currently eligible)
• 2.5 cumulative GPA in the required core
• 2.5 cumulative GPA overall

60
OHLAP Scholarship• Pays the equivalent of public college
tuition; can be used at private colleges and for some career-tech programs.
• Pays only for the actual hours enrolled; no minimum enrollment required.
• Good for up to five years or the completion of a baccalaureate degree

61
Other OHLAP Issues• Math – NOT Intermediate Algebra and
NOT Math of Finance
• History/Citizenship Skills – NOT Psychology and NOT Sociology
• Two 2.5 gpa’s: a 2.5 for the overall courses AND a 2.5 in the 17 unit OHLAP core
• OHLAP Curriculum Checklist
• New website www.okpromise.org