1 Introduction1 Overview of Global ... - KERALA …keralaagriculture.gov.in/htmle/aez/Aez...
100
AEZ Kerala Cebeco India Private Limited Your Partner in Agri-business TABLE OF CONTENTS 1 Introduction ............................................................................................. 1 1.1 Background ........................................................................................ 1 1.2 The objectives of the study .................................................................... 1 1.3 Approach and Methodology ................................................................ 2 1.4 Structure of the study ........................................................................... 4 2 Overview of Global Production and Trade of Horticulture Produce ........... 5 2.1 Global production of Fruits.................................................................... 5 2.2 Global trade of Fruits ............................................................................ 7 2.3 Global production of Vegetables .......................................................... 9 2.4 Global trade of Vegetables ................................................................ 10 2.5 Global production of Floriculture products............................................ 11 2.6 Global trade of Floriculture products.................................................... 13 3 Overview of India’s production of horticulture produce ......................... 17 3.1 Fruits ................................................................................................. 17 3.2 Vegetables ....................................................................................... 18 3.3 India’s Exports ................................................................................... 19 3.4 Flowers............................................................................................. 21 4 Agriculture in Kerala .............................................................................. 23 4.1 Agro-soil Zones of Kerala..................................................................... 23 4.2 Land use Pattern ............................................................................... 25 4.3 Role of State Government in Development of Horticulture ...................... 26 4.4 Kerala Horticulture Development Programme (KHDP)............................. 27 4.4.1 Features .................................................................................................................................................. 27 4.4.2 Activities ................................................................................................................................................. 27 4.4.3 Project outlay and financing pattern ...................................................................................... 28 4.4.4 Self Help Groups................................................................................................................................. 28 4.4.5 Seed processing................................................................................................................................. 29 4.4.6 Technology development through farmer participation.............................................. 29 4.4.7 Credit facilities..................................................................................................................................... 29 4.4.8 Training.................................................................................................................................................... 30 4.4.9 Marketing arrangement for vegetables and fruits ............................................................ 30 4.4.10 Market information centre ............................................................................................................ 30 4.4.11 Farmers field centres ........................................................................................................................ 30 4.4.12 Fruit processing ................................................................................................................................... 31 4.5 Kerala State Horticulture products Development Corporation Ltd. (HORTICORP) .............................................................................................. 31 4.5.1 A brief History....................................................................................................................................... 31 4.5.2 Functional Areas ................................................................................................................................ 32 4.5.3 Achievements ..................................................................................................................................... 33 4.5.4 Products .................................................................................................................................................. 33 4.5.5 Future activities proposed ............................................................................................................. 33 4.5.6 Assistance from government ....................................................................................................... 34 4.6 State Agriculture Department .............................................................. 34 4.7 Kerala Agro Industries Corporation Ltd.................................................. 34 4.8 Other Agencies ................................................................................. 35 4.9 Kerala Agricultural Markets Project (KAMP) ........................................... 35
Transcript of 1 Introduction1 Overview of Global ... - KERALA …keralaagriculture.gov.in/htmle/aez/Aez...

AEZ Kerala Cebeco India Private Limited Your Partner in Agri-business
TABLE OF CONTENTS
1 Introduction............................................................................................. 1
1.1 Background ........................................................................................ 1 1.2 The objectives of the study.................................................................... 1 1.3 Approach and Methodology ................................................................ 2 1.4 Structure of the study ........................................................................... 4
2 Overview of Global Production and Trade of Horticulture Produce........... 5
2.1 Global production of Fruits.................................................................... 5 2.2 Global trade of Fruits............................................................................ 7 2.3 Global production of Vegetables .......................................................... 9 2.4 Global trade of Vegetables ................................................................ 10 2.5 Global production of Floriculture products............................................ 11 2.6 Global trade of Floriculture products.................................................... 13
3 Overview of India’s production of horticulture produce ......................... 17
3.1 Fruits................................................................................................. 17 3.2 Vegetables ....................................................................................... 18 3.3 India’s Exports ................................................................................... 19 3.4 Flowers............................................................................................. 21
4 Agriculture in Kerala.............................................................................. 23
4.1 Agro-soil Zones of Kerala..................................................................... 23 4.2 Land use Pattern ............................................................................... 25 4.3 Role of State Government in Development of Horticulture ...................... 26 4.4 Kerala Horticulture Development Programme (KHDP)............................. 27
4.4.1 Features ..................................................................................................................................................27 4.4.2 Activities .................................................................................................................................................27 4.4.3 Project outlay and financing pattern......................................................................................28 4.4.4 Self Help Groups.................................................................................................................................28 4.4.5 Seed processing.................................................................................................................................29 4.4.6 Technology development through farmer participation..............................................29 4.4.7 Credit facilities.....................................................................................................................................29 4.4.8 Training....................................................................................................................................................30 4.4.9 Marketing arrangement for vegetables and fruits............................................................30 4.4.10 Market information centre............................................................................................................30 4.4.11 Farmers field centres ........................................................................................................................30 4.4.12 Fruit processing...................................................................................................................................31
4.5 Kerala State Horticulture products Development Corporation Ltd. (HORTICORP).............................................................................................. 31
4.5.1 A brief History.......................................................................................................................................31 4.5.2 Functional Areas ................................................................................................................................32 4.5.3 Achievements .....................................................................................................................................33 4.5.4 Products..................................................................................................................................................33 4.5.5 Future activities proposed.............................................................................................................33 4.5.6 Assistance from government .......................................................................................................34
4.6 State Agriculture Department.............................................................. 34 4.7 Kerala Agro Industries Corporation Ltd. ................................................. 34 4.8 Other Agencies ................................................................................. 35 4.9 Kerala Agricultural Markets Project (KAMP) ........................................... 35

AEZ Kerala Cebeco India Private Limited Your Partner in Agri-business
4.9.1 Physical progress................................................................................................................................35 4.9.2 Operational progress .......................................................................................................................36
4.10 Other infrastructural facilities ............................................................ 36 4.11 Credit availability in the state ........................................................... 36
5 Kerala’s Production and Exports of Horticultural Crops........................... 38
5.1 Production of fruits............................................................................. 38 5.2 Vegetables production in Kerala ......................................................... 39 5.3 Causes of low yield in the state............................................................ 40 5.4 Floriculture in Kerala ........................................................................... 42 5.5 Marketing of horticulture produce in Kerala .......................................... 43 5.6 Supply Chain..................................................................................... 44
5.6.1 Farmers....................................................................................................................................................45 5.6.2 Self Help Group / Sangams / Cooperatives.........................................................................45 5.6.3 Pre-harvest contractors ..................................................................................................................46 5.6.4 Village merchants.............................................................................................................................46 5.6.5 Commission agents...........................................................................................................................46 5.6.6 Wholesale merchants......................................................................................................................46 5.6.7 Exporters .................................................................................................................................................46 5.6.8 Retail traders / hawkers ..................................................................................................................47 5.6.9 Co-operative societies....................................................................................................................47 5.6.10 Public sector organizations ...........................................................................................................47
5.7 Pattern of arrival and price of fruits and vegetables ............................... 47 5.8 Current status and prospects of exports of horticultural products from Kerala 51 5.9 Export of Floricultural Products............................................................. 53 5.10 Present constraints and potential for growth....................................... 53 5.11 New Product and Markets................................................................ 57
5.11.1 Cut foliage............................................................................................................................................57 5.11.2 Banana wafers....................................................................................................................................57 5.11.3 Okra..........................................................................................................................................................58
6 SWOT Analysis....................................................................................... 59
6.1 Strengths .......................................................................................... 59 6.2 Weaknesses ...................................................................................... 59 6.3 Opportunities .................................................................................... 59 6.4 Threats............................................................................................. 59
7 Agri Export Zone in Kerala ..................................................................... 60
7.1 Agri Export Zone Scheme.................................................................... 60 7.1.1 The Concept of Agri Export Zone ..............................................................................................60
7.2 Measures envisaged for promoting exports from such Zone .................... 60 7.2.1 Financial Assistance..........................................................................................................................60 7.2.2 Fiscal Incentives..................................................................................................................................61 7.2.3 Monetary Incentives.........................................................................................................................61
7.3 Operation of the Concept .................................................................. 61 7.4 Need for AEZ..................................................................................... 62 7.5 Selection of products ......................................................................... 63 7.6 Project area ...................................................................................... 64 7.7 Identification of Export Markets............................................................ 65 7.8 Export targets for the state.................................................................. 66

AEZ Kerala Cebeco India Private Limited Your Partner in Agri-business
8 Interventions, Investments and Sources of funds .................................... 67
8.1 Approach to accelerate growth of Exports........................................... 67 8.1.1 Area expansion under exportable horticultural crops ....................................................67 8.1.2 Productivity and quality enhancement measures ...........................................................69 8.1.3 Development of appropriate post-harvest technology................................................72 8.1.4 Export Promotion................................................................................................................................74 8.1.5 Research and Development (R&D) .........................................................................................75 8.1.6 Other support measures.................................................................................................................75
8.2 Funding Mechanism........................................................................... 76
9 Concept of Agri Export Zone in Kerala ................................................... 80
9.1 Plan of Action, Deadlines and Administrative Structure........................... 81 9.2 Agencies involved in state level........................................................... 87
9.2.1 Department of agriculture............................................................................................................87 9.2.2 VFPCK......................................................................................................................................................88 9.2.3 Kerala Agro Industries Corporation...........................................................................................89 9.2.4 Kerala State Electricity Board......................................................................................................89 9.2.5 Department of Sales Tax................................................................................................................89 9.2.6 Kerala Agricultural University........................................................................................................89 9.2.7 State level Financial Institutions and Banks ...........................................................................89 9.2.8 Central Tuber Crops Research Institute..................................................................................90 9.2.9 Pineapple Research Centre.........................................................................................................90 9.2.10 Banana Research Station..............................................................................................................90 9.2.11 R&D on post harvest management of pineapple ............................................................91
9.3 Agencies involved - Central Government ............................................. 91 9.3.1 Agricultural and Processed Food Products Development Authority (APEDA)....91 9.3.2 Department of Food Processing Industries (DFPI)..............................................................91 9.3.3 National Horticulture Board..........................................................................................................92 9.3.4 Ministry of Commerce.....................................................................................................................92 9.3.5 NCDC.......................................................................................................................................................92 9.3.6 Indian Institute of Packaging.......................................................................................................92
10 Socio-Economic Benefits....................................................................... 93
10.1 Increased exports and benefits to exporters....................................... 93 10.2 Profits to farmers from production enhancements............................... 93 10.3 Reduction in handling losses............................................................. 93 10.4 Creation of employment ................................................................. 94 10.5 Income from EEC markets................................................................ 94 10.6 The proposed soil & leaf analysis centre ............................................. 94 10.7 Export of value added products ....................................................... 94 10.8 Benefits from ‘Commercial Horticulture farms’ .................................... 94 10.9 Cost Benefit of the project ............................................................... 94
LIST OF TABLES
TABLE 1 M AJOR FRUIT PRODUCING COUNTRIES OF THE WORLD ( IN 000’MT) .................................................................5 TABLE 2 C OUNTRY-WISE PERCENT SHARE OF FRUITS PRODUCTION (2001)........................................................................5 TABLE 3 P RODUCTION, AREA AND PRODUCTIVITY OF MAJOR BANANA PRODUCING COUNTRIES OF THE WORLD IN
2001.................................................................................................................................................................................6 TABLE 4 M AJOR PINEAPPLE PRODUCING COUNTRIES OF THE WORLD...............................................................................6 TABLE 5 M AJOR FRESH FRUIT IMPORTING COUNTRIES OF THE WORLD IN YEAR 2000 ( VALUE IN 000’US$)..................7 TABLE 6 M AJOR FRESH FRUIT EXPORTING COUNTRIES OF THE WORLD IN YEAR 2000 ( VALUE IN 000’US$)..................7

AEZ Kerala Cebeco India Private Limited Your Partner in Agri-business
TABLE 7 B ANANA EXPORTS ......................................................................................................................................................8 TABLE 8 B ANANA IMPORTS ......................................................................................................................................................8 TABLE 9 P INEAPPLE EXPORTS ...................................................................................................................................................8 TABLE 10 P INEAPPLE IMPORTS.................................................................................................................................................9 TABLE 11 MAJOR VEGETABLE PRODUCING COUNTRIES OF THE WORLD ( IN 000’ MT) ...................................................9 TABLE 12 COUNTRY-WISE PERCENT SHARE OF VEGETABLE PRODUCTION (1999-00)................................................... 10 TABLE 13 MAJOR CASSAVA PRODUCI NG COUNTRIES ..................................................................................................... 10 TABLE 14 MAJOR FRESH VEGETABLE IMPORTING COUNTRIES OF WORLD IN 2000 (VALUE IN 000’US$).................. 11 TABLE 15 MAJOR FRESH VEGETABLE EXPORTING COUNTRIES OF WORLD IN 2000 (VALUE IN 000’US$).................. 11 TABLE 16 MAJOR SUPPLIERS OF FLORICULTURE PRODUCE ................................................................................................ 12 TABLE 17 MAJOR CONSUMER OF FLORICULTURE PRODUCE............................................................................................. 12 TABLE 18 W ORLD TRADE IN FLORICULTURE (1999)........................................................................................................... 13 TABLE 19 GROWTH RATE OF INTERNATIONAL TRADE I N CUT FOLIAGE FROM T HE YEAR 1992 TO 1999( IN 000’US$)13 TABLE 20 MAJOR EXPORTERS OF CUT FLOWERS .................................................................................................................14 TABLE 21 MAJOR IMPORTERS OF CUT FLOWERS .................................................................................................................15 TABLE 22 EXPORT DESTINATIONS FOR FLORICULTURE PRODUCTS (FROM THE NETHERLANDS INCLUDING RE-EXPORT ) -
YEAR 1999................................................................................................................................................................... 15 TABLE 23 S HARE OF DIFFERENT FL OWERS IN THE EUROPEAN MARKET ............................................................................... 15 TABLE 24 THE TURNOVER OF TOP 10 CUT FLOWERS AT DUTCH AUCTION (VBA, 1999)............................................. 16 TABLE 25 ALL INDIA AREA , PRODUCTION AND PRODUCTIVITY OF FRUITS ...................................................................... 17 TABLE 26 ALL INDIA AREA , PRODUCTION AND PRODUCTIVITY OF BANANA................................................................. 17 TABLE 27 ALL INDIA AREA , PRODUCTION AND PRODUCTIVITY OF PINEAPPLE.............................................................. 17 TABLE 28 S TATE WISE AREA, PRODUCTION AND PRODU CTIVITY OF BANANA................................................................. 18 TABLE 29 S TATE WISE AREA, PRODUCTION AND PRODU CTIVITY OF PINEAPPLE............................................................... 18 TABLE 30 ALL INDIA AREA , PRODUCTION AND PRODUCTIVITY OF VEGETABLES........................................................... 19 TABLE 31 ALL INDIA AREA , PRODUCTION AND PRODUCTIVITY OF TAPIOCA ................................................................ 19 TABLE 32 S TATE WISE AREA, PRODUCTION AND PRODU CTIVITY OF TAPIOCA................................................................. 19 TABLE 33 EXPORTS OF FRESH FRUITS AND VEGETABLES FR OM INDIA (2000-2001) .......................................................20 TABLE 34 DESTINATION OF INDIA’S EXPORTS OF FRESH VEGETABLES............................................................................... 20 TABLE 35 ALL INDIA AREA , PRODUCTION AND PRODUCTIVITY OF FLOWERS................................................................. 21 TABLE 36 EXPORT OF FLORICULTURE PRODUCTS FROM INDIA (1999-2000)................................................................. 21 TABLE 37 EXPORT OF CUT FOLIAGE FROM INDIA (V ALUE IN 000’ R S)............................................................................ 22 TABLE 38 CLASSIFICATION BASED ON THE PHYSIOGRAPHICAL FEATURES OF THE STATE.................................................23 TABLE 39 AGRO-SOIL ZONES OF KERALA........................................................................................................................... 24 TABLE 40 L AND USE PATTERN IN KERALA (AREA IN HA) ....................................................................................................25 TABLE 41 D ISTRIBUTION OF OPERATIONAL LAND HOLDINGS IN KERALA..........................................................................26 TABLE 42FINANCING PATTERN ............................................................................................................................................. 28 TABLE 43 NEW MARKETS.......................................................................................................................................................36 TABLE 44 AREA UNDER FRESH FRUIT PRODUCTION (2000-01) ........................................................................................ 38 TABLE 45 QUANTITY OF FRESH FRU IT PRODUCTION (2000-01) (IN MTS) ....................................................................... 39 TABLE 46AREA UNDER VEGETABLE PRODUCTION (2000-01) (A REA IN HECTARES)..................................................... 39 TABLE 47 QUANTITY OF VEGETABLE PRODUCTION (IN MT).............................................................................................. 40 TABLE 48 PRODUCTIVITY OF KEY CROPS IN KERALA VIS-À-VIS BEST IN INDIA AND WORLD (MT / HA).......................41 TABLE 49 ESTIMATED DISPATCHES OF PINEAPPLE FROM KERALA...................................................................................... 44 T ABLE 50 M ONTHLY PRICE AND ARRIVAL OF SOME FRUITS & VEGETABLES IN T HIRUVANTHAPURAM WHOLESALE
MARKET , YEAR 2001................................................................................................................................................... 48 T ABLE 51 COMPARISON OF PRICES OF SOME F RUITS AND VEGETABLES BETWEEN THIRUVANATHAPURAM AND
CHENNAI MARKET (YEAR 2000) ................................................................................................................................ 49 TABLE 52 M ONTHLY AVERAGE PRICE S OF PINEAPPLE ( RIPE) FOR THE LAST THREE YEARS IN VAZHAKULAM MARKET OF
ERNAKULAM DISTRICT (PRICE - RS . / KG) .................................................................................................................51 TABLE 53 WHOLESALE PRICE (RS./KG) OF TAPIOCA IN THRISSUR MARKET (JAN. 1999- SEPT . 2002)..................... 51 TABLE 54 EXPORTS OF FRESH FRUITS & VEGETABLES FROM THIRUVANATHAPURAM AIRPORT........................................ 52 TABLE 55 ESTIMATES OF INDIAN MIGRANTS IN THE GULF REGION, 1975-1999........................................................... 54 TABLE 56 PERCENTAGE OF NRIS IN THE TOTAL POPULATION OF MAIN ARAB COUNTRIES IN YEAR 2000................... 54 TABLE 57 L ANDED PRICES OF BANANA IN MAJOR MIDDLE EAST COUNTRIES FROM VARIOUS COUNTRIES OF ORIGIN55 TABLE 58 A IRFREIGHT CHARGES FROM THIRUVANTHAPURAM AIRPORT TO MAJOR EXPORT DESTINATIONS................ 56

AEZ Kerala Cebeco India Private Limited Your Partner in Agri-business
TABLE 59 EXPORTS T O GULF COUNTRIES (QUANTITY IN MT, VALUE IN LACS RS.) ........................................................ 65 TABLE 60 KERALA EXPORT PROJECTIONS ........................................................................................................................... 66 TABLE 61 COVERAGE OF AREA AND FARMERS UNDER THE PROPOSED PROJECT .......................................................... 67 TABLE 62 PROJECT COST AND SOURCES OF FUNDS........................................................................................................... 77 TABLE 63 S UMMARY OF SOURCE WIS E FUNDS REQUIREMENT ............................................................................................ 79 TABLE 64 ESTIMATED PHASING OF FUNDS (RS . IN LACS )................................................................................................... 79 TABLE 65 INCREASE IN EXPORTS & BENEFITS TO EXPORTER S (RS . IN CRORES )................................................................. 93 TABLE 66S UMMARY OF VARIOUS ECONOMIC BENEFITS OF THE PROJECT ........................................................................ 95
LIST OF PERT CHARTS PERT CHART 1 P ROJECT IMPLEMENTATION .......................................................................................................................... 83 PERT CHART 2 D EVELOPMENT OF ORGANISATION AND S YSTEMS................................................................................... 85 ANNEXURES ANNEXURE- I CONTACT L IST …………………..……………..………………………………………….…,,…..… I ANNEXURE- II CROP PRODUCTION PRACTICES AND PLANT PROTECTION MEASU RES .........……..…………..…..… IV ANNEXURE- III DETAILED WORKING OF ECONOMIC INDICATORS (RS . IN LACS) ……………..………….………. XXII

AEZ Kerala 1 Cebeco India Private Limited Your Partner in Agri-business
1 INTRODUCTION
1.1 Background
The Government of India, as a part of the E xim policy announced on 1st April, 2001,
has proposed a bold new initiative for development of Agri Export Zones (AEZs) for
boosting exports of agricultural products in different states. The concept envisages
that the State Government would identify resource specific Agri Export Zones for
end-to-end development for export of specific products from a geographically
contiguous area.
Agri Export Zones (AEZs) are based on a comprehensive ‘product to export market’
approach which encompasses a market driven method of resource identification,
location selection, strengthening of the production function (pre & post-harvest
treatment), infrastructure & logistics, processing and packaging. This concept will
not only result into the ultimate goal of increasing the export earnings, but would
have several benefits like, improvement of agricultural output, productivity, quality,
reduction in post-harvest losses, up-gradation of technology, farmers’ skills and
income. This concept will also result into development of a internationally
competitive production base, increased private investments leading to increased
employment and overall economic development.
In order to take advantage of the above policy, the Secretary (Agriculture)
Department of Agriculture, Government of Kerala commissioned Cebeco India to
conduct a comprehensive study on feasibility of setting-up AEZ in Kerala for
vegetables, fruits and flowers.
Cebeco India is a leading consultancy company in the area of Agri -business in
India and has been associated with APEDA and the Ministry of Commerce to
prepare the ‘Pilot Projects’ for Agri Export Zones and has done several such
assignments for various other states.
1.2 The objectives of the study
In the state of Kerala a variety of horticultural products viz. fruits, vegetables and
flowers are grown. The broad objective of the study is to prepare a detailed report
on setting-up of Agri Export Zones for the selected fruits, vegetables and flowers in
Kerala. The specific issues to be covered are:

AEZ Kerala 2 Cebeco India Private Limited Your Partner in Agri-business
§ World market overview (world trade, existing and potential markets, distribution
channels, requirements of quality, import regulations)
§ Indian market and industry overview (technology evaluation, installed capacity,
capacity utilization, cost structure, viability issues)
§ Backward linkages (availability of raw materials, pre-harvest practices, R&D
requirements for the sector, feasibility of intermediate processing at farm level,
treatment of raw material before processing, packaging etc)
§ Infrastructure and logistics - strengths and weaknesses
§ Constraints and support required.
The scope of work for this study is detailed hereinafter:
1.3 Approach and Methodology
The overall approach used was to document all the relevant information, diagnose
and develop the project. The study of this kind having a vast scope of work requires
collection of lot of information primary as well as secondary; a contact list was
generated for collection of primary information. The following categories were
contacted.
§ Farmers
§ Fruits and vegetables markets – Urban, Rural and New EU funded
§ Exporters’ Associations and Individual Exporters
§ Processors
§ Commission Agents/Traders
§ Government officials
§ State Government Sponsored Projects associated with promoting horticulture in
Kerala i.e. VFPCK (KHDP), HORTICORP
§ Central Agencies – APEDA, NHB, MFPI, MOC
§ Organizations associated with consultancy & financing like AFC, NABARD
§ Relevant academic and R&D Institutions – KAU, CTCRI, Pineapple Research
Institute, The list of field contacts is given in Annex 1. Information was collected using a
checklist designed for collection of specific information for each contact.
For the collection of secondary information extensive desk research was done using
internet, several books, journals, magazines and published materials was scanned.

AEZ Kerala 3 Cebeco India Private Limited Your Partner in Agri-business
From Department of Agriculture in Kerala, a lot of published information was
collected.
The list of documents / reports made available by Department of Agriculture and
other agencies in Kerala is given below:
§ Status of Agriculture in Kerala – 1998
§ Project preparation and monitoring all Department of Agriculture
§ Data book on Agriculture 2000 by State Planning Board
§ Farm Guide 2002 – Farm Information Bureau
§ Economic Review 2001 by State Planning Board
§ A study of vegetables and fruits marketing in Kerala by Agricultural Finance
Corporation Ltd.
§ Report on cost of cultivation of important crops in Kerala 1997-98 by Department
of Economics and Statistics
§ Agricultural Statistics 2000-2001
§ Department of Economics & Statistics
§ Assessment of the scope for floriculture development in Kerala by Agricultural
Finance Corporation Ltd.
§ Package of practices for crops by Kerala Agricultural University
§ Proceeding of the Seminar on Kerala Floriculture 2020 by College of Horticulture,
Kerala Agri University.
§ Poten tial linked credit plan 2002-2007 for all the districts of Kerala by National
Bank for Agriculture and Rural Development. Besides use of above mentioned reports and documents, Cebeco India’s in-house
database was used for supplementing the information collected from field and
secondary sources. Wherever, information gaps were observed; the information
was sourced from Cebeco India’s associates in India and abroad.
The information, thus collected was analyzed and a multidisciplinary team
deployed for this study discussed key findings, which form the basis of
recommendations in this report. The draft report was sent to Department of
Agriculture, Government of Kerala for comments and a presentation was also
made to the Honorable Minister for Agriculture and coir and concern senior officers
of Government of Kerala. While finalizing the report the comments and suggestions
received have been taken into consideration.

AEZ Kerala 4 Cebeco India Private Limited Your Partner in Agri-business
The detailed framework of AEZs has been recommended keeping in view
interventions required for setting-up of AEZs in Kerala. The cost estimates have been
arrived at keeping in view local conditions, Cebeco India’s experience in similar
studies and budgetary quotes from the suppliers & contractors.
1.4 Structure of the study This study report incorporates findings from the field investigations and studies
undertaken for the purpose of evolving an integrated approach for “product to
export markets for the selected products”. The study focuses on a market driven
method of resource identification, location selection, strengthening of the
production function (pre and post harvest treatment), infrastructure and logistics,
processing and packaging by setting up of Agri Export Zone. The main focus in this
study is to exclusively explore some products in Kerala under Agri export concept
and integrate various activities. Thus, report essentially deals with different major
components, which constitute different sections of the report.
Firstly, for trend analysis, the current status of production and trade of horticulture
produce in world have been incorporated. Likewise an in-depth analysis of Indian
scenario has also been undertaken. With a view to identify the constraints/weak
links in the chain, the two subsequent sections are added regarding state of Kerala
viz . present agriculture scenario and exports. A qualitative analysis is carried out
under the SWOT analysis section. An analysis of competitiveness of selected
products from AEZ has been carried out, leading to recommendations of steps
required to achieve export promotion targets, covering all aspects of growing (pre
& post harvest), processing, packaging, storage and transportation etc. in line with
the requirements of international markets. A clear picture of fund inflow has been
described under the section intervention, investment and sources of funds. Role of
different government and non -government bodies has been defined clearly for
proper implement of AEZ scheme under the implementation plan. And lastly, the
Socio -economic benefits associated with the project have also been evaluated,
and a cost benefit analysis of the project has also been presented.

AEZ Kerala 5 Cebeco India Private Limited Your Partner in Agri-business
2 OVERVIEW OF GLOBAL PRODUCTION AND TRADE OF HORTICULTURE PRODUCE
The world production of horticulture produce is continuously increasing due to the
increa se in its global demand. Since the trade of the horticulture produce is
becoming more and more organized, so the trend is shifting towards market-
oriented production in developing countries also In this chapter, important statistics
related to global production and trade of fruits, vegetables and floriculture is
presented:
2.1 Global production of Fruits
The global production of fruits has shown very little growth during last four years. The
present level of world fruit production is 466.3 lac MT. China is the largest producer
of fruits in world, producing 67.7 lac MT followed by India which accounts for 48.5
lac MT. The major list of fruit producing countries in the world along with total
production of fruits is given in table 1.
Table 1 Major fruit producing countries of the world (In 000’MT) Country 1997 1998 1999 2000 2001
World 442,459 433,764 457,797 466,414 466,340
China 53,325 56,686 64,825 64,613 67,766
India 40,912 41,607 45,758 48,570 48,570
Brazil 36,778 34,190 37,0 9 3 33,118 31,731
USA 32,335 31,506 28,064 32,600 29,862
Italy 15,633 17,046 18,426 17,880 18,377
Spain 15,425 14,024 15,421 16,166 14,834
Mexico 12,594 11,730 12,513 13,290 13,236
France 11,019 10,340 11,700 11,155 11,169
Turkey 9,950 10,479 10,624 10,539 10,659
Philippines 9,791 9,156 10,302 10,597 11,053
Others 204,693 196,995 203,065 207,881 209,077
Source: NHB database 2000 and 2001
Table 2 Country-wise percent share of fruits production (2001)
Country % share
China 15 India 10 Brazil 7 USA 6 Italy 4 Spain 3 Mexico 3 France 2 Turkey 2 Philippines 2 Others 46
Source: NHB database 2000 and 2001
Major Fruit producing countries of world
Mexico 3%
Turkey 2%
Philippines 2%
France 2%
Italy 4% Spain
3%
USA6%Brazil
7%
China 15%
India 10%
others46%

AEZ Kerala 6 Cebeco India Private Limited Your Partner in Agri-business
It can be seen from the table 2 that India is a major producer of fruits accounting
for 10% of global production and ranks second after China.
Table 3 Production, Area and productivity of Major Banana producing countries of the world in 2001
Area in 000 HA Production in 000 MT Productivity in MT/HA Destination
1997 1998 1999 2000 2001 1997 1998 1999 2000 2001 1997 1998 1999 2000 2001
World 3900 3873 4020 4144 4202 60529 58211 64422 67545 68651 15.52 15.03 16.03 16.30 16.34
India 447 446 464 490 490 12642 12425 15100 16000 16000 28.28 27.86 32.54 32.65 32.65
Ecuador 211 207 194 194 229 7494 5463 6392 6477 7561 35.48 26.40 33.02 33.34 33.02
Brazil 533 518 521 521 514 5412 5322 5528 6079 5744 10.16 10.27 10.61 11.66 11.18
China 189 187 212 258 259 3097 3734 4407 5140 5393 16.38 19.94 20.82 19.90 20.82
Philippines 338 328 372 383 400 3774 3493 4571 4930 5061 11.16 10.66 12.28 12.86 12.65
Indonesia 264 258 270 285 285 3057 3177 3376 3747 3600 11.59 12.29 12.51 13.15 12.63
Costa Rica 4 9 4 7 4 9 4 8 5 0 2300 2500 2420 2250 2270 46.76 53.23 49.56 46.80 45.40
Mexico 6 8 6 6 7 5 7 2 7 5 1714 1526 1738 1863 1977 25.29 22.97 23.06 25.90 26.37
Thailand 130 134 134 134 134 1700 1720 1720 1720 1720 13.08 12.84 12.84 12.84 12.84
Burundi 295 295 295 295 300 1543 1399 1511 1514 1549 5.23 4.74 5.12 5.13 5.16
Source: www.fao.org
Amongst fruits, banana is a major crop globally. Interestingly, India has emerged as
a top banana producing country accounting for about 24% of global production
and in terms of productivity too it ranks quite high. Therefore, Banana holds a lot of
potential to be tapped by Indian entrepreneurs in the global market.
Table 4 Major Pineapple producing countries of the world
Area in 000 HA Production in 000 MT Productivity in MT/HA Destination
1997 1998 1999 2000 2001 1997 1998 1999 2000 2001 1997 1998 1999 2000 2001
World 676 692 719 752 766 1244812150 136051344913739 18.4017.56 18.92 17.87 17.93
Thailand 8 5 8 2 9 7 9 7 9 7 2083 1786 2372 2287 2300 24.6021.82 24.43 23.51 23.64
Philippines 4 0 3 8 3 7 4 3 4 5 163 8 1489 1530 1525 1572 40.5039.47 40.88 35.09 34.93
Brazil 5 4 5 5 5 7 5 6 5 9 1073 1113 1477 1293 1442 20.0420.24 25.95 23.19 24.31
China 3 7 3 7 4 7 5 3 5 8 828 961 1231 1214 1284 22.5625.83 26.03 23.12 22.25
India 8 2 8 2 7 4 8 0 8 0 1250 1280 1006 1100 1100 15.2 4 15.61 13.56 13.75 13.75
Nigeria 110 115 115 115 115 830 857 881 881 881 7.55 7.45 7.66 7.66 7.66
Mexico 9 1 2 1 2 1 2 1 3 391 481 504 522 535 43.0041.78 43.65 43.35 42.80
Costa Rica 9 9 1 0 1 3 1 2 355 400 445 475 475 38.7143.01 43.84 38.00 39.58
Colombia 5 5 9 8 9 313 116 388 338 360 58.1020.12 41.31 39.98 40.00
Viet Nam 2 5 2 8 3 6 3 7 37, 199 243 255 291 312 7.72 8.46 7.06 7.98 8.33
Source: www.fao.org

AEZ Kerala 7 Cebeco India Private Limited Your Partner in Agri-business
In case of pineapple India ranks fifth in terms of production, the major producing
countries are Thailand, Philippines and Brazil. It can be seen from the table 4 that the
productivity of pineapple is very low in India as compared to countries like Mexico
and Philippines.
2.2 Global trade of Fruits Table 5 Major fresh fruit importing countries of the world in year 2000 (value in 000’US$) Countries Import Countries Import
World 649,451 Canada 24,588 China, Macao SAR 119,499 Italy 18,264 France 78,070 Japan 15,590 United States of America 49,021 United Kingdom 14,755 Germany 42,790 Indonesia 13,746 Netherlands 30,575 United Arab Emirates 13,400 Russian Federation 29,507 India 197 Namibia 25,000
Source: FAO, 2000 Source: FAO, 2000 Table 6 Major fresh fruit exporting countries of the world in year 2000 (value in 000’US$) Countries Export
World 495,960 Thailand 109,516 Spain 78,930 China 72,587 Tajikistan 32,700 France 21,771 Netherlands 20,221 United States of America 18,454 China 17,705 Vie tnam 12,400 Colombia 11,160 India 8,280 Belgium 7,297 Pakistan 7,135 Source: FAO, 2000 The volume of international trade of fruits is substantial. The major exporting countries
are Thailand, Spain and China. India’s share in the trade is only about 2.5% and it
ranks twelfth. Even though India is top producer of banana it doesn’t find place
among the top ten Banana exporting countries as export volumes are negligible.
Same is case with pineapple. The details are given in tables 7 to table 10:

AEZ Kerala 8 Cebeco India Private Limited Your Partner in Agri-business
Table 7 Banana Exports
Qty. in MT Value (1000 $) Destination 1996 1997 1998 1999 2000 1996 1997 1998 1999 2000 World 13,910,315 14,514,06413,909,31914,060,99014,222,881 4,844,9925,051,4134,893,2134,675,3194,306,265Ecuador 3,8 66,079 4,462,099 3,889,2173,966,126 3,993,968 964,119 1,311,6391,058,729 945,560 809,364
Costa Rica 2,102,830 2,025,549 2,288,4972,259,126 2,096,465 631,853 588,029 684,707 641,625 553,202
Colombia 1,476,523 1,586,029 1,508,4871,584,000 1,710,949 459 ,159 503,196 476,102 478,000 480,620
Philippines 1,252,196 1,143,336 1,149,5521,319,632 1,599,920 236,267 216,556 217,040 240,703 291,651
Guatemala 611,183 659,392 794,240 623,583 801,514 155,189 151,064 191,372 135,351 167,451
Panama 631,953 608,208 462,415 593,364 489,284 184,031 179,841 138,748 182,253 148,328
USA 408,741 418,823 416,520 418,813 400,188 195,167 189,237 177,013 161,106 157,410
Côte d’Ivoire 194,235 200,616 206,060 241,580 243,032 87,435 68,633 68,966 76,723 68,470
France 149,842 2 49,325 250,205 250,024 241,679 108,626 139,553 174,377 144,484 117,861Source: www.fao.org
Table 8 Banana Imports
Qty. in MT Value (1000 $) Destination
1996 1997 1998 1999 2000 1996 1997 1998 1999 2000
World 13,602,42213,567,95513,261,263 14,066,38314,268,5627,062,6526,615,3526,596,7556,573,679 6,052,707
USA 3,776,992 3,772,694 3,913,314 4,295,2914,030,6361,368,4291,388,8531,387,1941,389,355 1,317,485
Germany 1,197,779 1,113,889 9 8 7,354 994,3321,114,505 897,479 742,716 686,452 689,414 621,557
Japan 818,712 885,140 864,854 983,2041,078,655 433,219 435,754 469,913 547,846 551,287
U K 672,413 634,285 755,098 730,478 742,933 502,881 484,041 577,874 534,273 483,086
Italy 543,213 515 ,345 524,852 601,980 604,774 384,682 369,439 376,793 346,032 315,580
China 512,859 547,042 539,133 431,737 593,533 140,907 145,771 163,151 140,506 169,296
Russian Fed. 308,616 660,681 477,114 377,888 502,952 118,605 153,624 150,257 151,248 175,054
Canad a 408,209 417,597 416,436 419,474 398,616 174,597 168,096 161,246 149,196 142,269
France 604,912 334,268 310,228 333,387 340,676 339,435 231,785 223,259 200,823 164,265
Source: www.fao.org Table 9 Pineapple Exports
Qty. in MT Value (1000 $) Destination
1996 1997 1998 1999 2000 1996 1997 1998 1999 2000 World 839,152 901,585 860,4721,054,320 1,039,209346,072 369,308 377,037 438,355 414,995Costa Rica 179,451 250,100 271,272 304,418 322,453 6 8,932 102,848 114,968 128,234 121,550Côte d’Ivoire 170,406 175,064 149,356 201,787 187,836 57,063 49,547 37,250 54,549 47,083Philippines 143,994 144,802 117,436 127,682 135,484 24,514 27,189 20,841 22,814 24,794France 77,181 85,445 75,560 108,172 77,3 7 1 55,467 59,753 55,494 63,926 53,737Belgium 0 0 0 0 64,419 0 0 0 0 44,210Honduras 30,636 22,949 43,100 43,500 41,511 8,744 5,645 18,500 19,200 15,774USA 17,792 23,788 25,063 31,521 40,064 10,936 15,585 18,202 22,128 28,017Ghana 26,750 25,402 21,300 21,849 26,173 9,051 9,998 11,676 11,593 11,514Mexico 10,198 18,337 19,827 19,612 24,409 3,362 4,596 5,961 7,032 8,297Netherlands 24,202 20,082 14,447 23,456 19,171 23,278 19,524 14,701 19,349 15,889Source: www.fao.org

AEZ Kerala 9 Cebeco India Private Limited Your Partner in Agri-business
Table 10 Pineapple Imports
Qty. in MT Value (1000 $) Destination
1996 1997 1998 1999 2000 1996 1997 1998 1999 2000
World 776,776 867,596 860,739 1,031,474 1,044,333480,130 524,530 504,601 585,293 623,043
USA 135,255 2 03,993 252,848 283,090 318,837 64,029 102,248 103,259 145,206 157,591
France 142,250 142,833 131,940 168,211 148,239 94,777 95,146 89,693 89,588 93,524
Japan 96,618 96,088 84,710 89,866 100,092 44,710 45,667 37,964 44,007 49,557
Belgium 0 0 0 0 81,686 0 0 0 0 57,934
Italy 47,820 50,755 47,396 74,366 67,677 35,185 37,469 37,567 49,327 51,822
Germany 46,264 40,424 38,417 60,931 57,354 36,856 33,657 35,979 45,409 43,925
Canada 17,669 24,120 25,568 32,507 41,000 9,885 14,512 17,291 21,149 25,914
Spain 29,011 29,422 24,984 39,440 31,170 21,087 21,353 19,073 25,916 27,460
United Kingdom 25,279 31,253 30,582 30,903 29,309 23,476 25,137 20,777 20,241 19,912
Korea, Republic 18,216 20,229 11,659 19,469 21,790 9,807 11,400 6,727 10,038 10,961
Source: www.fao.org
2.3 Global production of Vegetables This section is related to second category i.e. vegetable, which is a main
component of daily diet in all the countries. Like fruits, in vegetables also China
occupied the leadership position producing 107 million MT vegetables. India holds
a distant second rank with production of 25 million MT of vegetables.
Table 11 Major vegetable producing countries of the world (in 000’ MT) Country 1997 1998 1999 2000 2001
World 174,480 180,339 184,212 193,626 196,083
China 93,545 95,998 97,580 104,988 107,510
India 20,000 22,000 24,000 25,000 25,000
Viet Nam 4,250 4,300 4,300 4,350 4,350
Philippines 3,700 3,900 4,020 4,100 4,200
Nigeria 3,657 3,815 3,868 3,868 3,868
Korea 3,338 3,492 3,346 3,700 3,800
Russian Fed. 3,210 3,114 3,379 3,500 3,300
Japan 3,136 2,973 3,022 2,900 2,900
Myanmar 2,500 2,700 2,800 2,800 2,800
Korea, D P Rep 2,000 2,200 2,200 2,400 2,400
Brazil 2,150 2,200 2,200 2,200 2,200
Others 32,994 33,647 33,497 33,820 33,755
Source: www.fao.org

AEZ Kerala 10 Cebeco India Private Limited Your Partner in Agri-business
Table 12 Country-wise percent share of vegetable production (1999-00)
Country % share
China 5 6
India 1 3
Vietnam 2
Philippines 2
Nigeria 2
Korea 2
Russian Fed. 2
Japan 1
Myanmar 1
Korea, D P Rep 1
Brazil 1
Others 1 7
Source:www.fao.org Table 13 Major cassava producing Countries
Area in 000 HA Production in 000 MT Productivity in MT/HA Destination
1997 1998 1999 2000 2001 1997 1998 1999 2000 2001 1997 1998 1999 2000 2001
World 1597316545166411703217020161950 163613171918 176784 178868 10.14 9.89 10.33 10.38 10.51
Nigeria 2697 3043 3072 3135 3135 32050 32695 32697 33854 3385411.88 10.75 10.64 10.80 10.80
Brazil 1552 1579 1571 1722 1741 19896 19503 20864 23336 2408812.82 12.35 13.28 13.55 13.84
Thailand 1230 1044 1065 1131 1150 18084 15591 16507 19064 1828314.70 14.93 15.49 16.86 15.90
Indonesia 1243 1205 1350 1284 1280 15134 14696 16438 16089 1615812.17 12.19 12.18 12.53 12.62
Congo 2021 2103 2034 1967 1902 16402 17060 16500 15959 15436 8.11 8.11 8.11 8.11 8.11
Ghana 589 630 640 600 600 7000 7227 7845 8107 8512 11.88 11.48 12.25 13.51 14.19
India 256 264 26 8 270 270 5663 6682 6700 7000 7000 22.11 25.28 25.00 25.93 25.93
Tanzania, 564 693 656 848 761 5700 6128 7182 5758 5650 10.11 8.84 10.95 6.79 7.42
Mozambiq
ue 992 1015 958 926 926 5337 5639 5353 5362 5362 5.38 5.56 5.59 5.79 5.79
Uganda 342 356 375 401 390 2291 3204 4875 4966 5265 6.70 9.00 13.00 12.38 13.50
Source: www.fao.org Cassava is a vegetable, which is important for Kerala. Although it is not among the
widely produced vegetable but its production is increasing appreciably all over the
world. Nigeria has the leadership position, in terms of total production, whereas
India is having the highest productivity viz. of 25MT/HA.
2.4 Global trade of Vegetables
The global trade of vegetable is of 920 million US$. UK is the major importer of
vegetable in the world followed by Germany, whereas the biggest exporter is USA.
China and India, who are the largest producer of vegetables in the world occupy
the third and tenth rank respectively in vegetable exports.
Major Vegetable producing countries
Myanmar1%
Korea2%
China56%
Russian Fed.2% Japan
1%Nigeria
2%
Viet Nam2%
Philippines2%
India13%
Korea, D P Rep1%
Brazil1%
Others17%
AEZ Kerala 11 Cebeco India Private Limited Your Partner in Agri-business
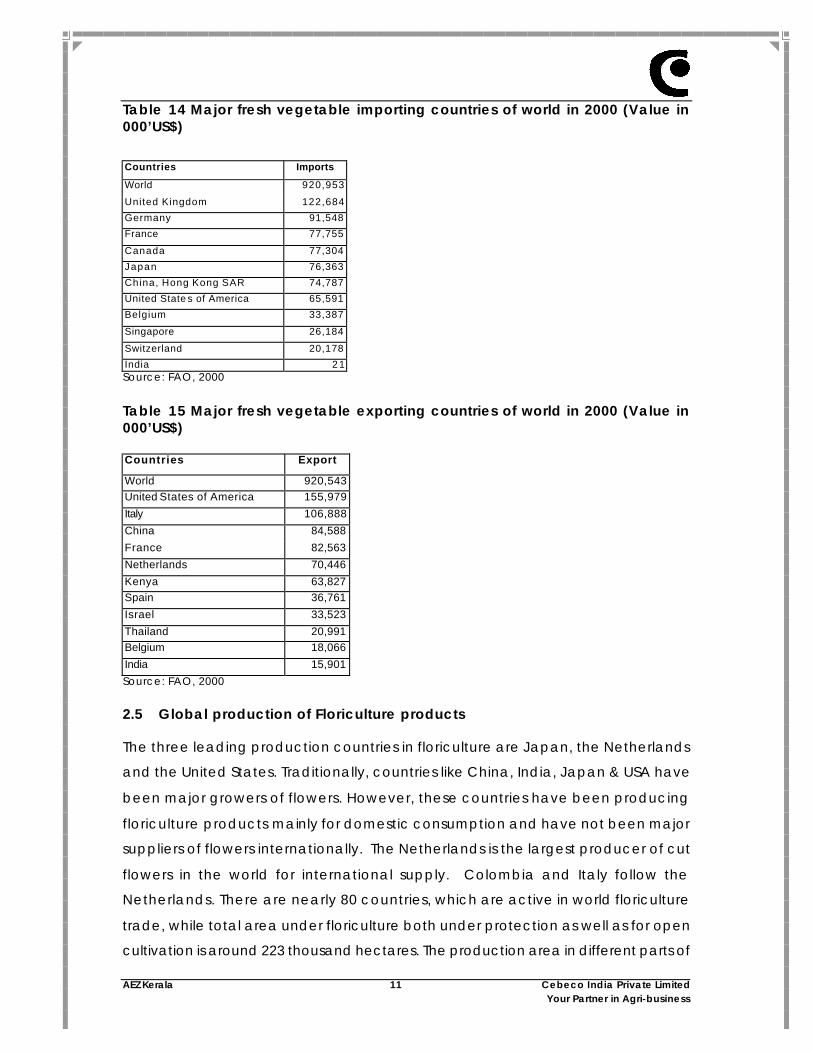
Table 14 Major fresh vegetable importing countries of world in 2000 (Value in 000’US$) Countries Imports
World 920,953
United Kingdom 122,684 Germany 91,548 France 77,755
Canada 77,304 Japan 76,363 China, Hong Kong SAR 74,787 United State s of America 65,591 Belgium 33,387
Singapore 26,184
Switzerland 20,178 India 2 1 Source: FAO, 2000 Table 15 Major fresh vegetable exporting countries of world in 2000 (Value in 000’US$) Countries Export
World 920,543 United States of America 155,979 Italy 106,888 China 84,588 France 82,563 Netherlands 70,446 Kenya 63,827 Spain 36,761 Israel 33,523 Thailand 20,991 Belgium 18,066 India 15,901 Source: FAO, 2000
2.5 Global production of Floriculture products
The three leading production countries in floriculture are Japan, the Netherlands
and the United States. Traditionally, countries like China, India, Japan & USA have
been major growers of flowers. However, these countries have been producing
floriculture products mainly for domestic consumption and have not been major
suppliers of flowers internationally. The Netherlands is the largest producer of cut
flowers in the world for international supply. Colombia and Italy follow the
Netherlands. There are nearly 80 countries, which are active in world floriculture
trade, while total area under floriculture both under protection as well as for open
cultivation is around 223 thousand hectares. The production area in different parts of

AEZ Kerala 12 Cebeco India Private Limited Your Partner in Agri-business
the world under open field cultivation is about 60 % and 40 % is under protected
cultivation. China has maximum area under floriculture i.e. 59 ha (26%), followed by
India (15%) and Japan (9%).
According to the statistics available from the Flower Council of Holland, Switzerland,
Norway, Austria and Germany, in that order, are the countries with highest per
Capita consumption of floriculture products. The details of World consumption, per
Capita consumption of flowers, market size and world trade is furnished in table 16
and 17:
Table 16 Major suppliers of floriculture produce Countries %
Netherlands 60 Colombia 9 Italy 6 Israel 4 Kenya 1 Others 20 Source: NHB database 2001
Table 17 Major consumer of floriculture produce Countries %
Germany 27 Belgium-Luxembourg 3 France 10 Austria 3 Italy 4 Japan 10 Sweden 3 Switzerland 5 Spain 1 UK 8 Denmark 2 Netherlands 8 Norway 1 US 12 Canada 2 Others 1 Source: NHB database 2001
The emergence of new production centres in Asia, Latin America and Africa has
made the floriculture market quite competitive. The countries of these regions
derive their competitiveness from low cost to high level of investment and rapid
innovation. These countries produce highly quality floriculture products at a low
cost price, which is finding a favorable place in the markets of Western America
and Japan.
Major Suppliers of flowers
Colombia9%
Italy6%
Isarel4%
Kenya1%
Others20%
Netherlands60%
Major Consumer of floriculture produce
Germany27%
Others1%
Belgium-Luxembourg
3%
France10%
Austria3%
US12%
Norway1%
Netherland8%
Denmark2%
UK8%
Spain1%
Italy4%
Japan10%
Switzerland5%
Sweden3%
Canada2%

AEZ Kerala 13 Cebeco India Private Limited Your Partner in Agri-business
2.6 Global trade of Floriculture products
The world trade in floriculture and plants is estimated to be more than US $ 40 billion.
Consumption of flowers has increased manifold in the last 2 decades. The global
consumption of floriculture products is estimated to be above USD 50 Billion. The
world trade measured in terms of imports into the main markets is to the tune of USD
7.9 Billion. The rate of increase in world trade has been around 10 percent in recent
years. The share of developing countries in total trade has been around 20 percent
in the last few years. Cut flowers constitute a major portion of the world trade in
floriculture products. In the total global import of floriculture products of 7.9 billion
USD during 1999, flowers accounted for USD 3.76 billion, followed by plants, USD 2.78
billion. The trade figures of major markets during 1999 are provided in Table 18.
Table 18 World trade in floriculture (1999) (FIGURES IN ‘000’ US$)
S.NO. COUNTRY BULBS PLANTS FLOWERS FOLIAGE TOTAL 1 . Germany 69,183 673,730 794,251 141,321 1,678,484 2 . USA 203,280 257,224 734,804 85,759 1,281,103 3 . France 69,852 363,353 414,869 37,208 885,282 4 . U.K. 50,704 264,337 526,637 26,291 867,969 5 . Netherlands 30,989 192,603 366,418 157,028 747,035 6 . Italy 58,840 168,711 146,278 15,539 389,368 7 . Japan 121,523 70,408 153,680 38,219 383,830 8 . Switzerland 29,493 141,008 140,949 32,295 343,745 9 . Belgium 11,156 149,300 108,168 21,775 290,399
10. Austria 11,390 105,673 90,095 17,079 224,237 11. Canada 31,648 95,216 62,808 14,178 203,850 12. Sweden 18,210 93,089 45,657 4,378 161,333 13. Denmark 10,370 72,532 64,414 7,049 154,366 14. Spain 16,940 64,884 38,605 4,815 125,244 15. Finland 6,959 26,553 15,790 3,864 53,165 16. Portugal 4,746 22,859 16,940 1,453 45,121 17. Ireland 778 10,702 28,089 849 40,418 18. Greece 3,677 12,839 21,869 1,294 39,679
Total 7,49,734 27,85,021 37,69,443 6,10,430 79,14,629 Source: www.pathfastpublishing.com
Table 19 Growth rate of International trade in cut foliage from the year 1992 to 1999(in 000’US$)
Country 1998 1999 % growth Austria 18,621 17,079 1 Belgium 12,891 21,775 8.5 Canada 13,761 14,178 1 3 Denmark 6,823 7,049 1 3 Finland 4,379 3,864 -3 France 35,462 37,203 1 5 Germany 155,614 141,321 0 Greece 1,342 1,294 6 Ireland 760 849 2 3 Italy 13,740 15,539 2 4 Japan 34,331 38,219 2 2 Netherlands 163,579 157,028 5 Portugal 1,101 1,453 4 5 Spain 3,915 4815 3 5 Sweden 5,232 4,378 -8 U.K. 29,195 26,291 -1 Switzerland 31,835 32,295 1 1 USA 84,466 85,795 1 1 Total 617,047 610,430 9
Source: www.pathfastpublishing.com

AEZ Kerala 14 Cebeco India Private Limited Your Partner in Agri-business
Cut flower production in Africa, particularly in Kenya, Zimbabwe, Ivory Coast,
Morocco, South Africa and Tanzania is highly competitive. Professional companies
owned by foreign investors, hire experts from Europe for the purpose of operating
flower-growing facilities in these countries. These countries have benefited from
developing infrastructure, knowledge, transport facilities and entry to European
market due to trade agreement. Bulk of flowers produced in these countries is
intended for export to the European market, with increasing efforts to catch on the
Asian market as well. Roses are the major cut flowers grown in these countries
owing to them higher income generation capacity from exports. Growers in South
Africa, especially small growers, have focused production for domestic
consumption.
It is quite evident from the data in Table 20, that Netherlands will face stiff
competition from Latin American, African and Asian countries in the near future.
India, which entered commercial floriculture quite late, also seems to have a bright
future.
The key exporting countries are Holland, Colombia, Italy and Israel. The share of
exporting countries is given in table 20:
Table 20 Major exporters of cut flowers
Country Share in export market (%) *
Holland 59 Colombia 10 Italy 6 Israel 4 Spain 2 Kenya 1 Others 18
Source: www.pathfastpublishing.com It is evident from the figure above that 4 leading exporters – Holland, Colombia,
Italy and Israel – constitute about 80 percent of the market. The share of the
developing countries in Africa, Asia and Latin America including Thailand, Ecuador
and India is less than 20 percent. The international trade in cut flowers is growing by
about 11 percent.

AEZ Kerala 15 Cebeco India Private Limited Your Partner in Agri-business
Table 21 Major importers of cut flowers
Country Imports (%)
Germany 39 U.S.A 17 France 11 U.K. 10 Netherlands 6 Japan 6 Switzerland 5 Others 6
Source: www.pathfastpublishing.com
The consumption in UK, Holland and Germany is growing by 10-15 percent while,
the consumption in Switzerland and France is growing at a faster pace.
Roses are the most preferred flowers in the international market. Carnations and
chrysanthemums are other flowers, which also have a major share in the
international market. The demand for roses has been growing at a higher rate
compared with other flowers, resulting in a logical decision for Indian flower growers
to invest in the production of roses. The table 22 serves as an indicator of the final
destinations in West Europe.
Table 22 Export destinations for Floriculture Products (from the Netherlands including re-export) - Year 1999
S.NO. COUNTRY MILLION NLG
1. Germany 3,236 2. France 1,170 3. United Kingdom 1,044 4. Italy 446 5. Belgium 309 6. Switzerland 261 7. Austria 251 8. Spain 230 9. Denmark 205 10. Sweden 175
Source : www.pathfastpublishing.com
Table 23 Share of different flowers in the European market
Flower Share (%)
Roses 51
Carnations 19
Chrysanthemums 10
Gladioli and orchids 15
Other species 5
Source: www.pathfastpublishing.com

AEZ Kerala 16 Cebeco India Private Limited Your Partner in Agri-business
The top ten cut flowers and pot plants traded at Dutch Auctions, which is an
indicator of the world trade, are given in Table 24.
Table 24 The turnover of top 10 cut flowers at Dutch Auction (VBA, 1999)
SL. No.
CUT FLOWERS MILLION NLG
1. Rose 1672 2 Tulip 569 3 Chrysanthemum 421 4 Gerberas 272 5 Carnation 178 6 Lily 143 7 Freesia 141 8 Alstroemeria 139 9 Iris 103 10 Gypsophila 87
Source: www.bbh.nl
The trade in exotic flowers like Anthurium and Orchids is growing and is dominated
by a few niche players and these flowers command a high price.

AEZ Kerala 17 Cebeco India Private Limited Your Partner in Agri-business
3 OVERVIEW OF INDIA’S PRODUCTION OF HORTICULTURE PRODUCE
India’s diversity in climate and soil provides tremendous scope for growing a wide
variety of horticultural produce. Currently, India is the second largest producer of
fruits and vegetables in the world.
3.1 Fruits
The area under the fruit production 3.8 million lacs ha which has increased 13% from
the year 1995-96 whereas the increase in production is only 9%. So overall
productivity has declined in due course of time by 0.4 MT/HA but in case of Banana
India is enjoying the leadership position in terms of Area, production and
productivity. The production has increased substantially by 28%. In case of
Pineapple although there is increase in area but the production and productivity
has declined, marginally from the peak levels in 95-96.
Table 25 All India Area, Production and Productivity of fruits
Year Area (in 000’HA)
Production (in 000’MT)
Productivity (in MT/HA)
1995-96 3357.0 41507 12.4 1996-97 3580.0 40458 11.3 1997-98 3702.0 43263 11.7 1998-99 3727.0 44042 11.8 1999-00 3796.8 45496 12.0
Source: NHB database 2001 Table 26 All India Area, Production and Productivity of Banana
Year Area (in 000’HA)
% of total fruit area
Production (in 000’MT)
% of total fruit production
Productivity (in MT/HA)
1995-96 433.1 12.9 13095.1 31.5 30.2 1996-97 424.6 11.9 12439.6 30.7 29.3 1997-98 449.1 12.1 13339.5 30.8 29.7 1998-99 464.3 12.5 15072.7 34.2 32.5 1999-00 490.7 12.9 16813.5 37.0 34.3
Source: NHB database 2001 Table 27 All India Area, Production and Productivity of pineapple
Year Area (in 000’HA)
% of total fruit area
Production (in 000’MT)
% of total fruit production
Productivity (in MT/HA)
1995-9 6 71.2 2.1 1071.1 2.6 15.0 1996-9 7 68.7 1.9 924.6 2.3 13.5 1997-9 8 69.3 1.9 937.1 2.2 13.5 1998-9 9 74.2 2.0 1006.4 2.3 13.6 1999-0 0 75.5 1.9 1025.4 2.2 13.6
Source: NHB database 2001

AEZ Kerala 18 Cebeco India Private Limited Your Partner in Agri-business
Maharashtra has the highest productivity and of banana in the country. But
production is highest of Tamil Nadu. Although Kerala has very low productivity due
to absence of modern technologies but since the varieties found in the region are
having high demand in GCC countries where a significant number of Keralites are
staying. So low productivity is giving a opportunity to increase the export by
increasing productivity through introduction of hi technology. It is true in case of
pineapple.
Table 28 State wise area, production and productivity of banana
Area (in 000’HA)
Production (in 000’MT)
Productivity (in MT/HA)
States
1997-98 1998-99 1999-00 1997-98 1998-99 1999-00 1997-98 1998-99 1999-00 Andhra Pradesh
45.3 36.9 48.5 1131.9 922.1 1212.5 25.0 25.0 25.0
Assam 41.4 41.9 41.9 575.2 581.9 583.4 13.9 13.9 13.9 Bihar 27.6 28.3 29.2 551 .7 566.4 583.9 20.0 20.0 20.0 Gujarat 31.2 32.7 34.2 1113.8 1097.3 1109.1 35.7 33.6 32.4 Karnataka 60.9 60.9 61.0 2010.4 2010.4 2015 33.0 33.0 33.0 Kerala 24.7 29.1 27.9 351.5 415.1 393.7 14.2 14.3 14.1 Maharashtra 53.2 59.0 72.2 3130 3455.6 4330.5 58.8 58.6 60.0 Orrisa 23.9 24.7 16.4 257.4 276.8 193.5 10.8 11.2 11.8 Tamil Nadu 82.3 88.1 92.2 3144.4 4405.5 4856.4 38.2 50.0 52.7 West Bangal 16.2 18.7 18.8 210.1 301.2 331.4 13.0 16.1 17.6 Others 42.4 4 4 49.5 863.1 1040.4 1203.1 20.3 23.6 24.3
S ource: NHB database 2000 and 2001 Table 29 State wise area, production and productivity of pineapple
Area (in 000’HA)
Production (in 000’MT)
Productivity (in MT/HA)
States
1997-98 1998-99 1999-00 1997-98 1998-99 1999-00 1997-98 1998-99 1999-00 Arunachal Pradesh
7.2 7.3 7.3 29.4 30.2 32.0 4.1 4.1 4.4
Assam 14.1 13.6 13.8 217.3 209 207.8 15.4 15.4 15.1 Bihar 3.3 3.7 3.9 88.0 92.1 97.0 26.7 24.9 24.9 Kerala 5.0 8.6 9.0 46.7 57.3 73.7 9.3 6.7 8.2 Manipur 9.4 10.0 1 0 66.0 69.8 69.0 7.0 7.0 6.9 Meghalaya 9.3 9.3 9.4 80.4 80.4 82.5 8.6 8.6 8.8 Nagaland 2.3 1.8 2.5 63.7 60.0 71.1 27.7 33.3 28.4 West Bangal 9.2 9.6 10.3 246.8 283.9 280.2 26.8 29.6 27.2 Others 9.5 10.3 9.3 98.8 123.7 112.1 10.4 12.0 12.0
Source: NHB database 20 00 and 2001 As per the NHB, the productivity of Banana is 14 MT/HA but there is a contradiction
in the information given by state Govt. according to which the productivity is 8
MT/HA.
3.2 Vegetables The area under vegetable production is increasing every year substantially. There is
a 10% of increase in area in last seven years and the increase in production is very
encouraging i.e. 21% due to introduction of modern technologies in cultivation.

AEZ Kerala 19 Cebeco India Private Limited Your Partner in Agri-business
Although tapioca does not find a place in the main vegetable basket of the
country but its demand from NRIs in Gulf makes it a regular feature of exports from
India. A positive growth rate is also observed in its area production and
productivity. Kerala has highest area under this vegetable but it is second in
production and productivity, having lost top position to Tamil Nadu in recent years.
Table 30 All India Area, Production and Productivity of vegetables
Year Area (in 000’HA)
Production (in 000’MT)
Productivity (in MT/HA)
1995-96 5335 71594 13.4 1996-97 5515 75074 13.6 1997-98 5607 72683 13.0 1998-99 5866 87536 14.9 1999-00 5993 90831 15.2
Source: NHB database 2001 Table 31 All India Area, Production and Productivity of Tapioca
Year Area (in 000’HA)
Production(in 000’MT)
Productivity (in MT/HA)
1995-96 228.2 5443.2 23.9 1996-97 256.1 5662.8 22.1 1997-98 264.3 6681.9 25.3 1998-99 243.4 5830.0 24.0 1999-00 234.8 6181.1 26.3
Source: NHB database 2001 Table 32 State wise area, production and productivity of tapioca
Area (in 000’HA)
Production (in 000’MT)
Productivity (in MT/HA)
States
1998-99 1999-00 1998-99 1999-00 1998-99 1999-00
Andhra Pradesh 22.0 18.1 132.0 111.5 6.0 6.2 Assam 2.7 2.8 13.4 13.4 5.0 4.8 Karnataka 1.0 0.8 8.5 6.6 8.5 8.3 Kerala 129.9 109.3 2810.9 2563.5 21.6 23.5 Meghalaya 4.0 4.0 21.3 21.5 5.3 5.4 Mizoram 0.5 0.2 2.5 2.0 5.0 10.0 Nagaland 0.8 0.8 15.8 15.8 19.8 19.8 Rajasthan 0.1 0.1 0.4 0.4 4.0 4.0 Sikkim 0.5 0.5 1.2 1.2 2.4 2.4 Tamil Nadu 80.9 97.2 2804.7 3425.5 34.7 35.2 A&N 0.4 0.4 3.5 3.5 8.8 8.8 Pondicherry 0.6 0.6 16.2 16.2 27.0 27.0
Source: NHB database 2001
3.3 India’s Exports
Out of the total world exports of fresh vegetables, India’s share is hardly 2%. The
product-wise list of exports of fresh, chilled/frozen vegetables is given in table 33:

AEZ Kerala 20 Cebeco India Private Limited Your Partner in Agri-business
Table 33 Exports of fresh fruits and vegetables from India (2000 -2001)
Fruits Qty (MT)
Value (Rs.)
Mangoes 37110 6,86,070 Grapes 20647 829,355 Banana 8630 180,030
Pineapple 757 12,859 Apples 2847 41,729 Papaya 11928 161,991
Guava 670 12,784 Dates fresh 1 114 Oranges fresh 2683 273,734 Mandarins 15 264 Lemons 3527 57,487 Grapefruits 220 8,479 Other citrus fruits 79 784 Cherries 5 176 Pomegranates 4456 99,156 Tamarind fresh 2289 34,118 Sitafal 181 2,466 Sapota 911 16,185 Pear & quince 4 64 Custard apple 640 11,767 Figs 0.5 9 Mangosteens 989 22,012 Strawberries 40 3,917 Bore 154 1,633 lichi 167 15,184 Other fresh fruits 15619 191,314 Total of fresh fruits 119000 138,153,390
Source: APEDA Export Statistics It is quite evident that out of this list, barring onion and potato no other vegetables
having significant export volumes.
Table 34 Destination of India’s exports of Fresh Vegetables
1996 1997 1998 1999 Qty (Mt)
Val (1000$)
Qty (Mt)
Val (1000$)
Qty (Mt)
Val (1000$)
Qty (Mt)
Val (1000$)
16,862 4,315 48,799 14,395 39,010 15,297 39,010 15,297
Kuwait, Nepal, Bahrain Sri Lanka, Spain, UAE
UAE, Saudi Arabia, Germany
UAE, Maldives, Saudi Arabia
Source: APEDA Exports statistic
Further, India’s fresh vegetable exports are not consistent to any particular country,
indicating that no concerted effort has been made to develop the market and
exports have been on short term basis.
Vegetables Qty (MT.) Value (Rs.)
Fresh onion 343254 2,762,191 Potaotes fresh 22637 116,009 Tomatoes 1134 10,520
Kohrbi 26 618 Other lettuce 56 1,527 Radishes 0.07 0.3 Salad Beet Root 1 18 Other legumes 24 634 Shallots 10 125 Garlic 4443 51,636 Globe artichokes fresh 12 325 Asparagus 0.2 24 Mushrooms fresh 7597 391,952 Spinach 2 21 Olive fresh 55 659 Pumpkins 273 9,200 Other vegetables fresh/chilled 28934 352,942 Cabbage lettuce 65 3,565 Cauliflowers 2 33 Cucumber & gerkin 7445 123,370 Peas 723 15,157 Beans 47 3,745 Egg Plants 8 73 Green chilly 3212 59,482 Other chilly 367 8,206 Plantain(curry Banana) 22 855 Mixed vegetables 26193 354,443 Total vegetable 477245700 4,670,685

AEZ Kerala 21 Cebeco India Private Limited Your Partner in Agri-business
3.4 Flowers
India is endowed with varied agro climatic conditions suitable for growing a
number of flowers. India is known for growing the traditional flowers such as
jasmine, marigold, chrysanthemum, tuberose, etc. though growing of cut flowers is
of recent origin. Tamil Nadu, Karnataka, Maharashtra, West Bengal, Jammu and
Kashmir, Sikkim and Andhra Pradesh are major flower growing states. The total area
under flower crops is 89 thousand hectare, with a total production of 509 thousand
MT of loose flowers and 681 million cut flowers. The volume of trade in the domestic
market was around Rs. 200 crores in the beginning of the nineties, which has now
grown in more than Rs. 500 crores. The trade figures have increased manifold due
to significant increase in floriculture production during this period.
Table 35 All India Area, Production and Productivity of flowers
Year Area (in 000’HA)
Production (in 000’MT)
Loose
Production (in lacs no’s)
Cut 1995-96 82 334 5370 1996-97 71 367 6152 1997-98 74 366 6222 1998-99 74 419 6428 1999-00 89 509 6806
Source: NHB database 2001 Most important cut flower under protected cultivation is rose and large headed
Hybrid-T roses are cultivated in plastic houses. Initially imported technology was
used for cultivation, but farmers have now modified techniques more suitable to
Indian conditions.
Table 36 Export of floriculture products from India (1999-2000)
West Europe Volume (MT)
Value (000’ Rs.)
Germany 410 45376 UK 460 30702 France 96 8480 Belgium 116 9014 Italy 169 16590 Netherlands 381 30073 Switzerland 14 1145 Spain 134 14084 Sweden 11 1545 Denmark 120 17122 Total 1911 174131 SEA & Pacific Australia 26 1999

AEZ Kerala 22 Cebeco India Private Limited Your Partner in Agri-business
West Europe Volume (MT)
Value (000’ Rs.)
Japan 66 6412 Sri Lanka 135 4763 Singapore 0.02 2 Hong Kong 20 716 Total 246 138906 USA 1995 8591 Gulf UAE 27 21700 Grand Total 4179 323798
Source: APEDA Exports statistic
Table 37 Export of cut foliage from India (Value in 000’ Rs)
Country 1999-2000 2000-2001 Italy - 1269 Kenya 250 - Srilanka - 305 Netherlands - 757 Singapore 2 - U.A.E. 142 - USA - 579 Total - 2911
Source: APEDA Exports statistic
The exports of floriculture products from India are mainly directed to Europe, Gulf
and Middle East. Exports are suppose to increase in coming years in all the
horticulture produce through India due to the air freight subsidy provided by
APEDA, which was the main constraint earlier in the exports of horticulture produce.

AEZ Kerala 23 Cebeco India Private Limited Your Partner in Agri-business
4 AGRICULTURE IN KERALA
Kerala state is situated in the Southwest corner of Indian Peninsula between 8” 18’
and 12” 84’ North latitude and 74” 52’ and 77” 22’ East longitude. The state is
bounded by Western Ghats in the east; the Arabian Sea in the west, Tamil Nadu in
the South and Karnataka in the North. Total land area is 38,864 sq. m. with length of
coastal line 590 km (North to South direction) and width 30-130 km between the
Western Ghats and the Arabian Sea (East -West direction). Kerala is a land with
highly diversified physical features and agro-ecological conditions. The undulating
topography of the land ranges from below the sea level to 2,494 mtrs above the
seal level. The state can be divided into four zones based on the physiographical feature.
Table 38 Classification based on the physiographical features of the state
Regions Specialties Crops grown
High ranges Mountains land with elevation ranging from 750-2500 as above MSL along with high ranges. Most area is reserve forest. (1.94 lac ha)
Tea, Coffee, Rubber Cardamom
High land Elevation ranging from 75-1500 m above MSL, (16.71 lac ha), located of the foot with of Western Ghats. Contains high content of organic matter.
Tea, Coffee Rubber Pepper, Cardamom
Mid land Ranges from 7.5-75.0 m above MSL covering 16.23 lac ha. Undulating terrain with rivers, small hills and valleys. Annual and perennial crops.
Rice, Coconut, Tapioca, Banana, Sugarcane, Pepper, Ginger, Arecanut, Cashew and Rubber
Low land Strips of land running along the coast bordering the Arabian Sea with a coat line of 590km with an elevation less then 7.5m above sea level. Characterized by backwaters. Land is subjected to salinity intrusion.
Rice, Coconut
Source: Department of Agriculture, GOK
4.1 Agro-soil Zones of Kerala
In the state of Kerala, super imposing six moisture availability regimes over seven soil
groups identifies twenty agro-soil zones.

AEZ Kerala 24 Cebeco India Private Limited Your Partner in Agri-business
Table 39 Agro-soil Zones of Kerala
S. No.
Zones Location Crops grown
1 Dry Forest Loam In and around Chinnar Plantation crops other than spices, coconut and tapioca
2 Semi Dry Red Loam
Isolated pockets in Thiruvanthapuram and Neyyattinkara Taluks
Coconut, tapioca, paddy and fruits plants like cashew & mango
3 Semi Dry Laterite Parts of Quilon, Chirayinkil, Thiruvanthapuram, Neyyattinkara & Nedumangad taluk
Paddy, coconut and fruit crops like mango and cashew
4 Semi Dry-Alluvium River beds and coastal areas of Quilon, Chirayinkil, Thiruvanthapuram Neyyattinkara, Ottappalam Talappillly, Palakkad and Alathur Taluks
Paddy, coconut, tapioca, mango and cashew
5 Semi Dry-Black soil Eastern most parts of Chittur and Palakkad taluks
Paddy cotton and Coconut
6 Semi Dry-Forest Loam
Kumily and parts of Peerumedu taluk Tapioca, tea, coffee and rubber
7 Sub humid -Red Loam
Kasaragod and Kannur. Parts of Kasaragod, Hosdurg and Taliparamba taluks
Coconut, cashew, paddy, rubber, pepper and arecanut
8 Sub humid – Laterite
Parts of Kannur, Tirur, Choughat, Parur, Kasaragod, Hosdurg, Taliparamba, Tellichery, badagara, Talappily, Trichur, Mukundapuram, Alwaye, Kanayannur, Alathur, Chittur, Ernad, Mannarghat, Palghat, Kunnathur, Kottarakkara, Pathanapuram, Neyyattinkara and Nedumangad taluks
Paddy, coconut, rubber, cashew, pepper, arecanut, tapioca and mango
9 Sub humid – Alluvium
Coastal areas and river beds in the regions under item 8
Paddy, coconut, Mango, cashew, rubber, Pepper, arecnut and Tapioca
10 Sub humid – Saline
Pokkali lands in the coastal parts of Parur, Kanayannur and Cochin taluks
Paddy and Coconut
11 Sub humid Forest loam
Parts of Ernad, Mannarghat, Devikulam and Pathanapuram Taluks
Pepper, tea, cardamom, tapioca and paddy
12 Humid laterite Parts of Kasaragod, Taliparamba, Tellicherry, Qualiandy, Kozhikode, Badagara, Kunnathun ad, Meenachil, Kanjirappaly, Pathanamthitta, Chengannur, Mavelikkara and Nedumanagad taluk
Vegetables, nutmeg, cashew, folder grass and pineapple
13 Humid – Alluvium River beds of taluk areas described under item 12, western part of Chengannur and Mavelikkara taluks, coastal areas of Shertali, Ambalapuzha and Karunagapaly
Paddy, coconut, cocoa, tapioca, arecanut, mango and banana
14 Humid – Greyish Onattukara
Onattukara – parts of Mavelikkara, Karunagappally and Karthikappally taluk
Paddy, coconut, Seasamum and tapioca
15 Humid Saline Around Vembanad lake (areas with acid saline soils)
Paddy and coconut

AEZ Kerala 25 Cebeco India Private Limited Your Partner in Agri-business
S. No.
Zones Location Crops grown
16 Humid Forest Loam Parts of Ernad, south Wynad and North Wynad, Kasaragod, Hosdurg, Taliparamba taluks; Tellicherry, Pathanamthitta, Pathanapuram, Neyyattinkara, Devikulam and Peerumedu taluks
Coffee, tea, pepper, cardamom, rubber, ginger, paddy, mango and jack
17 Per Humid Laterite Parts of S. Wynad, Quilandy, Ernad, Kunnathunad, Devikulam, Todupuzha, Kothamangalam, Meenachil and Kanjirappally taluks
Paddy, coconut, tapioca, rubber, pepper, Arecanut, cocoa, mango, jack, cashew, ginger and banana
18 Per Humid Forest Loan
A small pocket in and around Vythiri, parts of Devikulam, Thodupuzha and Peerumedu taluk
Paddy, coconut, coffee, Tapioca, pepper, tea, cocoa and cardamom
19 Wet Laterite Parts of South Wynad, Ernad, Mukundapuram, Devikulam, Meerumedu, Pathanamthitta Taluk
Cardamom, Tea, Coffee, Rubber, Pepper, Tapioca, Ginger and Paddy
20 Wet Forest Loam Parts of Neriamangalam, Devikulam, Thodupuzha, Kanjirappally, Meenachil and Peerumedu Taluk
Source: Department of Agriculture, GOK
4.2 Land use Pattern
The table 40 indicates the details of land use pattern in 1995-96 and 2000-01.
Table 40 Land use pattern in Kerala (Area in ha)
1995-96 2000-01 S. No
Classification of Land Actual % Actual %
1 Geographical Area 3885497 - 3885497 - 2 Forest 1081509 27.83 1081509 21.83 3 Land put to non -agricultural uses 313131 8.06 381873 9.8 4 Barren and uncultivated land 43154 1.11 29318 0.8 5 Permanent pastures & Grazing land 1170 0.03 164 - 6 Land under miscellaneous tree crops not
included in net area sown 26852 0.69 15409 0.4
7 Cultivable waste 74382 1.91 59277 1.5 8 Fallow other than Current fallow 29143 0.75 33988 0.87 9 Current fallow 51314 1.32 77853 2.0
10 Net area sown 2268420 58.29 2206126 56.8 11 Area sown more than once 802383 20.65 815556 21.0 12 Total cropped area 3067225 78.94 3021692 77.8 13 Cropping intensities 135.43 - 137 - 14 Area under horticultural crops 466000 15.00 524000 17.30
Source: Department of Agriculture, GOK
It can be seen from the table 40 that area under current fallow has increased
during last 5 years, which needs to be investigated, as availability of cultivable land
is already limited. The net sown area has also marginally declined. The cropping
intensity is 137.0, which has marginally improved during last 5 years. However,
keeping in view prolonged monsoon this needs to be increased. The area under
horticultural crops was only 4.66 lac hectares, in the year 1995-96, which has

AEZ Kerala 26 Cebeco India Private Limited Your Partner in Agri-business
improved to 5.24 lac hectares % in 2000-01, which shows gradual shift towards
horticultural crops.
Another important feature of agriculture in Kerala is extremely small land holdings.
More than 92% of farmers fall into the category of marginal farmers having a land
holding of 0.18 hectares. The details can be seen from the 41:
Table 41 Distribution of operational land holdings in Kerala
No. of Holding Area Operated S. No.
Particulars
(in ‘000 ha) % (in ‘000 ha) %
Average Operation Holding
1. Marginal Farmers 5016 92.5 879 48.8 0.18 2. Small Farmers 281 5.2 381 21.1 1.36 3. Medium Farmers 119 2.2 367 20.4 3.08 4. Large Farmers 3 0.1 174 9.6 58.0 Total 5419 100 1802 100 0.33
Source: Centre for monitoring Indian Agriculture
The important features of agriculture in Kerala are:
§ The shift in area from subsistence seasonal or annual food crops has been
continuing. Food crops are becoming increasingly difficult to sustain.
§ The productivity of crops still remains lower as compared to other states.
§ Regional imbalances in agricultural growth.
§ Movement of cultivators and agricultural labour away from the farm front. Acute
shortage of labour for field operations during peak seasons in the midst of
unemployment.
§ Wage rates very high (Rs. 140 – 160 per day).
§ High proportion of part-time farmers
§ Drift towards less labour absorbing systems of land use.
§ Trends towards mixed cropping pattern, which helps in reducing risks due to fall-
in prices of a particular commodity.
§ NRI/owners of small plots lease out land for cultivation.
§ No Agri Produce Marketing Act in Kerala and no regulated markets.
§ Existence of Kerala land use act, which prohibits shift of land under paddy
cultivation to any other crop.
4.3 Role of State Government in Development of Horticulture
The stagnant production of fruits and vegetables in 1990s and state’s increasing
dependence on supplies of fruits and vegetables from the neighbouring state;
seized the attention of Government of Kerala and a number of projects related to

AEZ Kerala 27 Cebeco India Private Limited Your Partner in Agri-business
production enhancement of fruits and vegetables and creation of Agri-
Infrastructure were initiated. The important on going projects in the state are
detailed in the following paragraphs
4.4 Kerala Horticulture Development Programme (KHDP)
Kerala Horticulture Development Programme (KHDP) is a joint venture of the
European Union and the Government of Kerala. The programme, which has an
outlay of Rs. 131.45 crores, envisages the overall development of the cultivation and
production of vegetables and fruits in the state of Kerala and also an increase in the
level of income earned by the small-scale horticultural farmers of the state. It also
aims at building up of development models in the horticultural sector for the benefit
of developed and developing countries.
4.4.1 Features
§ Establishment of a unique system of organizing the farmers into self-help groups
for attaining self-sufficiency.
§ Empowerment of Self Help Group (SHG) for taking up and maintaining activities
for commercial production based on advanced technology.
§ Activities pertaining to the vegetables and fruit sector, stressing at all stages
thereof, right from the development of technology to value addition and trading
of the products.
§ Technology development with farmers’ active participation.
§ Better income to farmers through planning of production, marketing and credit.
§ Equipping farmers as leaders & thereby making the knowledge dissemination
process effective.
§ Imparting training to master Farmers to equip them as trainers.
§ Unique concept of transfer of technology through Master Farmers as trainers.
4.4.2 Activities Establishment of self -help groups (SHGs) of farmers as focal points of implementing
the promotional schemes. Technical packages on scientific basis for improving
productivity are being delivered to these groups through a team of trained
extension staff and Master farmers, specially trained for the purpose. The major
activities are:

AEZ Kerala 28 Cebeco India Private Limited Your Partner in Agri-business
§ Imparting training to extension personnel and Master Farmer, in all aspect of
vegetable and fruit production, credit, marketing and farmer training.
§ Providing quality seeds and planting materials to farmers. A modern seed
processing plant had been established at Alathur as part of the Programme with
the objective of providing quality seeds to vegetables to the farmers.
§ Undertaking contractual R&D Programmes with the assistance of Kerala
Agricultural University.
§ Participatory Technology Development (PTD) with active involvement of farmers.
§ A unique need based Credit System with the participation of selected
commercial banks, wherein beneficiary farmers in SHGs are given access to
credit from branches of these banks. The credit package is farmer friendly with
innovative features.
§ Setting up of Krishaka Vipanis (Farmer Markets) at major production center,
which are managed by the farmers under the support from Programme Staff.
§ Market Intelligence network for compiling / publishing data on the latest market
information of fruits and vegetables, in order to improve the bargaining ability of
farmers.
4.4.3 Project outlay and financing pattern
The total outlay of the project is 36.76 million Euro, which is equivalent to about
Rs.131.45 crores. This is financed as follow:
Table 42Financing Pattern
Donors Percentage Rs. (In crore) European Union 78.0% 102.53 Government of Kerala 21.5% 28.26 Others 0.5% 0.66 Total 100% 131.45
Source: KHDP progress Report
4.4.4 Self Help Groups
The activities of the Programme are being implemented through self-help groups,
each consisting of 15 to 20 vegetable and fruit farmers in the neighborhood. This
new method of organizing farmers aims empowering them to attain self-sufficiency
in production and marketing of vegetable & fruits. As on 31st Dec, 2001, there were
1,886 SHGs formed with the participation of a total of 40,958 farmers in
Thiruvanthapuram, Kottayam, Ernakulam, Thrissur, Palakkad, Malappuram,
Kozhikode.

AEZ Kerala 29 Cebeco India Private Limited Your Partner in Agri-business
4.4.5 Seed processing
The seed processing Plant set up at Alathur near Paighat is an important component
of the Programme. This plant with a capacity of processing 1.5 MT of seeds/hour is
capable of processing paddy, oil seeds and pulses, besides vegetable seeds. The
Programme also provides expert training to farmers in seed production, processing
and quality inspection. This seed processing factory can provide seeds of high
quality to the farmers as per requirements and hence obviate several major
problems faced by them including scarcity of seeds and difficulty for procurement
and processing during bad weather conditions. A Seed Growers Association has
been formed, which is registered.105 MT of seeds were processed in the Seed
Processing Plant.
4.4.6 Technology development through farmer participation
The concept that farmer’s participation is inevitable for minimizing the drawbacks of
the modem technology and making the same applicable in the field. Scientists and
technical personnel facilitate participatory approach and this in turn helps in
refinement of technologies. KHDP has already started Participatory Technology
Development (PTD) activities with objectives viz.
§ Development of superior technology, which could be made operational
§ Empowerment of farmers for development and use of appropriate technology.
The PTD farmers are involved in the problem analysis process at all stages and are
more likely to adopt the recommendations. The approach is to utilize to the
maximum the traditionally acquired knowledge along with modem technology. The
farmers experimenting in their own fields, enabling reduction in the cost of
production, adoption of improved methods of plant protection, availability of higher
yield of crops with superior quality and also ensuring quality of the end products.
4.4.7 Credit facilities
On the basis of the Memorandum of Understanding executed by KHDP with State
Bank of India, State Bank of Travancore, Union Bank of India, Canara Bank and
South Malabar Gramin Bank, credit facilities are being extended by these banks to
the vegetable and fruit farmers organized on SHG basis. Lease land cultivators can
also access credit through this package.

AEZ Kerala 30 Cebeco India Private Limited Your Partner in Agri-business
4.4.8 Training
KHDP implemented training programmes for Master Farmers who were in turn to
train their fellow farmers in modem techniques including production, value addition
and marketing. The farmers are given comprehensive training covering all the
aspects of vegetable & fruit cultivation. In all the project areas, well -equipped
training centres are functioning. Project staff members are also trained regularly to
enhance their capabilities. The multidisciplinary knowledge base of the personnel is
updated in a timely & sequential manner. As on 31st Dec the project organized 258
batches project staff training programs.
4.4.9 Marketing arrangement for vegetables and fruits The activities being implemented under this scheme are:
§ Providing the latest information pertaining to the market and the price levels, to
the producer.
§ Organizing wholesale markets of several fruits & vegetables, with infrastructural
facilities for procurement grading and trading of products.
§ Imparting expert training to farmers in marketing their produce.
4.4.10 Market information centre The Market Information Centre (MIC) of KHDP centered at Ernakulam, collects data
of prices from 12 main markets, 6 urban retail markets of Kerala and 5 outside state
markets for vegetables and fruits. It compiles and a nalyses the same for publication
in the mass media for the use of the farmers and consumer. Short-term forecasts
regarding prices of vegetable and fruits also are provided to the farmers. Market
trend is also provided on a weekly basis to farmers’ market.
4.4.11 Farmers field centres
As on 31st December 2001, 79 Farmers Field Centres & 18 Bulking Centres have been
established, to equip farmers themselves to handle the marketing activities directly
like assessing the arrival of produce finding suitable traders, fixing reasonable price,
maintaining accounts, regular auditing & employ adequate staff etc. Training has
been provided to about 51892 farmers in produce, handling, grading & marketing
techniques.

AEZ Kerala 31 Cebeco India Private Limited Your Partner in Agri-business
4.4.12 Fruit processing A Fruit Processing Factory has been set up at Avoly, near Muvattupuzha, for
processing fruits like pineapple, mango etc. with the capacity to process 3.5 t of
pineapple/hour and provides concentrated juice up to 290 Kg/hour. Mango also
can be processed similarly. The major product is RTS (Ready to Serve) directly based
on Pineapple, Mango and mixes for retail in 250ml Tetra Pack cartons. Fruit Candies
from pineapple, papaya, mango, ginger & banana also can be made here. This
factory has spun off as a public limited company named Nadukkara Agro-
processing Company Limited in which farmers will have major (70%) equity share
holding. The Government of Kerala will hold the balance 30% shares.
4.5 Kerala State Horticulture products Development Corporation Ltd. (HORTICORP)
4.5.1 A brief History Kerala State Horticultural Products Development Corporation Limited (HORTICROP) is
a fully owned Government Company incorporated in the year 1989. The main
objective of the formation of the company was to achieve multifaceted
developments in the field of Procurement Processing and Marketing of vegetables
and fruits in the State of Kerala. In the formative years the Corporation activities
were of restricted nature such as Participation in Fairs and Exhibitions,
Implementation of Schemes of Government of Kerala and Government of India and
limited distribution of vegetables, fruits, planting materials etc. The Government in the year 1996-97 so as to make it more useful to the public and
the farmers alike revived the Corporation after years of low key functioning. Thus a
revival package “Cold Chain Scheme” was proposed by the Corporation to
streamline the operations of the Company in a more scientific and productive way
so as to deliver maximum benefit to the customers and ensure fair prices to the
producers.
The main objects of HORTICORP as envisaged in Cold Chain Scheme are:
§ The operation of a chain of retail outlets throughout the State, through scientific
procurement, storage and distribution of quality vegetables and fruits to the
consumer at reasonable rates.

AEZ Kerala 32 Cebeco India Private Limited Your Partner in Agri-business
§ Procurement of quality vegetables and fruits from the farmers. Haritha Sangams
and ‘Swasrcya Karshaka Vipani’ of the VFPCK at reasonable rates thus
eliminating the exploitation by middlemen.
§ Maintaining the open market prices of vegetables at reasonable levels by
effectively intervening in the markets and eliminates shortage in the supply of
vegetables in the State.
§ Attract more and more farmers to the field of Horticulture by providing them with
adequate marketing support and collection centres and thereby reducing the
dependency for vegetables on other states.
4.5.2 Functional Areas § Procurement of vegetables and fruits
HORTICORP through its chain of 7 Regional offices procures vegetables and fruits
from both within the State and from the neighbouring States at reasonable rates
on a daily basis from the farmers, farmers’ societies and directly from the major
wholesale markets. The vegetables brought to the Regional centres are graded
and distributed through the retail outlets.
§ Marketing of vegetables and fruits through retail outlets of HORTICORP.
HORTICORP has established a chain of more than 450 retail outlets throughout
the State for the marketing of the vegetables and fruits. The outlets are located
in the vicinity of the areas with high density of population and thus ensure
accessibility to the public. Also, as the prices are maintained at uniform rates in
each district it ensures fair prices to the consumers.
§ Scientific storage facility
HORTICORP has commissioned two State-of-the-art cold storages at Munnar,
Idukki district and Eruthiampathy, Palakkad District. These storages are aimed at
providing storage facilitates to the farmers for storing their vegetable without
damage during surplus production months and getting a fair price in times of
shortages.

AEZ Kerala 33 Cebeco India Private Limited Your Partner in Agri-business
§ Distribution of seeds and planting materials
HORTICORP distributes good quality seeds and planting materials through the
Krishibhavans and some retail outlets, to the farmers.
§ Participation in state and National Agricultural exhibitions and organising fairs
during festival seasons.
§ Implementation of Central Sector Scheme on “Beekeeping for improving crop
productivity” in the State of Kerala
4.5.3 Achievements
§ General Achievements
- Making available to the Customers commodities at low rates compared
those in the open market prices.
- Ensure availability of all varieties of quality vegetables throughout the year.
- Provide employment opportunities both direct and indirect to the public.
- Provide scientific procurement and storage facility for agricultural produces.
- Save farmers fr om exploitation of middlemen.
- Providing a secure marketing infrastructure for produces of farmers.
4.5.4 Products
§ Vegetables
§ Fruits
§ Coconut
§ Essential Commodities
§ Honey and Honey based products like HONEY COLA
§ Planting Materials and Seeds
4.5.5 Future activities proposed
§ Increase the number of retail outlets thus generate employment opportunities.
§ Establish cool rooms in all Regional Production Centres to minimize losses.
§ Maintain quality of vegetables through introduction of Refrigerated trucks.
§ Organise seminars and meeting of agriculturists in order to make them aware of
the modem hi-tech practices in agriculture like Poly house, Drip Irrigation, Group
Farming etc.

AEZ Kerala 34 Cebeco India Private Limited Your Partner in Agri-business
§ Diversification of activities
- Introducing value added products like pickles, jams, frozen foods and
vegetables, processed foods etc. in the market.
- Export of vegetables, fruits and processed food products.
- Introduce Commercial Floriculture in the State through production and
marketing of varieties of commercially valuable flowers.
- Intensify distribution of quality vegetable seeds and planting materials to
farmers.
4.5.6 Assistance from government HORTICORP is a unique organisation as it is engaged in the retail marketing of highly
perishable, commodities. It has been effectively controlling the open market prices
even with minimal assistance from the Government. HORTICORP faces stiff
competition from the private wholesalers who dump vegetables from the outside
markets. Our market intervention efforts have helped in maintaining the open
market prices at reasonable levels and within control.
4.6 State Agriculture Department The DOA has made direct interventions too in order to increase the production of
vegetables in the state.
Since 1997-98 the DOA implemented Intensive Vegetable Development
Programme (IVDP) in the state, under which ‘Haritha Sangamas’ are being
organised. In the 152 blocks of Kerala, one procurement-cum-sales outlet (block
outlet) in each block is proposed to be organized. An amount of Rs. 20,000 is
proposed to be provided for each such block outlets for putting up stall and
purchase of platform balance, plastic crates etc. Under the project there is
provision for subsidies for the spray pump, vegetable seed kits, pushcarts for
transporting vegetables and digging-up of well.
Under IVDP, schemes were also introduced for development of vegetable gardens
in the educational institutes.
4.7 Kerala Agro Industries Corporation Ltd.
The broad functions of KAIC include mechanization of agriculture in the state and
development of Agri based industry in the state. KAIC has network of branches in

AEZ Kerala 35 Cebeco India Private Limited Your Partner in Agri-business
the state for sale of tractors and other agricultural implements. It also undertakes
role on the basis of hire and machinery purchase or installments basis.
KAIC had put-up a fruits processing unit with an annual capacity of 300 MT at
Punalur. Pineapple and mango were being processed and sold under the brand
name of ‘Kisan Jyoti’. The unit is not operational at present.
4.8 Other Agencies
Some other organisations of Kerala having agricultural land also participated in the
Intensive Vegetable Development Programme. These organisations were State
Farming Corporation, Plantation Corporation, Kerala Agriculture University and Oil
Palm, all of them collectively brought some 200 hectares of land under vegetable
cultivation in the year 1998-99.
4.9 Kerala Agricultural Markets Project (KAMP) KAMP is a European Union (EU) assisted project implemented for the development
of agricultural markets in the State. Under the project 6 Agricultural Wholesale
Markets (AWM) are constructed. Since the three larger markets of the six are
situated in the urban agglomerations of Thiruvanthapuram, Cochin and Kozhicode,
the construction works of the markets were entrusted to the Urban Development
Authorities concerned.
§ Anayara (tvm.) and Nedumangad : TRIDA
§ Maradu (Cochin) and Muvattupuzha : GCDA
§ Vengari (CLT) and S. Bathery : CDA
Original closing date of the project was 31st Mar, 97. This was extended till 31st
Dec’98 for enabling the Sate Govt. to fully utilize the EU share of Rs 3238 lacs. Total
project cost is Rs. 7151 lacs.
4.9.1 Physical progress
Facilities provided in the markets in general are:
§ Separate trading units with modules of 8m x 4m size and loading and unloading
platform on one side and trading space on the other side
§ Ancillary buildings for market administration, Dormitory, Canteen etc.
§ Wide internal roads and parking facilities.

AEZ Kerala 36 Cebeco India Private Limited Your Partner in Agri-business
4.9.2 Operational progress According to the Government Order, an executive committee will be constituted
with the District Collector as Chairman and an officer in the cadre of Joint Director
of Agriculture in the case of urban markets. Whereas Deputy Director of Agriculture
in the case of rural markets as Market Secretary (MS) to look after the affairs of the
market. An Assistant Secretary (AS) in the cadre of Assistant Director of Agriculture
will also be provided for each market. The posts of AS have been filled in all the
markets and the post of MS has been filled in the case of Maradu and
Muvattupuzha markets. Table 43 New Markets
West Europe Volume (MT)
Value (000’ Rs.)
West Europe
Anayara 15/12/2000 19/03/2001 AS Application for 23 shops received Nedumangad 05/05/2001 AS Maradu 12/11/1999 25/07/20 AS
18/12/2000 MS EC constituted. Application for 15 stalls received
Muvattupuzha 07/06/1999 14/07/1999 AS 27/03/2000 MS
65 stalls rented out. Muvattupuzha General Marketing Society has started business. The District Collector is examining the possibilities of shifting a portion of existing trade to the market.
Vengeri 05/05/2000 19/04/2000 AS There are 92 stalls in the market. Fifty -one stalls have been leased out on an interest free deposit ranging from Rs. 1,71,000 to Rs.2,60,000 and a monthly rent ranging from Rs.1,500 to Rs.3,500. Thirty-eight stalls have b een allotted to the Kerala State Warehousing Corporation for storing copra procured for NAFED
Source: Department of Agriculture, Govt. of Kerala
4.10 Other infrastructural facilities The state has good infrastructural facilities like roads, power, water etc. The state has
three airports at Thiruvanthapuram, Kochi and Kozhikode. The first two named have
facilities of cold room for handling perishable horticultural produce. The state also
has a well-developed port at Kochi. KINFRA has developed Food Parks, Export
Promotion Zones and Industrial Parks for setting-up of industry.
4.11 Credit availability in the state
The following financial institutions are active in Kerala:
§ Commercial Banks
§ Regional Rural Banks

AEZ Kerala 37 Cebeco India Private Limited Your Partner in Agri-business
§ District Cooperative Banks
§ Service Cooperative Banks (PACs)
§ Kerala State Cooperative Agriculture and Rural Development Bank
§ Rural Development Banks
§ Kerala State Cooperative Banks
§ Urban Cooperative Banks
All these financial institutions have good network of branches all over the state and
there is adequate availability of credit. NABARD is also providing refinance for
Farming/Agro Processing/Agri Infrastructure projects at a concessional rate.
The banks provided agricultural credit of about Rs. 1,534 crores in the year 1997-98.

AEZ Kerala 38 Cebeco India Private Limited Your Partner in Agri-business
5 KERALA’S PRODUCTION AND EXPORT S OF HORTICULTURAL CROPS
The warm humid tropical climate, with annual rainfall of above 3000mm distributed
over long duration and the topography ranging from 0 to 2000 mtrs. above sea level
makes Kerala conducive for the growth of a variety of tropical horticultural crops
throughout the year with supplementary irrigation. The production of fruits,
vegetables and flowers has been discussed separately in three sub-section of this
chapter.
5.1 Production of fruits
The total area under fruit cultivation in the state of Kerala in the year 2000-01 was 3.2
lacs ha. There has been gradual increase in the area during last decade as in the
year 1992-93; the area was only 2.4 lacs ha. The district-wise area under various fruits
is given in the 44.
Table 44 Area under fresh fruit production (2000-01) (Area in hectares)
S. No. Districts Jack
Mango
Banana
Other
plantain Pineapple
Papaya
Other fresh
fruits Total
1 Thiruvanthapuram 6402 6778 2149 5615 294 839 516 22593
2 Kollam 6877 5972 1743 4293 573 983 332 20773
3 Pathanamthitta 2967 1601 1975 2131 234 550 710 10168 4 Alappuzha 2994 5849 595 2777 107 932 891 14145
5 Kottayam 4885 3179 2885 4193 516 990 743 17391
6 Idukki 5703 2706 1306 3922 1322 594 733 16286
7 Eranakulam 4431 4886 4737 4364 5762 1294 1076 26550
8 Thrissur 5447 7090 2810 5720 334 1288 1708 24397
9 Palakkad 4998 8040 5931 4770 142 1102 1070 26053
1 0 Malappuram 9106 11605 7136 4098 400 1801 1176 35322
1 1 Mozhikode 11228 11313 1839 3375 413 1569 100 5 30742
1 2 Wayanad 11320 5409 8935 2152 6 3 368 817 29064
1 3 Kannnur 14699 13598 2035 4387 440 1230 1107 37496
1 4 Kasaragod 2641 2545 983 2556 9 2 526 687 10030
Total 93698 90571 45059 54353 10692 14066 12571 321010
Source: Department of Economics and S tatistics, GOK
The major fruit in Kerala are banana & plantain, which are used as vegetable, fruit
as well as for processing into chips. Other important fruits grown in the state are
mango, pineapple, papaya and Jackfruit.
The production of major fruits in the state for the year 2000-01 is given in the table 45:

AEZ Kerala 39 Cebeco India Private Limited Your Partner in Agri-business
Table 45 Quantity of fresh fruit production (2000-01) (in MTs)
S. No. Districts Jack
(Nos. in million nuts) Mango
Banana
Other
plantain Pineapple
Papaya
Total
1 Thiruvanthapuram 2 5 21630 13668 40817 1886 5525 83526 2 Kollam 2 4 22034 10253 31683 4932 914 69816 3 Pathanamthitta 1 3 10884 13354 19439 1282 3038 47997 4 Alappuzha 7 17130 4134 21992 495 4636 48387 5 Kottayam 1 8 12771 25340 42079 3151 7131 90472 6 Idukki 2 0 11396 12372 41265 13889 1479 80401 7 Eranakulam 1 6 12621 31880 35790 47998 6265 134554 8 Thrissur 1 9 17574 20138 26849 2014 5633 72208 9 Palakkad 1 8 29802 40376 33035 745 7306 111264
1 0 Malappuram 3 1 29962 48464 24447 2558 7779 113210 1 1 Kozhikode 2 5 12846 15500 23140 2451 1020 54957 1 2 Wayanad 3 3 9235 67547 19078 236 2457 98553 1 3 Kannnur 5 0 40174 16436 24756 2098 6588 90052 1 4 Kasaragod 1 4 11576 8493 19325 864 3237 43495
Total 313 259635 327955 403695 84599 63008 1138892 Source: Department of Economics and Statistics, GOK
5.2 Vegetables production in Kerala
A wide variety of vegetables are grown in Kerala. The important vegetables are
tapioca, minor tubers (Amorphophallus, Colocasia, Diascorea and Colus),
drumsticks, bitter gourd, snake gourd, okra, cucumber, pumpkin, ash gourd, green
chillies, brinjal etc. Winter season vegetables like cabbage, carrot, cauliflower etc
are grown in high altitude regions of the state namely Wayanad, Idukki and
Palakkad. The district-wise statistics of area and production of all the above-
mentioned vegetables are not available. However, information available for some
vegetables is presented in table 46:
Table 46Area under vegetable production (2000-01) (Area in hectares)
S. No. Districts Drum-
sticks Tubers
Sweet Potato
Tapioca
Bitter gourd
Snake gourd Okra Brinjal
Amar- anthus
Other veg.
Total
1 Thiruvanthapuram 2226 1703 5 6 27084 6 7 9 3 5 9 1 6 8 8 739 32131
2 Kollam 1558 5640 2 26484 8 6 1 6 165 124 518 641 35234
3 Pat hanamthitta 580 3677 - 7681 127 146 3 4 5 4 7 9 730 13108
4 Alappuzha 834 2192 1 4843 133 7 7 1 1 2 8 157 645 8921
5 Kottayam 898 1489 3 8749 246 215 1 4 4 9 2 9 965 12657
6 Idukki 562 1935 5 7794 286 1 9 1 1 2 0 4225 14848
7 Eranakulam 927 992 1 2 5208 191 130 4 6 6 1 102 994 8663
8 Thrissur 1289 802 3 1637 110 3 3 4 0 1 7 7 5 741 4747
9 Palakkad 1658 2553 369 6646 212 109 415 299 101 8559 20921
1 0 Malappuram 2474 2433 260 7508 125 4 0 7 6 4 2 6 0 2286 15304
1 1 Kozhikode 3297 1822 5 4037 2 7 1 2 - 1 5 539 9745
1 2 Wayanad 890 1727 1 2 1620 100 2 3 3 3 716 5076
1 3 Kannnur 1798 1094 2 2 3945 8 1 8 2 9 2 2 6 7 1032 8098
1 4 Kasaragod 641 390 6 6 1373 2 6 - 3 0 9 2 8 997 3560Total 19632 28449 816 114609 1817 871 933 735 1342 23809193013
Source: Department of Economics and Statistic s, GOK

AEZ Kerala 40 Cebeco India Private Limited Your Partner in Agri-business
It can be seen from the table that tapioca in the most popular vegetable
occupying about 60% of area under cultivation. Minor tubers and drumstick follow
this. Area under other vegetables is very little, bitter gourd account for only 1% and
others even less than 1%.
In mid 90s, the area under cultivation of vegetables was around 70,000 ha only and
imports from neighbouring states were increasing. Kerala Government noticed this
trend and started various developmental projects. The year 1997-98 was declared
as a “Harita Year” and organizing farmers into “Harita Sanghams” started massive
programs for commercial cultivation of vegetables in selected areas. The good
achievements under the project every year has resulted in present level of area
under vegetable cultivation, which has more than doubled during last 5 years.
The production of major vegetables in the state is given in the table 47:
Table 47 Quantity of vegetable production (in MT)
S. No.
Districts
Drumsticks
Tapioca
Sweet Potato
Total
1 Thiruvanthapuram 3590 468213 635 472438
2 Kollam 2849 566274 2 2 569145
3 Pathanamthitta 596 167849 - 168445
4 Alappuzha 930 81313 1 2 82255
5 Kottayam 493 256831 2 4 257348
6 Idukki 738 267112 5 7 267907
7 Eranakulam 726 15455 9 135 155420
8 Thrissur 1749 41524 3 2 43305
9 Palakkad 2205 136341 3403 141949
1 0 Malappuram 2588 185143 2992 190723
1 1 Kozhikode 1313 88366 5 7 89736
1 2 Wayanad 718 54917 140 55775
1 3 Kannnur 1371 90706 250 92327
1 4 Kasaragod 959 27755 1204 29918
Total 20825 2586903 8963 2616691
Source: Department of Economics and Statistics, GOK
5.3 Causes of low yield in the state
The productivity of the major fruits and vegetables cultivated in Kerala is extremely
poor when compared with the leading states in India and countries in the world. The
summary is given in the table 48:

AEZ Kerala 41 Cebeco India Private Limited Your Partner in Agri-business
Table 48 Productivity of key crops in Kerala vis-à-vis best in India and world (MT / ha)
S. No.
Particulars Kerala Best in India
Best in world
1. Banana 8 60 – Maharashtra 45 – Costa Rica 2. Pineapple 8 28 – West Bengal 45 – Mexico 3. Tapioca 22 41 – Tamil Nadu 25 – India
Source: Cebeco field survey
It can be seen from the table 48 that in case of pineapple and banana the
productivity in Kerala is extremely poor. The reasons for the same are many. Firstly, in
Kerala system of mixed cropping is practiced, crop like pineapple is grown in the
plantations of rubber or cocoa, which do not permit full sunlight to the former. This
pattern is followed randomly in the state, without knowing the complimentary or
antagonistic effects of crops on each other, which results in lower yield. The reasons
of lower yield are the antagonistic effect of one on the other crop.
Specific nutrient requirement of each crop, which can’t be fulfilled when, planted
under this system.
Adverse effect of Shade
Crop specific agronomic practices like irrigation, hoeing etc can not be
undertaken. These problems can easily be overcome by the scientific crop selection, which will
be complimentary to each other. Mono cropping can also be more remunerative.
Further, mixed cropping makes use of crop specific agronomical practices difficult.
In Kerala farmers still grow ethnic varieties of Banana like Nendran, Palayankodan,
Poovan etc., which are having low productivity as compared to exotic varieties.
Even though high yielding tissue cultured plants can be used for these varieties too
the usage in very little. In case of pineapple, low yielding ‘Mauritius’ is preferred over
‘Kew’, which can give almost double yield. In case of Tapioca, the state of Tamil
Nadu is much ahead of Kerala even though cultivation in Tamil Nadu started on
large scale only in the nineties. In fact, farmers in Kerala are in a vicious cycle, low investment in planting material
and other inputs, poor crop management that leads to poor productivity.

AEZ Kerala 42 Cebeco India Private Limited Your Partner in Agri-business
For crops like banana and tapioca, India is world leader (India’s productivity almost
equal to Columbia and Ecuador in case of banana therefore, it should not be
difficult for Kerala to improve its production technology. With use of scientific
cultivation technology states like Maharashtra and Tamil Nadu have achieved very
high productivity in banana. The scientific production practices and plant
protection measures of these crops are given in Annex 2.
5.4 Floriculture in Kerala
Even though Kerala based well known companies like “AV Thomas” and “Beena
Nursery” started export of live young plants, ornamental plants, cut flowers etc.
several years back, at present state does not find a place in the horticulture map of
India. In the matter of flower production, Karnataka leads with 34% of the total
production in the country followed by Tamil Nadu with 25%, Andhra Pradesh,
Maharashtra and West Bengal also have significant presence. Kerala is not a
producer of traditional flowers like Jasmine, Marigold, Nerium and cut flowers like
rose, gladioli, tuberose, aster, golden rod etc. Nearly 95% of the demand in Kerala
for the traditional flowers is met by neighbouring states of Karnataka and Tamil
Nadu. Small quantity of local supplies in form of Jasmine from Alappuzha and
Palakkad are prevalent.
However, the state has a significant presence in the production of modern flowers
like orchids, anthurium ornamental foliages and cut foliages.
The reason for Kerala’s insignificant role in floriculture is high rainfall, high humidity
and the undulating topography of the garden and dry lands with its covering of tree
crops, hinders quality and duration of sunlight falling on ground. Neighbouring states
like Karnataka and Tamil Nadu have large stretches of plain lands with bright
sunlight throughout the day supplemented by low humidity and ideal temperature
for floriculture.
The production of floricultural products is largely in the hands of small farmers who
undertake this for supplementing their income. For promotion of such activities there
are several societies in the state like Federation of Indian florists at
Thiruvanthapuram, Kerala cut flowers producers’ society, Thiruvanthapuram,
Farming Tr ust of India Palakkad, the Vanitha Pookrishi Sahakarana Sangham. Even
AVT group had also started cultivation of orchids through women’s group and

AEZ Kerala 43 Cebeco India Private Limited Your Partner in Agri-business
projects was known as AVT-Vanitha but the operations had to be closed as AVT
found it difficult to market the flowers. There are a few other small floriculture
projects in the state namely Kerali Orchids at Ernakulam, Sterling Orchids at
Palakkadd, Carnation Orchids at Ernakulam Team Flowers, an anthurium project at
Palakkad. A few others are Hafi Orchids at Kolamseri, Toyo Floriculture at Quillon,
Palakkad District Cut Flower Growers Association at Palakkad.
The floriculture units set-up in the state are not doing well and are catering to
domestic market only for high value flowers like anthurium. Very small quantities are
being exported. Even in domestic market, the units started having marketing
problem after large projects like Natural Synergy in Karnataka started production.
Kerala has a climatic edge in the rearing of orchids and anthurium. In other states,
these flowers are grown in protected environment and cost of production is high. In
Kerala, these are grown under shade of coconut tree. But as farmers don’t follow
the proper fertilizer application schedule, the growth of flower is poor and there is
lack of standardization because of which flower is not exports worthy.
The export of flowers to gulf and western countries from Thiruvanthapuram airport for
the year 2000-01 was about Rs. 11 lacs, which had increased from export of Rs. 2.4
lacs in 1998-99.
5.5 Marketing of horticulture produce in Kerala With the increase in incomes and awareness regarding nutritive value and
importance of fruits and vegetables in diet the demand for the same has increased
in recent years and it will continue to do so in near future as the present
consumption levels are quite low.
The total arrivals of fruits and vegetables in markets of Kerala are estimated at about
14 lacs MT annually. Eranakulam district tops the list by handling 2.35 tons of these
commodities each year. Thiruvanthapuram, Thrissur and Palakkad districts receive
over 1.4 lacs tons per annum. Eranakulam Corporation market handles the
maximum with 1.65 lac tonnes of annual arrivals. The urban market at Palakkad,
Thiruvanthapuram and Thrissur handle over one lac ton individually in a year. The
commodity group-wise annual trading in the state is estimated as follows:

AEZ Kerala 44 Cebeco India Private Limited Your Partner in Agri-business
Vegetables : 7.13 lacs MT
Banana : 5.26 lacs MT
Other Fruits : 1.65 lacs MT -------------------
Total 14.04 lacs MT
Of the 7.13 lacs tons vegetables (excluding tapioca & other tubers) traded in the
state about 5 lacs tons (68%) comes from the neighbouring states viz. Tamil Nadu
and Karnataka. In case of fruits, out of total arrivals of 1.66 lacs tons on 0.4 lacs tons
(25%) are reportedly procured from within the state. However, only in case of
pineapple, jackfruit and mango, the state has marketable surplus. Pineapple in
particular is sold to all parts of India regularly. According to leading traders of
pineapple at Vazhakulam market, the major market of pineapple in Kerala; about
11,750 Lorries of pineapple are sent out of Kerala every year, the break-up for
various states/cities is given in table 49:
Table 49 Estimated dispatches of pineapple from Kerala
S. No.
State/City No. of Lorries/Year
1. Bangalore 1,200 2. Mumbai & Pune 6,000 3. Gujarat 700 4. Delhi 350 5. Andhra Pradesh 2,000 6. Chennai 1,000 7. Madhya Pradesh 350 8. Rajasthan 150
Total
11,750
Source: Cebeco field survey
Considering the weight of each lorry as 9 MT, the dispatches of pineapple to other
states aggregate to about 1 lac ton. In case of Banana, out of arrivals of 5.28 lacs
tons annually in Kerala, only about 3 lacs tons per year that comes to the market of
Kerala is sourced from within the state. From the above, it is clear that there is overall
acute shortage of fruits and vegetables in the state.
It has been also informed that producers of fruits and vegetables retain about 10%
of some major products for the domestic consumption and remaining is sold in the
market.
5.6 Supply Chain
There is long supply chain of producers, consolidators, sub-agents, agents,
transporters, merchant exporters, wholesalers, retailers etc. before the commodity

AEZ Kerala 45 Cebeco India Private Limited Your Partner in Agri-business
reaches end users. The various functionaries involved in the production, collection,
exports distribution/marketing of fruits and vegetables are:
§ Farmers
§ Self help groups / Growers’ societies
§ Pre-harvest contractors
§ Village merchants
§ Commission agents
§ Wholesale merchants (urban & rural)
§ Exporters
§ Retail traders / hawkers
§ Public Sector Organizations – VFPCK, KHDP, HORTICORP, Maveli (Civil supplies
corporation)
§ Processing units
A brief description of various functionaries and their role is given in the following
paragraphs.
5.6.1 Farmers
The farmers growing fruits & vegetables are starting point of the chain. Most of the
farmers are small; some have own land whereas others cultivate leased lands.
There are different ways by which farmers sell their produce. The small farmers sell
their produce to local retailer or nearby wholesaler. Sometimes, there are agents in
the village who consolidate their produce and sell to agents in urban centers. In
some villages, there are self-help group of farmers where the produce is
consolidated and taken to market. Some agents/ traders also buy the produce from
farm.
A recent trend noticed is that some of the large-scale producers have direct link
with the commission agents/traders and the produce is directly taken to the
wholesale markets bypassing the intermediaries.
5.6.2 Self Help Group / Sangams / Cooperatives
In Kerala a very successful model developed under EU aided Kerala Horticulture
Development Program where in some 2000 Self Help Group of farmers growing fruits
and vegetables have been organized. The produce of all the members is pooled

AEZ Kerala 46 Cebeco India Private Limited Your Partner in Agri-business
together and taken to market/mandi for auction. This eliminates a number of
intermediaries besides farmers get a fair price. The state department of agriculture
has also promoted “Sangams” of vegetables growers. Similarly, there are co-
operative societies of farmers growing/selling horticultural produce.
5.6.3 Pre-harvest contractors
In certain villages, local merchants or traditional money lenders act as pre-harvest
contractors and advance money to the needy farmers and collect produce from
them usually at a lower rate then prevailing market rates. These merchants collect
the produce from different holdings and sell it to the primary wholesalers in urban or
rural markets.
5.6.4 Village merchants
The small village merchants collect the produce either direct from the farm holdings
or from the nearest mandi or primary markets and sell the produce to the wholesale
merchants and retail merchants in the primary markets.
5.6.5 Commission agents
Commission agents act as a lin k between the sellers and buyers. They arrange to
collect and deliver the produce to the wholesalers, exporters or processors. For
commodity like pineapple, tapioca, tubers etc. which are sold to far off markets,
commission agents play a very important role.
5.6.6 Wholesale merchants
They are the most important functionaries in supply of fruits and vegetables. They
bring the produce either from other states through commission agents / wholesalers
or from rural markets. For some commodities they buy through auctions also and
further sell to retailers / hawkers.
5.6.7 Exporters
More than 100 exporters, largely based at Thiruvanthapuram followed by
Eranakulam and Kozhikode are engaged in the export of vegetables and fruits to
foreign countries especially to gulf countrie s. Exporters have collection points of fruits
and vegetables in production centers and their agents operating in these collection
points, purchase and transport produce to the exporter’s premises sufficiently ahead
of the flight departure timings. The produce is graded and packed before exports.

AEZ Kerala 47 Cebeco India Private Limited Your Partner in Agri-business
5.6.8 Retail traders / hawkers
Retailers are important link in the chain as consumers generally buy from them.
Retailers have their own shops; some occupy open space in the market yard or
roadside and exhibit the produce in small heaps. Hawkers carry head-load of fruits
and vegetables or used rickshaw / pushcart for reaching to the customers.
Generally, they try to finish their stock at end of the day.
5.6.9 Co-operative societies
Marketing societies also play a role in the marketing of vegetables in the state. They
procure or purchase vegetables and fruits mainly from their grower members and
sell directly to the consumers availing only a small margin for meeting their
operational expenses. There are around 10 societies successfully operating in the
state, the notable ones are Regional Fruit and Vegetable Producers Co-operative
Society. Thaliparamba (Kannur), Kuruppumthara Fruits and Vegetables Marketing
Society (Kottayam), Thrissur Fruits and Vegetables Marketing Society.
5.6.10 Public sector organizations
Due to increasing gap between supply and demand of fruits and vegetables in the
state, the Kerala Government had planned several interventions like the EU aided
Kerala Horticulture Development Programme (KHDP), the Kerala State Horticultural
Products Development Corporation (HORTICORP). For this purpose Kerala State Civil
Supplies Corporation (KSCSC) and women owned sales outlets by Women’s
Development Corporation were also helpful.
Even state agriculture department also organizes sales of vegetables during festivals
by procuring vegetables from “Harita Sangams” promoted by them in the state. The
main defective behind this activity of the department is to check the hike in open
market prices of vegetables and to make available quality fresh vegetables to
consumers at reasonable prices during Onam Season.
5.7 Pattern of arrival and price of fruits and vegetables
The information on arrivals of major fruits & vegetables and price pattern over a year
was studied for state’s major market viz. Thiruvanthapuram. The details are given in
table 50 and the graphs.

AEZ Kerala 48 Cebeco India Private Limited Your Partner in Agri-business
Table 50 Monthly price and arrival of some fruits & vegetables in Thiruvanthapuram wholesale market, Year 2001
(Arrival – MT / Month, Price - Rs. / Q) Banana Pineapple Okra Bitter Gourd Month
Arrival Price Arrival Price Arrival Price Arrival Price January 1326 675 166 675 429 756 250 1441 February 1498 586 153 603 441 772 266 1199 March 1837 548 171 754 520 621 364 1059 April 1289 532 149 687 363 700 224 1417 May 1602 651 225 908 490 724 293 1549 June 1623 598 171 923 507 753 284 1590 July 1888 542 220 905 547 574 245 1586 August 1350 708 183 983 603 564 283 1389 September 1302 799 222 887 508 729 246 1546 October 1543 758 240 1032 666 743 354 1433 November 1540 694 295 1064 565 866 428 1339 December 1541 717 388 933 627 571 462 1038
Source: NHB Monthly Reports
Figure 1 Arrival of Major fruits and Vegetables in Thiruvanathapuram
Price pattern of Major fruits and Vegetables in Thiruvanathapuram
0200400600800
100012001400160018002000
Jan Feb Mar Apr May Jun Jul Aug Sep Oct Nov Dec
Month
Arr
ival
s [
MT
s/M
on
th]
Banana Pineapple Okra Bitter Gourd
0200400600800
10001200140016001800
Jan Feb Mar Apr May Jun Jul Aug Sep Oct Nov Dec
Month
Pri
ce [
Rs.
/Qn
tl.]
Banana Pineapple Okra Bitter Gourd

AEZ Kerala 49 Cebeco India Private Limited Your Partner in Agri-business
It is clear that the availability of banana, pineapple, okra and bitter gourd is round
the year. Only in case of banana the fluctuations can be observed in arrivals – peak
arrivals in February, March and July and low arrivals in the months of January, April,
August and September. As far as prices are concerned, the fluctuations across the
year have been only marginal and prices were more or less stable for most of the
year.
The prices of banana, okra, bitter gourd and green chillies in Thiruvanthapuram
market were compared with those of Chennai Market (the nearest major market) to
see state’s competitiveness for exports. It can be seen from the table 51 and graphs
below that except for okra, the prices of remaining fruits and vegetables, in Chennai
market are 30-40% lower. This is due to the fact that Tamil Nadu is a surplus state for
fruits and vegetable and it is despatched to Kerala in large volumes. Interestingly, in
case of okra, the prices were lower in Thiruvanthapuram market during most of the
months. This may be due to the fact that local consumption of okra is low and it is
largely cultivated for export purposes. It is noteworthy that the prices of okra in
Kerala were found to be very competitive when compared to prices in other major
markets of India. Therefore, okra merits special attention as an export-oriented
vegetable from Kerala.
Table 51 Comparison of prices of some fruits and vegetables between Thiruvanathapuram and Chennai market (Year 2000)
(Prices - Rs. / Q) Thiru. Chennai Thiru Chennai Thiru Chennai Thiru Chennai Fruits/Vege.
Banana Okra Bitter Gourd Green Chillies Jan 693 388 647 1032 1265 949 1027 746 Feb 665 365 619 883 1205 838 955 667 Mar 616 374 674 934 1184 602 908 756 Apr 598 356 565 634 1409 688 897 866
May 616 386 579 551 1587 778 1276 1005 Jun 562 398 641 443 1881 690 1106 707 Jul 564 405 693 699 1685 782 984 840
Aug 744 418 686 807 1360 726 959 1001 Sep 784 439 622 512 1439 606 944 838 Oct 658 417 589 526 1813 718 1044 802 Nov 762 406 761 585 1486 562 942 442 Dec 658 410 754 762 1463 796 936 451
Source: Cebeco field survey

AEZ Kerala 50 Cebeco India Private Limited Your Partner in Agri-business
Thiruvanathapuram
Chennai
The prices of pineapple for three years in the major pineapple markets of Kerala are
given in Table 52. It is clear from the price trends that over last three years, the
prices of pineapple have increased. Throughout the year the prices have been
above Rs. 5.50/kg. Due to this reason, the local pineapple-processing unit has not
been able to process the pineapple, as at these prices, it is not commercially
viable. However due to good quality of pineapple there is good demand for it from
all over the country. Like wise the prices of Tapioca in Thrissur Market is also given
in table 53. The prices fluctuate from Rs 3 to 4.50 per kg.
0200400600800
1000
1200
Jan
Feb
Mar
Apr
May Jun
Jul
Aug
Sep Oct
Nov
Dec
Month
Pri
ce
Banana Okra Bitter Gourd Green Chillies
0
500
1000
1500
2000Ja
n
Feb
Mar
Apr
May
Jun
Jul
Aug
Sep Oct
Nov
Dec
Month
Pri
ce
Banana Okra Bitter Gourd Green Chillies

AEZ Kerala 51 Cebeco India Private Limited Your Partner in Agri-business
Table 52 Monthly average prices of pineapple (ripe) for the last three years in Vazhakulam market of Ernakulam district (Price - Rs. / kg)
MONTH 1999 2000 2001
Jan
7.19 3.49 5.64
Feb 6.50 5.33 6.10
March 6.26 6.20 5.50
April 7.00 4.67 7.72
May 4.47 6.28 6.54
June 3.25 7.02 6.13
July 5.55 5.46 6.92
Aug 5.54 5.38 8.50
Sept 6.69 4.60 6.55
Oct 4.55 3.82 7.19
Nov 3.26 5.82 8.96
Dec 5.73 4.64 5.47
Source: VFPCK
Table 53 Wholesale price (Rs./Kg) of Tapioca in Thrissur Market (Jan. 1999- Sept. 2002)
Months 1999 2000 2001 2002
Jan 3.27 3.98 4.00 3.06
Feb 3.50 3.92 4.00 -
March 3.50 4.00 3.67 3.50
April 3.50 4.00 3.29 3.50
May 3.5 0 3.85 3.08 3.18
June 3.58 3.90 2.97 3.65
July 3.50 3.76 3.07 4.00
Aug 3.50 3.86 3.22 4.38
Sept 3.72 3.95 3.50 4.50
Oct 3.72 4.00 3.17 -
Nov 3.88 4.08 3.37 -
Dec 4.00 4.00 3.04 -
Source: Vegetable & Fruit Promotion Council Keralam
5.8 Current status a nd prospects of exports of horticultural products from Kerala In this section, the present status of exports of fruits, vegetables and floricultural
products from Kerala and the potential for the same has been discussed.
Pineapple - prices (Rs/kg)
0123456789
10
Janu
ary
Febr
uary
Mar
ch
Apr
il
May
June July
Augu
st
Sept
embe
r
Oct
ober
Nov
embe
r
Dec
embe
r
Months
Rs/
kg
199920002001
Tapioka - Prices (Rs/kg)
0
0.5
1
1.5
2
2.5
3
3.5
4
4.5
5
Jan
Feb
Mar
ch
Apr
il
May
June
July
Aug
Sep
t
Oct
Nov Dec
Months
Rs
/Kg
1999200020012002

AEZ Kerala 52 Cebeco India Private Limited Your Partner in Agri-business
The current level of exports of fruits and vegetables from Kerala is about 25,000 MT.
About 80% of the volume is exported from Thiruvanathapuram airport, and
Ernakulam airport and Kochi port account for about 10% and remaining (about 2500
MT) is exported from Kozhikode airport. The build-up of the exports volumes of fruits &
vegetables from Thiruvanathapuram airport is given in table 54:
Table 54 Exports of fresh fruits & vegetables from Thiruvanathapuram airport
Year Quantity (MT)
1990-91 6,754 1993-94 10,217 1998-99 17,044 1999-00 21,951 2000-01 18,972 2001-02 20,036
Source: KSIE
The average increase in exports is about 12% per annum. The experts attributed this
to the increase in number of international flights from Thiruvanathapuram. At
present, the available cargo capacity is being fully utilized and with the increase in
number of flights from Thiruvanathapuram, the exports can be further increased. The
dip in the exports from Thiruvanathapuram airport in 1998-99 was due to
cancellation of 6 gulf flights from Thiruvanathapuram airport as the Air-India wanted
to promote Kochi airport and it did result in shifting some exports to the later.
However, exporters prefer Thiruvanathapuram as the exit point, due to availability of
better quality plantation in South Kerala, therefore, some of them started patronizing
foreign airlines. The value of current level of export of fruits and vegetables from
Kerala is about Rs. 50 crores. Fruits & vegetables from Kerala are exported to gulf
countries and other western countries. The important gulf countries importing
vegetables and fruits from Kerala are Dubai, Abu Dhabi, Saudi Arabia, Kuwait,
Bahrain, and Sultanate of Oman & Qatar. Small quantities of specified items are also
exported to Western/European countries like Amsterdam, Australia, London,
Frankfurt, Paris, Toronto etc. Dubai is the major importing country. Winter season
vegetables like cabbage, carrot, cauliflower, beans along with banana and
pineapple are also exported to Maldives. Of the total quantity of fru its and
vegetables exported more than 60% is Banana (both green & ripe). The varieties of
Banana having export demand include Nendran, PalayinKodan, Rasthali and
Poovan. The other fruits exported are pineapple, jackfruits and green Mangoes.

AEZ Kerala 53 Cebeco India Private Limited Your Partner in Agri-business
The vegetables include tapioca, bitter gourd, drumstick, cucumber, snake gourd,
okra, green chillies, curry leaves, brinjal etc. bulky items like tapioca,
Amorphophallus and other minor tubers are being exported through ship from Kochi
port. Recently export of drumstic ks to Germany has started from the state and
volumes are expected to increase. The value-added products include wafer of
banana & Jackfruit, pickles etc.
5.9 Export of Floricultural Products In spite of Kerala having tremendous climatic advantage in the rear ing of orchids
and anthurium and variety of ornamental foliage, it has not been able to penetrate
the export market and sales have remained confined to metro cities of India only.
Very small quantities of cut flowers, ornamental foliage, cut foliage etc are exported
to gulf countries. The value of exports from Thiruvanthapuram airport during the
years 1998-99, 1999-00, 2000-01 has been Rs. 2.39 lacs, Rs. 3.00 lacs and Rs. 11.00 lacs
only. Although, the precise information for total exports of floriculture products from
Kerala is not available, considering some exports from other airports too, the value
of exports from Kerala is less than Rs. 25 lacs annually.
5.10 Present constraints and potential for growth
The reason for regular and sizeable exports of fruits and vegetables in gulf is Indian
Diaspora who needs ethnic vegetables & particular varieties of banana. The
population of NRIs in major gulf countries is given in the table 55:

AEZ Kerala 54 Cebeco India Private Limited Your Partner in Agri-business
Indian Diaspora in Gulf Countries
Table 55 Estimates of Indian Migrants in the Gulf Region, 1975-1999
Source: Ministry of External Affairs
Table 56 Percentage of NRIs in the total population of main Arab countries in Year 2000
Source: Ministry of External Affairs
According to the estimates of ministry of external affairs about 50% of NRIs are from
Kerala and another 15-20% from southern states like Andhra Pradesh, Tamil Nadu
and Karnataka. Therefore, the demand for certain fruits and vegetables is regular.
The major constraints faced by exporters of fruit and vegetables in Kerala are:
§ High air-freight charges
§ No knowledge of appropriate post -harvest practices
§ Lack of availability of fruits and vegetables in the state
§ High prices

AEZ Kerala 55 Cebeco India Private Limited Your Partner in Agri-business
High landed cost of India products
As mentioned earlier the most important destination for the exports of fruits and
vegetables from Kerala is gulf countries viz. countries like UAE, Saudi Arabia, Bahrain,
Kuwait and Qatar. As banana and plantain account for 60% of exports, the
information on prices on the same from various sources of origin was compiled and
is presented in table 57:
Table 57 Landed prices of banana in Major Middle East countries from various countries of origin
(Rs. per kg in 2002)
Market Origin March April May June July August
Bahrain Philippines 26.71 24.17 - 30.53 24.17 27.98 Kuwait Philippines 44.64 37.20 - 38.69 32.74 32.74
Ecuador 34.45 32.50 - - - - Philippines 32.50 29.64 - 29.25 27.30 27.95 Yemen 21.45 22.75 - 20.54 17.55 14.95
S. Arabia
India 76.05 76.05 76.05 76.05 76.05 76.05 Philippines 29.25 30.29 - 30.29 24.44 26.65 UAE India 78.00 78.00 78.00 78.00 78.00 - Philippines - - - 49.24 - - Qatar India - - - 79.20 - -
Source: AIC, FICCI
The prices in the markets of gulf countries indicate that the supplies from Philippines
are very cost competitive. This is attributable to export of banana to these countries
by the use of marine transport, which is very economical. India is in a position to
export some quantities at high prices due to some ethnic varieties, which are
preferred by Indian expatriates. India can only increase its volumes if exports are
affected through marine transport. The present airfreight charges Rs. 26 to 40 per kg
are more than the landed cost of banana from Philippines.
Countries like Thailand and Malaysia have also perfected the protocols for transport
of pineapple and mango through low cost reefer containers and are gradually
capturing the market hitherto controlled by India. Therefore, it is absolutely
necessary that appropriate post harvest protocols be developed for transportation
of fresh fruits through marine transportation. Compared to value of the product, the freight charges are indeed very high which
can be seen from the table 58:

AEZ Kerala 56 Cebeco India Private Limited Your Partner in Agri-business
Table 58 Airfreight charges from Thiruvanthapuram airport to major export destinations
(Rs./Kg.) Damam Dubai Abu Dhabi Muscat Bahrain Kuwait Doha
Thiruvanthapuram 37 34 34 32 40 40 40 Kozhikode 37 25 25 - 38 - 38 Kochi 30 29 29 29 38 41 -
Source: KSIE
High freight charges make the landed costs high and even though Kerala is a
monopoly supplier of some items, the fruits & vegetables being price-sensitive, there
is an adverse effect on demand. While reduction in airfreights can’t be expected,
use of high -speed marine transport; C.A. containers and use of appropriate post-
harvest technology would be needed. One of the leading exporters lamented that
when he tried exporting pineapple through ordinary container, there was a quality
problem and he incurred loss of Rs. 3.00 lacs. It was reported that Malaysia and
Thailand are using marine transport for export of pineapple to gulf countries and
India has lost the market due to price competition even though Indian pineapple is
better.
The exporters were confident that they could recapture the market if they could be
helped in successfully exporting the pineapple through marine transport. Philippines
has started export of banana to gulf countries through use of CA containers.
The problems of availability of fruits & vegetables and high price are related. Since,
there is acute shortage of fruits & vegetables in the state, the supplies come from
the neighbouring states. Even exporters are sourcing supplies from Tamil Nadu. This
result in increase in prices due to a large number of intermediaries involved and
quality also gets affected due to long distance transportation and lack of direct
supervision. The exporter opined that Kerala has lost tapioca market to Sri Lanka and
Tamil Nadu, on account of prices.
The exporters had shown keen interest in developing backward linkages provided
some land was made available to them. Exporter had also shown interest in working
with farmers, Self Help Groups/Cooperatives in Kerala and to source their
requirements only from within the state. The state has witnessed a growth rate of 10-12% in exports of fresh fruits and
vegetables during last decade and exporters are confident that if appropriate
support measures are taken the growth rate up to 25% could be achieved.

AEZ Kerala 57 Cebeco India Private Limited Your Partner in Agri-business
5.11 New Product and Markets For increasing the exports from the state some new product like cut foliage, Banana
wafers and okra have been recommended. The exporters from the state should also
reach out to new markets like UK for okra and major European countries for cut
foliage.
5.11.1 Cut foliage
Tropical Cut Foliage is an important part of florist industry. Cut foliage is used as filler
in bouquets, flower arrangements etc. in combination with cut flowers. Unlike cut
flowers, there is year round demand for cut foliage in Europe, the USA and Japan
through the volume is lower in off-season. The important producers are the USA,
Spain, Kenya and Sir Lanka. During the period of October to April production in the
colder regions is very low whereas demand is high. The cut foliage from Kerala has
many competitive advantages like: § Due to long duration of rains and high humidity; year round production,
particularly during October to April when export demand is high.
§ Investment cost is very low as compared to cut flowers .
§ Risk of damage during transportation is minimum.
§ A variety of foliage grown in Kerala.
§ A number of foliage plants grown in open field conditions in Kerala.
§ Even leaves of coconut, palm and banana, which are by products/waste, have
market in certain countries.
§ The rich forests of Kerala with its diverse flora are a good and cheap source of
cut foliage.
5.11.2 Banana wafers
Banana wafers for exports are being packed in ordinary poly packs and are not
branded. The banana wafers are manufactured by cottage scale units and quality
is inconsistent and shelf life uncertain. Therefore, in order to have growth in exports it
would be desirable to process the banana wafers in organised sector and market in
form of packed and branded product. Similar efforts in case of Indian snacks,
savories, ground spices etc have made a substantial impact. This would also enable
the exporters to enter in quality conscious markets of some European countries.

AEZ Kerala 58 Cebeco India Private Limited Your Partner in Agri-business
5.11.3 Okra Besides, Middle East market, okra has good demand in UK, where population o f
Indians and Pakistanis is substantial. Okra is not grown on a large scale in Europe,
therefore, it is imported from various countries like Thailand, Brazil, Gambia, Kenya,
Zimbabwe, Cyprus and SARRC countries. India produces world’s 64% of okra and
there is a vast potential for India to exploit its unique position. The demand for okra in
UK is about 20-30 MT per day and India is in a position to supply okra round the year
at a competitive price; this opportunity needs to be exploited. Within India Kerala is
very competitive. However, a special variety of baby okra needs to the promoted,
which is preferred by the overseas consumers.

AEZ Kerala 59 Cebeco India Private Limited Your Partner in Agri-business
6 SWOT ANALYSIS
The strengths, weakness, opportunities and threats for the export of floricultural
products from Kerala is presented below:
6.1 Strengths
§ Good climate, which enables round the year production/availability of fruits,
vegetables and flowers.
§ Rains spread over 6-8 months in most parts of Kerala. Drought situation rare.
§ High literacy, new ideas / innovations adopted fast.
§ Excellent infrastructural facilities airport, food parks, markets etc.
§ Proximity to export markets like gulf countries Sri Lanka, Maldives & Mauritius.
§ Sizeable population of non-resident Indians in above-mentioned countries.
§ Kerala produces some unique products like Nendran banana, table variety of
pineapple (Mauritius) and some minor tubers, which have good export potential.
§ Varieties of foliage plants can grow under natural conditions.
6.2 Weaknesses
§ High wage rates.
§ Very small land holdings.
§ High price of land as well as lease rental.
§ High population density, which creates deficit of most of fruits and vegetables
and very little marketable surplus, for a few commodities.
§ Prices of most of fruits and vegetables produced in state are high.
6.3 Opportunities
§ Global trade of fresh fruits and vegetables increasing NRIs of Kerala origin
patronize produce of Kerala because of its distinct quality.
§ With use of appropriate post -harvest technology coupled with use of marine
transportation. Kerala can become competitive and recapture the lost-markets
§ Growing demand for cut foliage needs to be tapped.
6.4 Threats
Neighbouring states like Tamil Nadu and countries like Sri Lanka, Malaysia and
Thailand capturing a high share due to high productivity and lower cost of
production.

AEZ Kerala 60 Cebeco India Private Limited Your Partner in Agri-business
7 AGRI EXPORT ZONE IN KERALA
7.1 Agri Export Zone Scheme
The Agri Export Zones (AEZ) scheme has been introduced recently by the Ministry of
Commerce for promoting export of specific produce/products grown in a
contiguous area, with the objective of providing remunerative returns to farmers on
a sustained basis by improved access to exports.
7.1.1 The Concept of Agri Export Zone Sporadic efforts have been made in the past for promoting export of agricultural
produce/products from the country. On one hand Research and Development has
taken place with little bearing on the development of a particular agricultural
produce for the purpose of export, on the other hand financial and fiscal incentives
are being provided for exporting a particular produce without actually addressing
pre-harvesting and post -harvesting practices. The concept of Agri Export Zone thus
attempts to take a comprehensive look at a particular produce/product located in
a contiguous area for the purpose of developing and sourcing the raw materials,
their processing/packaging, leading to final exports. Thus, the entire effort is
centered on the cluster approach of identifying the potential products, the
geographical region in which these products are grown and adopting an end-to-
end approach of integrating the entire process right from the stage of production
till it reaches the market. There would also be a need to identify and enlist
difficulties and problems encountered at each stage. These difficulties could be
procedural in nature or may relate to a particular quality standard. A package
needs to be developed to suggest solutions to these problems and
agency/agencies identified to implement these in a given time frame, which forms
the basis of the Agri-Export Zone concept.
7.2 Measures envisaged for promoting exports from such Zone
7.2.1 Financial Assistance
Central as well as State Government and their agencies are providing a variety of
financial assistance to various agri export related activities. These extend from
providing financial assistance for Training and Extension, R&D, Quality Upgradation,
Infrastructure and Marketing etc. Thus, whereas Central government Agencies like
APEDA, Spices Board, National Horticulture Board, Department of Food Processing

AEZ Kerala 61 Cebeco India Private Limited Your Partner in Agri-business
Industries, and Ministry of Agriculture provide assistance. A number of State
Governments have also extended similar facilities. All these facilities would have to
be dovetailed and extended to promote agri exports from the proposed Zones in a
coordinated manner. Some addit ional features like providing grants from Market
Access Initiative fund could also be considered.
7.2.2 Fiscal Incentives
The benefits under Export Promotion Capital Goods Scheme, which were hitherto
available only to direct exporters, have now been extended to service exporters in
the Agri Export Zones. Thus, even service provider to ultimate exporters will be
eligible for import of capital goods at a concessional duty for setting up of common
facilities. They shall fulfill their export obligation through receipt of foreign exchange
from ultimate exporters who shall make the payments from their EEFC account. Exporters of value added agri products will be eligible for sourcing duty free fuel for
generation of power, provided the cost component of power in the ultimate
product is 10 per cent or more and the input-output norms are fixed by the advance
licensing committee of the DGFT. In view of the power intensive nature of most of
the value addition, almost all the exporters of value added agriculture produce will
become eligible for such facility. Similarly, input-output norms can also be fixed for
sourcing other inputs, like fertilizer, pesticides etc. duty free for cultivation purpose.
7.2.3 Monetary Incentives
The units in the AEZ can avail concessional loan for infrastructure project like cold
chain through NABARD refinance scheme wherein banks are given refinance @
8.5% and after adding spread of 1.5% to 2% loan interest will work out to 10-10.5%.
Similarly, RBI has recently notified that units in AEZ can avail credit to distribute inputs
to contract growers @ 8.5%.
7.3 Operation of the Concept
The entire approach of promoting the Agri Export Zone would have to be taken on
a project mode. This would mean that the State Governments would need to
identify potential export products that could be selected for development by
adopting a cluster approach. State Governments will have to evolve Projects that
are feasible and capable of immediate implementation. They also have to confirm

AEZ Kerala 62 Cebeco India Private Limited Your Partner in Agri-business
to the indicative guidelines. The States will forward such project proposals to APEDA,
which will conduct the initial scrutiny of the proposals. If found feasible, APEDA may
provide necessary guidance, in preparing the detailed project report. This report,
after preliminary scrutiny, will be pla ced before the Steering Committee, which has
been constituted under the chairmanship of Commerce Secretary. Once the
Committee has approved the project proposal of a State, a MOU would be signed
between APEDA (on behalf of the Central Government) and the State Government
for providing possible assistance at each stage of the project. The responsibilities of
the State government would also be defined in the MOU.
The broad steps involved in setting up Agri Export Zones are:
§ Identification of specific products which enjoy good export potential.
§ Selection of a “contiguous geographical location” where the product is
available.
§ Taking necessary steps to strengthen the production, infrastructure, R&D support,
processing and packaging facilities etc.
§ Undertaking intensive market development and promotion efforts.
7.4 Need for AEZ
In keeping with the Government’s new policy, APEDA has proposed setting up of
Agri Export Zones in contiguous areas based on intensity of cultivation/ productivity
per hectare and the total availability.
The value chain for perishable product exports can be summarized as follows:
§ Supply of planting material
§ Production infrastructure
§ Technical know -how
§ Supply of inputs
§ Post Harvest Management (Grading/sorting/packing/storage)
§ Refrigerated transport
§ Marketing
- Exports (including logistics)
- Strengthening of domestic market
§ Marketing tie-ups in foreign markets

AEZ Kerala 63 Cebeco India Private Limited Your Partner in Agri-business
Most of the small producers find it very difficult to address all the above issues on
their own. As a result, the farmers are neither being able to maintain consistent
quality, nor able to market at a remunerative price.
Hence, it is important to adopt an integrated approach, under the AEZ model, to
ensure that all aspects of production to marketing are organized in a way so as to
benefit even the small producers besides leading to increase exports.
A suggested model for applying the AEZ approach for promoting exports of
selected products is described in the following section of this report.
7.5 Selection of products Due to Kerala’s very congenial ago-climatic conditions a large number of
horticultural crops are grown and exported. However, as the basic purpose for
setting-up an AEZ is to select a few promising crops and focus development
activities on them. The criterion used for selection of crops is as follows:
§ Volume of existing exports
§ The present production status and state’s competitiveness (productivity, quality,
price product’s uniqueness)
§ Potential for increasing exports.
§ Demand in overseas markets
§ Marketable surplus On the basis of above in the category of fruits, banana and pineapple have been
selected. Banana accounts for about 60% of present exports of fruits & vegetables
and have potential for growth further increase. Kerala is known for its unique
banana varieties like Nendran, Poovan, Palayamkodan which have regular
demand from non -resident Keralites in gulf. Pineapple is the only fruit crop, Kerala
has sizeable marketable surplus. The variety (Mauritius) grown in Kerala is table
variety, which is very juicy and delicious. If through proper post-harvest technology
its shelf life can be extended, the export volume could be increased. In vegetable
category ethnic vegetables like Yarn, Tapioca, Bitter gourd, Okra, Snake gourd,
Drumstick and spring beans have been identified.

AEZ Kerala 64 Cebeco India Private Limited Your Partner in Agri-business
In floriculture sector, there seems to be very limited opportunities for Kerala in
traditional cut-flower markets. Flowers of foreign origin like orchids and anthurium
have potential, as agro climatic conditions are suitable.
However, cut foliage exports have very good potential and Kerala has strengths for
cultivation of a variety of plant foliage like Dracaena, Codiaeum, Cordyline etc.
7.6 Project area
The concept of AEZ is based on cluster approach so that interventions can be
focused on potential areas for generating agricultural exports of the identified
products. The areas have been selected using the following factors.
§ Production and productivity of the identified crops
§ Proximity to exit points (airport and port) and availability of export –
infrastructures.
§ Contiguity of the identified districts.
§ Existing pattern of exports
Using above parameters, the districts of Thrissur, Ernakulam, Kottayaam, Alappuzha,
Pathanumthitta, Kollam, Thiruvanathapuram, Idukki and Palakkad have been
identified to constitute the proposed AEZ in Kerala.
About 86 % of pineapple is cultivated in these districts, and these districts account
for about 63 % of banana and plantain cultivated in Kerala.
The districts also have proximity to major exit points from the state namely airports at
Thiruvanathapuram and Cochin and port at Cochin. About 80% of present exports of perishables from the state are accounted by
Thiruvanathapuram airport. Another reason for selection of these districts is large
base of exporters of fruits and vegetables in these cities and existence of EEC
markets where pack houses and storage facilities could be made available. The
proposed AEZ in Kerala is shown in the map on page 65:

AEZ Kerala 65 Cebeco India Private Limited Your Partner in Agri-business
Proposed Area for Setting up of Agri Export Zone in Kerala
7.7 Identification of Export Markets
The major export destination from Kerala for perishables at present is gulf countries.
However, with addition of cut foliage, ethnic vegetables and pineapple in the
product mix and use of appropriate post -harvest technology new markets in
Europe, Africa could also be developed besides nearby markets like Maldives and
Mauritius. The present level of exports to these countries for relevant products is
given in tables 59:
Table 59 Exports to Gulf countries (Quantity in MT, Value in Lacs Rs.)
Vegetables Floriculture products
Fruits Countries
Quantity Value Quantity Value Quantity Value Bahrain 3178.12 499.14 - - 484.72 94.08 Kuwait 2954.12 523.48 - - 514.61 136.25 Maldives 3805.62 558.95 - - 208.86 36.08 Oman 1097.51 142.43 0.12 0.40 653.65 129.02 Qatar 2435.24 394.19 - - 418.196 100.74 Saudi Arabia 8218.47 1251.1 - - 1446.96 304.56 UAE 16511.05 2192.46 10.80 5.09 4416.15 920.10 Total 38200.15 5561.75 10.92 5.49 8143.16 1720.82
Source: APEDA export statistics for Agro and Food Products, India 2000-2001

AEZ Kerala 66 Cebeco India Private Limited Your Partner in Agri-business
7.8 Export targets for the state
For an overall accelerated development in select horticultural products in the state
of Kerala and to enhance their exports, the following needs to be done:
§ Development of suitable post-harvest technology for enhancing shelf life of
pineapple and banana. So, that these products could be exported using
economical marine transportation, which alone would increase the exports
substantially.
§ Development of a plan by which area under banana cultivation could be
increased in the identified 9 districts of Kerala. So that, the exporters discontinue
sourcing it from Tamil Nadu. Measures for improving productivity and quality of
varieties like Nendran should also be undertaken.
§ Dovetailing of developmental schemes of central Government and State
Government and targeting identified areas and crops in order to have faster
results.
§ A well organized and regulated marketing system where facilities for grading,
packaging and storage are available.
§ Integration of various organizations in the state with well defined role suitable
policy changes for creation of an enabling environment for Agri-exports.
§ Market development activities in the overseas markets.
Under the above strategies, it is felt that, it would be possible for the state of Kerala
to achieve the following targets, given in table 60.
Table 60 Kerala Export Projections
(Qty. in 000’MT and value in crores) Year 1 Year 2 Year 3 Year 4 Year 5 Item
Qty. Value Qty. Value Qty. Value Qty. Value Qty. Value Banana 22 38 25 42 29 46 34 50 40 58 Pineapple 2 4 3 6 4 8 5 10 7 14 Ethnic vegetables
5 8 7 11 9 14 11 ‘17 13 19
Cut Foliage 3 8 4 10 5 13 6 15 7 17 Banana Wafers 1 8 1.5 12 2 16 3 24 4 32 Total 33 66 40.5 81 49 97 59 116 71 140

AEZ Kerala 67 Cebeco India Private Limited Your Partner in Agri-business
8 INTERVENTIONS, INVESTMENTS AND SOURCES OF FUNDS
The unique products of Kerala like Nendran, Mauritius pineapple, and ethnic
vegetables already have established market in gulf countries and efforts are
needed for consolidation of Kerala’s position in these markets. Cut foliage offers
new opportunities to Kerala and markets in Europe and USA can also be accessed
besides gulf markets. Similarly, Okra, Bitter gourd, Tapioca and certain tubers have
good market and are also becoming popular in African and European countries
and these markets need to be developed. In this chapter the interventions to be
needed, for increasing export of horticultural products from Kerala, agencies
responsible for the same and financial implications have been detailed.
8.1 Approach to accelerate growth of Exports
The major interventions required for setting-up AEZ in Kerala by integrating various
tasks in a synergistic manner would include:
§ Area expansion under exportable horticultural crops
§ Productivity and quality enhancement measures
§ Development of appropriate post-harvest technology
§ Export promotion
§ Research & Development
§ Logistics
The broad parameters on which interventions have been planned and requirement
of funds estimated have been given in table 61 hereunder:
Table 61 Coverage of area and farmers under the proposed project
Particulars Banana Pineapple Ethnic vegetables
Export targets at the end of 5 t h year (MT/Year)
40,000 fresh 4000 wafers
7,000 fresh 13,000
Production requirement (MT/Year) 60,000 8000 15,000 Expected productivity (MT/ha) 20 16 30 Requirement of area for Mono crop (Ha) 3,000 500 500 Estimated number of farmers under the programme
12,000 2,000 2,000
8.1.1 Area expansion under exportable horticultural crops
The full benefits of better realization on exports can accrue to states’ farmers only
when exporters start sourcing the product from within the state rather than from the
neighbouring states. For achieving this objective area under cultivation for the
identified crops would need to be increased in the districts of Thiruvanthapuram,

AEZ Kerala 68 Cebeco India Private Limited Your Partner in Agri-business
Ernakulam, Kollam, Thrissur, Pathanamthitta, Alappuzha, Kottyam, Idduki and
Palakkad. The farmers need to be convinced about better realization from
exportable crops, so that they increase the area under target crops. Farmers need
to be demonstrated the better economics of mono crops rather than present
practice of mixed cropping. There is need for amendment of land utilization act so
that area under paddy cou ld be shifted to horticultural products without any fear.
Since availability of land is a problem in the state, it is suggested that Government of
Kerala may make available some 500 ha of land in form of plots of 10 ha in the
selected 9 districts for cultivation of horticultural crops in the additional area. The
land may be from existing wasteland, panchayat land or Govt. owned agricultural
farms or Seed production centres. Presently there are 61 farms owned by
department of agriculture in the Kerala, out o f this 44 are in nine districts, identified
as AEZ. These farms are being used as seed and planting material production
centres at present. It was also learn that GOK is incurring losses on maintaining these
farms. The land may be given on long-term lease basis on commercial terms. The
land could be given to progressive farmers, farmers’ SHGs and VFPCK. Exporters’
associations may also be encouraged to take cultivation for exports. Under area
expansion scheme of MoA, there is a provision for Rs 30,000 per ha for Banana and
Pineapple farms. Since an area of 3500 ha for cultivation of these two fruits is
proposed for the purpose of exports exclusively, it is estimated that about 500 ha
can be brought in as additional area for the cultivation of banana and pineapple.
The provision available may be availed as grant; the aggregate grant would work
out to Rs 1.5 crores.
8.1.1.1 Commercial horticulture farm
At present the details of facilities available at each Government farm
recommended to be privatized are not available. For ‘Commercial Horticulture
Farm’ each farm should have an irrigation system, power sprayer, Modern
implements, collection room, plastic crates, a green house in an area of 200 sq.
meters for raising the nursery for the planting material particularly for farms to be
used for the cultivation of vegetables. The budgetary estimate for developing a
farm ad measuring ten hectares under ‘Commercial Horticulture Farm’ is Rs. 10 lacs.
NHB could provide grant of Rs. 2.5 lacs for each farm totaling to Rs. 25 lacs against
submission of bankable reports, which could be developed for specific location.
NABARD could finance these farms on concessional rate of interest. The state should

AEZ Kerala 69 Cebeco India Private Limited Your Partner in Agri-business
strive to set up 50 such farms for cultivation of banana, pineapple and ethnic
vegetable to avail the budgetary allocations. The state could also provide financial
assistance to these farms at the rate of Rs. 20,000 per hectare as applicable under
on going IVDP. This would amount to about 20% contribution by the state on this
activity.
8.1.1.2 Foliage farms (one Central farm and 50 satellite farm)
A number of schemes to promote small/cottage scale floriculture units, in the state
have been introduced with good degree of success. On similar lines small foliage
farms about 50 in number could be set up around a Modern Floriculture Farm
(mother farm) for cultivation of foliage. A central ‘Modern Floriculture Farm’ would
be required to supply planting material to satellite growers, provide them technical
assistance and collect their produce. For establishing a Modern Floriculture Farm
(Mother Farm) in an area of 5 hectare would require an investment of Rs. 70 lacs.
Out of this 20% (Rs. 14 lacs) would be available from NHB as subsidy and NABARD
could finance this project on concessional rate of interest. A provision of Rs. 75,000
towards shade nets (black) and planting material for each unit is kept, which
aggregates to 37.5 lacs. A subsidy of 20% could be availed from NHB. It is
recommended that DOA may also consider a subsidy of 25% to promote this
scheme as cut foliage is going to be a new export oriented product for the state.
The farmers and SHGs could avail the remaining amount as loan from NABARD on
concessional terms.
8.1.2 Productivity and quality enhancement measures
It has been explained earlier in Chapter 5 that even though banana has been a
traditional crop of Kerala, states like Maharashtra, Tamil Nadu & Gujarat; where
banana cultivation in large acreage has started only in 90s; have left Kerala far
behind. This has been due to use of tissue-cultured plants and proper agronomic
practices by the farmers of these states.
The potential for increase in productivity is upto 200%, for crops like Banana, which
can be achieved, in a short period of 3-4 years. Farmers are in a vicious cycle of low
cost, low productivity and low income. They need to be brought out of it. Similarly
good seeds and planting material for other crops need to be popularized.
The farmers should be supplied tissue cultured plants of banana and pineapple of
the desired varieties. Department of Agriculture has set-up one tissue culture lab,

AEZ Kerala 70 Cebeco India Private Limited Your Partner in Agri-business
which could supply these plants. Besides, there are a number of tissue culture labs in
private sector and a few owned by NGOs. Similarly, Kerala Government should
organize production of high quality hybrid seeds at their seed production centers for
the targeted crops and arranges distribution in the selected pockets at
concessional rates.
8.1.2.1 Making available disease-free quality planting material
Government of Kerala through various interventions is try ing to expand area under
cultivation of fruits and vegetables. The DOA has also set-up a Tissue Culture Lab
near Thiruvanthapuram. It is recommended that in each selected district of AEZ, a
modern nursery be set up. These nurseries should also have provision for hardening
the young tissue cultured plants of banana supplied by the tissue culture lab of GUK.
The estimated investment on each nursery (1000 Sq. m.) would be Rs. 20 lacs and a
grant of 25% i.e. Rs 5 lac per nursery would be available from NHB. This would
aggregate to a total investment of Rs 1.8 crore and grant of Rs 45 lacs. The rest may
be provided by GOK or any private entrepreneur could also be brought in.
8.1.2.2 Productivity improvement / rejuvenation
Under the scheme of ministry of agriculture and cooperation there is a provision of
Rs. 5000-7000 per ha on items like; replacement of virus infected plants, - balanced
use of micro nutrients, plant protection equipment and plant protection chemicals.
The provision is subject to maximum of Rs 7000 per ha, this assistance is as total grant.
It should be availed for the entire area to be covered under the project viz. 3500 ha
the grant would aggregate to Rs. 2.45 crores.
8.1.2.3 Assistance for adoption of IPM
To overcome the issue of pesticide residue, the intervention has to start right from
the farm level. The farmers need to adopt integrated pest management approach
supported with the information from the disease forecasting facility; farmers should
be encouraged to adopt IPM. An area of 4000 ha is proposed to be brought under
IPM with the assistance of MOA, which provides Rs. 1,500 per ha as grant, which
works out to Rs. 60 lacs. The R&D institutions in the state like KAU, CTCRI, Pineapple
Research Institute, Banana Research Station shall be requested to recommend
appropriate IPM packages.

AEZ Kerala 71 Cebeco India Private Limited Your Partner in Agri-business
8.1.2.4 Setting-up of laboratory facility for soil, water, leaf and quality analysis
The quality and productivity depends on condition of soil, nutrient availability and
extent of infestation with pests/diseases. In order to find out the deviation from the
optimum and to suggest corrective measures AEZ will have central laboratory
facilities for testing soil, water and leaf tissue. The total cost for establishing such a
facility would be around Rs. 50 lacs of which 25% amount may be obtained from
Ministry of Agriculture (GOI) assistance scheme. DOA could provide the rest of the
amount. For investment in the laboratory even private sector could be invited to run
it and technical assistance of KAU could be availed.
8.1.2.5 Development of Agri Information Centre
Collection, analysis and quick dissemination of market information is very important
for success of the export promotion initiative. Hence, it is proposed to set-up state-
of-art Agriculture Information Centre, which could be managed by DOA or VFPCK.
The centre will maintain information on package of practices for various crops, area
under cultivation, market price, arrivals etc. A network of user-friendly kiosks would
be created which SHGs could use. The centre will be further linked to the wholesale
markets through NHB and international information providers like ITC Geneva. The
center should also be linked be wholesale fruits and vegetable market of Dubai- the
major export destination.
For this an amount of Rs. 15 lacs is envisaged and the same can be obtained as
grant from MOA under the scheme for promotion of information technology.
8.1.2.6 Demonstration and extension services
The ‘Commercial Farms’ recommended in heading 8.1.1 under area expansion
scheme will also act as demonstration farms and can be used for providing
technological guidance to the farmers on all aspects of cultivation and post -
harvest.
The total area under AEZ is expected to be around 4000 ha and there would be
about 16,000 farmers covered under AEZ. It is proposed that about 20% of farmers
viz. 3200 may be covered under the programme and 400 farmers could be trained
and given exposure to modern farming techniques every year. A budgetary support
of Rs. 1,500/- per farmer is provided which would work out to Rs. 48 lacs. This amount
could be availed as 100% grant from NHB/MOA.

AEZ Kerala 72 Cebeco India Private Limited Your Partner in Agri-business
8.1.3 Development of appropriate post-harvest technology
There is urgent need for development of appropriate post-harvest technologies for
extending the shelf life and keeping the quality of commodities good. Some
exporters of perishable commodities were confident that if shelf life of the products
could be extended they would be in a position to increase the exports many times
through use of cheaper marine transport. Appropriate post -harvest infrastructure
needs to be provided. Pack houses, CA/MA cold storage need to be provided.
Existing EU funded markets at Thiruvanthapuram, Ernakulam, Movaputtan could be
used for creating such facilities.
8.1.3.1 Collection /Bulking Centre
For exportable fruits and vegetables, a collect ion / Bulking centre would need to be
set up for a group of farmers / SHGs as a first point for bulking of the produce and
primary processing i.e. grading etc. The existing infrastructure of VFPCK could be
used for this purpose wherever possible. However, in the new identified clusters such
centres will need to be set-up. It is estimated that 10 new such centres would be
needed and cost for each centre is estimated at 15 lacs and the aggregate cost
would be 150 lacs. NHB and APEDA could provide 50% grant. The remaining amount
could come from private investments or VFPCK/DOA.
8.1.3.2 Integrated pack house
By the end of project, a total volume of about 60,000 tons of fruits and vegetables is
expected to be exported in a year. Therefore, 4 integrated pack houses are being
recommended. These could be set-up in the existing EEC markets or food parks. This
would bring down the cost of infrastructure needed and also help in utilization of the
existing facilities. It is estimated that an amount of Rs. 150 lacs would be required for
setting-up each integrated pack house. Out of total requirement of Rs. 600 lacs,
MFPI/NHB could provide 50% of this amount as grant viz. an amount of Rs 3 crores as
grant. The remaining amount would come as a private investment for which
concessional loan could be availed from NABARD.
8.1.3.3 Wafer processing unit
For export markets, it would be desirable to have branded banana wafers,
processed and packed using modern technology. It is suggested that a modern
banana wafer -processing plant may be set-up in the existing pineapple processing

AEZ Kerala 73 Cebeco India Private Limited Your Partner in Agri-business
plant at Muvattupuzha. The investment on this is estimated at Rs. 150 lacs. MFPI
would provide a grant of Rs. 25 lacs for this. Assistance to the extent of 20% of
investment subject to a ceiling of Rs. 25 lacs may also be availed from NHB.
8.1.3.4 Reefer trucks
For movement of fruits and vegetables from collection centres to pack houses and
from pack houses to airport, it would be desirable to transport the highly perishable
fruits and vegetable in reefer trucks to maintain good quality. It is suggested that 10
reefer trucks costing Rs. 120 lacs may be provided. APEDA can provide a subsidy of
Rs 50 lacs on this item.
8.1.3.5 Quality Systems Implementation
Quality systems like HACCP and ISO should be implemented atleast at four locations
i.e. one each in the three proposed integrated pack houses and one in the Banana
wafer-processing unit. For implementation of quality systems and post-harvest
practices at 4 locations, a provision of Rs. 8 lacs is being kept. Out of which, an
amount of Rs.4 lacs can be obtained as a grant from APEDA.
8.1.3.6 Trial consignment in MA Container
MOA would organize development of protocols for transporting fruits, vegetables
and cut foliage through MA containers. It is proposed that APEDA may finance
dispatch of 2 trial containers to Gulf Countries and 2 to European markets. The cost
towards this is estimated at Rs. 12 lacs (Rs. 3 lacs/container), which may be provided
by APEDA as 100% grant.
8.1.3.7 Development of packaging
Suitable packaging material needs to be developed for fresh fruits and vegetable.
Similarly banana wafers would also require good quality packaging material which
can give it long shelf life. Some research work would also need to be under taken
on other aspects of packaging like vacuum packaging, Nitrogen flushing, skin
wrapping etc. for enhancement of shelf life and preservation of quality. It is
suggested that the services of Indian institute of packaging may be availed for the
desired work on packaging material and techniques. A provision of Rs. 10 lac is
being made for this and this amount is to be paid as grant by APEDA.

AEZ Kerala 74 Cebeco India Private Limited Your Partner in Agri-business
8.1.4 Export Promotion
Kerala also has advantage of having a good base of loyal Consumers in gulf market
that has preference for produce of Kerala. For further strengthening of exports
following steps would be needed:
§ Understanding international competitiveness of identified products and Kerala’s strengths.
§ Understanding of the international standards of product and packaging. § Building-up a market information system.
8.1.4.1 Understanding India’s Competitiveness
After implementation of WTO, the trade barriers are gradually being removed.
Therefore, the least cost producers will have an advantage in the international
trade. The exporters should identify the major competitors in the target market and
do a detailed comparative analysis of the competing countries’ products in terms of
product quality, packaging, productivity, cost of production, availability period etc.
and ascertain India’s competitiveness. For this purpose, a detailed market survey will
need to be undertaken in the major export destination. Since some European
countries have started showing interest in products like Drumsticks, Yam and
vegetables. Further, a large proportion of cut foliage would be sold in European
countries, therefore, a detailed market study be undertaken in these markets. A
provision of Rs. 15 lacs is being made for this activity. APEDA may provide this
amount as total grant.
8.1.4.2 Understanding international standards of product and packaging
The increased levels of consumer awareness the quality aspects have assumed a
great importance. The laws related to products packaging quality in the export
market need to be studied in details. Issues like residual levels of insecticide &
pesticides are very important, as the same would need to be handled at farmers’
level. Similarly, issues related to packaging material, mandatory information on
packages need to be understood. For this activity, a team of exporters could
participate in important exhibitions, conferences etc. in foreign countries. It is
recommended that 5 persons per year for 3 years may participate in such
exhibitions. The total expenses towards this would be Rs. 45 lacs, out of which APEDA
may provide grant for 50% amount. The remaining amount would be borne by the
exporters who wish to visit the foreign countries.

AEZ Kerala 75 Cebeco India Private Limited Your Partner in Agri-business
8.1.5 Research and Development (R&D)
For the various issues highlighted above, the R&D institutes in the state; like KAU,
CTCRI, Banana Research Station and Pineapple Research Institute would work out
details of the research work to be undertaken along with the requirements of funds
for the same. At this stage no budgetary allocation being provided. For this activity,
financial assistance may be obtained from CSRI, CSIR, MFPI, NHB and APEDA. The
priority of research should be decided in consultation with the farmers and
exporters. No budgetary provision is being made at this stage.
8.1.6 Other support measures
For successful implementation of AEZ, apart from the financial support of Central
Government Agencies, the GOK and its various departments would also be required
to take some policy decisions, earmark some additional resources and depute a
dedicated team of officers. Some of the activities are:
§ Integration of various on going horticulture developmental activities, in the state.
§ Financial support to VFPCK for undertaking activities for organizing farmer’s SHGs
etc. in areas identified under AEZ.
§ Making available Government land for hi-tech cultivation by farmers
SHGs/VFPCK, Exporters’ Associations etc. on long-term commercial lease basis.
§ Arrange uninterrupted power supply to cold storages, pack houses and general
improvement in power supply to farmers in AEZ through KEB.
§ To provide budgetary support to Central Lab and Nursery till these are self-
sustainable.
§ To develop a mechanism by which part of EEC markets is handed over to service
providers for setting up pack houses.
§ Making available land for setting-up collection / bulking centres., for exportable
fruits and vegetables.
§ To create a special cell comprising of at lea st 3 senior officers with support staff
for implementation of AEZ.
§ Repealing of Land Utilization Act to enable faster conversion of land under
Paddy to Horticultural Crops.
§ To create an enabling environment suitable steps for motivation of farmers
(better availability of inputs, crop insurance, credit etc.), exporters and to attract
fresh investments from entrepreneurs.

AEZ Kerala 76 Cebeco India Private Limited Your Partner in Agri-business
The major cost to be borne by state would include expenses on creation of ‘Special
Cell’ for implementation of AEZ. The costs estimated are:
Salaries of 3 officers : Rs. 10 lacs / year
Support staff : Rs. 2 lacs / year
Office expenses : Rs. 2 lacs / year
Travel etc. : Rs. 2 lacs / year
Miscellaneous : Rs. 1 lacs / year ------------------------- Total : Rs. 17 lacs / year
The expanses d uring project period would be Rs. 85 lacs. Strengthening of extension
activities for project period would be Rs. 50 lacs. Support to VFPCK would also need
to be provided by GOK for strengthening its activities in the AEZ for which a provision
of Rs one crore has been kept.
The summary of the project cost and expected assistance from various agencies
associated with the project is given on next page.
8.2 Funding Mechanism
The total cost of various activities under the AEZ is estimated at Rs. 18.58 crores, of
which Rs. 7.79 crores can be financed through the existing schemes of various
Government departments (central and state level). Based on this there would be a
gap of Rs. 10.79 crores for which, besides attracting private sector investment, the
various st ate organizations like VFPCK may also consider making special
concessions/ provisions under their existing schemes.
Funds requirement at a glance is presented in table 62:

AEZ Kerala Cebeco India Private limited. Your partner in Agri -Business
77
Table 62 Project cost and sources of funds
S.No. Particulars No. / Capacity
Cost per unit (in Rs. lacs)
Total Cost (in Rs. lacs)
Govt. Organization
Support Assistance Amount (in Rs. lacs)
Private Sector Investment (in Rs.
lacs) 1. Area expansion under exportable horticultural crops
§ Additional area under Banana and Pineapple § Commercial Horticulture Farms § Modern Floriculture farm § Foliage satellite Farms
500 ha 50 of 10 ha
each 1 of 5 ha
50 of 02 ha each
0.3 10 70
0.75
150 500 70
37.50
MoA NHB NHB
NHB/DOA
150 125 14
16.9
-
375 56
20.6
2. Production and quality enhancement programme § District level for planting material § Productivity improvement/rejuvenation § Assistance for adoption of IPM § Central Lab § Development of Agri-information System Demonstration and extension services § Time and method of planting § Planting Density § Integrated Pest Management § Fertilizer Practices Salaries of § Horticulture Expert § IPM Expert §
9
3500 ha 4000 ha
1 1
3200 farmers
1 for 3 years 1 for 3 years
20
@Rs.7000/ha @Rs.1500/ha
50 15
Rs. 1,500
3 3
180 245 60 50 15
48
9 9
MOA MOA
MOA & NHB MOA MOA
MOA
DOA DOA
45
245 60
12.5 15
48
9 9
135
- -
37.5 - - - -
3. Post-Harvest Management § Collection / Bulking Centres § Integrated Pack Houses with cold storages § Wafer Processing Unit § Reefer Trucks § Quality Systems Implementation § Trial Consignments in M.A. Containers § Development of packaging
10 4 1
10 4 location
4
15
150 150 12 2 3 10
150 600 150 120
8 12 10
NHB /APEDA NHB/MFPI NHB/MFPI
APEDA APEDA APEDA APEDA
75
300 50 50 8 12 10
75
300 100 70 - - -
4. Export Promotion § Market Surveys § Participation in International Exhibitions
1 survey in
Gulf 5 lessons per year for 3 yr.
15 3
15 45
APEDA APEDA
15
22.5
-
22.5
5. R&D Project

AEZ Kerala Cebeco India Private limited. Your partner in Agri -Business
78
S.No. Particulars No. / Capacity
Cost per unit (in Rs. lacs)
Total Cost (in Rs. lacs)
Govt. Organization
Support Assistance Amount (in Rs. lacs)
Private Sector Investment (in Rs.
lacs) § Maturity indices standardization for sea & air
shipping § Development of protocols for banana &
pineapple for sea shipping § High yielding varieties of vegetables § In view of mixed cropping, recommendation on
best combination of crops and agronomic practices
§ Development of protocols for tissue culture plants for ethnic banana varieties and pineapple
§ IPM Packages for various selected crops
As per requirements
Cost to be estimated by
the concerned
R&D Institution
MFPI APEDA/NHB
CSIR
6 Project implementation and support by GOK § Pre project expenses § Expenses of special cell for AEZ § Strengthening of extension activities § Support to VFPCK
A team of 3 officers for 5
years in identified
clusters organizing
new SHGs in identified
clusters
25 85 50
100
DOA DOA DOA DOA
25 85 50
100
- - -
TOTAL
2743.5 1551.9 1191.6
Say Rs. 27.44 crores

AEZ Kerala Cebeco India Private Limited Your Partner in Agri -business
79
Out of total investments expected for implementation of AEZ in Kerala the central
agencies are expected to contribute about 43% almost matching amount is
expected to be brought in by the private entrepreneurs. The rest, about 15% would
be contributed by the Government of Kerala. The details are given in the table 63:
Table 63 Summary of source wise funds requirement
Source
Rs. lacs % contribution Central Agencies (APEDA/NHB/MFPI/MOA) 1265 46 DOA (GOK) 287 11 Private Investments 1192 43 Total 2744 100
*GOK will also make available required portions of existing EU markets to be
converted to integrated pack houses and the valuation of the same has not been
done.
The year wise allocation of funds by different agencies is given in the table 64.
Table 64 Estimated phasing of funds (Rs. in Lacs)
Years Source 0 1 2 3 4 5 T otal
Central agencies 254 342 519 100 50 1265 DOA (GOK) 25 43 80 89 25 25 287 Private Investment 238 368 436 100 50 1192 Total 25 535 790 1044 225 125 2744
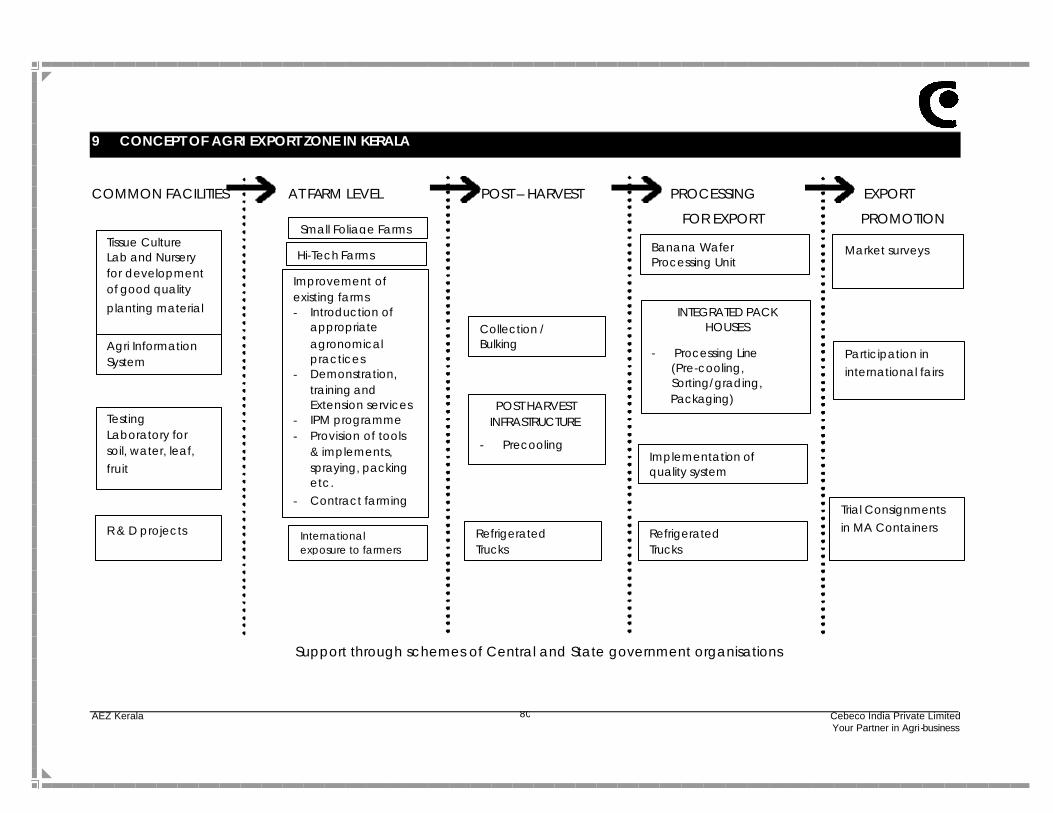
AEZ Kerala Cebeco India Private Limited Your Partner in Agri-business
80
9 CONCEPT OF AGRI EXPORT ZONE IN KERALA
COMMON FACILITIES AT FARM LEVEL POST – HARVEST PROCESSING EXPORT
FOR EXPORT PROMOTION
Support through schemes of Central and State government organisations
POST HARVEST INFRASTRUCTURE
- Precooling
INTEGRATED PACK HOUSES
- Processing Line (Pre-cooling, Sorting/grading, Packaging)
Tissue Culture Lab and Nursery for development of good quality planting material
Testing Laboratory for soil, water, leaf, fruit
Agri Information System
Collection / Bulking Centres
Improvement of existing farms - Introduction of
appropriate agronomical practices
- Demonstration, training and Extension services
- IPM programme - Provision of tools
& implements, spraying, packing etc.
- Contract farming
International exposure to farmers
Market surveys
Participation in international fairs
Implementation of quality system
R & D projects
Hi-Tech Farms
Small Foliage Farms
Refrigerated Trucks
Banana Wafer Processing Unit
Refrigerated Trucks
Trial Consignments in MA Containers

AEZ Kerala Cebeco India Private Limited Your Partner in Agri -business
81
9.1 Plan of Action, Deadlines and Administrative Structure The establishment of the Agri Export Zone in Kerala will be undertaken in following
phases:
Phase I Approvals and AEZ creation phase (0 to 5 months)
Activity 1 § State will designate nodal agency for Agri Export Zone –within 15 days of the
acceptance of the report
§ Getting commitment of various state Govt. departments and signing MOU for
allocation of resources – within two months
- The nodal agency will coordinate with various organizations and enter into
MOU with the concerned departments for financial grants, time frame and
implementation of designated activities.
- Concession Agreement/memorandum to be entered into with various
exporters, processors and service providers which will facilitate single window
clearance of various activities.
- Submission of proposal to APEDA
§ Receipt of proposal by APEDA, which will process the same and forward it to
steering committee for ;
- Approval of proposal
- Declaration of proposed area as Agri Export Zone
This activity will be completed within a month on receipt of proposal from
state nodal agency
§ APEDA to get approval from MOC and in principle commitment from central
agencies towards described role for implementation of AEZ – this activity is likely
to be completed within 45 days of the receipt of proposal from the state nodal
agency
§ APEDA will prepare proforma for collection of information of various activities
and information systems for monitoring/review of the progress of implementation.
- to be completed within 15 days of the approval by steering committee.

AEZ Kerala Cebeco India Private Limited Your Partner in Agri -business
82
Activity 2
§ The nodal agency will dedicate a team which will;
- Carry out survey to firm up the area and selection of farmers to be associated
with AEZ developmental activities
- Identification of Govt. land/farms which could be leased out for cultivation.
- Completion of formality for handing over of part/full EEC market for survice
providers/exporters of pack houses.
- Start discussion with exporter/processors, growers about the agri export zone.
These activities will be completed within 3 months
§ Preparation of proposals for the following activities;
- DPR for Banana processing unit – within three months of the approval from
APEDA
- DPR for Hi Tech farms within three months of the approval from APEDA.
- DPR for ‘Modern Floriculture Park’ and satellite farms.
- DPR for post harvest facilities – within three months of the approval from
APEDA
- Preparation of NIT inviting entrepreneurs to make investment in High Tech
farms and post harvest infrastructure – within a month from the preparation of
feasibility reports
Activity 3
§ Selection of entrepreneurs for various facilities – to be completed in a period of
three months from the completion of activity 2.
§ Concerned department in consultation with nodal agency will firm up and start
development work – the work to start within one month of the approval of
APEDA
§ Initiation of demonstration/training and product/quality improvement
programme - the work to start within one month of the approval of APEDA
Phase 2 Project implementation phase (Year 1 onward)
This phase describes the scheduling of various activities envisaged to achieve export
targets. Some of these activities will start at the outset. Schedule is presented in the
enclosed pert chart.

AEZ Kerala Cebeco India Private Limited Your Partner in Agri-business
83
Pert Chart 1 Project Implementation Activity List 1 2 3 4 5 6 7 8 9 10 11 12 13 14 Activity 1 Designation of Nodal Agency Getting commitments of state govt. and signing MOU for resource allocation § Entering into MOU for
Financial grant § Concessional agreement
with exporters, processors and service providers
§ Submission of proposal to APEDA
Receipt of proposal by APEDA Approval from MOC and commitment from central agencies towards described role for implementation of AEZ
Preparation of Performa by APEDA for information collection
Activity 2 Dedication of a team by nodal agency § For survey for selection of
farmers and area § Identification of Govt. land
for leased cultivation § Handing over of EEC market
for survice providers/operators of pack houses
§ Discussion with exporter, processor and growers

AEZ Kerala Cebeco India Private Limited Your Partner in Agri-business
84
Preparation of proposals and DPR
§ Preparation of proposals
§ DPR for Banana processing unit
§ DPR for ‘Hi Tech farms’ within three months of approval from APEDA
§ DPR of Modern Floriculture Park and satellite farmers
§ DPR Post harvest facilities
Preparation of NIT
Activity 3 Selection of entrepreneurs Start development work with concern department
Initiation of demonstration/training and productivity/quality improvement program
Phase 2 Scheduling of various activities tp achieve export targets

AEZ Kerala Cebeco India Private Limited Your Partner in Agri-business
85
Pert Chart 2 Development of Organisation and Systems Activity List
1 2 3 4 5 6 7 8 9 10 11 12 13 14
Decision on organisation setup
Appointment of Directors
Appointment of team by Mandi Parishad & interim management
Familiarization to the concept
Selection of key personnel
Formulation of consultative committee
Setting up of farmers interest groups/assoc.
Training of key executives
Selection of supervisory & field staff
Setting up of the software system for MIS
System for dissemination of the information
Procurement & wholesale operations
Full scale operations


AEZ Kerala 87 Cebeco India Private Limited Your Partner in Agri -business
9.2 Agencies involved in state level A number of states PSUs/Departments/organizations are engaged in development
of horticulture in the state, a brief description about their roles is given in Chapter 4.
It is suggested that the state dep artment of agriculture should act as an
implementation agency for setting-up of Agri Export Zone in Kerala. The department
should form a special cell consisting of a multidisciplinary team for co-coordinating
the activities of various associated organisations, central as well as state, with
respect to the assigned roles.
However, apart from taking the responsibility of monitoring the activities of other
agencies involved, the department of agriculture would need to take certain
specific actions itself.
9.2.1 Department of agriculture
§ To act as a nodal agency for the implementation of AEZ
§ Search entrepreneurs/agencies for operating common facilities like integrated
pack house, markets, central laboratory, nursery etc.
§ To set-up a disease forecasting system
§ To set-up agri- information center for collection and quick dissemination of
market information.
§ Strengthening of extension activities in the selected blocks by deploying extra
staff and organizing more demonstration farms etc.
§ Higher outlay for ‘vegetable Growers Sangams’ in selected districts and inclusion
of fruit and foliage growers also in this scheme.
§ Makes available quality planting material / seeds through its tissue culture lab,
Nursery seed farms etc.
§ Set-up state-of-art laboratory (crop-related tests l ike soil, water leaf analysis etc.)
at a central location.
§ Help the farmers and exporters to bench mark against international standards by
way of meeting with experts/scientists, visits to developed states/other country
participation in exhibitions etc.
§ Dovetailing of various state & central schemes and to ensure quick disbursement
to eligible farmers.

AEZ Kerala 88 Cebeco India Private Limited Your Partner in Agri -business
§ Development of irrigation resources. Allocate funds to other designated
agencies of the state.
§ Create a reliable system for database on area under production, quantities
produced for each horticultural crop
§ To promote investments in horticulture assist farmers in obtaining crop loans.
§ Take up issue with the National Insurance companies to include targeted crops
under crop insurance policy and share part payment of the premium in initial
years.
§ Handover EEC markets in the AEZ to private service providers on a long-term
basis.
§ Repeal land utilization act to legally promote shift in area under paddy to
horticulture crops.
9.2.2 VFPCK VFPCK formerly known as KHDP has successfully demonstrated organizing SHGs of
vegetable growers, providing them technical inputs and arranging sale of their
produce in a very transparent manner. It is suggested that in view of VFPCK’s
existing network and experience, it should be given larger responsibilities. The
specific roles envisaged for VFPCK are:
§ Extending its activities in all the districts proposed to be covered under Agri
Export Zone
§ Including cut foliage for exports in its product range.
§ Identification of pockets more suited for cultivation of export-oriented crops.
§ Identification of SHGs of progressive farmers keen on growing fruits and
vegetables and arranging special training for them as well as helping them by
arranging inputs like good planting material/seeds, fertilizers,
insecticides/pesticides etc. apart from credit.
§ Upgrading existing bulking center or setting-up new bulking centers at strategic
locations. These Centres should have post-harvest facilities required for exports.
§ Acting an interface between growers SHGs and exporters. Developing systems
on contract farming, benchmarking of quality, pricing methods etc. to ensure
fair price to farmers and suppliers of export worthy products.
§ Development of market information system with linkages among all major
markets.

AEZ Kerala 89 Cebeco India Private Limited Your Partner in Agri -business
9.2.3 Kerala Agro Industries Corporation
KAIC could take up the responsibility of strengthening Agro Service Centres in the
identified pockets, facilitating mechanization of the proposed ‘High Tech farms’.
9.2.4 Kerala State Electricity Board KSEB could play an important role in promoting agro-exports from the state. It should
supply uninterrupted power to the post -harvest facilities and pack houses.
The processing/harvesting facilities centres set up AEZ. The unit would be eligible to
avail duty free diesel for power generation as per Exim Policy. KESB may accord
permission to the units to generate their own electricity so as to avail duty
concession on diesel. Large farms to be set-up under Hi-tech horticulture should be
supplied regular power to ensure timely irrigation and other operations at the farm.
9.2.5 Department of Sales Tax The suppliers of packaging material and other inputs in the AEZ may be given sales
tax exemption.
9.2.6 Kerala Agricultural University
KAU can play very important role in promoting export of horticultural produce. It
should focus on research on market needs (exports) rather than academic
research.
The specific task in this regard should be:
§ Development of high yielding varieties of the identified crops.
§ Standardization of Agronomic practices.
§ Organizing farmer’s fairs, conference etc.
§ Development of post-harvest practices for increasing shelf life.
§ Organizing demonstration farms in land owned by KAU.
9.2.7 State level Financial Institutions and Banks
The financial institutions like ICICI, IDBI, SIDBI, Nationalized Banks (lead banks in
particular), rural & cooperative banks, NABARD etc. should be sensitized to credit
needs of the farmers and enterprises engaged in post -harvest, exports etc. The
activity being agriculture and export oriented should need priority lending at
concessional terms.

AEZ Kerala 90 Cebeco India Private Limited Your Partner in Agri -business
9.2.8 Central Tuber Crops Research Institute
The Central Tuber Crops Research Institute near Thiruvanthapuram is one of the
world’s leading research institutes for carrying out research work exclusively on
tropical tuber crops. The institute has done work on production technology, post -
harvest and processing of tuber crops. The specific tasks, which CTRI should be
entrusted with are:
§ Productivity enhancement through development of new verities and agronomic
practices.
§ Making available planting material for further multiplication and distribution to
farmers.
§ Dissemination of information on harvesting methods and post-harvest practices
§ Organizing Demonstration Farms, training of farmers.
9.2.9 Pineapple Research Centre
The pineapple research center at Muvattupuzha is engaged in cultivation aspects
of pineapple, development of tissue-cultured plants, development of new varieties
etc. The specific tasks assigned to this should include:
§ Development of high yielding varieties for table purp ose.
§ Development of agronomic practices for various crop combinations (pineapple
as on inter-crop in plantations).
§ Supply of disease free and quality tissue-cultured plantlets of pineapple.
9.2.10 Banana Research Station
Banana Research Station, Kannure, near Thrissur is engaged in R&D on various
aspects of banana cultivation and post -harvest management.
In view of extremely low level of productivity of banana, the focus of research
should be on productivity enhancement. The specific role of this institute would be:
§ Commercialization of tissue cultured plants for tradition varieties of banana in the state.
§ Standardization of package of practices. § Trials on suitable inter-crops for banana at different locations. § Improvement in production technology. § Cultivation of exotic varieties for exports markets. § Trials on post -harvest practices to increase shelf life so that Banana could be
exported through marine transportation, which is economical.

AEZ Kerala 91 Cebeco India Private Limited Your Partner in Agri -business
9.2.11 R&D on post harvest management of pineapple
It is felt that the exporters of horticultural produce (Fresh) should form a single state
level organization and actively participate in implementation of Agri Export Zone.
9.3 Agencies involved - Central Government
9.3.1 Agricultural and Processed Food Products Development Authority (APEDA) APEDA will be the nodal organisation to co-ordinate programmes of various Central
organizations, obtaining approval of the Steering Committee and monitoring the
implementation and putting up review reports to the Steering Committee.
In addition to a nodal agency role, APEDA will also extend assistance under various
schemes.
9.3.1.1 Specific responsibilities for Agri Export Zone
§ Market development/promotion support by way of market survey, participation
in international exhibitions, publicity (generic, printed material)
§ Support for setting up / upgradation of quality assurance systems (HACCP,
laboratory subsidy)
§ Freight subsidy for export
§ Provide support for purchase of pre cooling equipment and reefer trucks.
9.3.2 Department of Food Processing Industries (DFPI)
Assistance available to processing units such as grant- in-aid on capital investment
may be extended to the units in AEZ. Various support programmes of the DFPI will
be:
§ Support for contract farming
§ Grant in aid and equity participation in post harvest facilities and pack house
unit(s)
§ Financial assistance to AEZ
9.3.2.1 Specific responsibilities for Agri Export Zone
§ Provide grant and support for the Agri Export Zone
§ Provide support for setting up the contract farming system

AEZ Kerala 92 Cebeco India Private Limited Your Partner in Agri -business
9.3.3 National Horticulture Board
National Horticulture Board has a number of assistance schemes to support various
developmental programmes. Some of the relevant assistance schemes as
described below may be made available to the units in AEZ. § Support to research institutions for R&D projects
§ Extend scheme for integrated cultivation
9.3.3.1 Specific responsibilities for Agri Export Zone
§ Overseas training of farmers for giving them insight into international production
and handling practices
§ Market information on prices and arrivals in important markets of the country
may be made available to the AEZ.
§ Support R & D - Extend support to MAU. MAU to prepare specific projects and
submit the same to NHB, for approval.
9.3.4 Ministry of Commerce
§ Extend benefits of other schemes to all units/facilities set up within the AEZ
(EPCG, Export House).
§ Provide market development support through grant available under the
account Market Access Intervention Fund.
9.3.5 NCDC
Support for setting up farmers’ co-operatives for group activities including joint
purchase of inputs, setting up collection centres etc.
9.3.6 Indian Institute of Packaging § Development of packaging material for fresh & processed products
§ To set up a field station for testing of packaging material
9.3.6.1 Specific responsibilities for Agri Export Zone
§ To develop export worthy and accep table packaging for exports of fresh
Mangoes by sea.

AEZ Kerala 93 Cebeco India Private Limited Your Partner in Agri -business
10 SOCIO-ECONOMIC BENEF ITS
The investments on the desired interventions in the proposed AEZ in Kerala will be
developmental in nature. There would definitely be a discernible increase in the
export volumes and earnings, incomes of farmers and others related with the trade,
increased employment etc. Besides economic benefits, there would be many social
benefits like farmers’ adoption of other innovations and technology for
improvement in quality of life. It may not be possible to quantity such benefits since
the qualitative aspects can be felt, only.
Some of the benefits, which the project would accrue, are given here under:
10.1 Increased exports and benefits to exporters The interventions are specifically targeted at increasing exports. The interventions
are expected to increase India’s export earnings by Rs. 40 crores per year during 5th
year of project. The table 65 shows the year wise incremental value of exports and
the additional financial benefits, which the exporters are likely to have.
Table 65 Increase in exports & benefits to exporters (Rs. in crores)
Year S. No.
Particulars 0 1 2 3 4 5
1 Exports without interventions 6 0 6 6 72.6 79.86 87.85 96.63 2 Exports with interventions 6 0 6 6 8 1 9 7 116 140 3 Incremental exports 0 0 8.4 17.14 28.15 43.37 4 Profits to exporters 0 0 0.84 1.71 2.81 4.33
10.2 Profits to farmers from production enhancements The present level of productivity of banana, pineapple, tapioca and vegetables is
quite low and potential for productivity gain is upto 200 % for some crops. Even if
farmers achieve 25% increase in the productivity there will be tremendous benefits
to farmers in the clusters identified for nursing. The farmers in the nearby areas would
also get the benefits due to induction effect. With use of modern technology, profits
from other crops will also increase.
10.3 Reduction in handling losses
With R&D efforts in developing new post -harvest technology and setting-up of post-
harvest infrastructure like CA storage, pack houses etc., the handling losses will
reduce and due to improvement in quality of the product even price realization
may increase. Even if there were reduction in handling losses equivalent to 10%

AEZ Kerala 94 Cebeco India Private Limited Your Partner in Agri -business
quantity of the exported fruits & vegetables, its value would be around Rs. one crore
per annum in the fifth year of the project and will continue to grow. However for
calculation of economic rate of return (ERR) this benefit has not been consider.
10.4 Creation of employment Setting-up of CA Storage, pack houses, banana wafer processing plant and allied
activities would create additional employment in the state. Establishing of
‘Commercial Horticulture Farms. Foliage farms etc would create additional full
time/part time jobs in the rural areas of the state. Some job would also be created
in packaging industry. It is expected that about 450 new jobs would be created.
10.5 Income from EEC markets
Hitherto unutilized / underutilized EEC aided markets would be utilized for post-
harvest activities which will generate some income for the state.
10.6 The proposed soil & leaf analysis centre The proposed soil & leaf analysis centre, central nursery, banana wafer processing
units are proposed to run as independent profit centres after initial budgetary
support. These units are expected to generate modest profits after a gestation
period of 3-4 years.
10.7 Export of value added products
The export of value added products like banana wafers would bring additional
export realization.
10.8 Benefits from ‘Commercial Horti culture farms’
At present the GOK is not having any profit from the government owned/PSUs
owned farms; rather budgetary support is needed every year. The privatization of
farms will result in the savings of this support besides private owners will generate
some profits as well as additional job would be created in rural areas.
10.9 Cost Benefit of the project
From quantification of some benefits as explained in the foregoing paragraphs, it is
clear that the investments in the AEZ Kerala will bring in good economic returns. The
year wise projected benefits have been summarized in the table 66.

AEZ Kerala 95 Cebeco India Private Limited Your Partner in Agri -business
Table 66Summary of various economic benefits of the project (Volume in 1000MT, value in Rs. Crore)
Years S. No.
Particulars 0 1 2 3 4 5
1 Projected Volume of Exports without project (’000MT) 30.00 33.00 36.30 39.93 43.92 48.32
2 Estimated Value Rs crores 60.00 66.00 72.60 79.86 87.85 96.63
3 Projected Volume after project 30.00 33.00 39.60 47.52 57.02 68.43
4 Estimated value Rs crores 60.00 66.00 81.00 97.00 116.00 140.00 5 Incremental Export(value) 0.00 0.00 8.40 17.14 28.15 43.37 6 Estimated incremental profits 0.00 0.00 0.84 1.71 2.82 4.34 7 Increase in productivity 0.00 0.00 4.86 5.82 6.96 8.40
The project will have very attractive economic returns beside creation of additional
employment and positive qualitative changes in the life style of farmers. The Key
indicators of the economic return of the project are:
Economic rate of return = 37 %
Net Present value (NPV) = Rs 29 crores
Cost Benefits ratio = 2.4
The detail working of above indicators is given in Annex 3.
5 Value of estimated incremental exports(4 – 2)6 Profits on exports assumed at the rate of 10%
of export value. 7 Productivity increase assumed at 20% valued
at 30% of average export realization.
1. Existing level of exports projected at present growth rate of 10% PA
2 Estimated value of exports projected at current prices.
3. After intervention growth in exports assumed 20% PA.
4. Estimated value of exports projected at current
prices.