1 Introduction to medical survival analysis John Pearson Biostatistics consultant University of...
49
1 Introduction to medical survival analysis John Pearson Biostatistics consultant University of Otago Canterbury 7 October 2008
-
Upload
joshua-williams -
Category
Documents
-
view
220 -
download
0
Transcript of 1 Introduction to medical survival analysis John Pearson Biostatistics consultant University of...
1
Introduction to medical survival analysis
John PearsonBiostatistics consultantUniversity of Otago Canterbury7 October 2008

2
Objectives
• Describe survival data
• Define survival analysis terms
• Compare survival of groups
• Describe study design
Acknowledgement:Thanks to Colm Fahy for providing the example data.
3
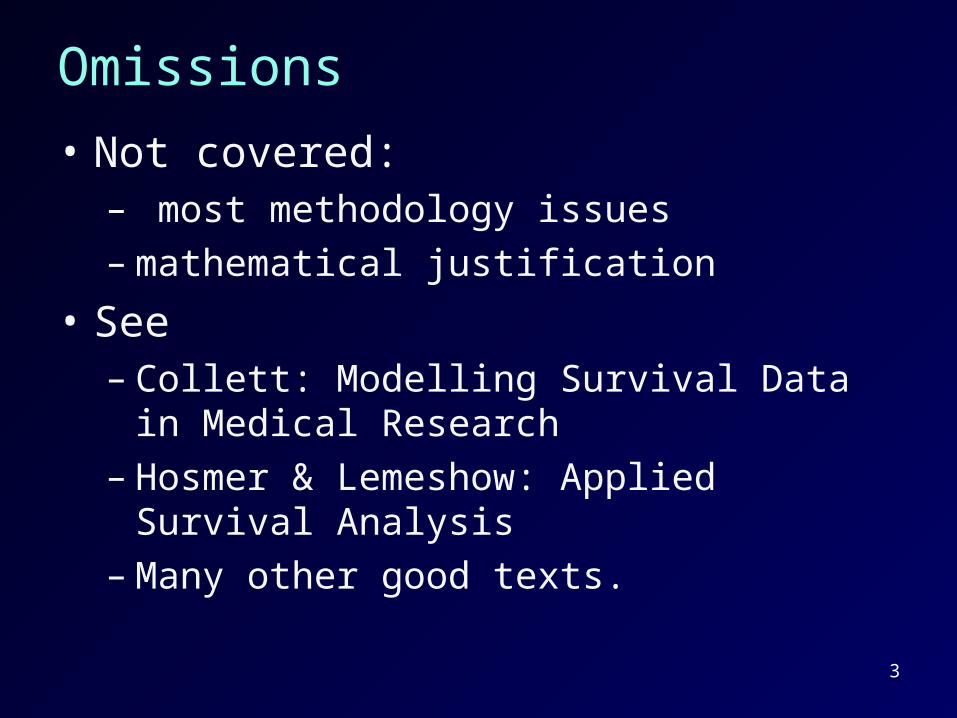
Omissions
• Not covered:– most methodology issues– mathematical justification
• See– Collett: Modelling Survival Data in Medical
Research– Hosmer & Lemeshow: Applied Survival
Analysis– Many other good texts.
4
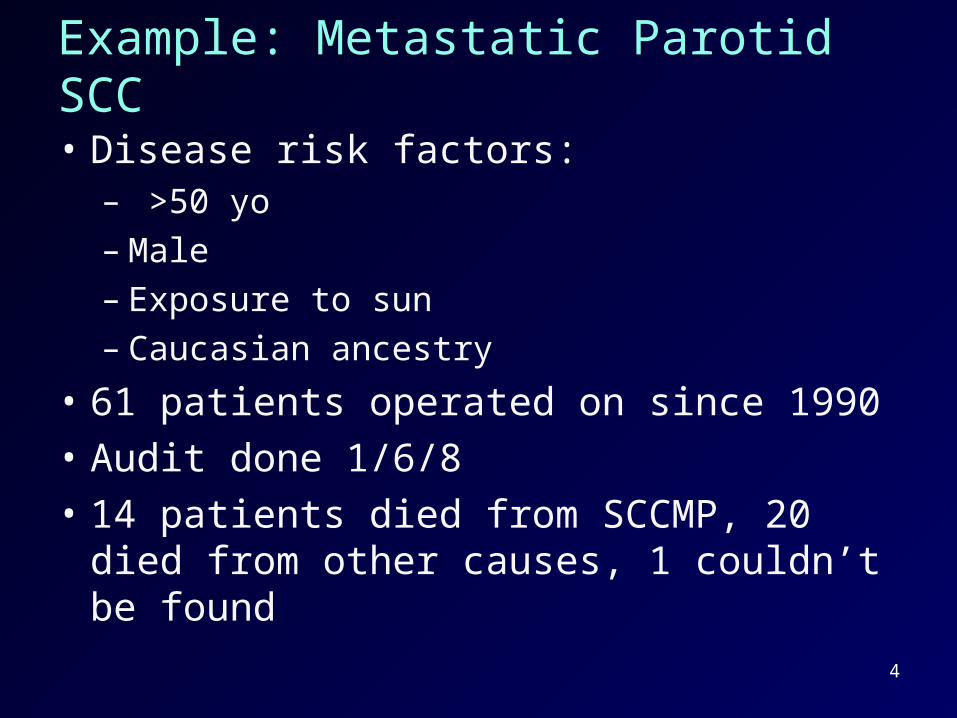
Example: Metastatic Parotid SCC
• Disease risk factors:– >50 yo– Male– Exposure to sun– Caucasian ancestry
• 61 patients operated on since 1990
• Audit done 1/6/8
• 14 patients died from SCCMP, 20 died from other causes, 1 couldn’t be found
5
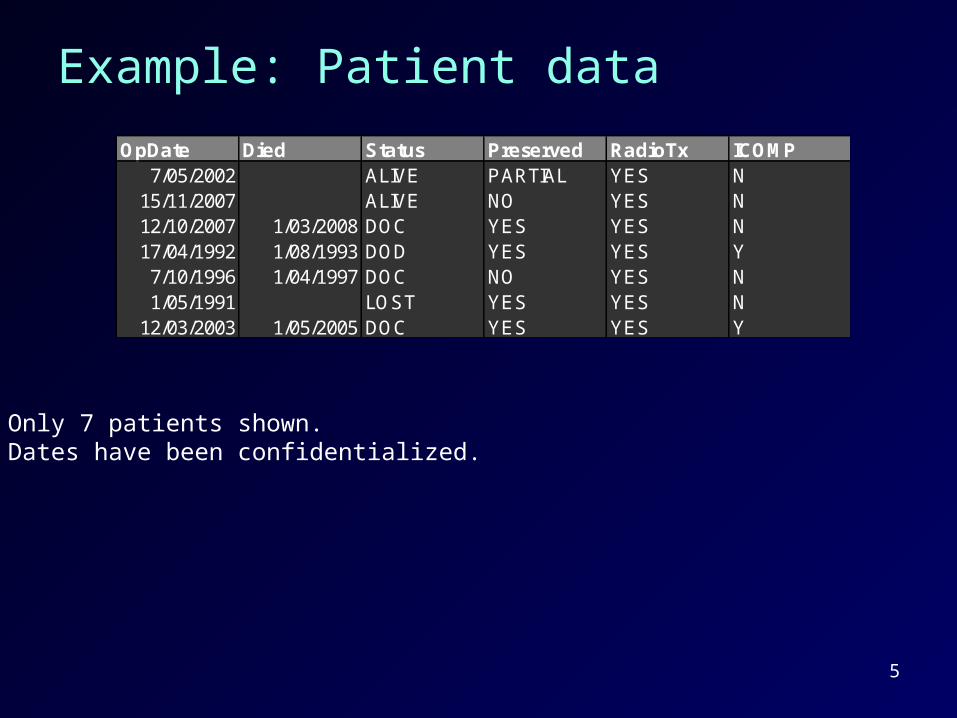
Example: Patient data
OpDate Died Status Preserved RadioTx ICOMP7/05/2002 ALIVE PARTIAL YES N
15/11/2007 ALIVE NO YES N12/10/2007 1/03/2008 DOC YES YES N17/04/1992 1/08/1993 DOD YES YES Y7/10/1996 1/04/1997 DOC NO YES N1/05/1991 LOST YES YES N
12/03/2003 1/05/2005 DOC YES YES Y
Only 7 patients shown.Dates have been confidentialized.
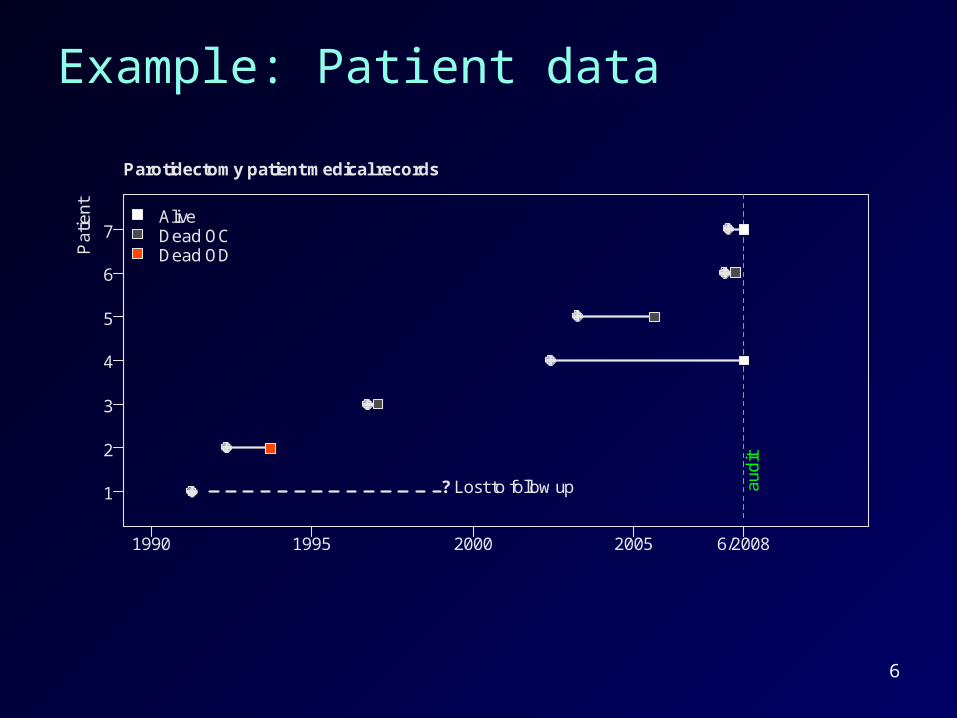
6
Example: Patient data
1
2
3
4
5
6
7
1990 1995 2000 2005 6/2008
Parotidectomy patient medical records
Pa
tien
t
AliveDead OCDead OD
? Lost to follow up au
dit
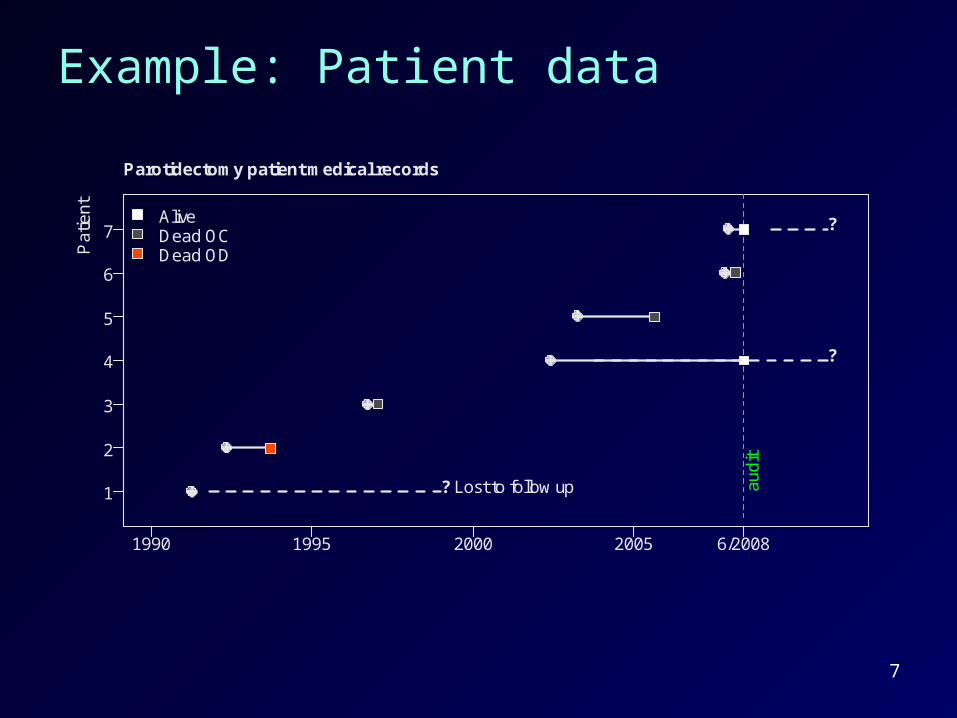
7
Example: Patient data
1
2
3
4
5
6
7
1990 1995 2000 2005 6/2008
Parotidectomy patient medical records
Pa
tien
t
AliveDead OCDead OD
? Lost to follow up au
dit
?
?
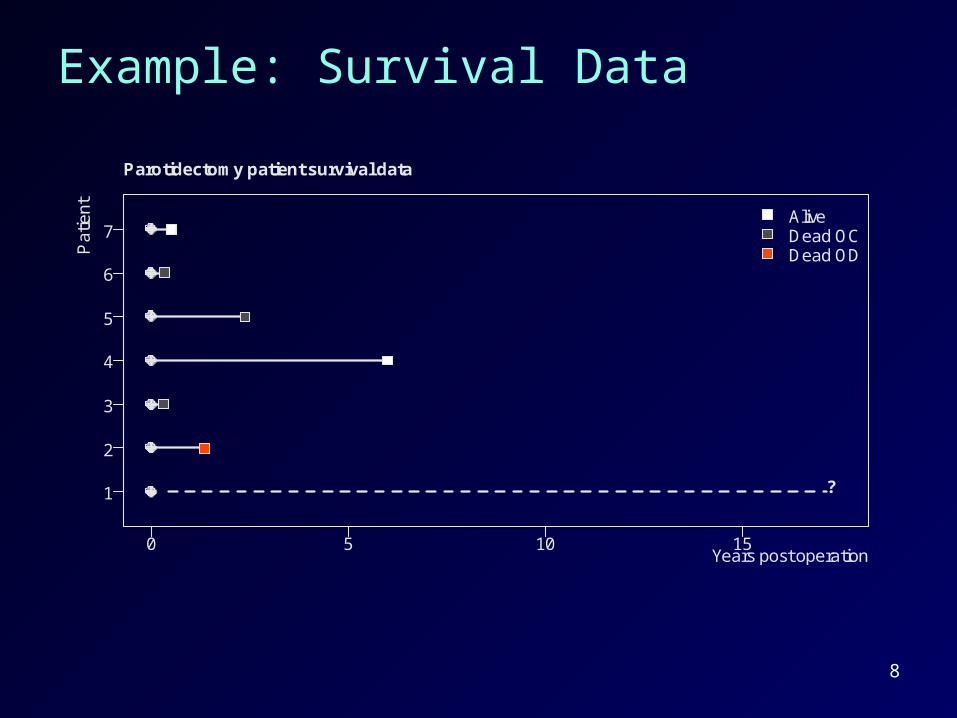
8
Example: Survival Data
1
2
3
4
5
6
7
0 5 10 15
Parotidectomy patient survival data
Pa
tien
t
?
AliveDead OCDead OD
Years post operation

9
Example: Survival Data
Date formats and manipulation can cause headaches. Check what happens when your software subtracts dates to get survival time.
1
2
3
4
5
6
7
0 5 10 15
Parotidectomy patient survival data
Pa
tien
t
?
AliveDead OCDead OD
Years post operation
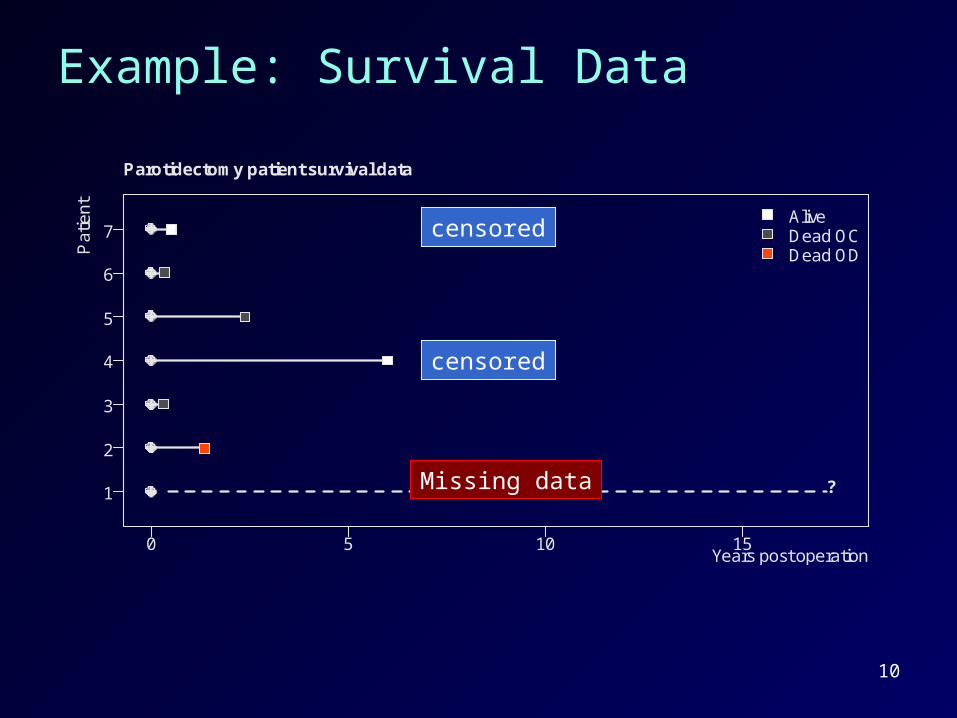
10
1
2
3
4
5
6
7
0 5 10 15
Parotidectomy patient survival data
Pa
tien
t
?
AliveDead OCDead OD
Years post operation
Example: Survival Data
censored
censored
Missing data

11
1
2
3
4
5
6
7
0 5 10 15
Parotidectomy patient survival data
Pa
tien
t
?
AliveDead OCDead OD
Years post operation
Example: Survival Data
censored
censored
Missing data
censored
censored
censored
12
1
2
3
4
5
6
7
0 5 10 15
Parotidectomy patient survival data
Pa
tien
t
?
AliveDead OCDead OD
Years post operation
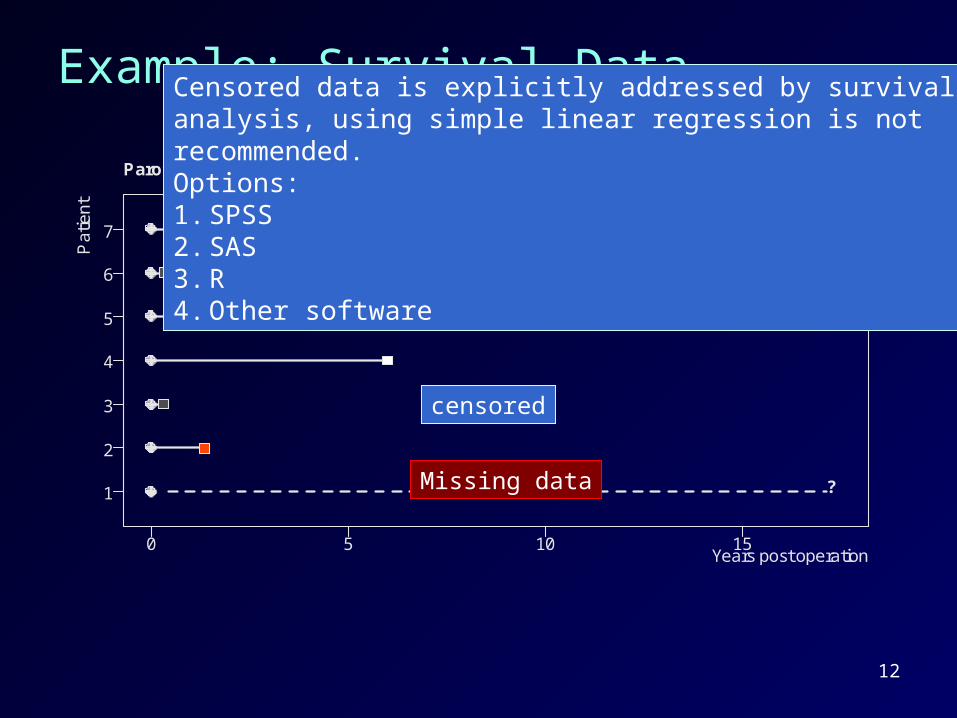
Example: Survival Data
censored
censored
censored
Missing data
censored
Censored data is explicitly addressed by survivalanalysis, using simple linear regression is not recommended. Options:1. SPSS2. SAS3. R4. Other software
13
1
2
3
4
5
6
7
0 5 10 15
Parotidectomy patient survival data
Pa
tien
t
?
AliveDead OCDead OD
Years post operation
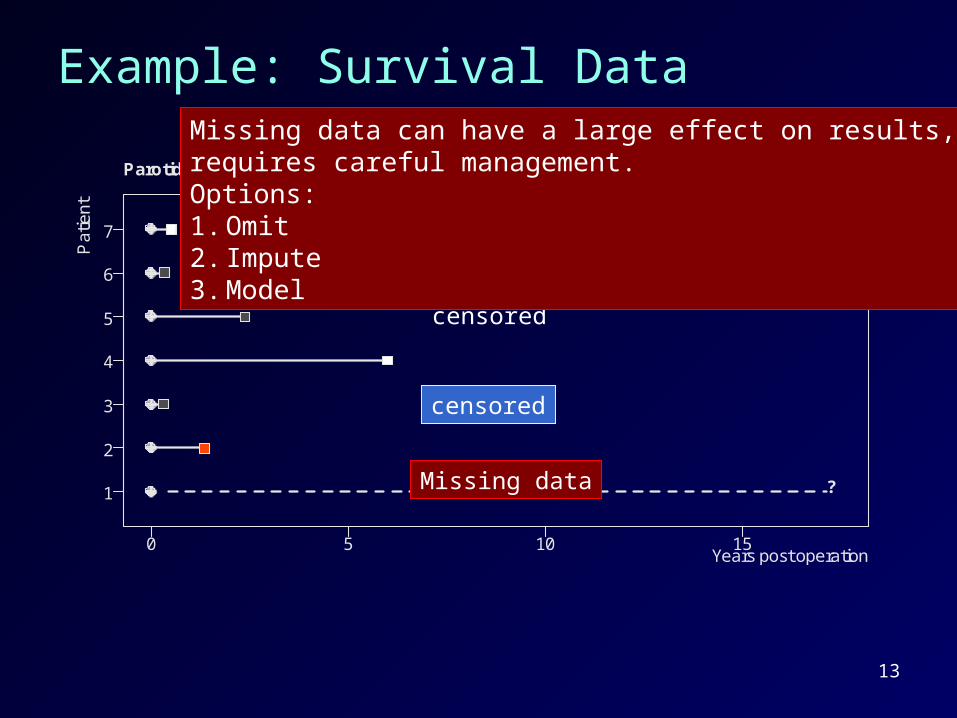
Example: Survival Data
censored
censored
censored
Missing data
censored
Missing data can have a large effect on results, requires careful management.Options:1. Omit2. Impute3. Model
14
What is survival analysis
• Time to event data– Continuous– Right skewed, ≥0, not normal– Censored– Analyse risk (hazard function)
• Examples– Time to death– Time to onset/relapse of disease– Length of stay in hospital
15
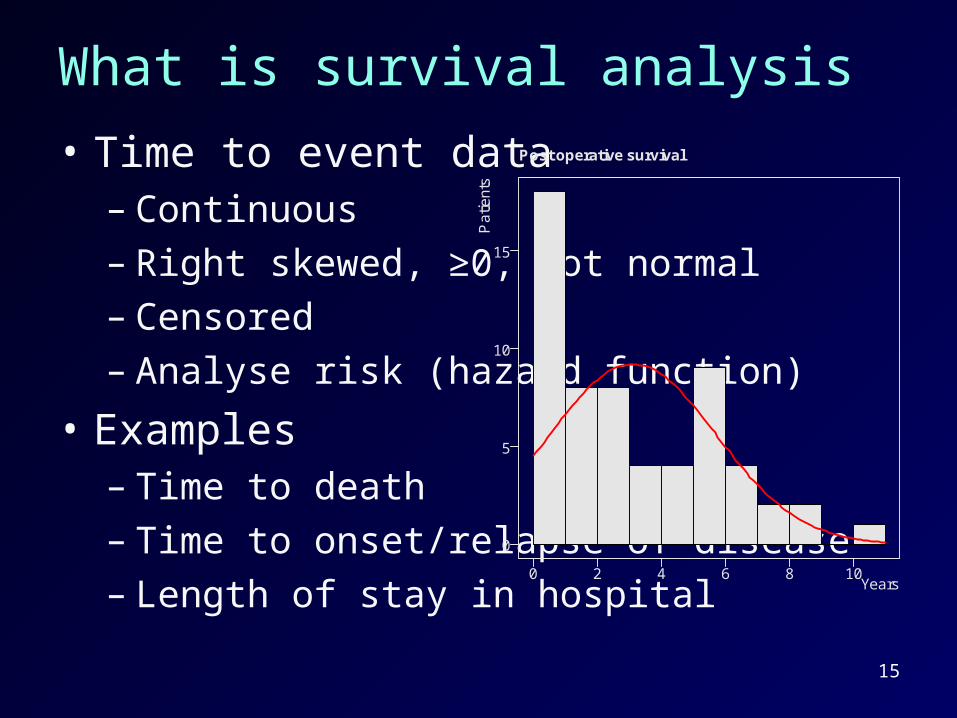
What is survival analysis
• Time to event data– Continuous– Right skewed, ≥0, not normal– Censored– Analyse risk (hazard function)
• Examples– Time to death– Time to onset/relapse of disease– Length of stay in hospital
0
5
10
15
0 2 4 6 8 10
Post operative survival
Pa
tien
ts
Years

16
Censoring
• Right censoring
• Left censoring
• Interval censoring
Censoring is also categorised by1. Fixed study length2. Fixed number of events3. Random entry to study
17
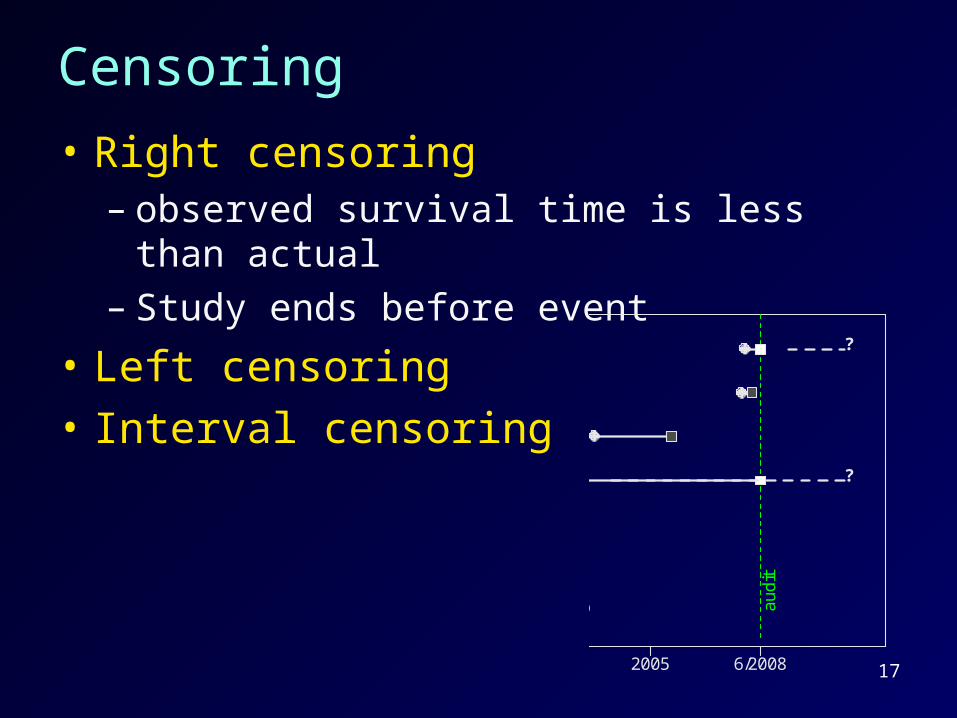
Censoring
• Right censoring– observed survival time is less than actual– Study ends before event
• Left censoring
• Interval censoring
1
2
3
4
5
6
7
1990 1995 2000 2005 6/2008
Parotidectomy patient medical records
Pa
tien
t
AliveDead OCDead OD
? Lost to follow up au
dit
?
?

18
Censoring
• Right censoring
• Left censoring – Time to relapse
– Time to event is less than observed t < 3
• Interval censoring
Surgery
0
Recurrence
3 month examt
19
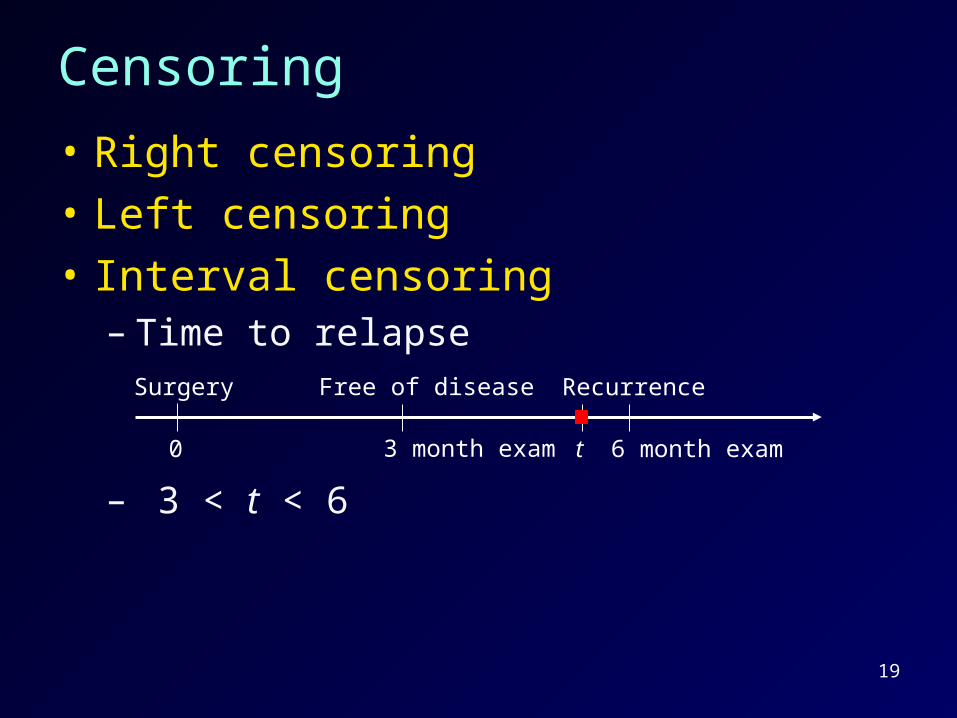
Censoring
• Right censoring
• Left censoring
• Interval censoring– Time to relapse
– 3 < t < 6
Surgery
0
Free of disease
3 month exam t
Recurrence
6 month exam
20
Censoring
Independent censoring
Survival time is independent of censoring process.
A censored patient is representative of those at risk at censoring time.
The methods described here assume independent censoring

21
Censoring
Independent censoring
Survival time is independent of censoring process.
Informative censoring
Patients removed from study if condition deteriorates.

22
Censoring example
How are the SCCMP patients censored?
23
Censoring example
How are the SCCMP patients censored?
• Enter study on surgery date
• Last known status is at audit
Random right censoring.

24
Survival function
The survival function S(t) is the probability of surviving longer than time t.
S(t) = P(T>t)
Where T is the survival time.
patients of number total
than longer surviving patients of Number tS(t)
25
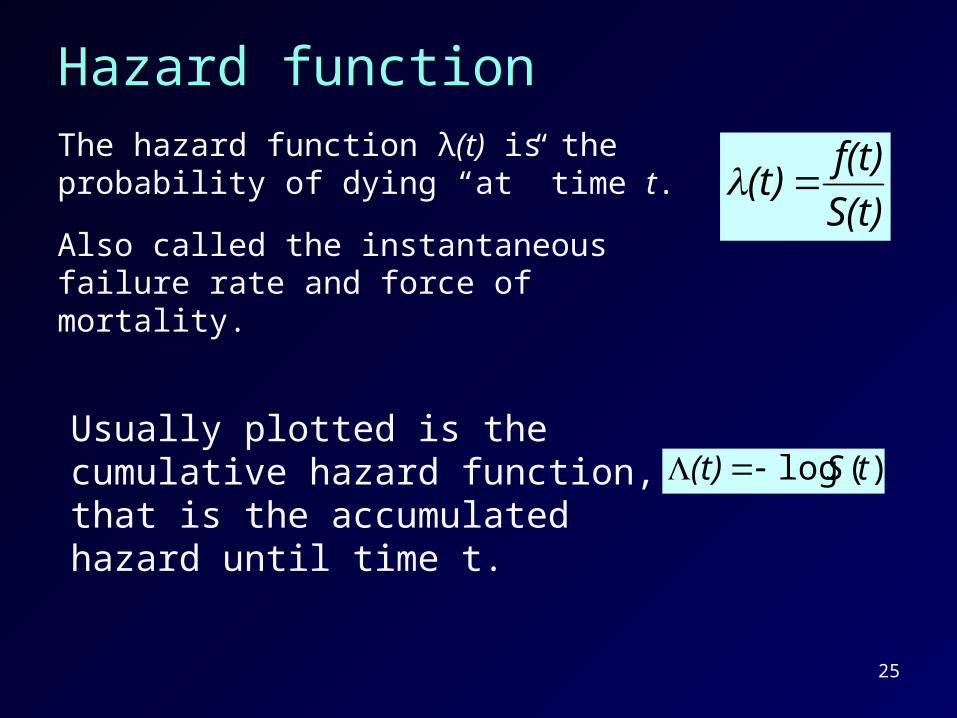
Hazard function
The hazard function λ(t) is the probability of dying “at” time t.
Also called the instantaneous failure rate and force of mortality.
S(t)
f(t)(t)
)(log tS(t) Usually plotted is the cumulative hazard function, that is the accumulated hazard until time t.
26
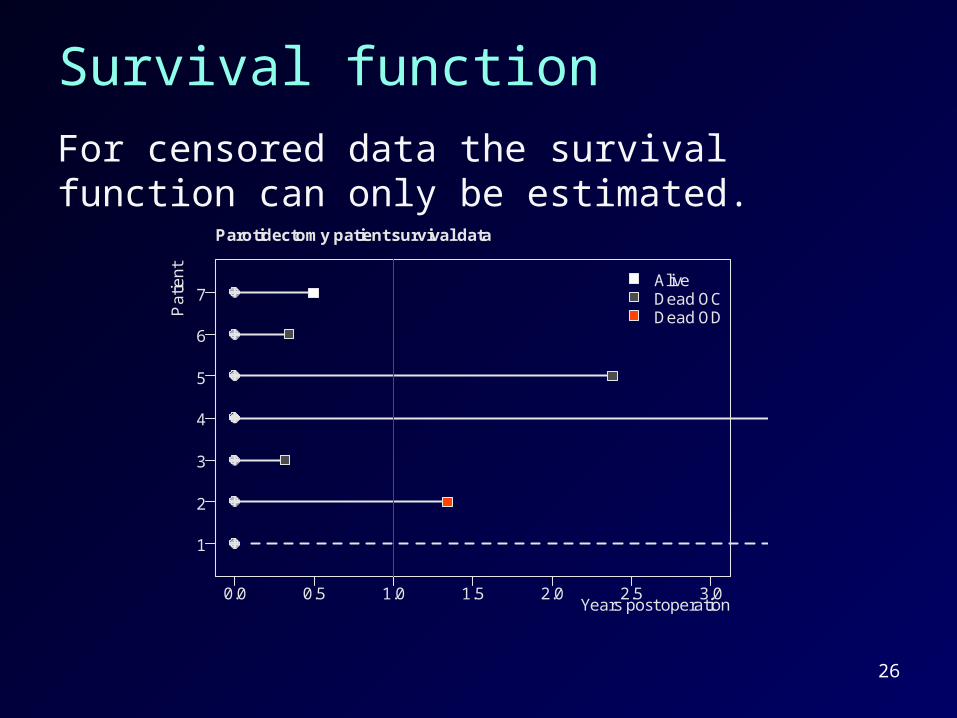
Survival function
For censored data the survival function can only be estimated.
1
2
3
4
5
6
7
0.0 0.5 1.0 1.5 2.0 2.5 3.0
Parotidectomy patient survival data
Pa
tien
t
AliveDead OCDead OD
Years post operation
27
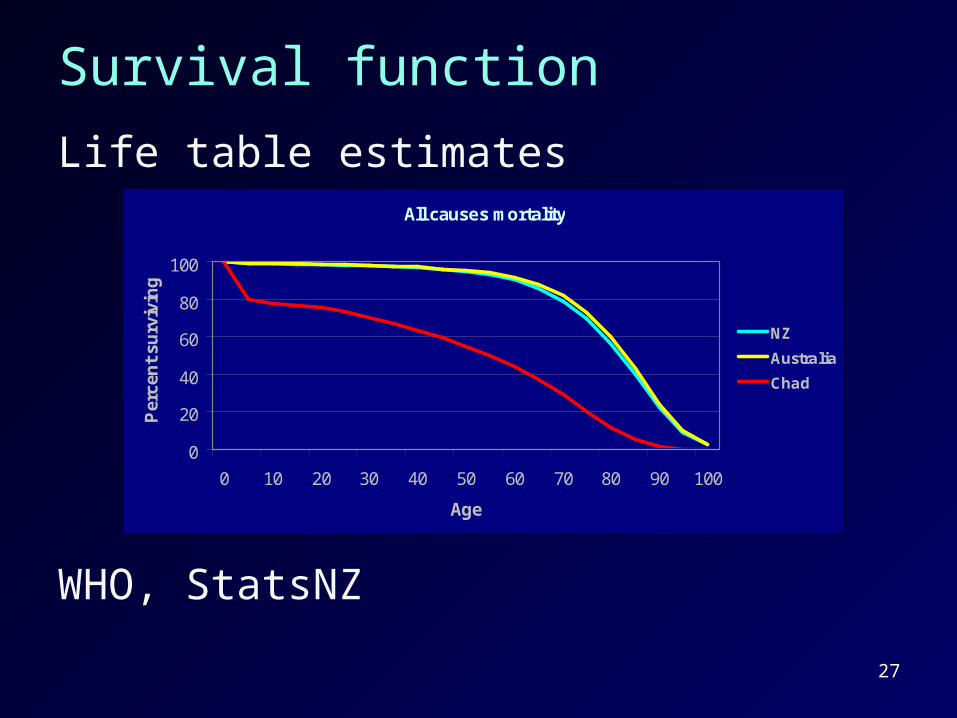
Survival function
Life table estimates
WHO, StatsNZ
All causes mortality
0
20
40
60
80
100
0 10 20 30 40 50 60 70 80 90 100
Age
Per
cen
t su
rviv
ing
NZ
Australia
Chad

28
Survival function
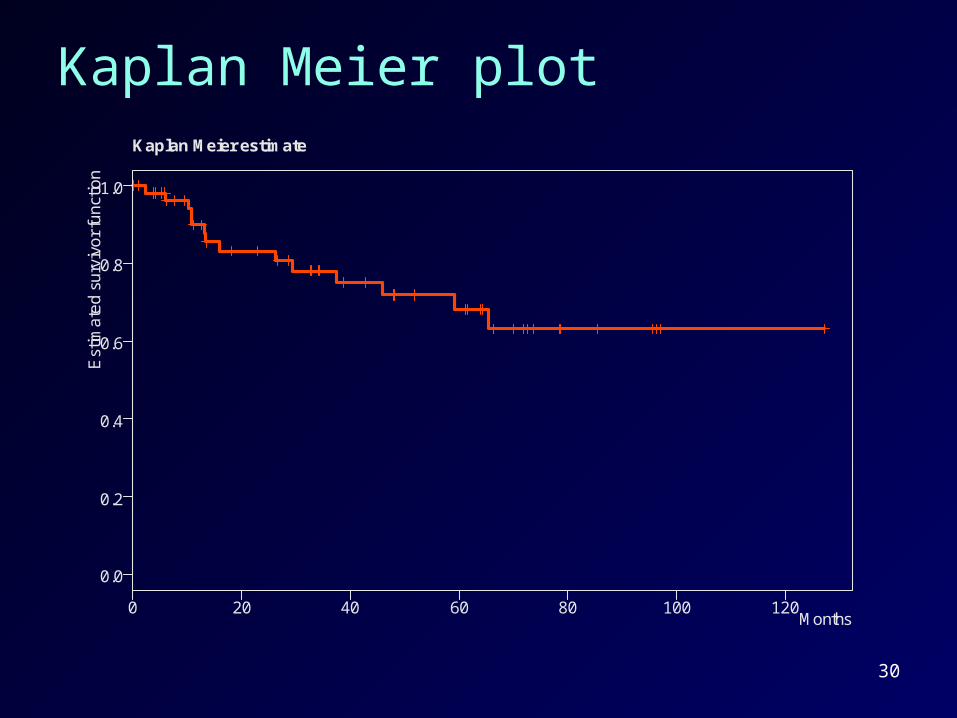
Kaplan Meier estimatesMonths n d (n-d)/n S(t)
1 2.2 57 1 0.982 0.9822 6.12 51 1 0.980 0.9633 10.32 46 1 0.978 0.9424 10.78 45 1 0.978 0.9215 10.88 44 1 0.977 0.96 13.08 41 1 0.976 0.8787 13.35 39 1 0.974 0.8568 16.11 37 1 0.973 0.8339 26.2 34 1 0.971 0.808
10 29.42 31 1 0.968 0.78211 37.48 26 1 0.962 0.75212 45.86 23 1 0.957 0.71913 59.08 19 1 0.947 0.68214 65.33 14 1 0.929 0.633

29
Survival function
Kaplan Meier estimatesMonths n d (n-d)/n S(t)
1 2.2 57 1 0.982 0.9822 6.12 51 1 0.980 0.9633 10.32 46 1 0.978 0.9424 10.78 45 1 0.978 0.9215 10.88 44 1 0.977 0.96 13.08 41 1 0.976 0.8787 13.35 39 1 0.974 0.8568 16.11 37 1 0.973 0.8339 26.2 34 1 0.971 0.808
10 29.42 31 1 0.968 0.78211 37.48 26 1 0.962 0.75212 45.86 23 1 0.957 0.71913 59.08 19 1 0.947 0.68214 65.33 14 1 0.929 0.633
1. Order data by time to event (death) 2. Number at risk of
event is number surviving less number censored.
3. Estimate of probability of surviving to next event
4. Multiply probabilities to estimate survival
30
Kaplan Meier plot
0.0
0.2
0.4
0.6
0.8
1.0
0 20 40 60 80 100 120
Kaplan Meier estimate
Est
ima
ted
su
rviv
or
fun
ctio
n
Months
31
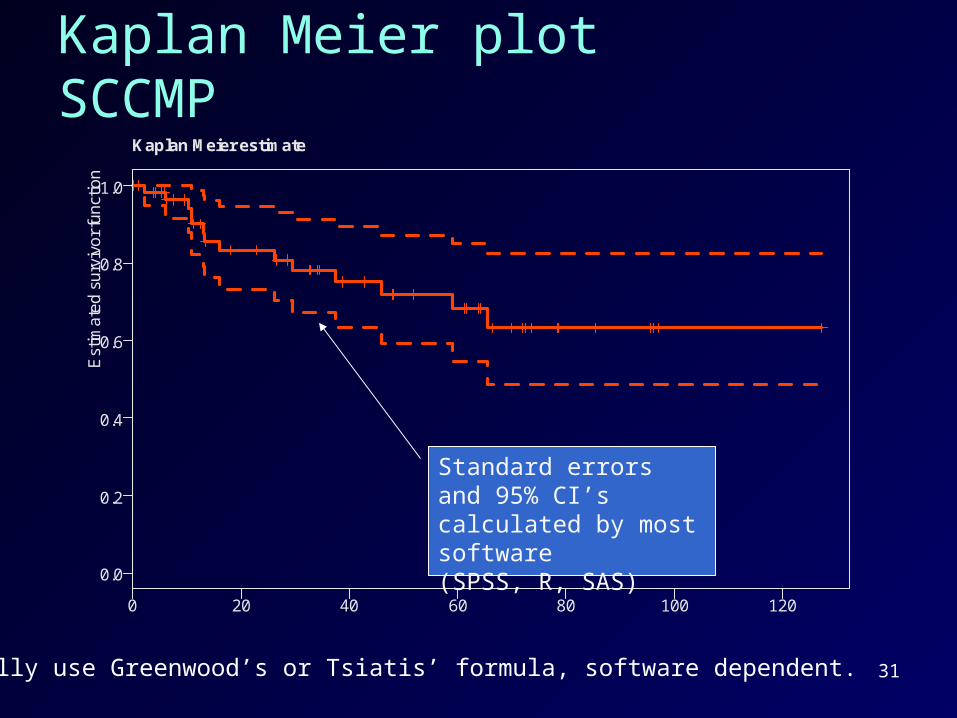
Kaplan Meier plot SCCMP
0.0
0.2
0.4
0.6
0.8
1.0
0 20 40 60 80 100 120
Kaplan Meier estimate
Est
ima
ted
su
rviv
or
fun
ctio
n
Standard errors and 95% CI’s calculated by most software (SPSS, R, SAS)
Usually use Greenwood’s or Tsiatis’ formula, software dependent.
32
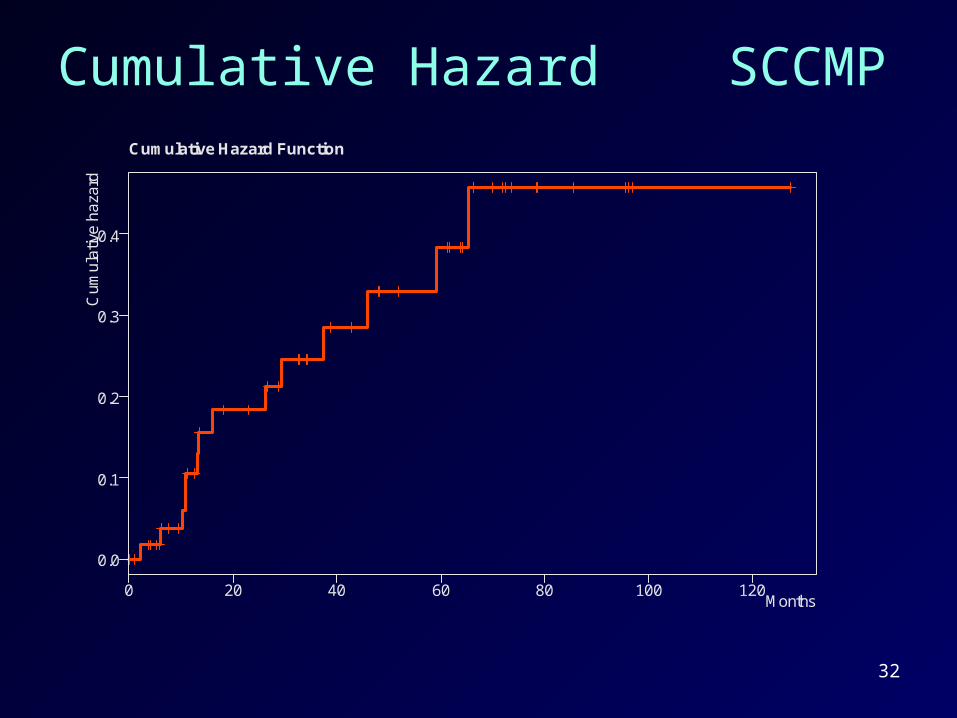
Cumulative Hazard SCCMP
0.0
0.1
0.2
0.3
0.4
0 20 40 60 80 100 120
Cumulative Hazard Function
Cu
mu
lativ
e h
aza
rd
Months
33
Summary statistics
1. Median survival: time when S(t) = 0.5• Must have enough data
2. Mean survival: area under the survival curve
3. 5 year survival is survival rate at 5 years
34
Kaplan Meier estimate
KM and lifetables are non-parametric methods: no assumptions are made about the distribution on the survival times.
Typical distributions are exponential and Weibull. More powerful but can be sensitive to getting the distribution right.
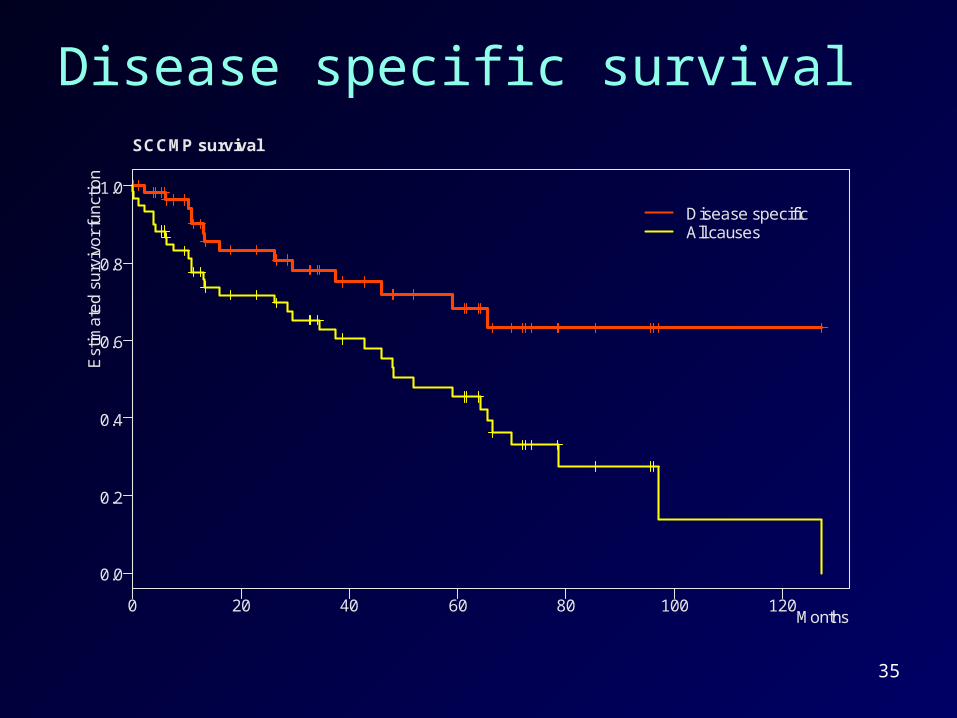
35
Disease specific survival
0.0
0.2
0.4
0.6
0.8
1.0
0 20 40 60 80 100 120
SCCMP survival
Est
ima
ted
su
rviv
or
fun
ctio
n
Months
Disease specificAll causes
36
Comparing 2 groups
Log rank test
• Computed in SPSS, SAS, R
• Most popular – (Bland Altman BMJ 2004;328:1073 (1 May)
• Limitations– No estimate of size– Unlikely to detect a difference when risk is not
consistent
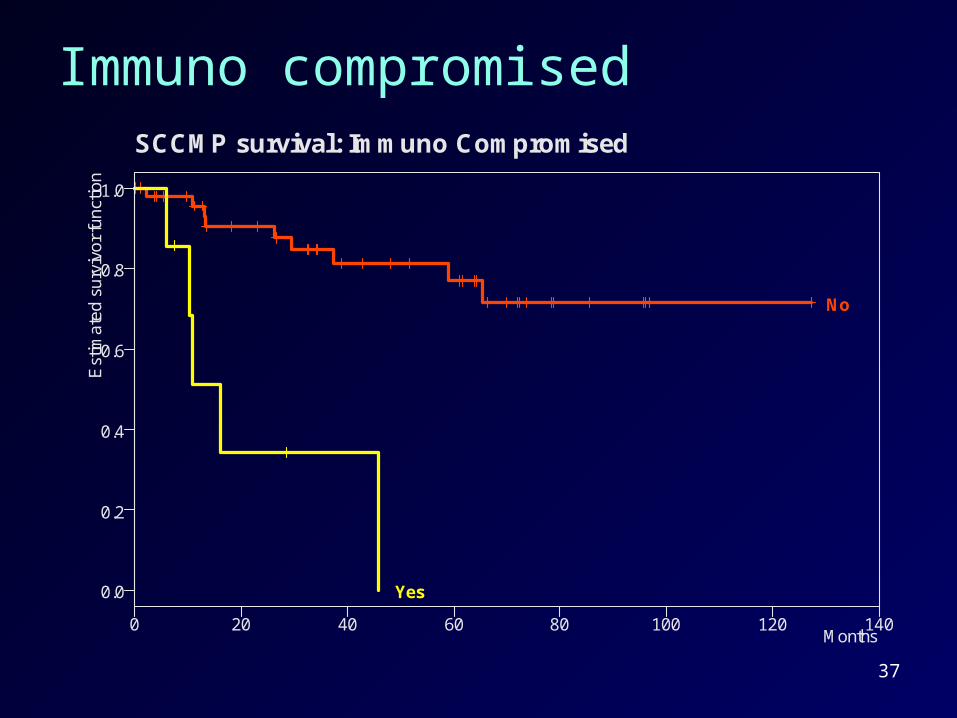
37
Immuno compromised
0.0
0.2
0.4
0.6
0.8
1.0
0 20 40 60 80 100 120 140
SCCMP survival: Immuno Compromised
Est
ima
ted
su
rviv
or
fun
ctio
n
Months
No
Yes
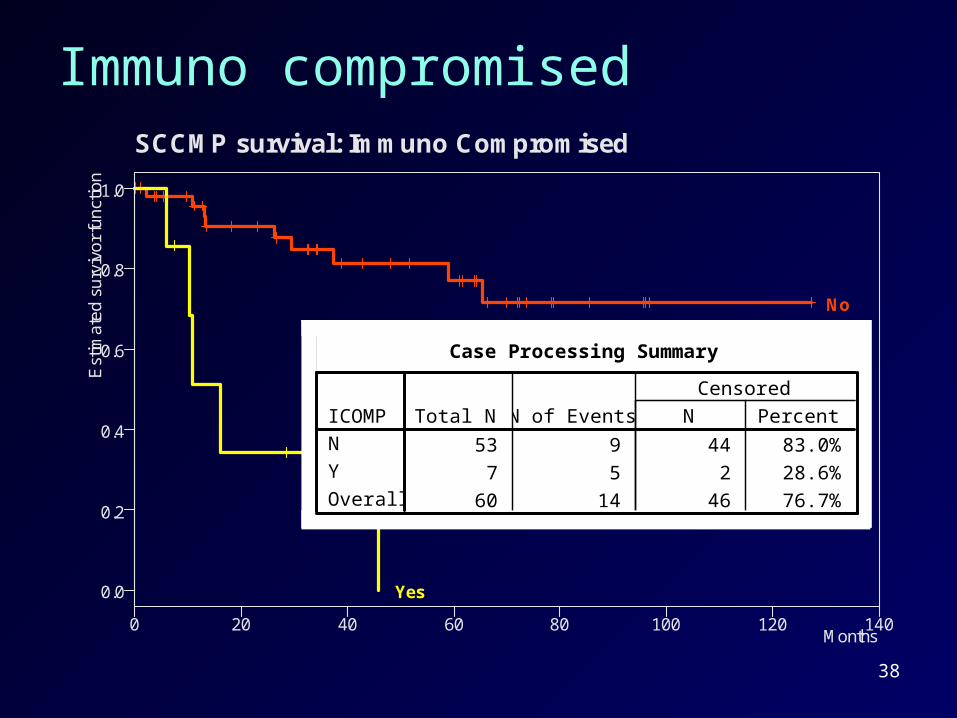
38
Immuno compromised
0.0
0.2
0.4
0.6
0.8
1.0
0 20 40 60 80 100 120 140
SCCMP survival: Immuno Compromised
Est
ima
ted
su
rviv
or
fun
ctio
n
Months
No
Yes
Case Processing Summary
53 9 44 83.0%
7 5 2 28.6%
60 14 46 76.7%
ICOMPN
Y
Overall
Total N N of Events N Percent
Censored

39
Immuno compromised
0.0
0.2
0.4
0.6
0.8
1.0
0 20 40 60 80 100 120 140
SCCMP survival: Immuno Compromised
Est
ima
ted
su
rviv
or
fun
ctio
n
Months
No
Yes
Means and Medians for Survival Time
101.048 7.616 . .
22.978 7.653 16.110 3.293
91.761 7.842 . .
ICOMPN
Y
Overall
Estimate Std. Error Estimate Std. Error
Meana
Median
Estimation is limited to the largest survival time if itis censored.
a.

40
Immuno compromised
0.0
0.2
0.4
0.6
0.8
1.0
0 20 40 60 80 100 120 140
SCCMP survival: Immuno Compromised
Est
ima
ted
su
rviv
or
fun
ctio
n
Months
No
Yes
Overall Comparisons
19.579 1 .000Log Rank (Mantel-Cox)Chi-Square df Sig.
Test of equality of survival distributions for the different levels ofICOMP.

41
Age group
0.0
0.2
0.4
0.6
0.8
1.0
0 20 40 60 80 100 120 140
SCCMP survival: Age group
Est
ima
ted
su
rviv
or
fun
ctio
n
Months
75+<75
Call:survdiff(formula = Surv(mths,Status == "DOD") ~ ICOMP)
N Observed Expected (O-E)^2/E (O-E)^2/VAge75=<75 24 7 5.63 0.332 0.557Age75=75+ 36 7 8.37 0.224 0.557
Chisq= 0.6 on 1 degrees of freedom, p= 0.455
42
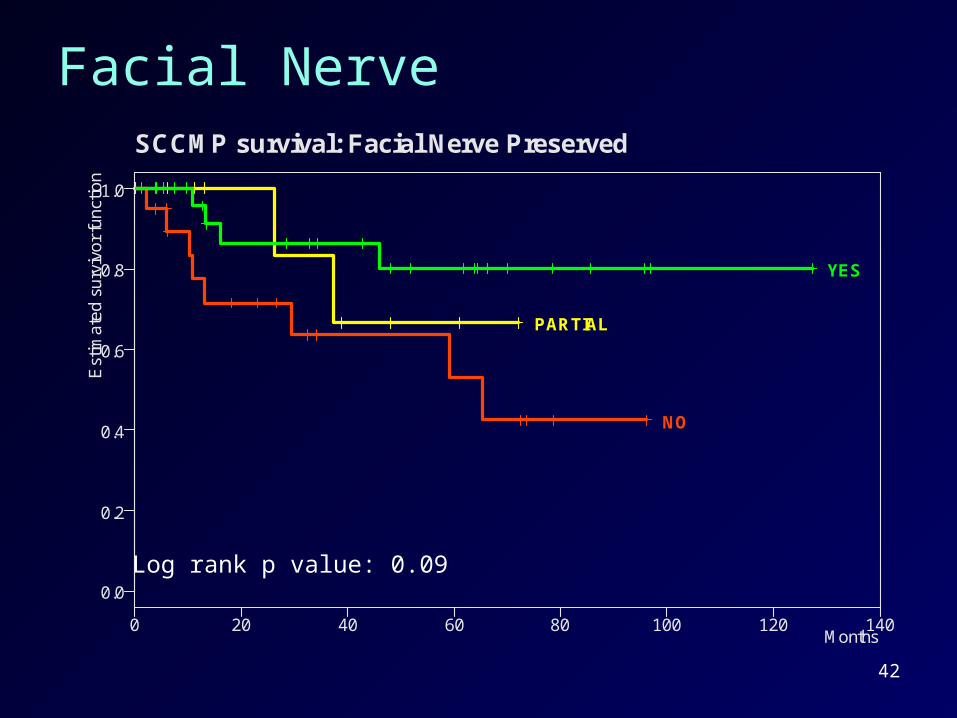
Facial Nerve
0.0
0.2
0.4
0.6
0.8
1.0
0 20 40 60 80 100 120 140
SCCMP survival: Facial Nerve Preserved
Est
ima
ted
su
rviv
or
fun
ctio
n
Months
NO
PARTIAL
YES
Log rank p value: 0.09
43
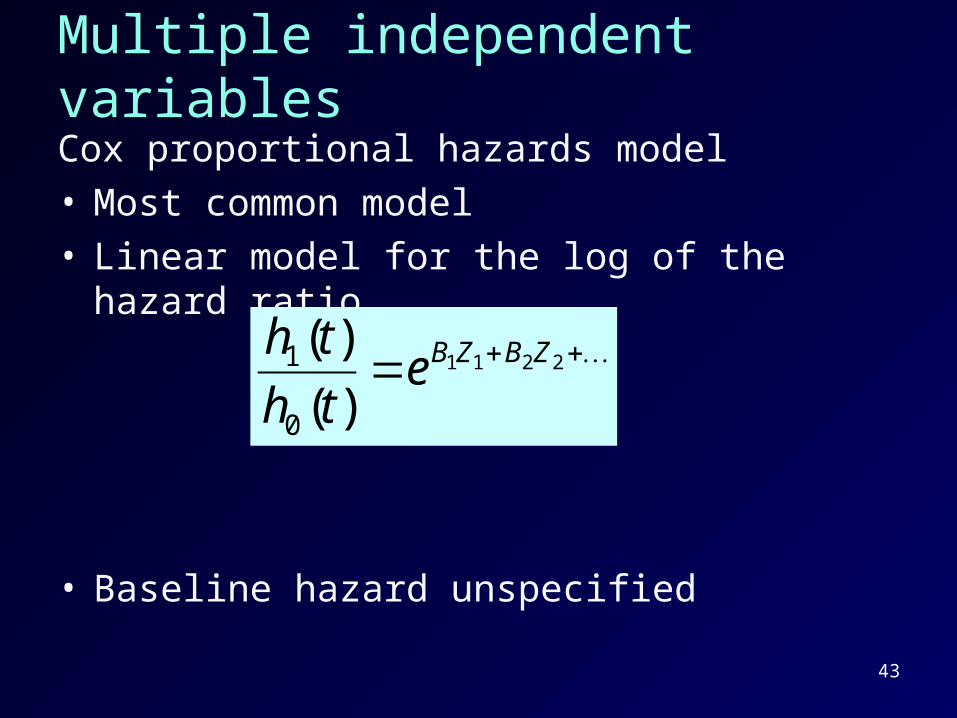
Multiple independent variables
Cox proportional hazards model• Most common model• Linear model for the log of the hazard ratio
• Baseline hazard unspecified
2211
)(
)(
0
1 ZBZBeth
th

44
SCCMP example
CPH model:Survival ~ Preserved + Age + ICOMP
Preserved and ICOMP categoricalAge continuous
Plot survival for patients with each of /Y/N/partial nerve preservation adjusted for age and immuno compromised status

45
SCCMP example - SPSS
Analyze > Survival > Cox Regression
COXREG
Months /STATUS=Status('DEAD')
/PATTERN BY Preserved
/CONTRAST (Preserved)=Indicator /CONTRAST (ICOMP)=Indicator(1)
/METHOD=ENTER Preserved Age ICOMP
/PLOT SURVIVAL
/SAVE=PRESID XBETA
/PRINT=CI(95) CORR SUMMARY BASELINE
/CRITERIA=PIN(.05) POUT(.10) ITERATE(20) .
46
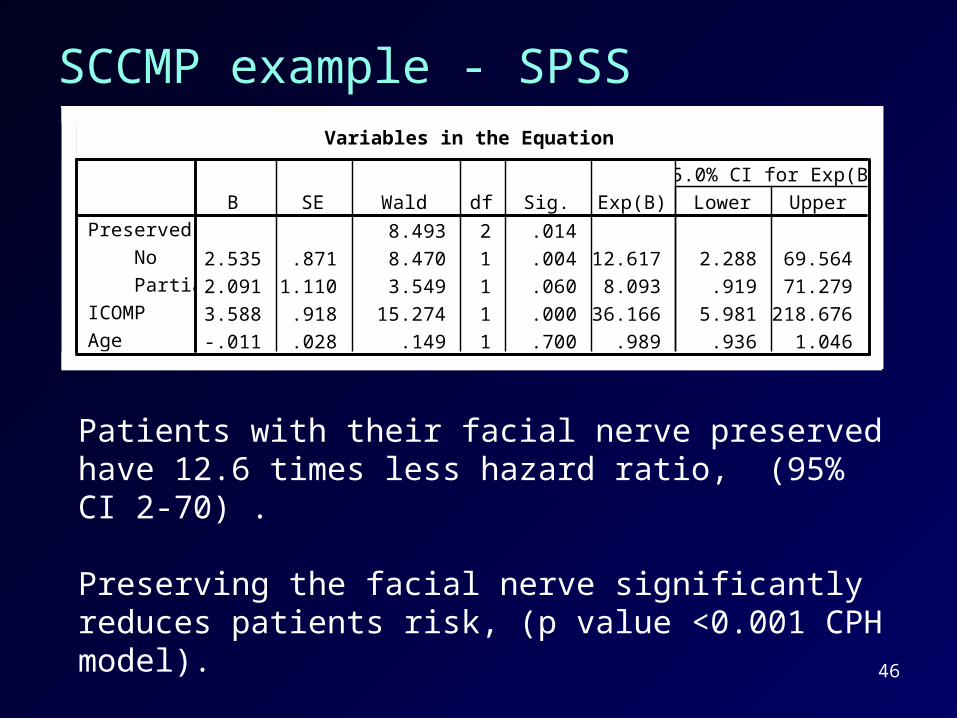
SCCMP example - SPSS
Patients with their facial nerve preserved have 12.6 times less hazard ratio, (95% CI 2-70) .
Preserving the facial nerve significantly reduces patients risk, (p value <0.001 CPH model).
Variables in the Equation
8.493 2 .014
2.535 .871 8.470 1 .004 12.617 2.288 69.564
2.091 1.110 3.549 1 .060 8.093 .919 71.279
3.588 .918 15.274 1 .000 36.166 5.981 218.676
-.011 .028 .149 1 .700 .989 .936 1.046
Preserved
No
Partial
ICOMP
Age
B SE Wald df Sig. Exp(B) Lower Upper
95.0% CI for Exp(B)
47
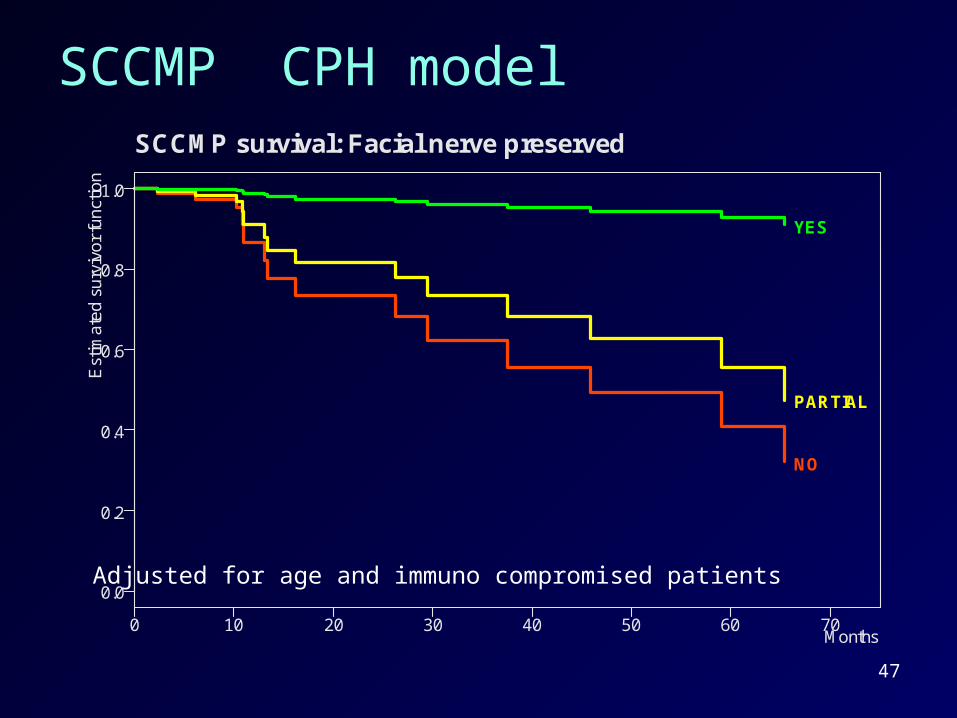
SCCMP CPH model
0.0
0.2
0.4
0.6
0.8
1.0
0 10 20 30 40 50 60 70
SCCMP survival: Facial nerve preserved
Est
ima
ted
su
rviv
or
fun
ctio
n
Months
NO
PARTIAL
YES
Adjusted for age and immuno compromised patients

48
Next Steps:
• Check proportional hazards assumption– Residual plots for groups
• Time dependent covariates
• More complex models
• we also didn’t do power calculations
49
Summary
• Survival analysis accounts for censoring in time to event data
• Log rank test: difference in survival between 2 groups
• Cox proportional hazard model
• More complex/powerful models available
• SPSS, R, SAS, Stata