1 INTRODUCTION NOVEMBER 13 2013 CHAPTER 2
21
2.0 TUCSON PLANNING CONTEXT Plan Tucson 2013 CHAPTER 2 TUCSON PLANNING CONTEXT Tucson Over Time .................... 2.1 Tucson in Recent Years ................ 2.3 Community Values & Visions ........... 2.8 A Sustainable Community ............. 2.11 Neighborhoods: The Foundational Unit .. 2.13 Poverty & Prosperity.................. 2.16 Goals .............................. 2.18 NOVEMBER 13, 2013
Transcript of 1 INTRODUCTION NOVEMBER 13 2013 CHAPTER 2

2.0 TUCSON PLANNING CONTEXT Plan Tucson 2013
INTRODUCTION1
CHAPTER 2TUCSON PLANNING CONTEXT
Tucson Over Time . . . . . . . . . . . . . . . . . . . . 2.1
Tucson in Recent Years . . . . . . . . . . . . . . . . 2.3
Community Values & Visions . . . . . . . . . . . 2.8
A Sustainable Community . . . . . . . . . . . . . 2.11
Neighborhoods: The Foundational Unit . . 2.13
Poverty & Prosperity . . . . . . . . . . . . . . . . . . 2.16
Goals . . . . . . . . . . . . . . . . . . . . . . . . . . . . . . 2.18
NOVEMBER 13, 2013

Plan Tucson 2013 TUCSON PLANNING CONTEXT 2.1
TUCSON PLANNING CONTEXT
The second part focuses on recent years, 2001–2012, looking first at variables that help define the community, from its natural setting, to its demographics, to land use patterns, and then at City plans, policies, and initiatives undertaken during this period. The third part addresses how values and visions identified through various activities in recent years served as a starting point for Plan Tucson. Building on the values and visions, the fourth part introduces sustainability as integral to the Plan’s goals and policies, while the fifth part considers the neighborhood as the foundational unit that sustains a city. The sixth, and concluding part, presents the goals toward which the City will strive
through the implementation of policies presented in Chapter 3.
Tucson Over Time1
Tucson is the oldest permanently settled community in the United States, going back about 4,000 years to the Hohokam Culture. Three hundred years ago, the Franciscan Order arrived in Tucson and established Mission San Xavier del Bac, a mission that is being restored and continues to serve the Tohono O’odham Nation. The Tucson Presidio, established in 1775 under Spanish rule, is the official birthplace of Tucson. The territory that would become Arizona was purchased by the United States from Mexico in 1854.
Tucson is an evolving community . Understanding that evolution is important to addressing the range of topics covered in the City’s General Plan . This chapter considers Tucson’s context in six parts . The first part highlights Tucson over time, from prehistoric days to 2001, the year the previous General Plan was adopted .
1A Brief History of Tucson; http://cms3.tucsonaz.gov/history/tucson_history
CHAPTER 2 TUCSON PLANNING CONTEXTNOVEMBER 13, 2013

2.2 TUCSON PLANNING CONTEXT Plan Tucson 2013
The Southern Pacific Railroad, which reached Tucson in 1880, improved access for new settlers and brought goods from the east. That year the population reached 8,000.
In 1862 the Morrill Act provided federal funds for the establishment of land-grant colleges to focus on agriculture and mining. In 1891, the University of Arizona opened its doors with 32 students and 40 donated acres. The University of Arizona’s enrollment grew to 13,058 students in 1960 and 39,000 full and part-time students in 2011.
In 1912, Arizona became the 48th state in the Union and, in 1919, Tucson had the distinction of opening the first municipally owned airport in the nation. The airport was later moved to a larger site which, in 1927, was dedicated by Charles Lindbergh for two Tucsonans who had lost their lives in aviation accidents—Lieutenants Samuel H. Davis and Oscar Monthan. Davis-Monthan Field accommodated both civil and military aircraft and became the largest municipally owned airport in the nation.2 In 1941, the City purchased the current site of the Tucson International Airport, and the Tucson Airport Authority was established in 1948 to operate the airport.
Between 1940 and the end of WWII, Tucson grew from about 40,000 to 120,000 due, in large part, to activities associated with Davis-Monthan. Tucson continued to grow rapidly after the war for three key reasons. First, military personnel who had trained at Davis-Monthan returned to Tucson after the war to settle down. Second, the advent of affordable, residential air conditioning made living in a hot climate more appealing to many. Third, the emerging, post-war, automobile-owning middle class sought single-family houses on large lots, which were readily available in Tucson. By 1960, Tucson boasted a population of 220,000, and by 2000, a population of 486,699, making Tucson the 30th largest city in the nation.
In the 1950s, the City began an aggressive campaign to annex the subdivisions that had sprung up outside the City limits.3 Beginning in the 1960s, real estate development sustained local growth, fueled in part by the interest of California investors in “cheap” land and the advent of the “retirement community.” In 1960, the City covered 70 square miles, which more than tripled by 2000 to 227 square miles (Exhibit T-1).
The Hughes Aircraft Company, now Raytheon Missile Systems, opened in 1951 to produce missiles and other military equipment. In the 1950s, Hughes employed over 5,000 workers, becoming the largest technology employer in Arizona and spurring growth in the region.
Along with real estate and technology, tourism has been a major contributor to the local economy. The warm, dry climate; unique natural environment; Hispanic and Native American cultures;
2Davis-Monthan Air Force History; http://www.dm.af.mil/library/factsheets/factsheet.asp?id=4318; Posted 6/2/2009
3Tucson Post World War II Residential Subdivision Development, 1945 –1973 October 2007, City of Tucson Urban Planning and Design Department, Historic and Cultural Resources; October 2007 http://cms3.tucsonaz.gov/sites/default/files/imported/resources/publications/wwii_102207.pdf
Old Main, University of Arizona, 1889.
TUCSON PLANNING CONTEXT CHAPTER 2 NOVEMBER 13, 2013
Plan Tucson 2013 TUCSON PLANNING CONTEXT 2.3
and the western ranching lifestyle have lured visitors to Tucson since the 1920s. Tourism dollars rose from $28.5 million in 1954 to $900 million in 1959, a thirty-two fold increase in only five years. By 2000 tourism dollars had reached $1.8 billion.
Tucson in Recent YearsNatural Setting: Tucson is located in the Sonoran Desert at an approximate elevation of 2,400 feet. The city is surrounded by mountain ranges and federally-protected lands. Tucsonans enjoy 350 days of sunshine per year with an average daytime temperature of 83 degrees. Average annual rainfall in Tucson is 12 inches. Precipitation typically falls during two seasons, with half of the rainfall coming during the summer monsoon season and half during the winter months. The Sonoran Desert is home to a diverse array of plants and animals. Some are found nowhere else in the world, including the iconic saguaro cactus and the ironwood tree.
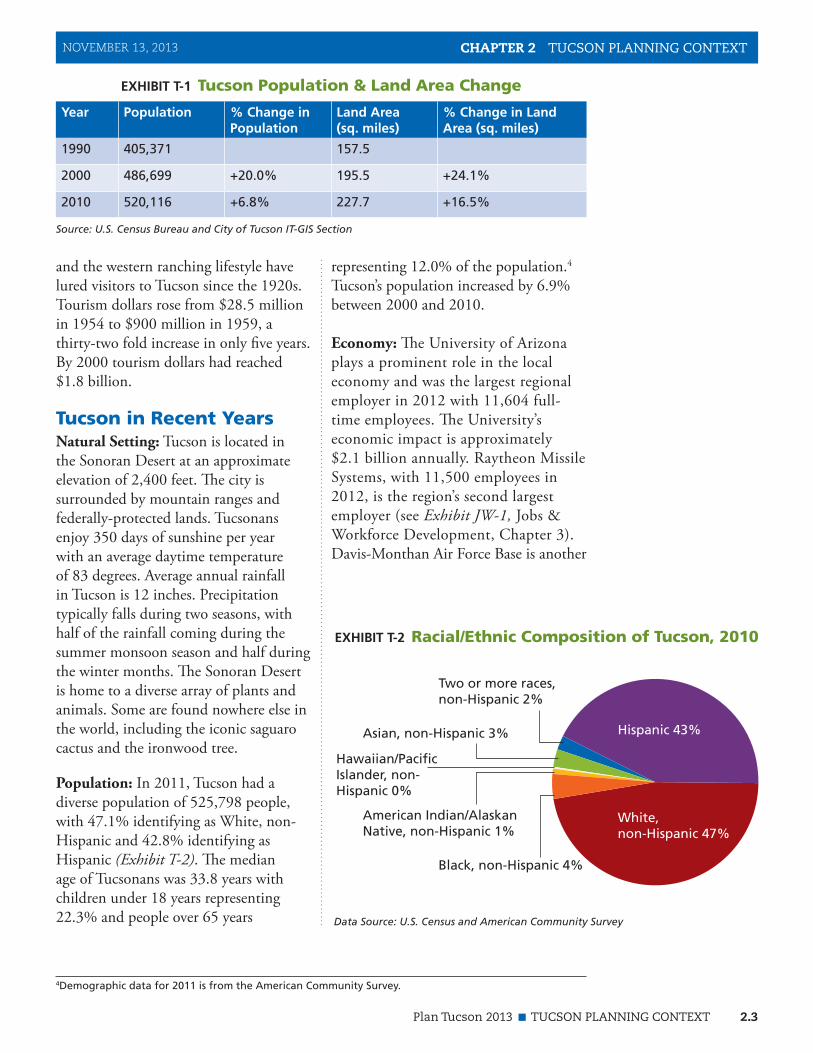
Population: In 2011, Tucson had a diverse population of 525,798 people, with 47.1% identifying as White, non-Hispanic and 42.8% identifying as Hispanic (Exhibit T-2). The median age of Tucsonans was 33.8 years with children under 18 years representing 22.3% and people over 65 years
representing 12.0% of the population.4 Tucson’s population increased by 6.9% between 2000 and 2010.
Economy: The University of Arizona plays a prominent role in the local economy and was the largest regional employer in 2012 with 11,604 full-time employees. The University’s economic impact is approximately $2.1 billion annually. Raytheon Missile Systems, with 11,500 employees in 2012, is the region’s second largest employer (see Exhibit JW-1, Jobs & Workforce Development, Chapter 3). Davis-Monthan Air Force Base is another
4Demographic data for 2011 is from the American Community Survey.
Year Population % Change in Population
Land Area (sq. miles)
% Change in Land Area (sq. miles)
1990 405,371 157.5
2000 486,699 +20.0% 195.5 +24.1%
2010 520,116 +6.8% 227.7 +16.5%
Source: U.S. Census Bureau and City of Tucson IT-GIS Section
White, non-Hispanic 47%
Black, non-Hispanic 4%
American Indian/Alaskan Native, non-Hispanic 1%
Hawaiian/Pacific Islander, non-Hispanic 0%
Asian, non-Hispanic 3%
Two or more races, non-Hispanic 2%
Hispanic 43%
EXHIBIT T-2 Racial/Ethnic Composition of Tucson, 2010
EXHIBIT T-1 Tucson Population & Land Area Change
CHAPTER 2 TUCSON PLANNING CONTEXT
Data Source: U.S. Census and American Community Survey
NOVEMBER 13, 2013

2.4 TUCSON PLANNING CONTEXT Plan Tucson 2013
major contributor to the local economy with a workforce of 6,000 military and 1,700 civilian personnel in 2011.
Tucson is a national leader in several fields. In 2011, Business Facilities ranked Tucson first in the nation as an Alternative Energy Industry Leader and sixth in Aerospace and Defense manufacturing. Tucson is also recognized as a leader in the optics, astronomy, and medical industries. In 2007, Tucson was designated by the United States Department of Energy as one of 25 Solar America Cities, acknowledging the City’s efforts to accelerate the adoption of solar energy technologies for a cleaner, more secure energy future. Tucson Regional Economic Opportunities, Inc. estimates that more than 1,200 high-tech businesses in the region employ more
than 50,000 workers.Tourism is a large part of Tucson’s
economy. The Metropolitan Tucson Convention and Visitors Bureau estimates that almost 22,000 jobs were supported by tourism in Tucson and Pima County in 2011 and $2.4 billion in direct travel spending was generated by visitors in the same year. Events such as the Tucson Gem and Mineral Show and the El Tour de Tucson bicycle race are well known nationally and internationally, bringing visitors and associated revenue from all over the world. A 2007 report conducted for the Metropolitan Tucson Convention and Visitors Bureau estimated more than $100 million was spent locally during the 2007 Gem Show, with food/lodging/local transportation being the largest category of expenditures. The associated local taxes paid were over $9 million, constituting about 4% of the City’s sales tax receipts that year.
Tucson experienced the recession of 2007–2009 in much the same way as the rest of the country. Median household income in Tucson was $35,362 in 2011, which was below the national median household income of $50,502. While national household income fell 1.5% from 2010 to 2011, household income in Tucson fell 2.9% in the same period (Exhibit T-3). The unemployment rate rose from a low of 3.6% in 2007 to a high of 9.4% in 2010 and then dipped to 8.4% in 2011. Exhibit T-4 presents employment data for Tucson between 2001 and 2011.
Education: Seven school districts operate within the City limits, including Amphitheater, Catalina, Flowing Wells, Foothills, Sunnyside, Tucson Unified, and Vail. Elementary, middle, and high school education is provided through over 800 public and private
Year Median Household Income
2011 $35,362
2010 $36,428
2009 $35,565
2008 $36,640
2007 $36,096
2006 $36,095
2005 $34,241
2000 $30,819
Year Employment Unemployment Rate
2011 426,406 8.40%
2010 433,795 9.40%
2009 441,966 9.00%
2008 446,651 5.60%
2007 438,680 3.60%
2006 429,323 3.90%
2005 418,214 4.50%
2004 417,457 4.60%
2003 405,584 5.30%
2002 399,021 5.70%
2001 395,453 4.30%
Source for Exhibits T3-T4: U.S. Census and American Community Survey
TUCSON PLANNING CONTEXT CHAPTER 2
EXHIBIT T-3 Median Household Income in Tucson
EXHIBIT T-4 Employment in Tucson
NOVEMBER 13, 2013

Plan Tucson 2013 TUCSON PLANNING CONTEXT 2.5
schools within the city. The largest post-secondary educational institutions are the University of Arizona, with an enrollment of 39,236 students in 2011, and Pima Community College, with an enrollment of 62,199 students in the same year. Five of six Pima Community College campuses are located within Tucson.
The City of Tucson supports lifelong learning through a variety of programs for different age groups. In 2011, the Parks and Recreation Department served over 250,000 seniors through its senior center programming, more than 50,000 adults and children through its therapeutic recreation programs, and 4,300 youth through its out-of-school programming.
Activities: Recreational activities are varied and the region’s mild climate encourages outdoor recreation. As of 2011, the Tucson metropolitan area had more than 27,000 acres of park lands, 732 miles of designated bikeways, and more than 40 public and private golf courses. In the same year, the City Parks
and Recreation Department managed 125 parks, 26 pools plus 1 splash pad, 16 recreation centers, 3 senior centers and 9 senior clubs, 5 golf courses, and 202 ball fields and multipurpose fields. In 2011, well over 1.1 million people attended classes, events, programs, or facilities managed by the Parks and Recreation Department.
Tucson hosts many sporting events. The most prominent of these include the University of Arizona Wildcats football and basketball games; the Tucson Padres baseball team, a Triple-A affiliate of the San Diego Padres; the Fort Lowell Shootout, a youth winter soccer tournament drawing soccer players from across the country and internationally; and El Tour de Tucson, attracting over 9,000 cyclists of all ages and abilities from the United States and many other countries.
Development Patterns & Transportation Networks: To a large extent, land use patterns in Tucson are a result of the transportation system. The relatively flat topography has enabled the
Aerial view of midtown Tucson looking east showing development in response to street grid pattern.
CHAPTER 2 TUCSON PLANNING CONTEXTNOVEMBER 13, 2013
2.6 TUCSON PLANNING CONTEXT Plan Tucson 2013
development of a street grid pattern in which the major roads (arterials) support commercial uses and the smaller streets (collectors and residential) accommodate residential uses. Interstates 10 and 19 are the only major highways that traverse Tucson, making arterials and collectors the primary means of traffic circulation within the city.
Similar to many cities across the nation, Tucson has taken a greater interest in transit in recent years due in part to higher gas prices, increased sensitivity to environmental issues, and a desire for a more walkable, less car-dependent community. The public transit system in Tucson is comprised of bus service operated for the City by Sun Tran. As of 2011, the bus service was made up of 40 fixed routes with 20 million passenger trips, an increase in transit ridership of 36% in ten years. A new addition to the transit system is the Modern Streetcar system currently under construction. The system, designed to connect the University of Arizona, the Fourth Avenue Business District, downtown Tucson, and historic westside neighborhoods, is anticipated to not only
provide an alternative to the automobile, but also to generate more public-private development along the route.
Neighborhoods: Neighborhoods are integral to Tucson’s sense of place. The Neighborhood Preservation Ordinance was enacted to ensure the health, safety, and welfare of residents and to protect residents from neighborhood deterioration. As of October 2012, there were 134 neighborhood associations registered with the City.
Housing has historically been affected by market factors including consumer preferences, land availability, and household size. Other factors that influence Tucson’s housing stock are demographics; transportation access, including public transit; and economics. In addition to wanting housing that meets family needs, Tucsonans value safe, accessible, and identifiable neighborhoods in which to live.
The character of Tucson’s neighborhoods is defined, in large part, by architecture and historic resources. As of 2012, Tucson had 31 National Register Historic Districts, 6 locally-designated Historic Preservation Zones, and 2 Neighborhood Preservation Zones. Architectural styles are diverse and represent many building periods, extending from the mid-to late-1840s through the 1960s. Styles include Sonoran, Territorial, Queen Anne, Mission Revival, Colonial Revival, Art Deco, Craftsman Bungalow, Moderne, International, and post WWII Suburban Ranch.
Culture: Tucson’s rich culture is founded in its heritage, architecture, demographics, and economy. The Tucson region has over 500 non-profit organizations focused on arts and culture. Cultural events and festivals are held throughout the year and cater
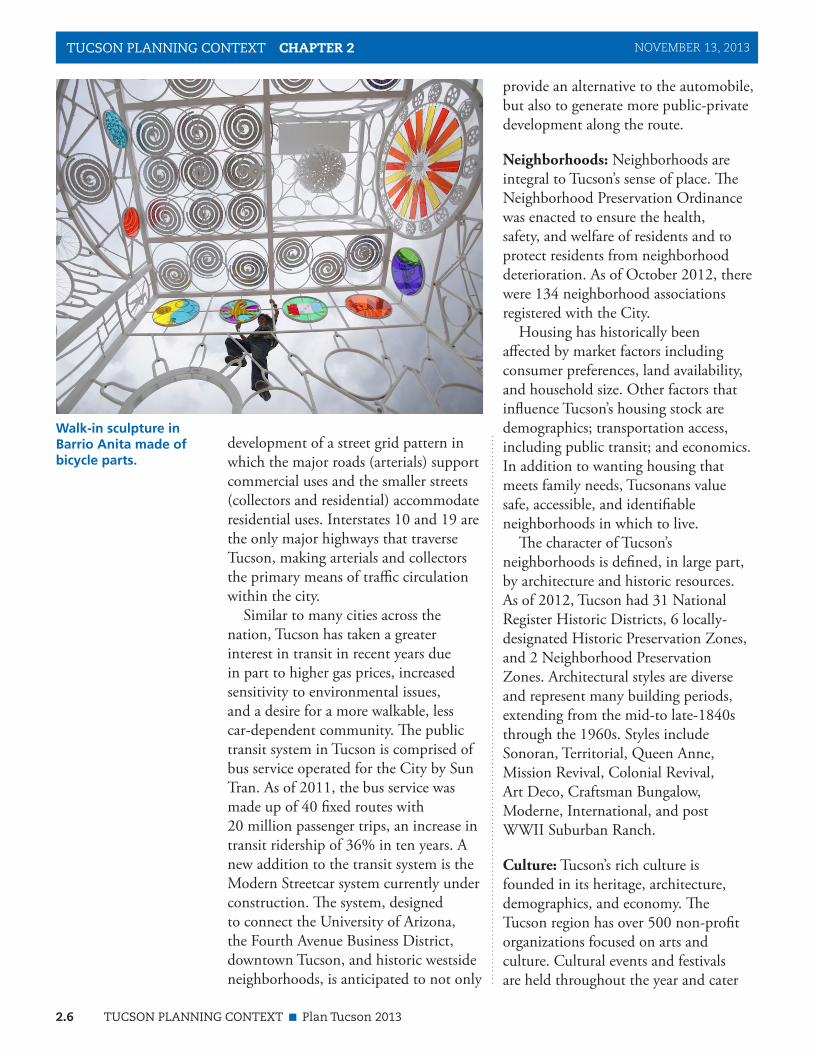
Walk-in sculpture in Barrio Anita made of bicycle parts.
TUCSON PLANNING CONTEXT CHAPTER 2 NOVEMBER 13, 2013

Plan Tucson 2013 TUCSON PLANNING CONTEXT 2.7
to people of all ages and backgrounds. Well-known events that attract visitors from outside the region include Tucson Meet Yourself, focusing on cultural diversity and food; Dia de Los Muertos All Souls Procession; the Fourth Avenue Street Fair; the Mariachi Conference; the Tucson Rodeo; and the world’s largest Gem and Mineral Show.
Music and theater performances are abundant in Tucson, and popular venues include the Temple of Music and Art, the Tucson Music Hall, the Fox Theater, the Rialto Theater, and the University of Arizona Centennial Hall. Prominent museums include the Tucson Museum of Art, the Center for Creative Photography, the Children’s Museum, the Pima Air and Space Museum, the
Museum of Contemporary Art, and the University of Arizona Art Museum. Major statewide cultural institutions such as the Arizona Historical Society, Arizona Opera Company, Arizona Theatre Company, and the Tucson Symphony Orchestra were founded in Tucson.
The Tucson Pima Arts Council administers the Percent for Art programs for the City and Pima County. One percent of the construction budget of major public construction projects is put toward the creation and installation of public art pieces. Since 1986, over 200 public art projects have been completed in metropolitan Tucson and Pima County.
CHAPTER 2 TUCSON PLANNING CONTEXT
EXHIBIT T-5 Tucson Awards and Recognitions
Year Award or Recognition Organization Recognizing Tucson
2012 Fifth highest spending per capita on cyclist/pedestrian amenities Alliance for Biking and Walking
2011 One of the “10 Best Places to Retire if You Love the Outdoors” AARP
2011 One of the “10 Great Retirement Cities in the U.S.” Kiplinger
2011 Ranked #9 in “Top 10 Cities for Veterans” Livability.com
2011 Ranked #15 in top “25 Best Places to Retire” CNN Money
2011 Included in Outside Magazine’s “Best Towns 2011” Outside Magazine
2011 Ranked #6 for Aerospace/Defense Manufacturing Business Facilities
2011 One of “10 Great Places for City Cycling” USA Today Travel
2011 Ranked #1 “Best Cities for Renters” Forbes
2011 Ranked #4 Best Cities for Public Transportation and Job Access Brookings Institution
2011 One of the “World’s Most Underrated Cities” Yahoo Travel
2011 One of the City’s ranked in “Housing Markets: Best Recovery Bets” CNN Money
2010 Ranked #10 “25 Best Places to Retire” CNN Money
2010 Named Best Town for Road Biking Outside Magazine
2010 Ranked #1 in alternative enery leadership Business Facilities
2010 Ranked #19 in “America’s Most Innovative Cities” Forbes
2010 Included as one of “20 Towns of the Future” Sunset
2010 Ranked #8 “Best Cities for Commuters” Forbes
2009 Ranked #1 “Best Affordable Places to Retire.” Bloomberg Business Week
2009 Included as one of the “Best Adventure Towns” National Geographic
2009 Ranked #1 “Best Places to Live a Simple Life” AARP
2009 Included, “Fast Cities” Fast Company
2009 Ranked #13, “Top 25 Fittest Cities” Men’s Fitness
Exhibit T-5 Illustrates the many accolades received by Tucson in recent years.
NOVEMBER 13, 2013
2.8 TUCSON PLANNING CONTEXT Plan Tucson 2013
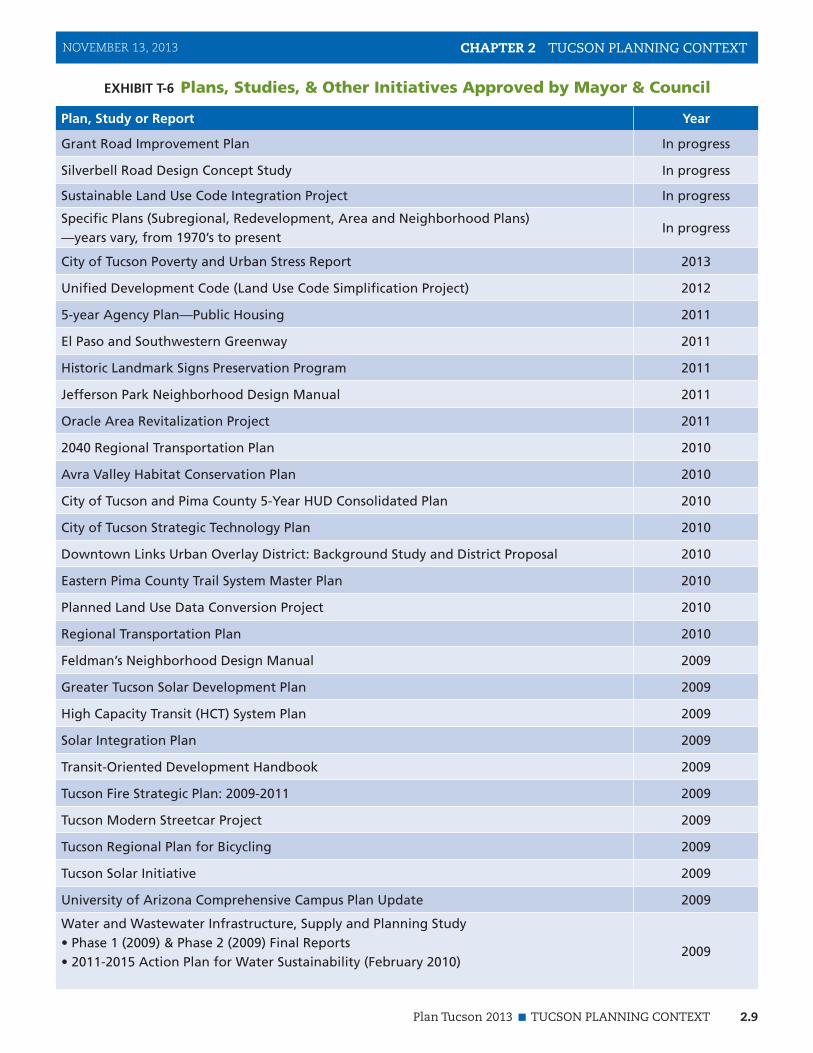
Prior Planning Efforts: Since adoption of the 2001 Tucson General Plan, the City’s Mayor and Council have endorsed or approved a variety of studies, plans, and reports and have adopted policies and directives. A review of these documents was conducted in the preparation of Plan Tucson (Exhibit T-6, pg 2.9).
Community Values & Visions
Long-term planning for a community, such as that done for a General Plan, should acknowledge shared values and envision a future built on those values. The 2001 General Plan was informed by the 1997 Livable Tucson Vision Program, which explored Tucsonans’ values and visions for the city through a series of forums and workshops and which still has much to contribute to Plan Tucson. Subsequent to that program and the adoption of the 2001 Plan, there were further efforts initiated by both governmental and nongovernmental entities to understand and integrate values and visions into community planning. These efforts included Town
Halls; Community Conversations; and in 2010 the Imagine Greater Tucson Project (IGT), a regional project focused on producing a vision for the Eastern Pima County region.
These visioning efforts provided a starting place for Plan Tucson. Rather than conducting a separate visioning effort, the Plan Tucson approach was to:• review the values and visions provided
through the other efforts to determine if there were any basic inconsistencies
• explore with Plan Tucson participants their aspirations for Tucson’s future and to consider those in light of the earlier values and visions
• look carefully at participants’ input during Plan Tucson workshops, meetings, and forums for any underlying values that ran counter to those identified through the other effortsPerhaps not surprisingly, this visioning
approach revealed remarkable consistency between values overtly stated in previous efforts and those that were implied in the goal and policy development process for Plan Tucson. In summary those shared values are:• good jobs • a strong economy • quality education • a clean and safe built environment • a protected natural environment • a healthy population • cohesive and attractive neighborhoods • access to multiple forms of
transportation • a vibrant and diverse cultural life • a sustainable development pattern • a distinctive character for both Tucson
and for the region• an efficient, effective, and transparent
government
TUCSON PLANNING CONTEXT CHAPTER 2
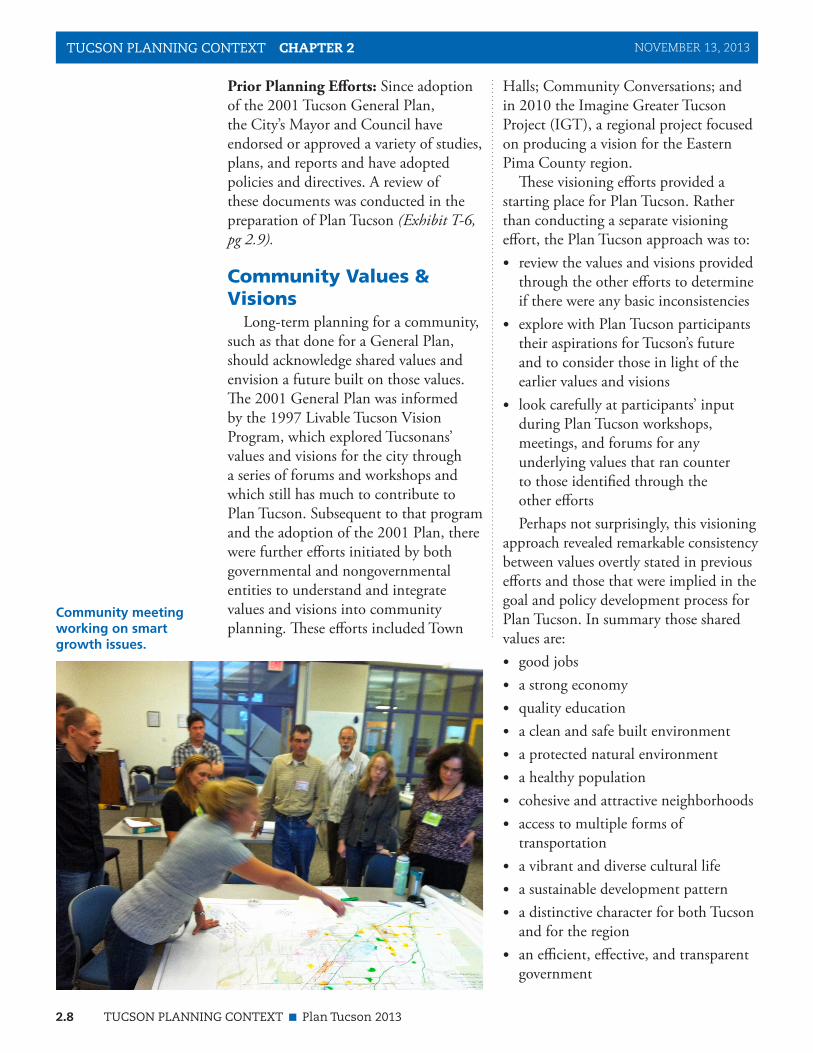
Community meeting working on smart growth issues.
NOVEMBER 13, 2013
Plan Tucson 2013 TUCSON PLANNING CONTEXT 2.9
CHAPTER 2 TUCSON PLANNING CONTEXT
Plan, Study or Report Year
Grant Road Improvement Plan In progress
Silverbell Road Design Concept Study In progress
Sustainable Land Use Code Integration Project In progress
Specific Plans (Subregional, Redevelopment, Area and Neighborhood Plans) —years vary, from 1970’s to present
In progress
City of Tucson Poverty and Urban Stress Report 2013
Unified Development Code (Land Use Code Simplification Project) 2012
5-year Agency Plan—Public Housing 2011
El Paso and Southwestern Greenway 2011
Historic Landmark Signs Preservation Program 2011
Jefferson Park Neighborhood Design Manual 2011
Oracle Area Revitalization Project 2011
2040 Regional Transportation Plan 2010
Avra Valley Habitat Conservation Plan 2010
City of Tucson and Pima County 5-Year HUD Consolidated Plan 2010
City of Tucson Strategic Technology Plan 2010
Downtown Links Urban Overlay District: Background Study and District Proposal 2010
Eastern Pima County Trail System Master Plan 2010
Planned Land Use Data Conversion Project 2010
Regional Transportation Plan 2010
Feldman’s Neighborhood Design Manual 2009
Greater Tucson Solar Development Plan 2009
High Capacity Transit (HCT) System Plan 2009
Solar Integration Plan 2009
Transit-Oriented Development Handbook 2009
Tucson Fire Strategic Plan: 2009-2011 2009
Tucson Modern Streetcar Project 2009
Tucson Regional Plan for Bicycling 2009
Tucson Solar Initiative 2009
University of Arizona Comprehensive Campus Plan Update 2009
Water and Wastewater Infrastructure, Supply and Planning Study • Phase 1 (2009) & Phase 2 (2009) Final Reports • 2011-2015 Action Plan for Water Sustainability (February 2010)
2009
EXHIBIT T-6 Plans, Studies, & Other Initiatives Approved by Mayor & Council
NOVEMBER 13, 2013

2.10 TUCSON PLANNING CONTEXT Plan Tucson 2013
Plan, Study or Report Year
Downtown Urban Design Reference Manual 2008
Framework for Advancing Sustainability 2008
Greater Southlands Habitat Conservation Plan 2008
Pima Cultural Plan: Needs Analysis and Strategies 2008
Update to the Water Plan: 2000-2050 2008
Urban Landscape Framework 2008
Downtown Infrastructure Study 2007
Emergency Operations Plan 2007
Tucson Post World War II Residential Subdivision Development Report (1945-1973) 2007
City of Tucson Parks and Recreation Ten-Year Strategic Service Plan 2006
Drought Response and Preparedness Plan 2006
Regional Transportation Authority Plan 2006
Stone Avenue Corridor Project 2006
Tucson Economic Blueprint, Strategic Analysis Report 2006
U.S. Mayor’s Climate Protection Agreement 2006
Water Efficiency: Water Conservation Program Recommendations for Tucson Water’s Future
2006
Greater Tucson Strategic Energy Plan 2005
Greyhound Transportation and Feasibility Study 2005
Human Services Plan, Fiscal Years 2007 & 2008 2005
Ronstadt Transit Center Transportation and Feasibility Study 2005
Urban Environmental Accords 2005
Affordable Housing in Downtown Tucson 2004
Davis-Monthan AFB/Tucson/Pima County Joint Land Use Study 2004
Downtown Parking Master Plan 2004
Plan for Annexation 2004
Tucson Historic Warehouse Arts District Master Plan 2004
Transportation Access Management Guidelines for the City of Tucson 2003
Patriot Act’s Critical Infrastructure 2001
Rio Nuevo Master Plan, 10-Year Development and Long-Range Vision 2001
Sonoran Desert Conservation Plan 2001
EXHIBIT T-6 Plans, Studies, & Other Initiatives Approved by Mayor & Council (continued)
TUCSON PLANNING CONTEXT CHAPTER 2 NOVEMBER 13, 2013
Plan Tucson 2013 TUCSON PLANNING CONTEXT 2.11
CHAPTER 2 TUCSON PLANNING CONTEXT
These shared values together create a vision of a community that will not just survive, but will thrive, for years to come–that is, a sustainable community as discussed in the next section.
A Sustainable Community In a very general sense, sustainability
refers to a condition in which human activities enhance economic development, social equity, and environmental health while remaining within the carrying capacity of the natural environment. In Tucson this means fully embracing the knowledge that this is a desert community and then applying that knowledge to all aspects of community life to ensure that the city is a place in which future generations can and will want to live.
In April 2012, the Mayor and Council directed staff to update the City’s “Framework for Advancing Sustainability,” adopted by Mayor and Council in 2008. The purpose of the update was to provide a more comprehensive vision for a sustainable future for Tucson. The resulting updated “framework for sustainability” is integrated throughout Plan Tucson.
How a community pursues sustainability is shaped by its particular context and values. The goals and policies in Plan Tucson reflect and support community values and are the catalyst for preserving and improving the community’s quality of life. The goals and policies signal the direction in which the community has said it wishes to go and will guide the City’s strategic
and, therefore, have more options to choose where they locate. Additionally, Tucson needs to continue providing, along with its weather, the quality of life and venues that attract tourists, winter visitors, and sporting, cultural, and other special events. All of these are essential to the community’s long-term economic prosperity and social continuity, which translates to sustainability.
While Tucson’s pursuit of sustainability must respond to local factors, the community is part of a larger national and international context, and Tucson must consider its sustainability efforts within this larger context also. The City’s “framework for sustainability” not only reflects community values and visions, but also aligns with emerging national sustainability guidelines.
efforts toward a more sustainable future. As such, Plan Tucson also serves as an essential foundation for establishing a community sustainability plan.
To achieve the long-term goals presented at the end of this chapter requires that Tucson continue to be a place where multiple generations of families choose to live because they value the quality of life, and because their children have ample opportunities to find jobs, establish careers, and ultimately provide a good future for their own families. Tucson must also be a place that maintains and supports local businesses while drawing high-tech, high-wage industries to the area. High-tech industries look for locations where the quality of life appeals to the highly-skilled workers who are in demand
“A modern sustainability vision for Tucson is to be the world’s leader and source of innovation for more efficient,
more prosperous, and healthier desert living.”—Climate Change Committee, City of Tucson, 2013
NOVEMBER 13, 2013

2.12 TUCSON PLANNING CONTEXT Plan Tucson 2013
TUCSON PLANNING CONTEXT CHAPTER 2
As discussed in Chapter 4, Implementation & Administration, progress toward community sustainability comes about through development of more detailed functional and specific plans, and the day-to-day implementation of the annual work program. For the goals and policies in a General Plan to support long-term community sustainability, there needs to be an understanding of ideal conditions or outcomes and indicators by which progress toward these ideals can be assessed. In the process of developing Plan Tucson many stakeholders said, for example, that they want more use of solar energy in the community. The ideal outcome for this goal would be complete reliance on renewable energy sources, which was also expressed by stakeholders. Tracking the percentage of local energy use that is provided by renewable sources gives an indication of where the community stands relative to that ideal state. Setting ideal sustainability outcomes is ambitious and not wholly achievable. Progress toward one outcome requires some compromise with respect to other outcomes. This makes the use of indicators doubly important as they provide a means of assessing the extent to which there is balance in the pursuit of
these ideals, i.e., progress in some areas is not being sacrificed to excel in others. Finally, establishing ideal outcomes for the community, while a daunting task, means there is no compromise on principles of equity, fairness, justice, prosperity, livability, and environmental integrity. While the community will likely never get to the point that every person has a job, no one lives in poverty, all residents can afford a home, only renewable sources of energy are utilized, all businesses have the resources and tools to stay in business, and no natural desert areas or sensitive species are lost, the pursuit of these ideals is a lofty and worthwhile enterprise.
Ultimately, the world can only be sustainable, if all communities, in all regions and all nations are pursuing sustainability. Therefore, as Tucson moves ahead to implement Plan Tucson, including the development of more specific and functional plans and the identification of progress indicators, it is important to consider how sustainability is assessed at a larger scale. Exhibit T-7 provides an example of one tool that has recently been developed as a comprehensive and quantitative framework for guiding local sustainability efforts.
EXHIBIT T-7 STAR Community Rating System: An Example
One example of a tool that is now being used for measuring selected communities’ progress in achieving sustainability is the
STAR Community Rating System.
This system is described as
“the nation’s first voluntary, self-reporting framework for evaluating, quantifying, and improving the livability and
sustainability of U.S. communities” (http://www.starcommunities.org/rating-system)
The system addresses sustainability in elements similar to many addressed in Plan Tucson, including: Built Environment; Climate & Energy; Economy & Jobs; Education, Arts & Community; Equity & Empowerment; Health & Safety; and Natural Systems.
NOVEMBER 13, 2013
Plan Tucson 2013 TUCSON PLANNING CONTEXT 2.13
CHAPTER 2 TUCSON PLANNING CONTEXT
Neighborhoods: The Foundational Unit
At a fundamental level, the sustainability of a community is interwoven with the sustainability of its neighborhoods. Neighborhoods are the smaller systems that are part of the larger system that is the community. These systems need each other; the community needs the neighborhoods to establish its identity and basic quality of life, and the neighborhoods need the larger community, which provides infrastructure, services, and facilities, all of which cannot be located in any one neighborhood. Addressing this interconnectedness in a way that recognizes the importance of the neighborhood both as an individual entity and as a part of the greater community is one purpose of a General Plan.
Once upon a time a neighborhood might literally have been a resident’s world; today physical and virtual modes of transport allow many residents to go far beyond the boundaries of their neighborhoods on a daily basis. Despite this ability, however, it is generally the
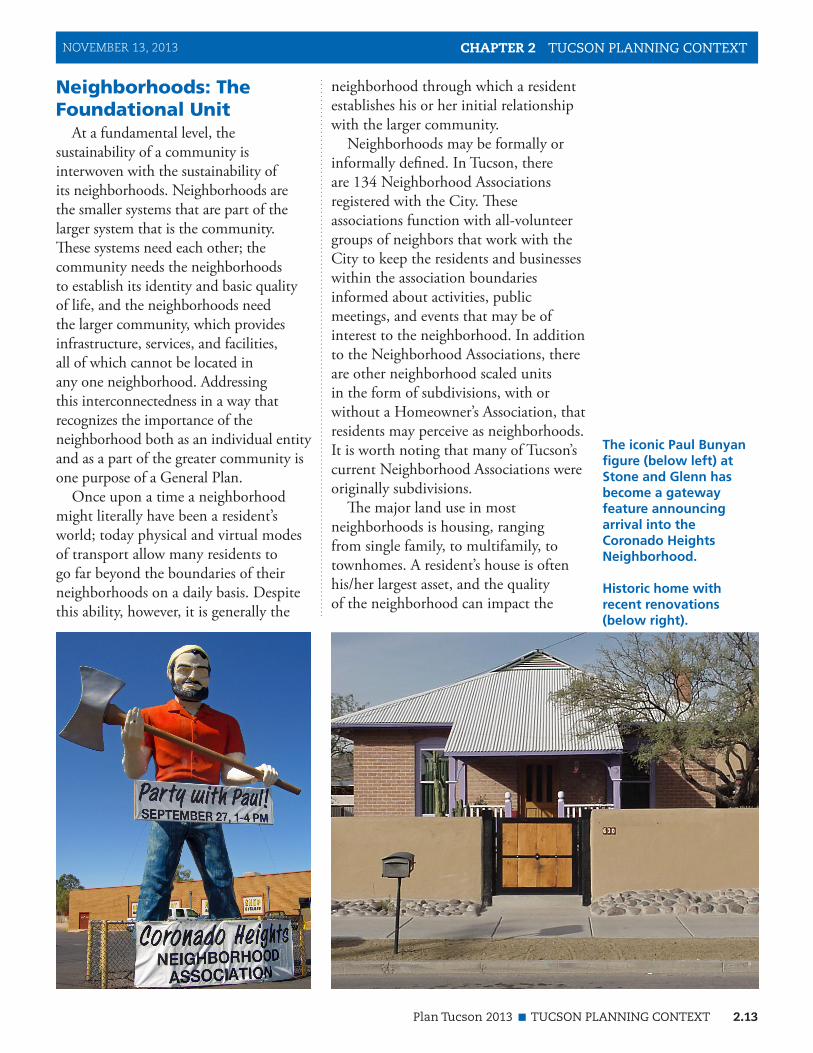
The iconic Paul Bunyan figure (below left) at Stone and Glenn has become a gateway feature announcing arrival into the Coronado Heights Neighborhood. Historic home with recent renovations (below right).
neighborhood through which a resident establishes his or her initial relationship with the larger community.
Neighborhoods may be formally or informally defined. In Tucson, there are 134 Neighborhood Associations registered with the City. These associations function with all-volunteer groups of neighbors that work with the City to keep the residents and businesses within the association boundaries informed about activities, public meetings, and events that may be of interest to the neighborhood. In addition to the Neighborhood Associations, there are other neighborhood scaled units in the form of subdivisions, with or without a Homeowner’s Association, that residents may perceive as neighborhoods. It is worth noting that many of Tucson’s current Neighborhood Associations were originally subdivisions.
The major land use in most neighborhoods is housing, ranging from single family, to multifamily, to townhomes. A resident’s house is often his/her largest asset, and the quality of the neighborhood can impact the
NOVEMBER 13, 2013

2.14 TUCSON PLANNING CONTEXT Plan Tucson 2013
value of that asset. Therefore, better neighborhood conditions are often equated with more owner-occupied housing because owner occupants have a particular vested interest in the condition of their property. However, Tucson has a high rental rate in many of its neighborhoods. Some of these renters are college students; others are members of the “baby boomer” or “Y” generations, who prefer not to have the responsibilities of property maintenance; and many are individuals or families without the income to afford a house. More affordable housing would benefit the latter individuals and families, and the neighborhoods would benefit from the pride and care that often accompanies homeownership.
In many neighborhoods, businesses are located along the periphery or along traversing collector or arterial streets. While Tucson’s neighborhoods have traditionally been focused on residential issues, services provided by many local businesses help make a neighborhood an even more desirable place to live as the emphasis on sustainable lifestyles, including the option of walking to
daily services, is increasing. Businesses also often provide a regular presence and daytime activity that can be helpful in deterring neighborhood crime. Additionally businesses, such as restaurants, may become informal, gathering places for neighbors. Residents, local businesses, and institutions working together can strengthen a neighborhood.
Other vital components of a neighborhood are the public infrastructure and facilities that allow a neighborhood to stay connected internally and externally, provide services such as electricity and water, offer gathering spaces, and often create a first impression through landscaping, signage, and other features. The pursuit of projects to enhance the public realm is often what brings neighbors together. Examples of common projects are traffic calming improvements, gateway features, and planting trees for shade to encourage pedestrian activity and to beautify streetscapes.
While the physical make-up of neighborhoods is important, it’s the people who reside in those neighborhoods that make them come to life. The more vested residents are in
TUCSON PLANNING CONTEXT CHAPTER 2
A traffic calming circle in the Miles Neighborhood was the outcome of neighbors’ proactive response to safety concerns.
NOVEMBER 13, 2013
Plan Tucson 2013 TUCSON PLANNING CONTEXT 2.15
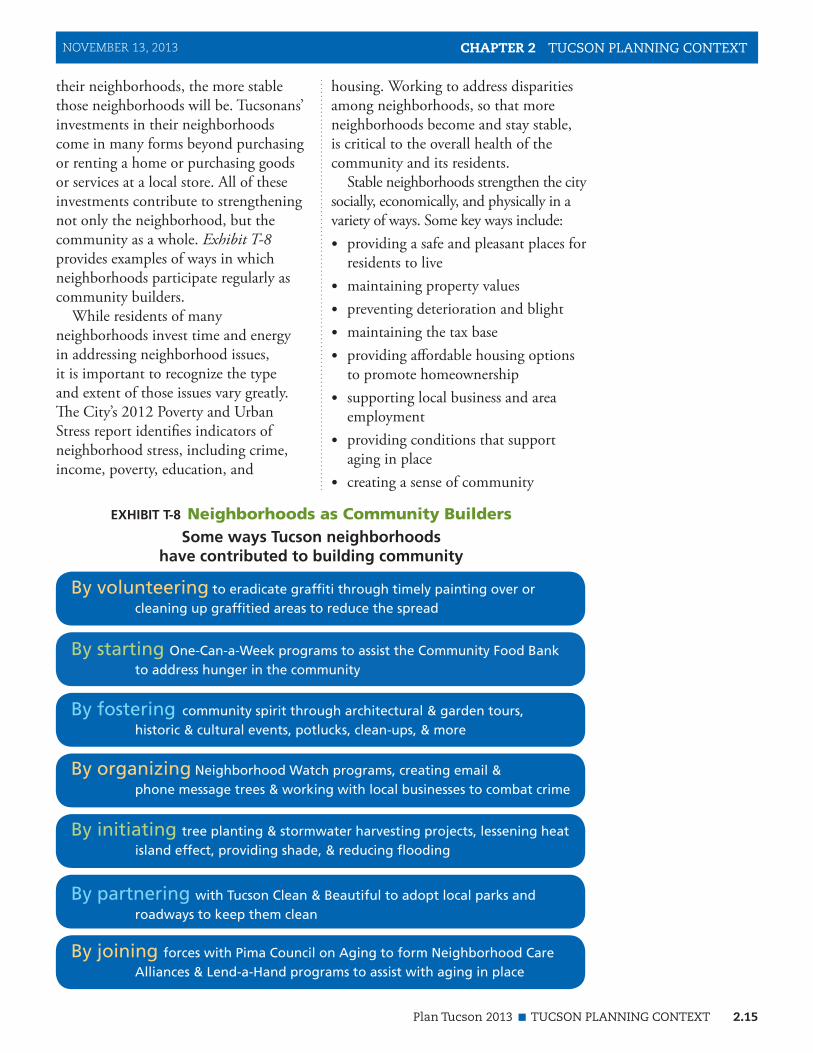
their neighborhoods, the more stable those neighborhoods will be. Tucsonans’ investments in their neighborhoods come in many forms beyond purchasing or renting a home or purchasing goods or services at a local store. All of these investments contribute to strengthening not only the neighborhood, but the community as a whole. Exhibit T-8 provides examples of ways in which neighborhoods participate regularly as community builders.
While residents of many neighborhoods invest time and energy in addressing neighborhood issues, it is important to recognize the type and extent of those issues vary greatly. The City’s 2012 Poverty and Urban Stress report identifies indicators of neighborhood stress, including crime, income, poverty, education, and
housing. Working to address disparities among neighborhoods, so that more neighborhoods become and stay stable, is critical to the overall health of the community and its residents.
Stable neighborhoods strengthen the city socially, economically, and physically in a variety of ways. Some key ways include:• providing a safe and pleasant places for
residents to live• maintaining property values• preventing deterioration and blight• maintaining the tax base• providing affordable housing options
to promote homeownership• supporting local business and area
employment• providing conditions that support
aging in place• creating a sense of community
CHAPTER 2 TUCSON PLANNING CONTEXT
EXHIBIT T-8 Neighborhoods as Community Builders
By volunteering to eradicate graffiti through timely painting over or cleaning up graffitied areas to reduce the spread
By starting One-Can-a-Week programs to assist the Community Food Bank to address hunger in the community
By fostering community spirit through architectural & garden tours, historic & cultural events, potlucks, clean-ups, & more
By organizing Neighborhood Watch programs, creating email & phone message trees & working with local businesses to combat crime
By initiating tree planting & stormwater harvesting projects, lessening heat island effect, providing shade, & reducing flooding
By partnering with Tucson Clean & Beautiful to adopt local parks and roadways to keep them clean
By joining forces with Pima Council on Aging to form Neighborhood Care Alliances & Lend-a-Hand programs to assist with aging in place
Some ways Tucson neighborhoods have contributed to building community
NOVEMBER 13, 2013

2.16 TUCSON PLANNING CONTEXT Plan Tucson 2013
All of the elements included in Plan Tucson that apply to the community as a whole also apply to neighborhoods. To emphasize the integrative nature of these elements, the policies relevant to neighborhoods are included across the elements presented in Chapter 3. While there is one goal and 27 policies that include the word “neighborhood,” the majority of Plan Tucson’s 25 goals and 186 policies are important to enhancing, maintaining and creating stable neighborhoods. Following the argument that the neighborhood is the
foundational unit of the city, then what affects the neighborhood will affect the city as a whole and vice versa.
Poverty & Prosperity Exhibit T-9 presents the top ten
metropolitan areas ranked by poverty, including Tucson, while Exhibit T-10 compares the poverty levels of Pima County with those of Tucson. This Plan contains a variety of policies to address poverty and its impacts on the community, including those policies related to the overall prosperity of
TUCSON PLANNING CONTEXT CHAPTER 2
Ranked Metro AreasPercent Living in
Poverty, 2011Comparative Cost of
Living to U.S.*
1. McAllen-Edinburg-Mission, Texas 37.7% -19
2. Fresno, California 25.8% +1
3. El Paso, Texas 24.7% -14
4. Bakersfield-Delano, California 24.5% -3
5. Modesto, California 23.8% +1
6. Tucson, Arizona 20.4% -9
7. Albuquerque, New Mexico 20.4% +3
8. Toledo, Ohio 20.2% -18
9. New-Orleans-Metairie-Kenner, Louisiana 19.5% -7
10. Lakeland-Winter Haven, Florida 19.4% -13
United States 15% 100
Source: American Community Survey, 2011
EXHIBIT T-9 Top Ten Metropolitan Areas Ranked by Poverty
University of Arizona Economist Marshall J. Vest recently clarified the much-cited report from the U.S. Census Bureau that Tucson is the sixth-poorest city in the country. "That's not true," Vest said, noting that the ranking only included metro areas with a population of 500,000 or more residents. He said the 2011 American Community Survey shows. . .
. . .the percentage of the population living in poverty is 20.4 percent in Tucson, ranking the city 105th
among micro and metro areas. He also pointed out that the average years of schooling for Tucsonans is 13.82, compared with the national average of 13.68. And more than 90 percent of the workforce in Tucson has at least a high school diploma.
Gabriela Rico, Arizona Daily Star, June 6, 2013
NOVEMBER 13, 2013

Plan Tucson 2013 TUCSON PLANNING CONTEXT 2.17
the region. Policies related to reduced poverty and increased prosperity can be categorized into three general approaches, which correlate with the areas focused on in Plan Tucson, i.e., the Social Environment, the Economic Environment, the Natural Environment, and the Built Environment.
First, poverty must be analyzed in reference to the causes. Limited household income, unusual cost burdens, lack of education and support, and declining health status are all factors that contribute to poverty. To mitigate the adverse impacts of these factors and pave the way for an increase in prosperity, the City must support the social environment.
Second, poverty is not a problem that is fixed by simply creating more jobs. There must be commensurate growth in the workforce and in job creation, resulting in a diversified economy and wages substantial enough to pay for basic goods and services that maintain a consistent standard of living. The City of Tucson 2012 Poverty and Urban Stress Report indicates that costs for housing, transportation, food, health care, and
other basic needs for a family of four requires an annual income $47,731. This number is close to the median annual income for the United States. Exhibit T-11 shows incomes for Tucson jobs that pay at or close to the self-sufficiency standard for Pima County.
Third, poverty must be evaluated in terms of the impact on the natural and built environments and its residual effects on neighborhoods, businesses, infrastructure, and facilities in areas with declining value and investment. In some of these areas, environmental and mobility conditions can also have an impact on household poverty. If there are vacant parcels in need of environmental remediation, repurposing or redevelopment opportunities without some additional resources may be limited. If a family cannot get to work or school, opportunities to get out of poverty may be limited. The City invests in community development activities, business incentives, redevelopment strategies, facilities and infrastructure, and a host of programs intended to improve and sustain a healthy environment.
CHAPTER 2 TUCSON PLANNING CONTEXT
0
5
10
15
20
25
30
EXHIBIT T-10 Comparison of Pima County and City of Tucson Poverty Levels
Pima County
City of Tucson
Perc
ent
Persons in Poverty, ACS Annual Data
2007Source: City of Tucson, Poverty and Urban Stress, 2012, p.1
2008 2009 2010 2011
NOVEMBER 13, 2013

2.18 TUCSON PLANNING CONTEXT Plan Tucson 2013
TUCSON PLANNING CONTEXT CHAPTER 2
GoalsAll of the Plan Tucson goals
are presented below and repeated as applicable in Chapter 3 at the beginning of each of the four focus areas: (1) The Social Environment, (2) The Economic Environment, (3) The Natural Environment, and (4) The Built Environment.
Together the goals speak to a sustainable community that embraces prosperity, equity, and a healthy environment.
Each goal below is a desired outcome for Tucson’s future, completing the sentence that begins “The City strives for…”.
Job/Source Estimated Amount or Annual Mean Wage
Self-Sufficiency Standard for Pima County (2012)1 $47,731
Average Social Security Benefit in Pima County (2010)2 $13,232
U.S. Poverty Level (2012 Family of Four)3 $23,681
Tucson’s Median Household Income (2011)4 $35,362
All Jobs for 348,480 Tucson Employees (2012)5 $42,530
Education Administrators, Preschool and Childcare Center/Program5 $42,500
Food Service Managers5 $44,870
Property, Real Estate and Community Association Managers5 $44,360
Wholesale and Retail Buyers5 $47,180
Human Resources Specialists5 $49,890
Meeting, Convention and Event Planners5 $49,760
Fund Raisers5 $49,760
Appraisers and Assessors of Real Estate5 $48,710
Insurance Underwriters5 $46,010
Credit Counselors5 $45,300
Tax Preparers5 $36,580
Computer User Support Specialists5 $46,660
U.S. Median Household Income 20114 $50,054
Purchasing Agents5 $53,260
Claims Adjusters, Examiners, and Investigators5 $51,410
Compensation benefits, and Jobs Analysis Specialists5 $53,040
Training and Development Specialists5 $56,610
Market Research Analysts5 $52,140
Computer Network Support Specialists5 $50,920
Tucson’s High Volume Occupations in 20125 $59,000–$88,000
Management Occupations (18,740)5 $88,130
Business and Financial Operations Occupations (15,200)5 $59,500
Computer and Mathematical Occupations (10,060)5 $74,260
Sources: 1How Much Is Enough in Your County, Women’s Foundation of Southern Arizona, 2012; 2U.S. Social Security Administration, Dec. 2010; 3Health and Human Services, 2012 HHS Poverty Guidelines; 42011 American Community Survey; 5May 2012 Metropolitan and Non-metropolitan Area Occupational Employment and Wage Estimates for Tucson, Arizona, U.S. Bureau of Labor Statistics
EXHIBIT T-11 A Sampling of 2012 Employment Income by Job Classification Compared to Poverty, Social Security, and Local/National Benchmarks
NOVEMBER 13, 2013
Plan Tucson 2013 PLAN TUCSON GOALS 2.19
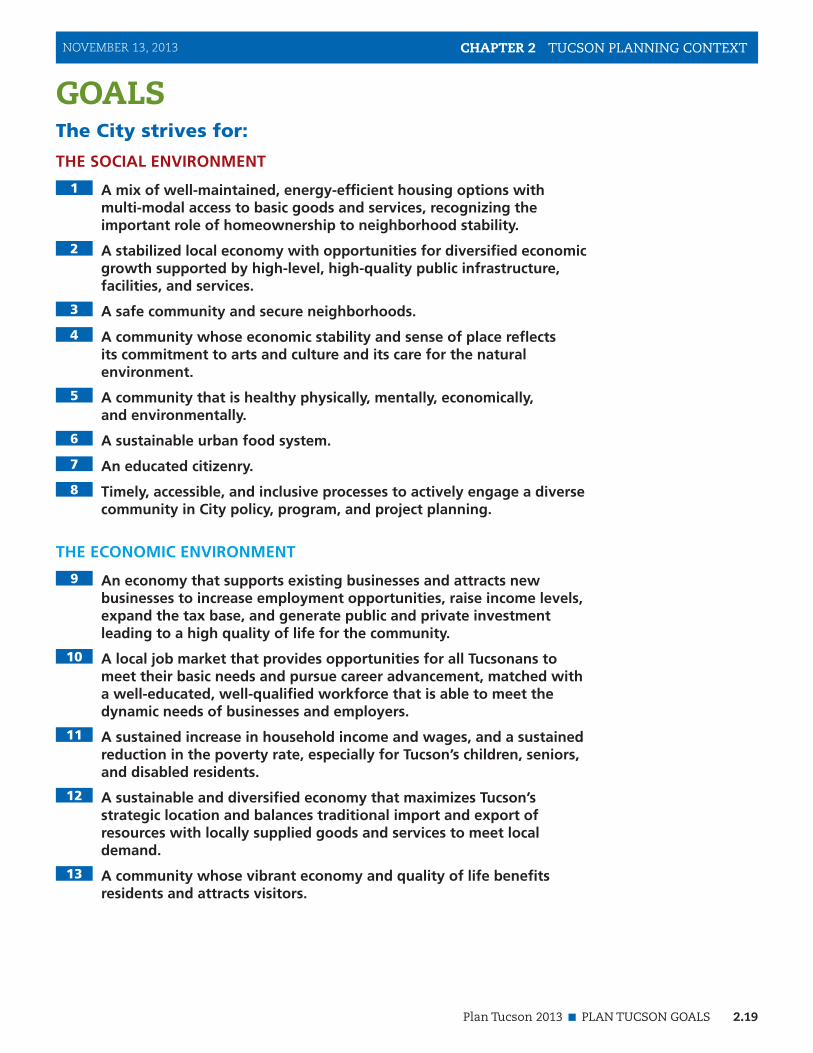
GOALS The City strives for:
THE SOCIAL ENVIRONMENT
1 A mix of well-maintained, energy-efficient housing options with multi-modal access to basic goods and services, recognizing the important role of homeownership to neighborhood stability.
2 A stabilized local economy with opportunities for diversified economic growth supported by high-level, high-quality public infrastructure, facilities, and services.
3 A safe community and secure neighborhoods.
4 A community whose economic stability and sense of place reflects its commitment to arts and culture and its care for the natural environment.
5 A community that is healthy physically, mentally, economically, and environmentally.
6 A sustainable urban food system.
7 An educated citizenry.
8 Timely, accessible, and inclusive processes to actively engage a diverse community in City policy, program, and project planning.
THE ECONOMIC ENVIRONMENT
9 An economy that supports existing businesses and attracts new businesses to increase employment opportunities, raise income levels, expand the tax base, and generate public and private investment leading to a high quality of life for the community.
10 A local job market that provides opportunities for all Tucsonans to meet their basic needs and pursue career advancement, matched with a well-educated, well-qualified workforce that is able to meet the dynamic needs of businesses and employers.
11 A sustained increase in household income and wages, and a sustained reduction in the poverty rate, especially for Tucson’s children, seniors, and disabled residents.
12 A sustainable and diversified economy that maximizes Tucson’s strategic location and balances traditional import and export of resources with locally supplied goods and services to meet local demand.
13 A community whose vibrant economy and quality of life benefits residents and attracts visitors.
CHAPTER 2 TUCSON PLANNING CONTEXTNOVEMBER 13, 2013

2.20 PLAN TUCSON GOALS Plan Tucson 2013
THE NATURAL ENVIRONMENT14 A reputation as a national leader in the development and use of
locally renewable energy technologies, water conservation, waste diversion and recovery, and other emerging environmentally-sensitive industries.
15 A reduction in the community’s carbon footprint, and greater energy independence.
16 A community that is resilient and adaptive to climate change.
17 Abundant and appropriate use of native plants and trees.
18 A network of healthy, natural open space managed for multiple benefits.
19 A secure, high quality, reliable, long-term supply of water for humans and the natural environment.
20 A comfortable, attractive, and pollution-free environment.
21 Sound, efficient, ecological policies and practices in government and in the private sector.
THE BUILT ENVIRONMENT22 Well-maintained public facilities and infrastructure that support
coordinated cost-effective service delivery for current and future residents.
23 A community that respects and integrates historic resources into the built environment and uses them for the advancement of multiple community goals.
24 Strategic public and private investments for long-term economic, social, and environmental sustainability.
25 An urban form that conserves natural resources, improves and builds on existing public infrastructure and facilities, and provides an interconnected multi-modal transportation system to enhance the mobility of people and goods.
TUCSON PLANNING CONTEXT CHAPTER 2 NOVEMBER 13, 2013