
Operational Seasonal Forecasting for Bangladesh: Application of quantile-to-quantile mapping
date post
19-Dec-2015Category
view
213download
0
1
Enhancing Firm Profitability: A Dynamic Perspective Using Quantile
Regression
Ming-Yuan Leon Li
Department of AccountancyGraduate Institute of Finance and BankingNational Cheng Kung University, Taiwan
June, 2007
2
Outline This Paper Financial data for U.S. firms listed during 1996-
2005 Examine numerous determinants of firm
profitability Quantile regression model versus OLS and LAD
estimates The nonlinearities derived from conditional
quantile regression size, significance and sign
The results are consistent with the theory of firm lifecycle
3
Motivations
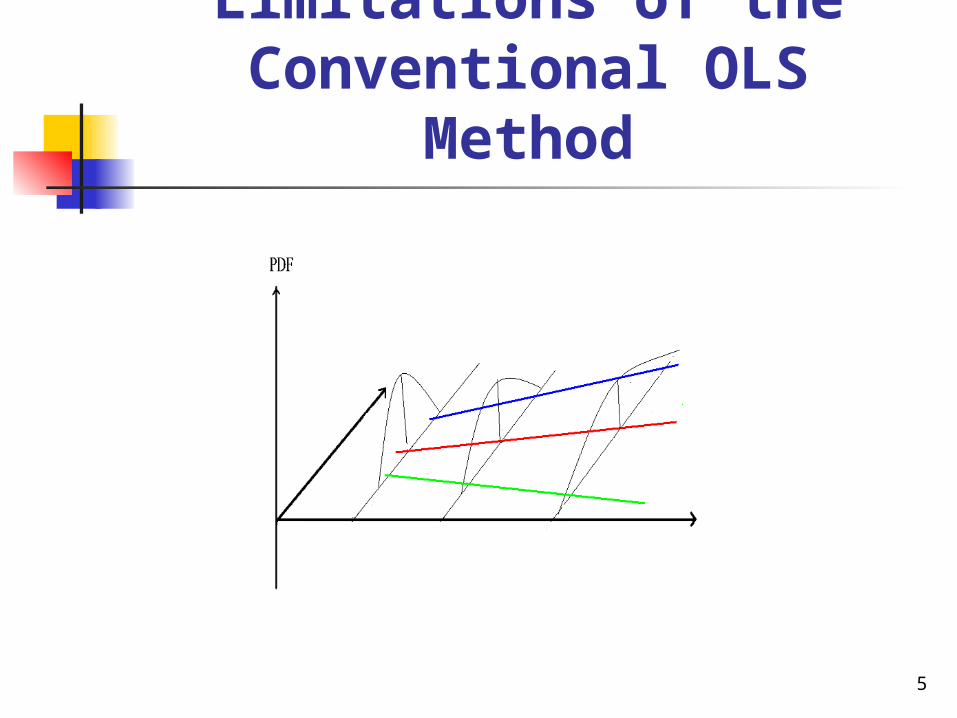
Limitations of OLS and LAD methods Central behaviors only Conditional mean
Qunantitle Regression Whole distribution Conditional distribution
4
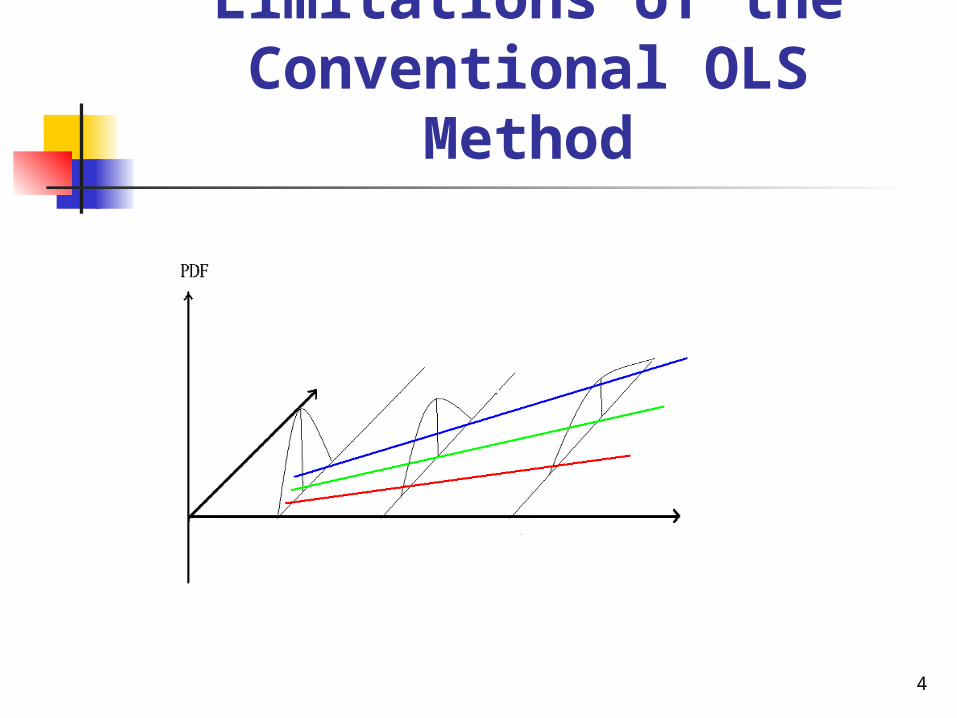
Limitations of the Conventional OLS Method
5
Limitations of the Conventional OLS Method
6
Key Question
The impacts of the identified determinants of profitability performance on firms are consistent with different levels of firm’s profitability quantiles?
7
Motivations
Firm life cycle Adizes (1988):
Business strategies and organizational structures of firms vary according to the problems faced at different life cycle stages of the organization

8
Prior Studies on Life-cycle Theory
The concept of corporate life-cycle stage has generated considerable applied interest
Dodge et al. (1994) on the relationship between operation strategies and life cycles
Beldona et al. (1997) and Robinson (1998) on effects of operation strategies on performance at various firm life cycle stages
Kimberley and Miles (1980) and Dodge and Robins (1992) positing that organization structure reflects current life cycle stage
Adizes (1979); Miller and Friesen (1984); Alexander et al. (1993); and Maturi (1999) examining the relationship between CEO leadership styles and life cycle stages
Anthony and Ramesh (1992), Black (1998) and Jorion and Talmor (2001) testing the impact of life-cycle on corporate earnings.
9
Key Limitation of Prior Studies
Segment sample companies into various subsets Use criteria such as earnings and/or age Apply traditional optimization techniques
such as ordinary least squares (OLS) and least absolute deviation (LAD) to fit their subsets
10
Key Limitation of Prior Studies
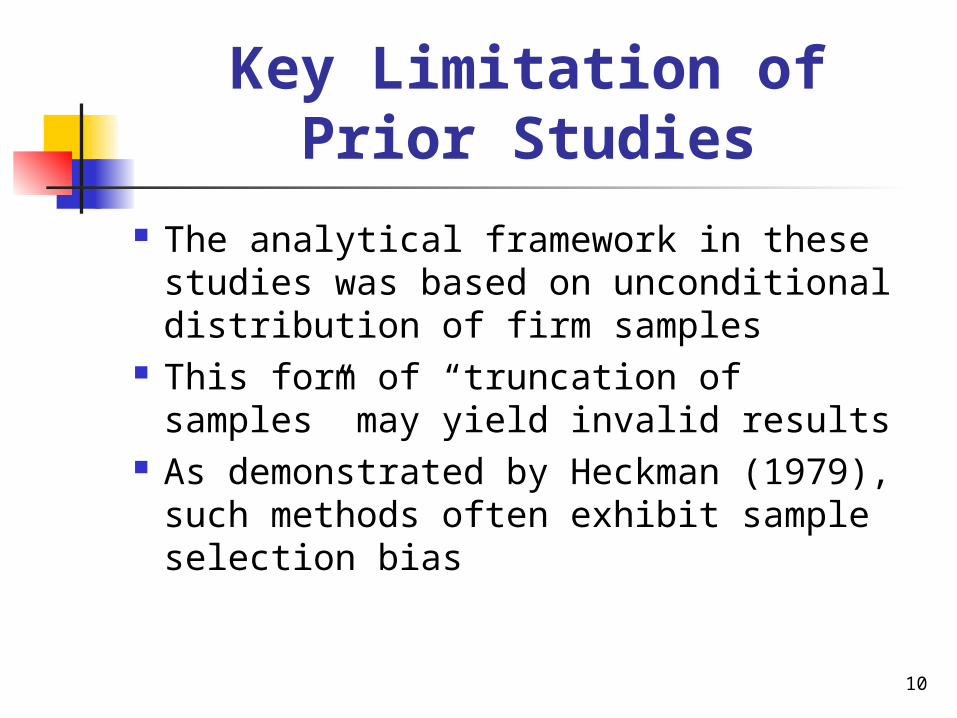
The analytical framework in these studies was based on unconditional distribution of firm samples
This form of “truncation of samples” may yield invalid results
As demonstrated by Heckman (1979), such methods often exhibit sample selection bias
11
Key Advantage of Quantitle Regression
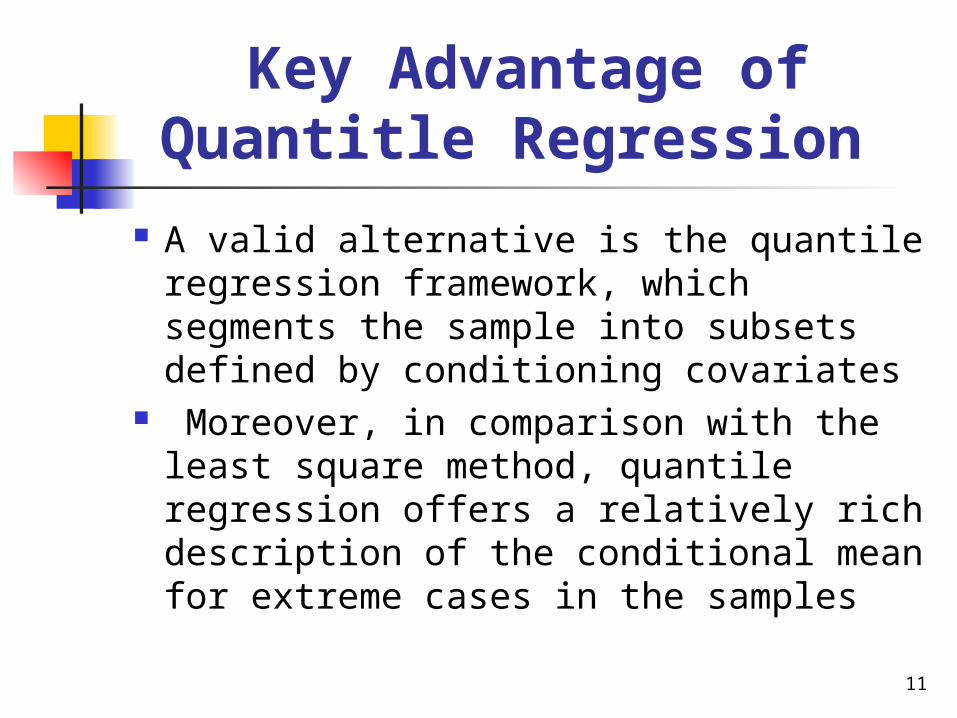
A valid alternative is the quantile regression framework, which segments the sample into subsets defined by conditioning covariates
Moreover, in comparison with the least square method, quantile regression offers a relatively rich description of the conditional mean for extreme cases in the samples
12
Key Advantage of Quantitle Regression
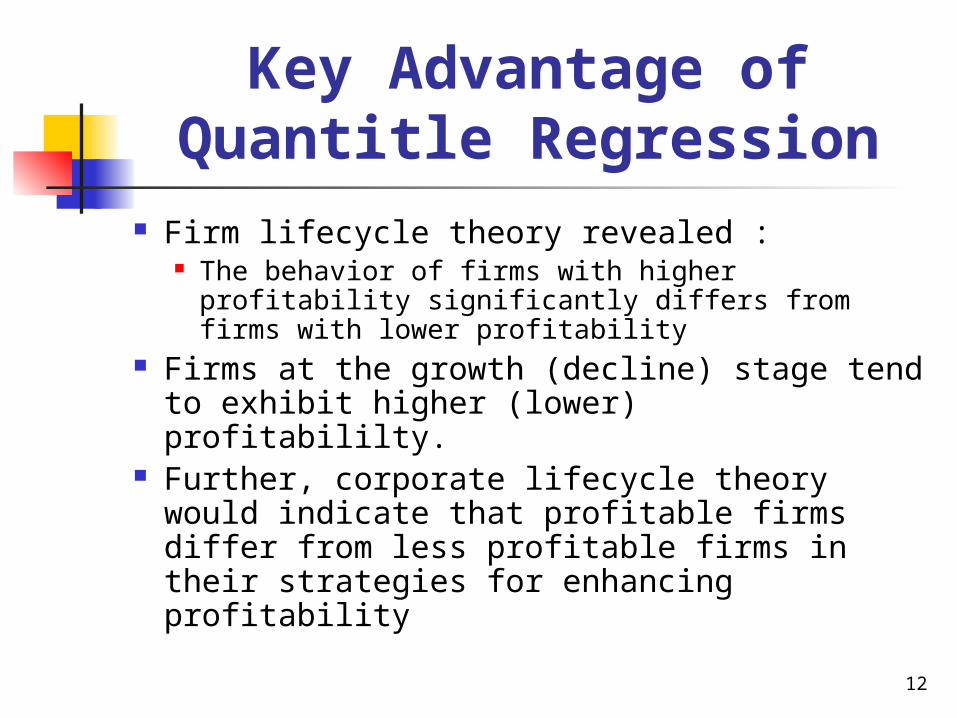
Firm lifecycle theory revealed : The behavior of firms with higher profitability
significantly differs from firms with lower profitability Firms at the growth (decline) stage tend to exhibit
higher (lower) profitabililty. Further, corporate lifecycle theory would indicate
that profitable firms differ from less profitable firms in their strategies for enhancing profitability
13
Empirical Methods
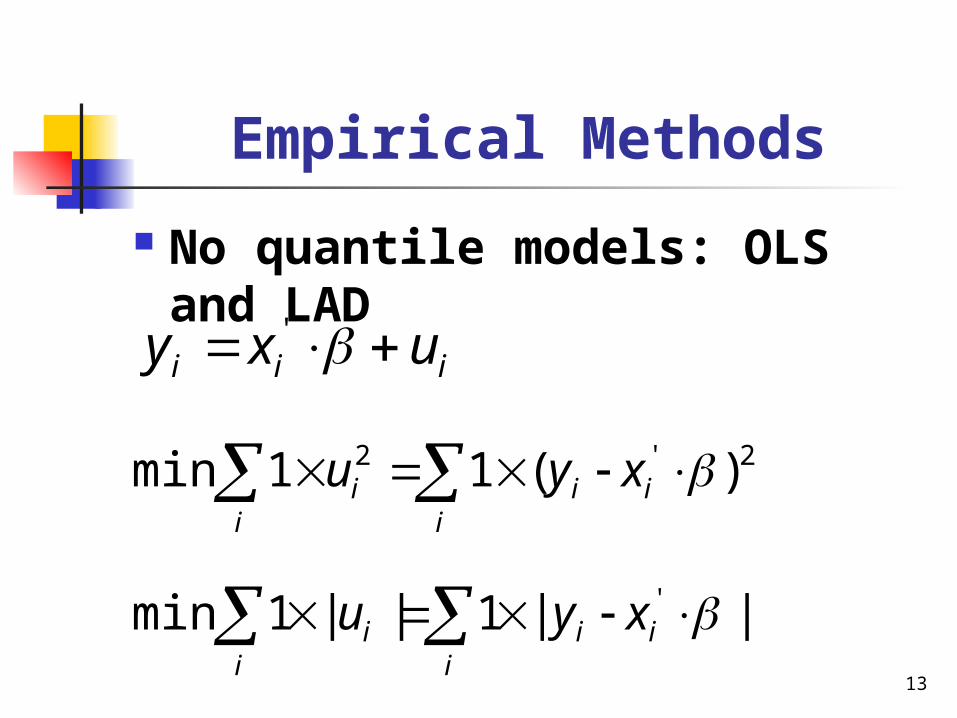
No quantile models: OLS and LAD
iii uxy '
2'2 )(11min ii
ii
i xyu
||1||1min ' ii
ii
i xyu
14
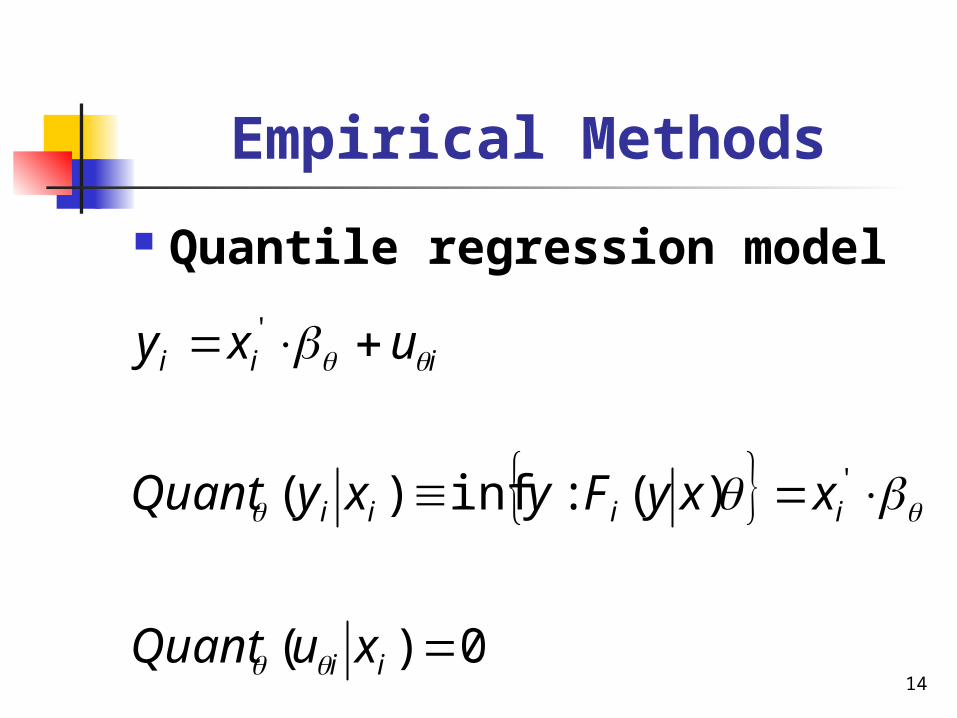
Empirical Methods
Quantile regression model
0)(
)(:inf)( '
'
ii
iiii
iii
xuQuant
xxyFyxyQuant
uxy
15
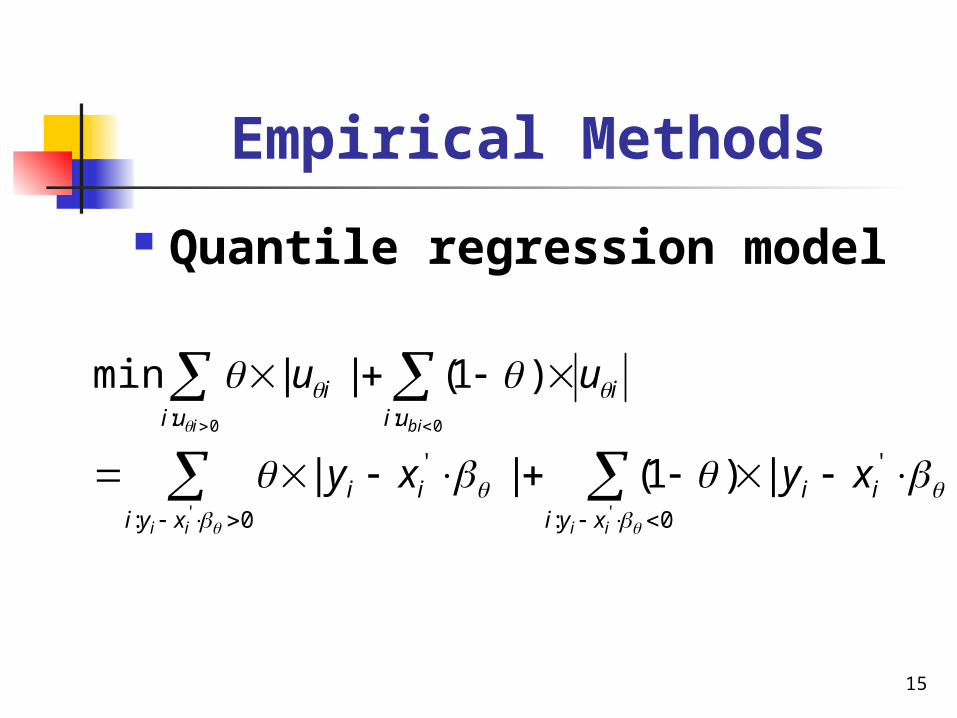
Empirical Methods
Quantile regression model
0: 0:
''
: :
' '
0 0
||)1(||
)1(||min
ii ii
i bi
xyi xyiiiii
ui uiii
xyxy
uu
16
Data Sample S&P500 firms over the 10-year period from 1996
to 2005 were analyzed Financial firms were excluded from the sample because
the nature of their liabilities and capital structure intrinsically differ from those of nonfinancial firms
Firms were also excluded from the analysis if the specified financial data were not available for the entire 10-year period
The final sample included 2,078 firm observations All data were obtained from the Compustat database.
17
Data Return on equity (ROE) was selected as the
proxy variable for firm profitability Five determinants of profitability were
recorded: R&D expense Company size Debt ratio Total asset turnover Current ratio
18
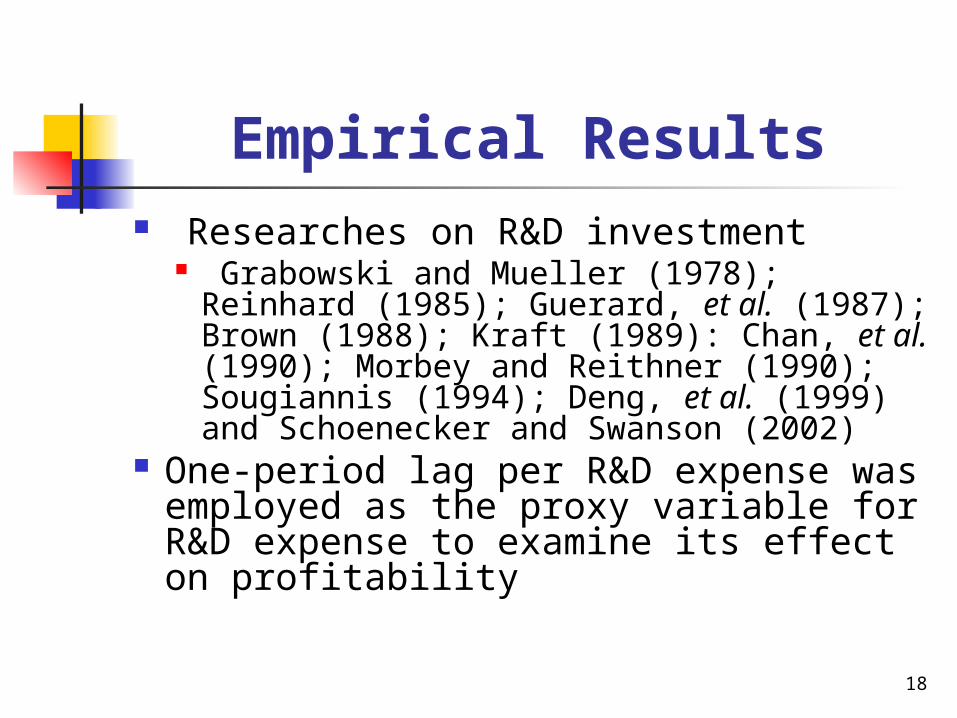
Empirical Results Researches on R&D investment
Grabowski and Mueller (1978); Reinhard (1985); Guerard, et al. (1987); Brown (1988); Kraft (1989): Chan, et al. (1990); Morbey and Reithner (1990); Sougiannis (1994); Deng, et al. (1999) and Schoenecker and Swanson (2002)
One-period lag per R&D expense was employed as the proxy variable for R&D expense to examine its effect on profitability
19
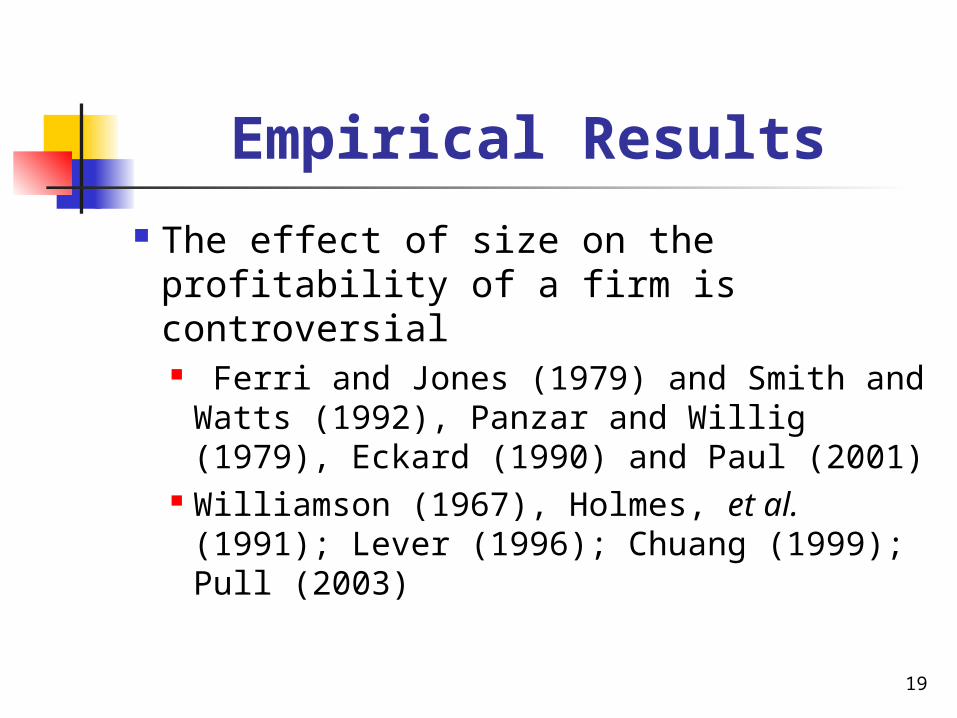
Empirical Results
The effect of size on the profitability of a firm is controversial Ferri and Jones (1979) and Smith and
Watts (1992), Panzar and Willig (1979), Eckard (1990) and Paul (2001)
Williamson (1967), Holmes, et al. (1991); Lever (1996); Chuang (1999); Pull (2003)
20
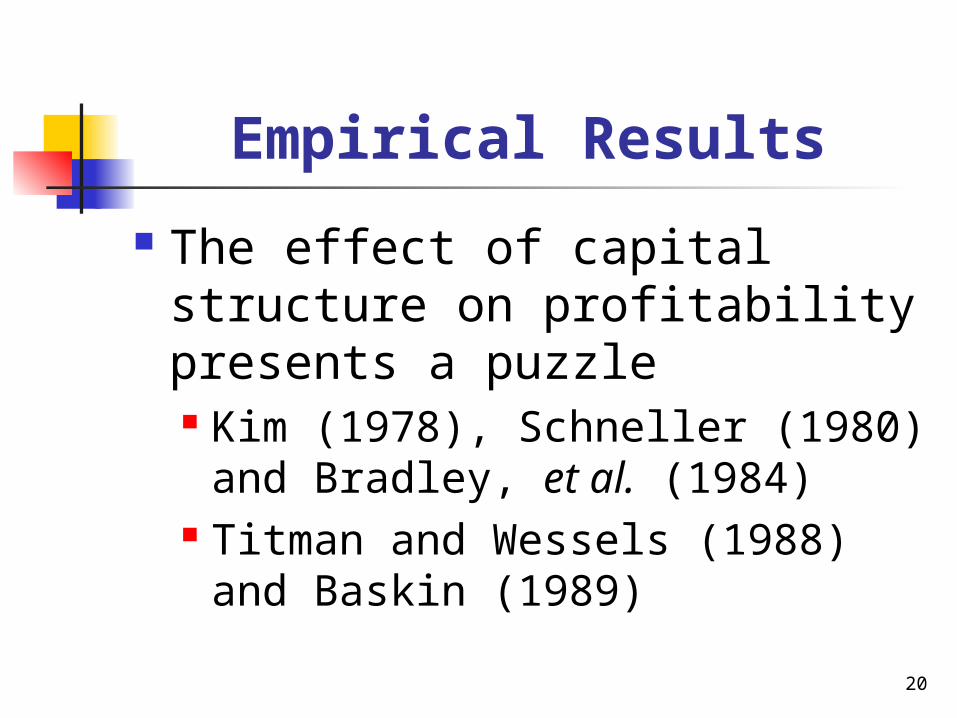
Empirical Results
The effect of capital structure on profitability presents a puzzle Kim (1978), Schneller (1980) and
Bradley, et al. (1984) Titman and Wessels (1988) and Baskin
(1989)
21
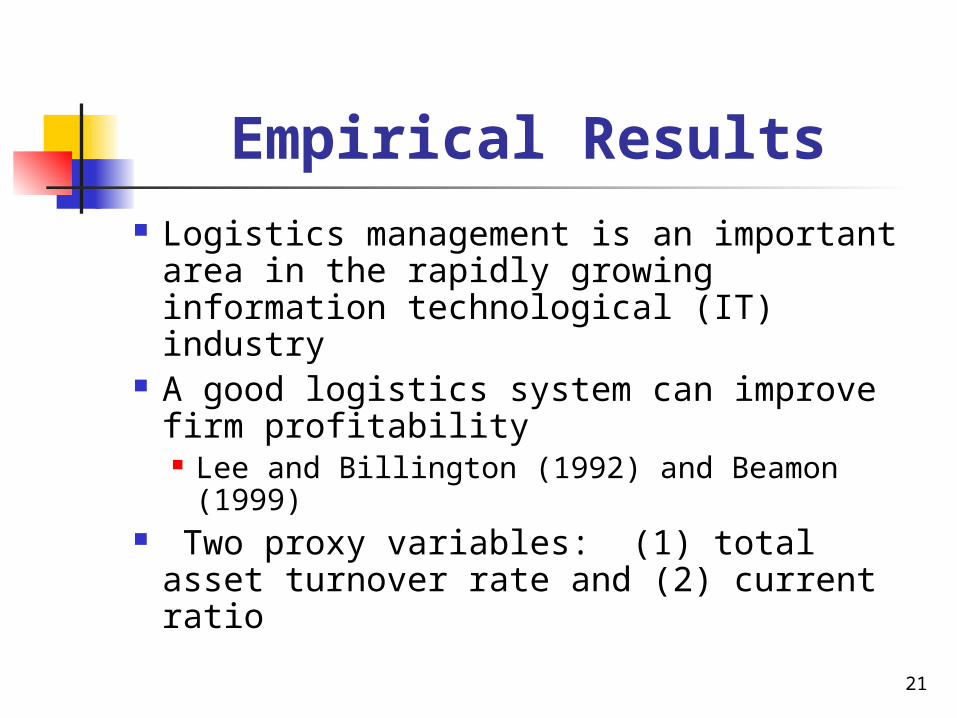
Empirical Results
Logistics management is an important area in the rapidly growing information technological (IT) industry
A good logistics system can improve firm profitability Lee and Billington (1992) and Beamon (1999)
Two proxy variables: (1) total asset turnover rate and (2) current ratio
22
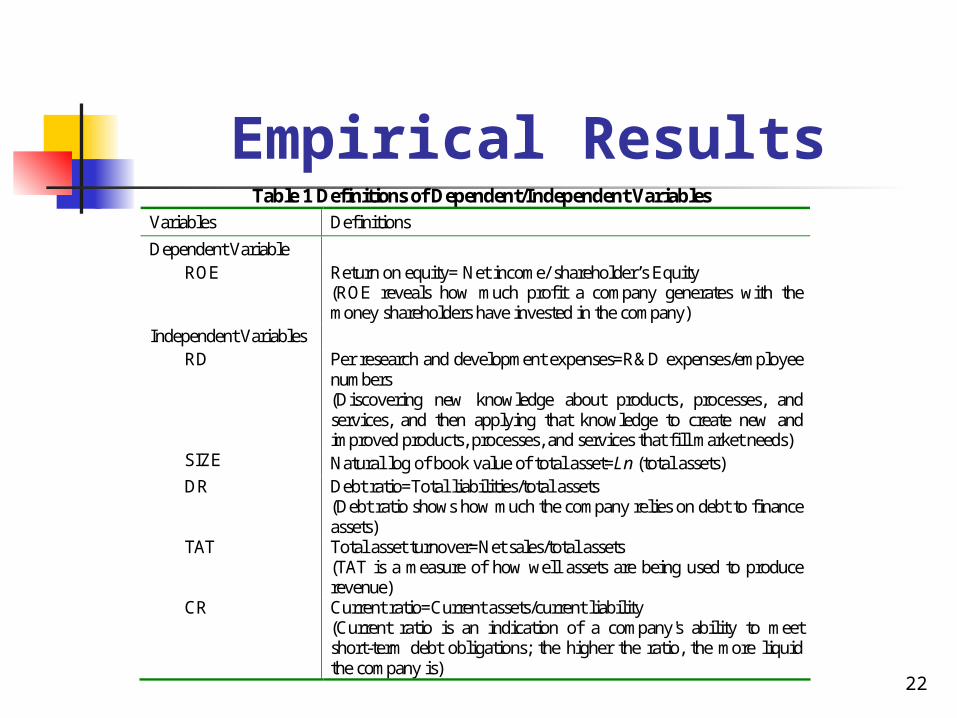
Empirical ResultsTable 1 Definitions of Dependent/Independent Variables
Variables Definitions
Dependent Variable ROE Return on equity= Net income/ shareholder’s Equity
(ROE reveals how much profit a company generates with the money shareholders have invested in the company)
Independent Variables RD Per research and development expenses=R&D expenses/employee
numbers (Discovering new knowledge about products, processes, and services, and then applying that knowledge to create new and improved products, processes, and services that fill market needs)
SIZE Natural log of book value of total asset=Ln (total assets) DR Debt ratio=Total liabilities/total assets
(Debt ratio shows how much the company relies on debt to finance assets)
TAT Total asset turnover=Net sales/total assets (TAT is a measure of how well assets are being used to produce revenue)
CR Current ratio=Current assets/current liability (Current ratio is an indication of a company's ability to meet short-term debt obligations; the higher the ratio, the more liquid the company is)
23
Empirical Results
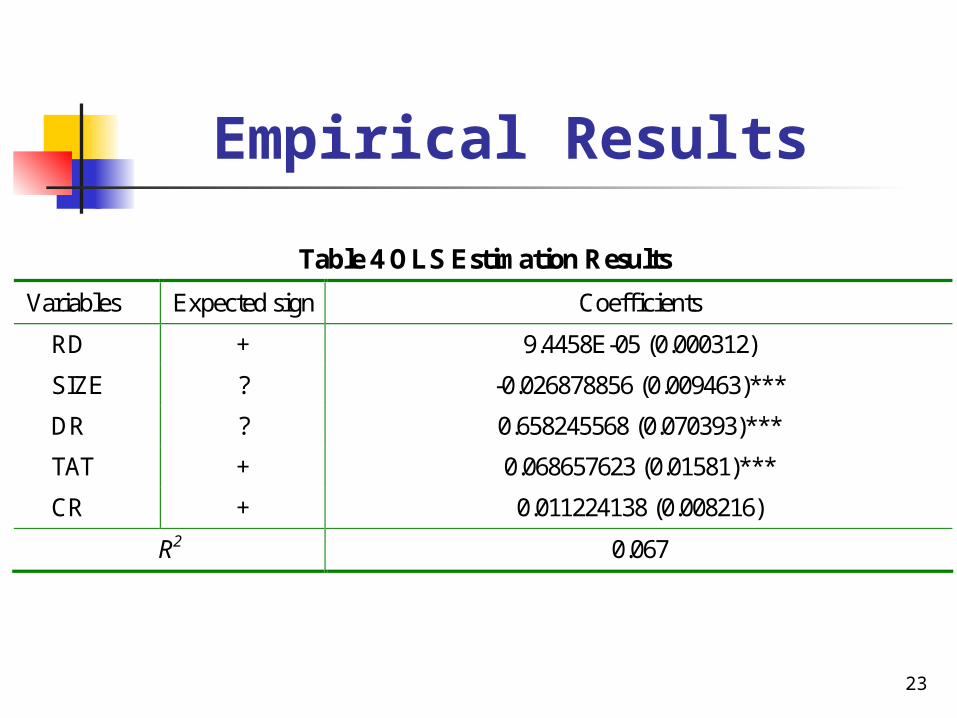
Table 4 OLS Estimation Results
Variables Expected sign Coefficients
RD + 9.4458E-05 (0.000312)
SIZE ? -0.026878856 (0.009463)***
DR ? 0.658245568 (0.070393)***
TAT + 0.068657623 (0.01581)***
CR + 0.011224138 (0.008216)
R2 0.067
24
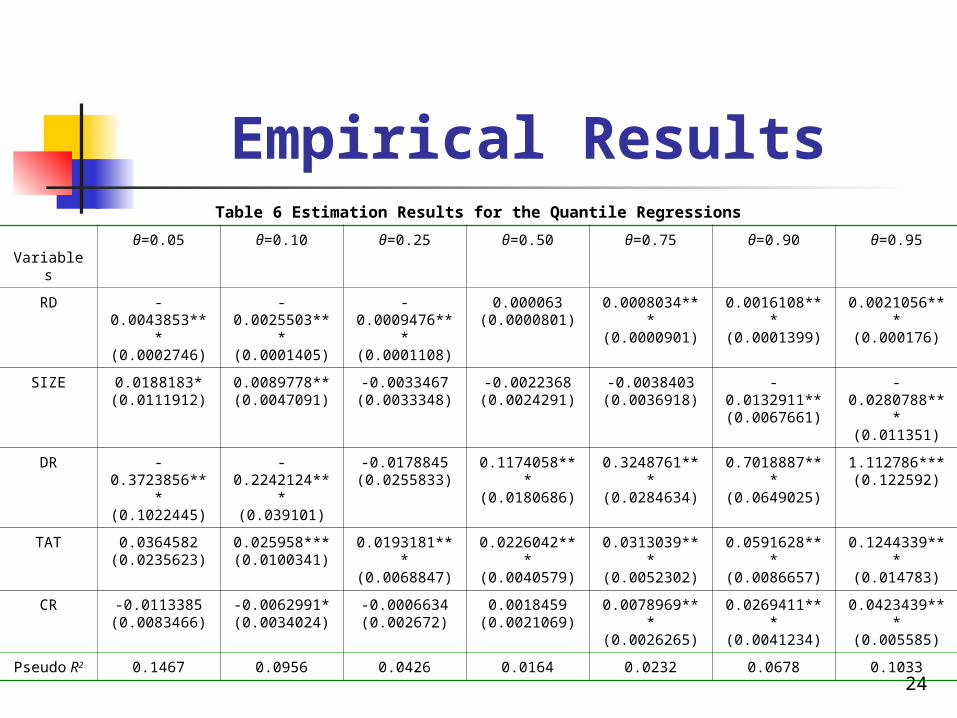
Empirical ResultsTable 6 Estimation Results for the Quantile Regressions
Variablesθ=0.05 θ=0.10 θ=0.25 θ=0.50 θ=0.75 θ=0.90 θ=0.95
RD -0.0043853***(0.0002746)
-0.0025503***(0.0001405)
-0.0009476***(0.0001108)
0.000063(0.0000801)
0.0008034***(0.0000901)
0.0016108***(0.0001399)
0.0021056***(0.000176)
SIZE 0.0188183*(0.0111912)
0.0089778**(0.0047091)
-0.0033467(0.0033348)
-0.0022368(0.0024291)
-0.0038403(0.0036918)
-0.0132911**(0.0067661)
-0.0280788***(0.011351)
DR -0.3723856***(0.1022445)
-0.2242124***(0.039101)
-0.0178845(0.0255833)
0.1174058***(0.0180686)
0.3248761***(0.0284634)
0.7018887***(0.0649025)
1.112786***(0.122592)
TAT 0.0364582(0.0235623)
0.025958***(0.0100341)
0.0193181***(0.0068847)
0.0226042***(0.0040579)
0.0313039***(0.0052302)
0.0591628***(0.0086657)
0.1244339***(0.014783)
CR -0.0113385(0.0083466)
-0.0062991*(0.0034024)
-0.0006634(0.002672)
0.0018459(0.0021069)
0.0078969***(0.0026265)
0.0269411***(0.0041234)
0.0423439***(0.005585)
Pseudo R2 0.1467 0.0956 0.0426 0.0164 0.0232 0.0678 0.1033
25
Empirical Results
-0.006
-0.005
-0.004
-0.003
-0.002
-0.001
0
0.001
0.002
0.003
0 0.2 0.4 0.6 0.8 1
Estimatedcoefficient
lower bound of95% C.I.
upper bound of95% C.I.
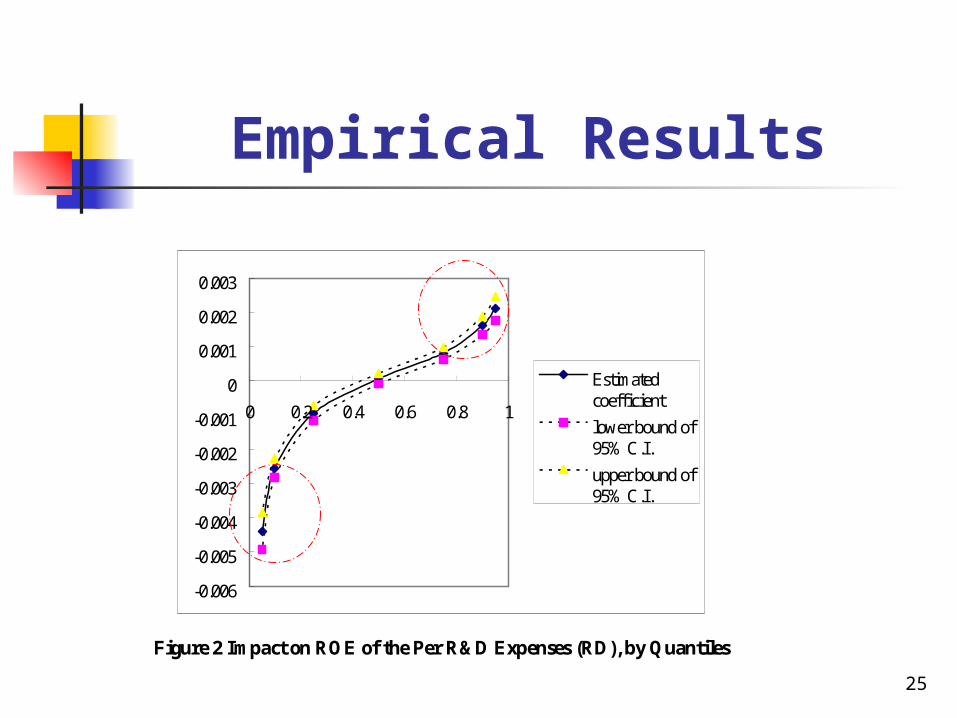
Figure 2 Impact on ROE of the Per R&D Expenses (RD), by Quantiles
26
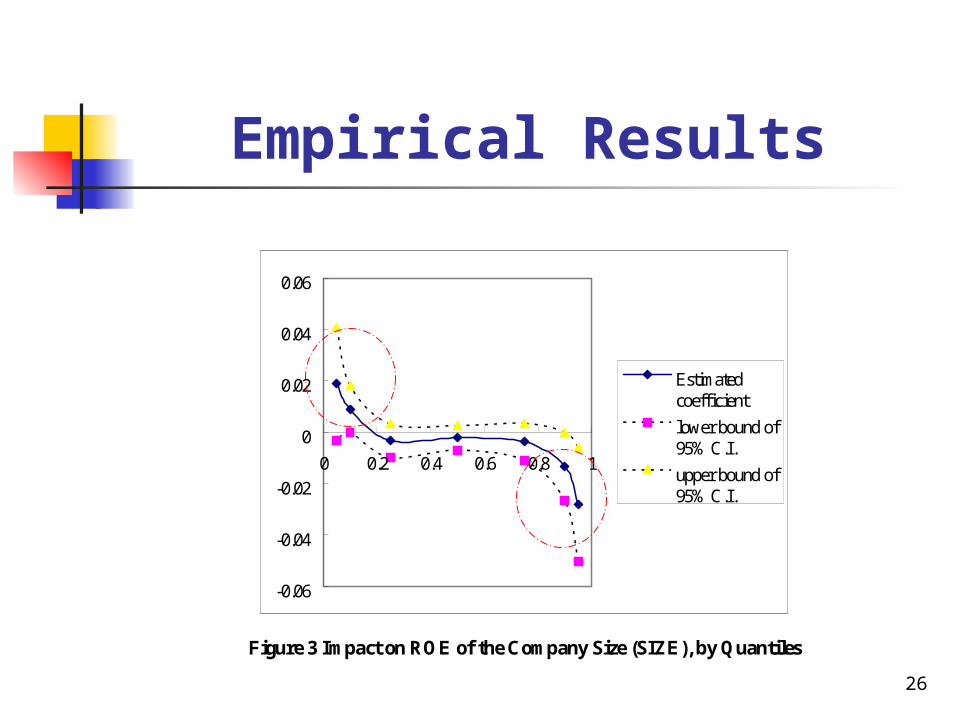
Empirical Results
-0.06
-0.04
-0.02
0
0.02
0.04
0.06
0 0.2 0.4 0.6 0.8 1
Estimatedcoefficient
lower bound of95% C.I.
upper bound of95% C.I.
Figure 3 Impact on ROE of the Company Size (SIZE), by Quantiles
27
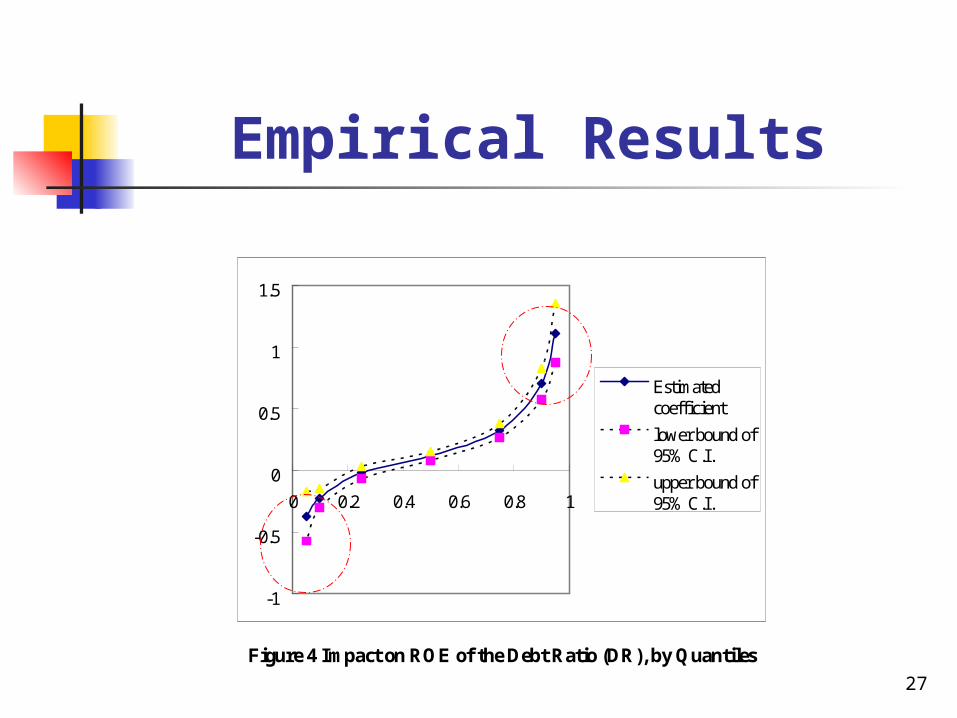
Empirical Results
-1
-0.5
0
0.5
1
1.5
0 0.2 0.4 0.6 0.8 1
Estimatedcoefficient
lower bound of95% C.I.
upper bound of95% C.I.
Figure 4 Impact on ROE of the Debt Ratio (DR), by Quantiles
28
Conclusions
This study reveals that traditional OLS and LAD optimization techniques capture central behaviors only and misestimate the effect of determinants of firm profitability, including size, significance and even sign, particularly in firms with extremely high/low profitability