1 Class 2 Measurement Terminology and Locating Specific Measures September 25, 2008 Anita L. Stewart...
98
1 Class 2 Measurement Terminology and Locating Specific Measures September 25, 2008 Anita L. Stewart Institute for Health & Aging University of California, San Francisco
-
Upload
sharon-taylor -
Category
Documents
-
view
213 -
download
0
Transcript of 1 Class 2 Measurement Terminology and Locating Specific Measures September 25, 2008 Anita L. Stewart...
1
Class 2
Measurement Terminology and Locating Specific Measures
September 25, 2008
Anita L. StewartInstitute for Health & Aging
University of California, San Francisco
2
Overview of Class 2
Measurement terminology– Confusion, variation, and overlap
Items and response scales Locating measures

3
Measurement
Assignment of numbers to aspects of objects or events according to a rule
Assignment of numbers to an unobservable characteristic of individuals (construct) – Numbers (measures) are “proxies” for the
unobservable latent variable

4
Measurement of Latent Variables: Concern of Measurement
Variable A
Measure A

5
Measurement of Latent Variables
Variable A
Item A2Item A1 Item A3 Item A4
6
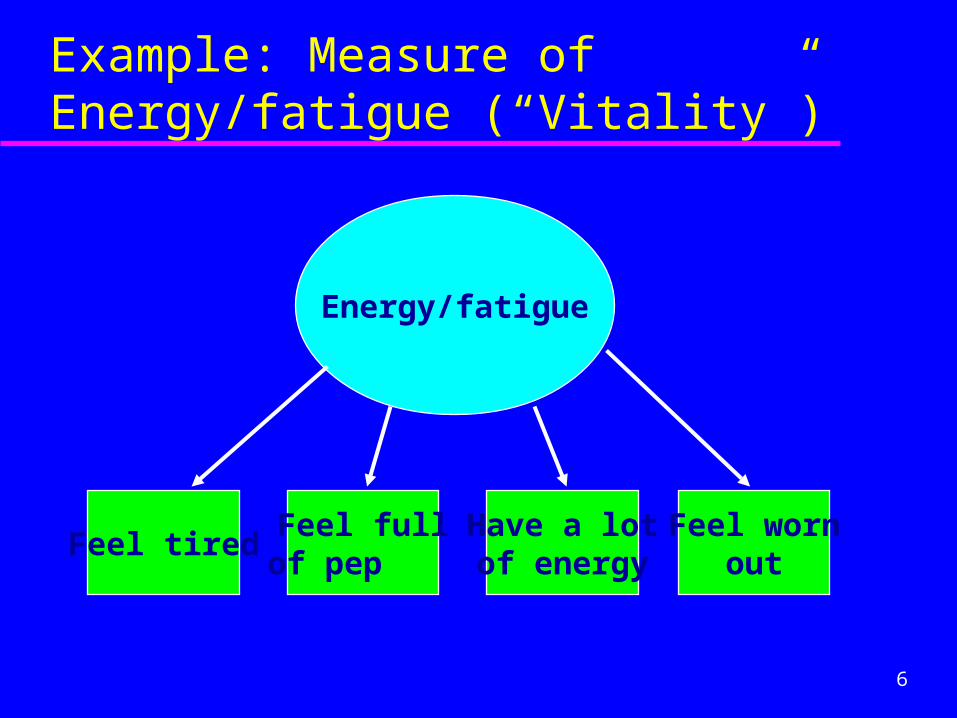
Example: Measure of Energy/fatigue (“Vitality”)
Energy/fatigue
Feel fullof pep
Feel tiredHave a lotof energy
Feel wornout

7
Measure, Scale, Index, Item
Measure - single- or multi-item scale or index (umbrella term)
Scale - aggregation of items from one concept, scored using accepted scaling method
Index - aggregation of 2 or more scales into a summary score
Item - a single question or statement including its response scale

8
Types of Measurement Scales
Categorical (nominal)– Classification– Numbers are simply labels for categories
Continuous (along a continuum)– Ordinal – Interval– Ratio

9
Categorical Measures: Numbers Have No Inherent Meaning
Race/ethnicity:1 African American
2 Asian
3 Latino
4 White
5 Other
Health insurance: 1 None
2 Private insurance
3 Medicare
4 MediCal
10
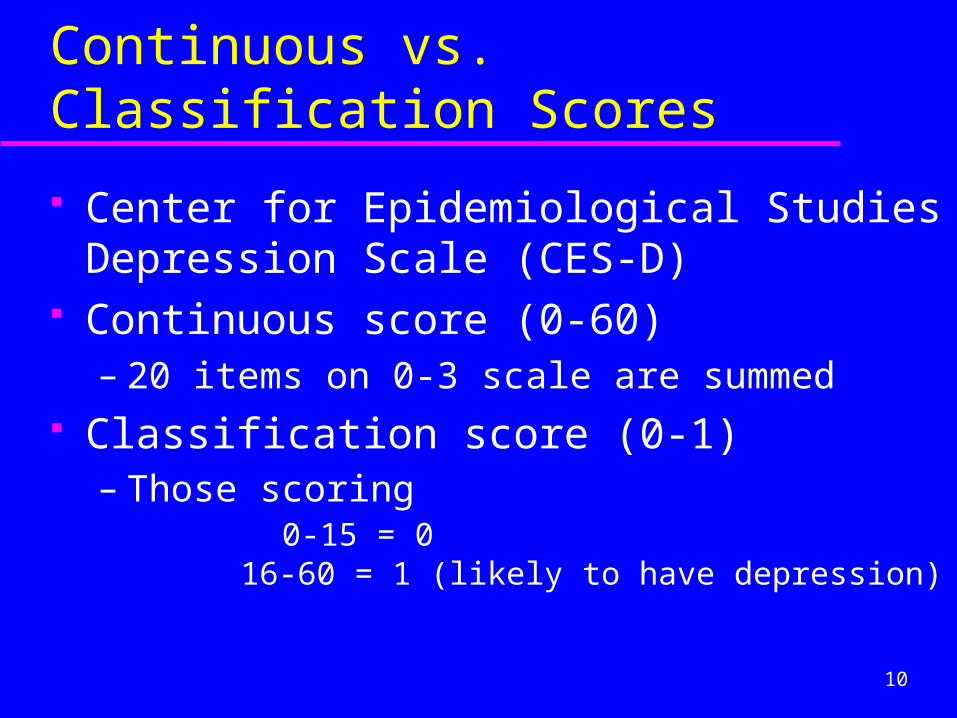
Continuous vs. Classification Scores
Center for Epidemiological Studies Depression Scale (CES-D)
Continuous score (0-60)– 20 items on 0-3 scale are summed
Classification score (0-1)– Those scoring
0-15 = 0 16-60 = 1 (likely to have depression)
11
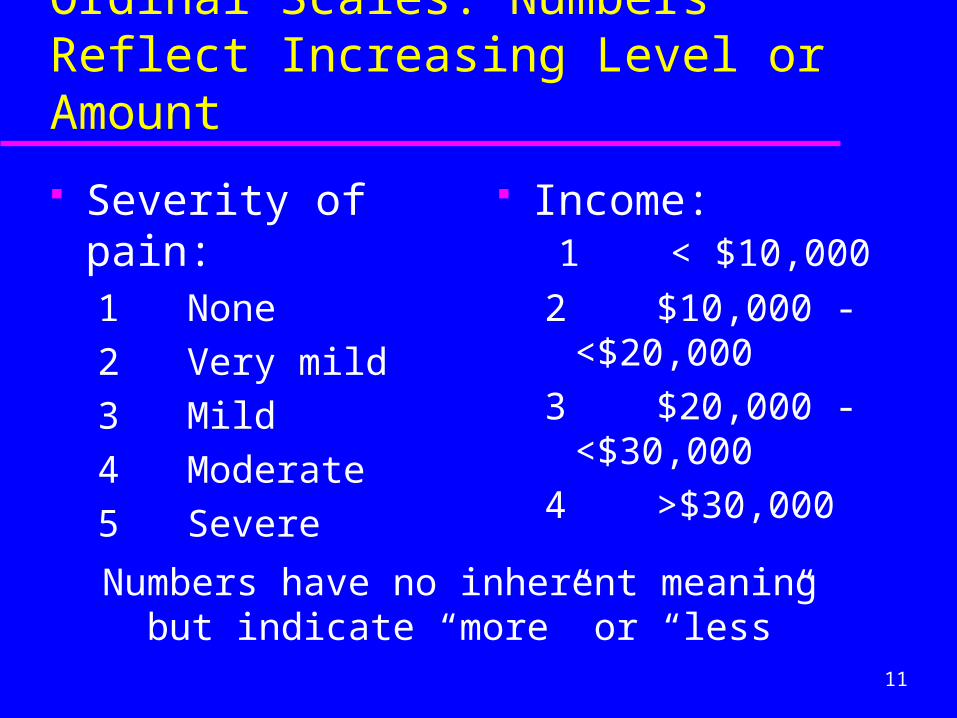
Ordinal Scales: Numbers Reflect Increasing Level or Amount
Severity of pain:1 None
2 Very mild
3 Mild
4 Moderate
5 Severe
Income: 1 < $10,000
2 $10,000 - <$20,000
3 $20,000 - <$30,000
4 >$30,000
Numbers have no inherent meaning but indicate “more” or “less”

12
Ordinal vs. Categorical Scales
1 – poor
2 – fair
3 – good
4 – very good
5 – excellent
0 = fair or poor
1 = good, very good, or excellent
In general, how would you rate your health?

13
Ordinal Items are Likert Scales
When ordinal responses determine extent of agreement (agree, disagree) – referred to as a Likert scale
Likert scale has since come to represent variety of ordinal response choices

14
Measure, Instrument, Battery, Questionnaire, Survey, Tool, Inventory
Measure - single- or multi-item scale or index (umbrella term)
Instrument - a published, named measure or set of measures
Battery - collection of measures from diverse sources

15
Questionnaire, Survey, Tool, Inventory
Questionnaire - any of the above (instrument, profile, battery) formatted into a set of measures
Survey - same as questionnaire Tool = Questionnaire = Survey? Inventory?

16
Examples of Names of “Instruments”
SF-36 Short Form Health Survey Beck Depression Inventory Health Assessment Questionnaire Sickness Impact Profile Center for Epidemiological Studies
Depression Scale

17
Example of a Battery
A questionnaire for a study containing the following measures/instruments:– SF-36 (8 domains)– Perceived stress scale (1 domain)– Social support survey (4 domains)– Pain measure
Typical in clinical trials, epi studies– Each measure serves particular purpose (outcome,
predictor, mediator, covariate)

18
Multidimensional and Unidimensional
A multidimensional “concept” has subdomains A multidimensional “measure” has several scores
of the subdomains Unidimensional measure
– Only one score is obtained Dimensionality must be empirically tested
– e.g., factor analysis identifies one factor,or more than one factor
19
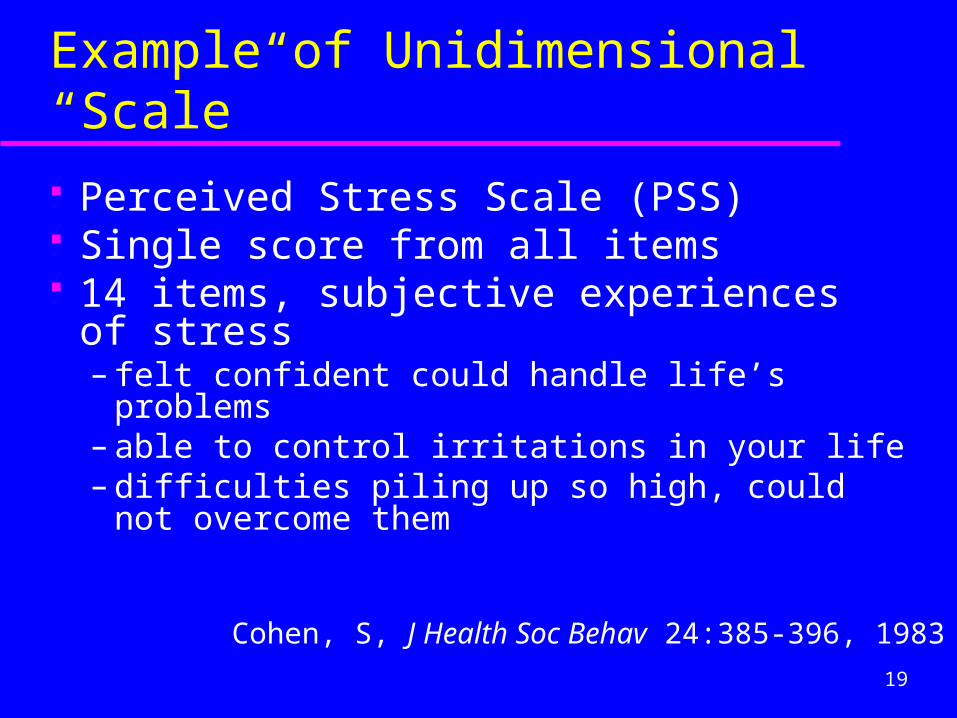
Example of Unidimensional “Scale”
Perceived Stress Scale (PSS) Single score from all items 14 items, subjective experiences of stress
– felt confident could handle life’s problems– able to control irritations in your life– difficulties piling up so high, could not
overcome them
Cohen, S, J Health Soc Behav 24:385-396, 1983

20
Example of Multidimensional “Questionnaire”
Patient Satisfaction Questionnaire (PSQ) 55 items, 18 subscales, e.g.
– Access to care
– Technical quality
– Interpersonal manner
– Explanations
– Continuity of care
Marshall GN, Psychol Assessment, 5:477-483, 1993

21
Example of a Multidimensional “Instrument” – SF-36Measures 8 health concepts (36 items): Physical functioning Role limitations due to physical health Role limitations due to emotional problems Social functioning Pain Vitality (energy/fatigue) Mental health Health perceptions

22
Overview of Class 2
Measurement terminology– Confusion, variation, and overlap
Items and response scales Locating measures

23
Composition of an Item
During the past month, how much of the time have you felt tired? 1 Never 2 A little of the time 3 Some of the time 4 Most of the time 5 All of the time
Responsescale
Itemstem
24
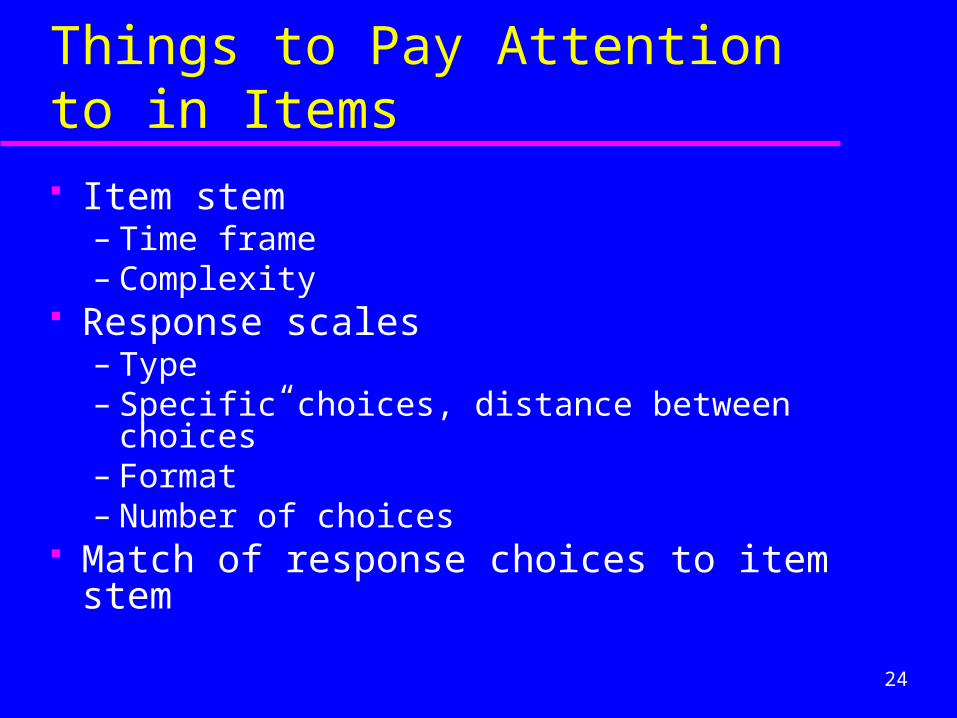
Things to Pay Attention to in Items
Item stem– Time frame– Complexity
Response scales– Type– Specific choices, distance between choices”– Format– Number of choices
Match of response choices to item stem

25
Time Frame: Part of Concept Definition
Past:
Present:
No time frame:
Average experience over some previous time period (6 months, 3 months, 4 weeks, etc)
Current status - today, in general
Time frame not specified
26
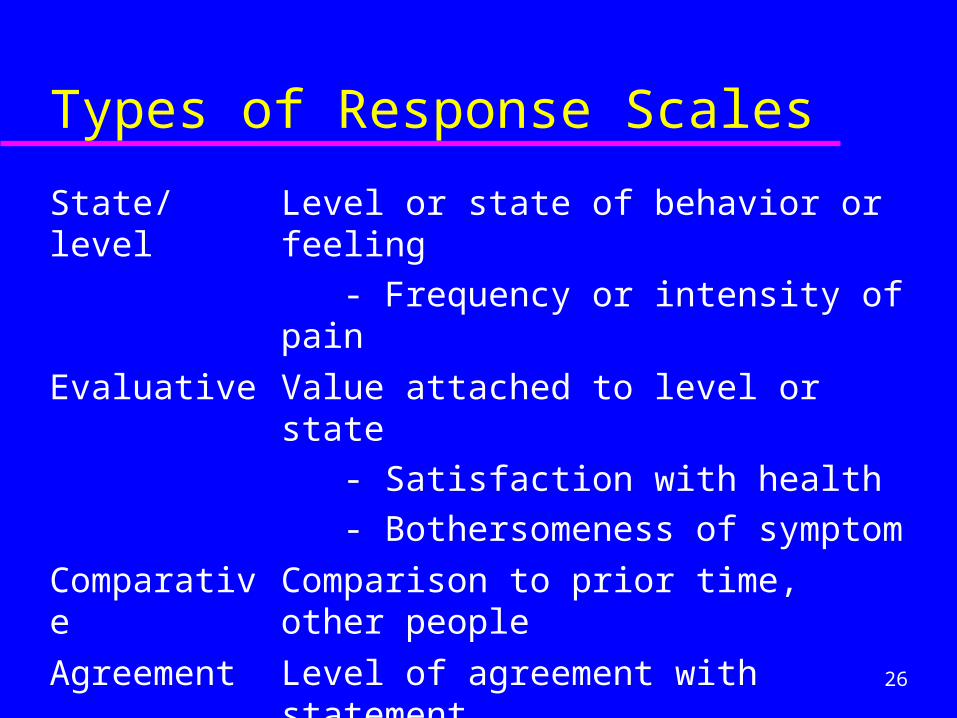
Types of Response Scales
State/level Level or state of behavior or feeling
- Frequency or intensity of pain
Evaluative Value attached to level or state
- Satisfaction with health
- Bothersomeness of symptom
Comparative Comparison to prior time, other people
Agreement Level of agreement with statement

27
Response Scale Choices: “Vague, Imprecise Quantifiers”
How often?– Very often, pretty often, not too often
– Sometimes, often, never How much?
– Too little, about right, too much
– Below average, average, above average
Bradburn NM. Public Opinion Quart 1979, 92-101.

28
Example of Vague Quantifier
For people speaking a language other than English at home:
How well does this person speak English?– Very well– Well– Not well– Not at all
29
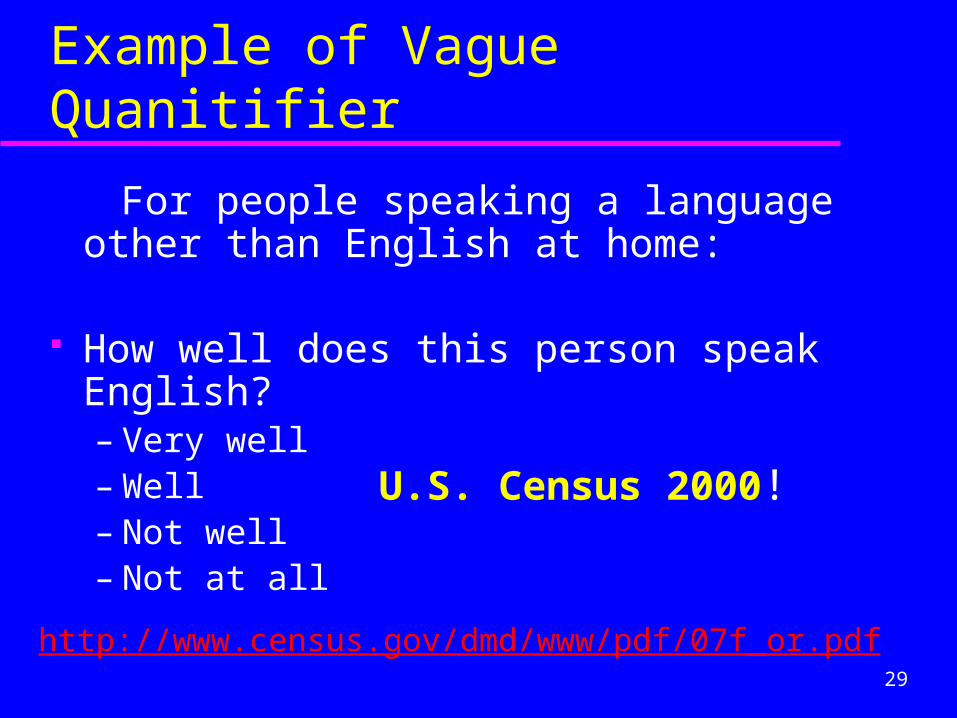
Example of Vague Quanitifier
For people speaking a language other than English at home:
How well does this person speak English?– Very well– Well– Not well– Not at all
U.S. Census 2000!
http://www.census.gov/dmd/www/pdf/07f_or.pdf
30
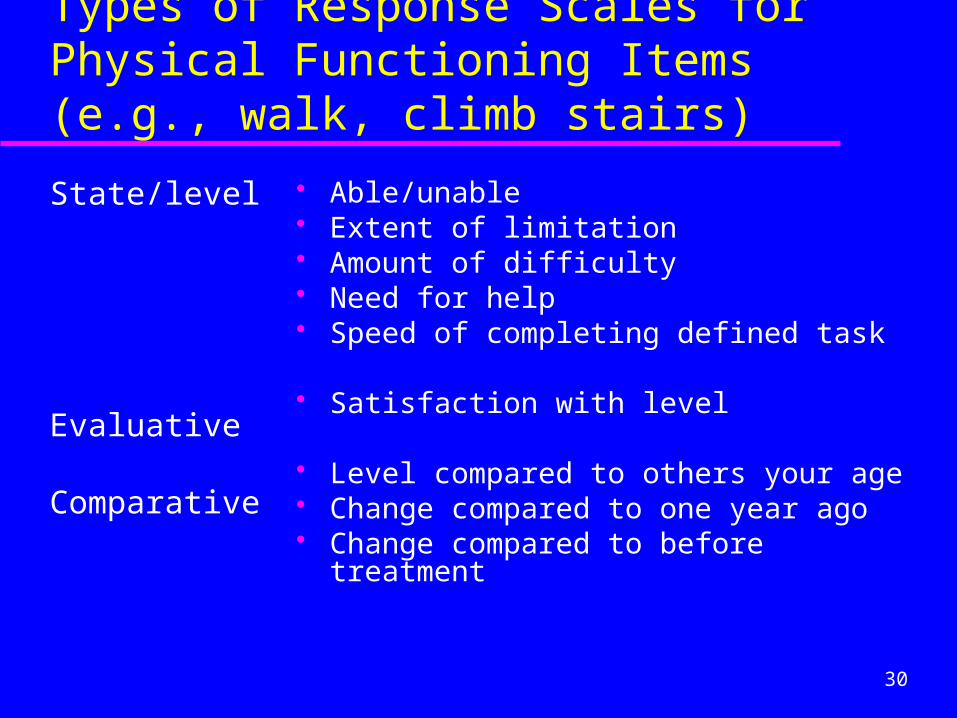
Types of Response Scales for Physical Functioning Items (e.g., walk, climb stairs)
State/level
Evaluative
Comparative
Able/unable Extent of limitation Amount of difficulty Need for help Speed of completing defined task
Satisfaction with level
Level compared to others your age Change compared to one year ago Change compared to before treatment

31
Types of Response Scales for Symptoms Items (e.g., nausea, fatigue)
Level/state
Evaluative
Comparative
Had symptom (yes/no) Frequency Intensity/severity (usually, at its worst) Amount of time, # of days had it
Extent to which bothered by Sx Extent of distress due to Sx
Extent of change (e.g. frequency) since start of treatment

32
Examples of Response Scales: Extent of Worry
Intensity (severity) of worry Frequency of worry Amount of time worried

33
Intensity Response Scale Choices
1 – Not at all
2 - Slightly
3 - Moderately
4 - Quite a bit
5 - Extremely
1 – Not at all
2 - A little
3 - A fair amount
4 - Much
5 - Very much
In the past 4 weeks, how worried have you been?

34
More Intensity Response Scale Choices
1 – Not at all
2 - A little
3 - Fairly
4 - Quite
5 - Extremely
1 – Not at all
2 - A little
3 - Somewhat
4 - Very much
In the past 4 weeks, how worried have you been?
35
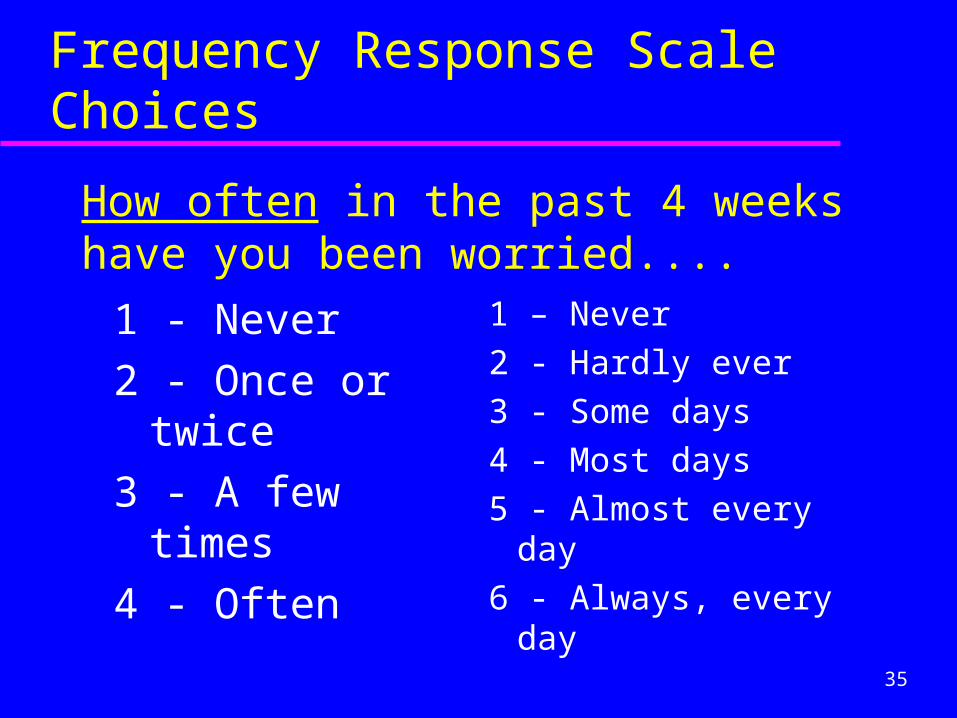
Frequency Response Scale Choices
1 - Never
2 - Once or twice
3 - A few times
4 - Often
1 – Never
2 - Hardly ever
3 - Some days
4 - Most days
5 - Almost every day
6 - Always, every day
How often in the past 4 weeks have you been worried....
36
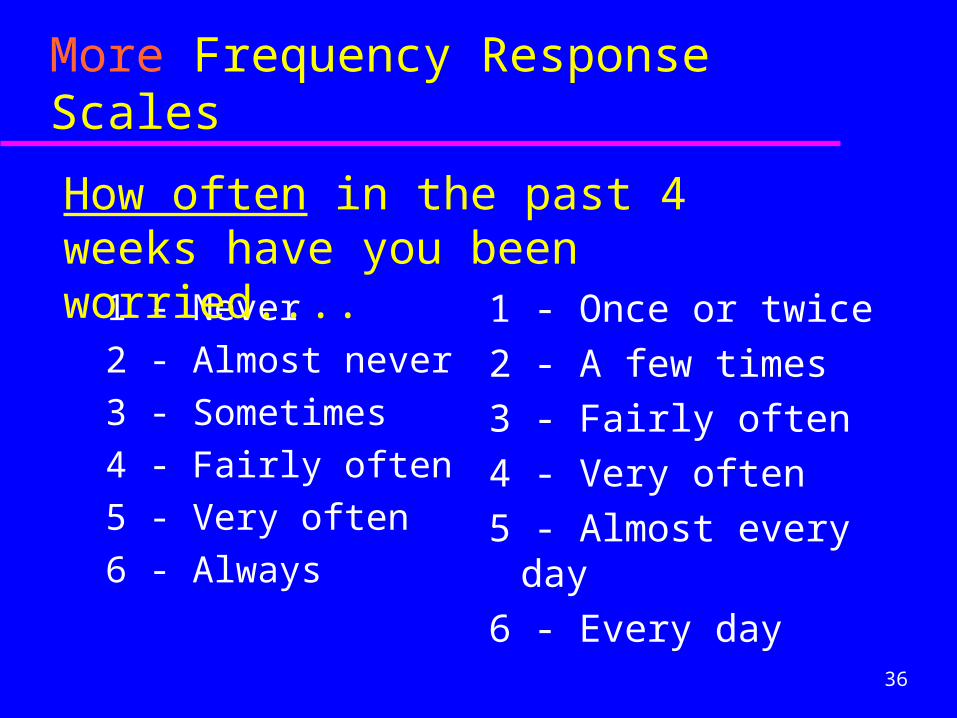
More Frequency Response Scales
1 - Never
2 - Almost never
3 - Sometimes
4 - Fairly often
5 - Very often
6 - Always
1 - Once or twice
2 - A few times
3 - Fairly often
4 - Very often
5 - Almost every day
6 - Every day
How often in the past 4 weeks have you been worried....

37
Amount of Time Response Scales
1 – None of the time
2 – A little of the time
3 – Some of the time
4 – Most of the time
5 – All of the time
How much of the time in the past 4 weekshave you been worried....
38
Feature of Ordinal Scales
Distances between numbers unknown, usually vary– some closer together in meaning than others

39
Interpretability of “Numbers” in Single Item Ordinal Scale
“In general, how would you rate your health?”
1 – poor
2 – fair
3 – good
4 – very good
5 – excellent
Is “very good” (4)twice as goodas “fair” (2)?

40
Distance Between Levels: “In general, how would you rate your health?”
Self-rated health item:1-5 0-100
Mean 7-item current health scale
ScreeningN=~11,000
BaselineN=3,054
1 – poor 0 10.8 10.8
2 – fair 25 30.0 30.6
3 – good 50 57.6 55.9
4 – very good 75 75.5 75.4
5 – excellent 100 87.9 86.9
Stewart and Ware, 1992, p. 299.
41
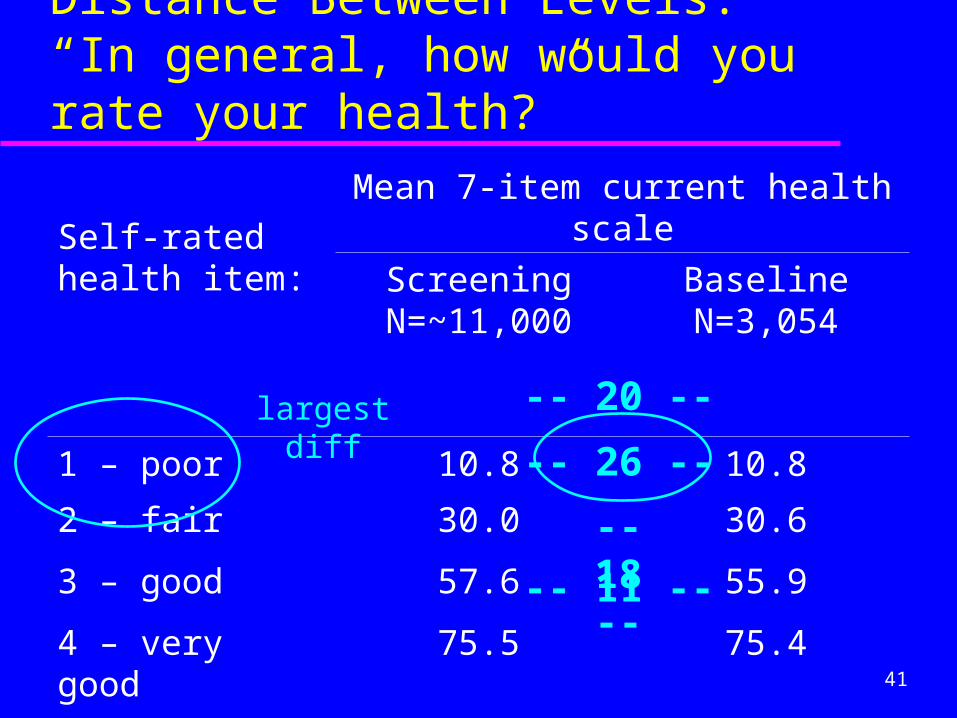
Distance Between Levels: “In general, how would you rate your health?”
Self-rated health item:
Mean 7-item current health scale
ScreeningN=~11,000
BaselineN=3,054
1 – poor 10.8 10.8
2 – fair 30.0 30.6
3 – good 57.6 55.9
4 – very good 75.5 75.4
5 – excellent 87.9 86.9
-- 20 --
-- 26 --
-- 18 --
-- 11 --
largest diff
42
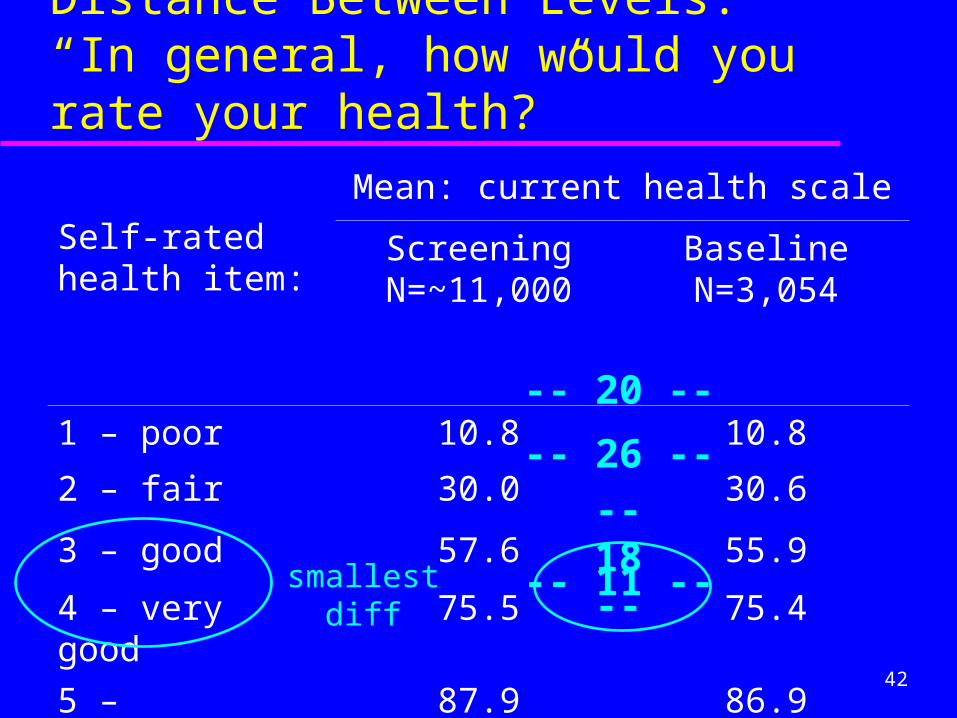
Distance Between Levels: “In general, how would you rate your health?”
Self-rated health item:
Mean: current health scale
ScreeningN=~11,000
BaselineN=3,054
1 – poor 10.8 10.8
2 – fair 30.0 30.6
3 – good 57.6 55.9
4 – very good 75.5 75.4
5 – excellent 87.9 86.9
-- 20 --
-- 26 --
-- 18 --
-- 11 --smallest diff
43
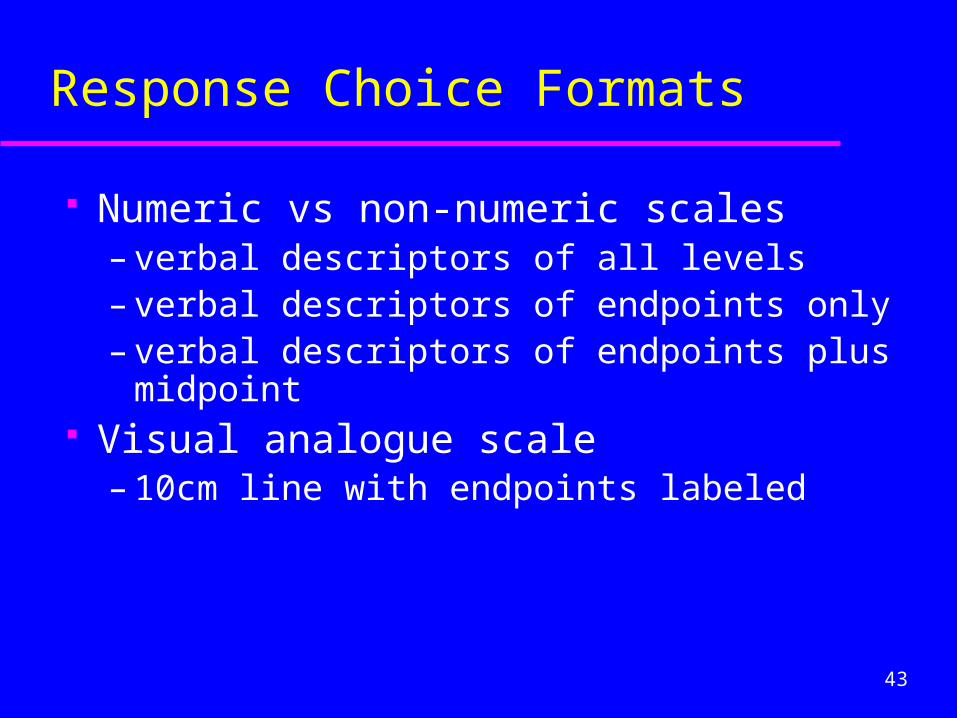
Response Choice Formats
Numeric vs non-numeric scales– verbal descriptors of all levels– verbal descriptors of endpoints only– verbal descriptors of endpoints plus midpoint
Visual analogue scale– 10cm line with endpoints labeled

44
Format: Numeric Scale with Verbal Descriptors of All Levels
1 - All of the time
2 - Most of the time
3 - Some of the time
4 - A little of the time
5 - None of the time

45
Format: Non-Numeric Scale with Verbal Descriptors of All Levels
All of the time Most of the time Some of the time A little of the time None of the time
46
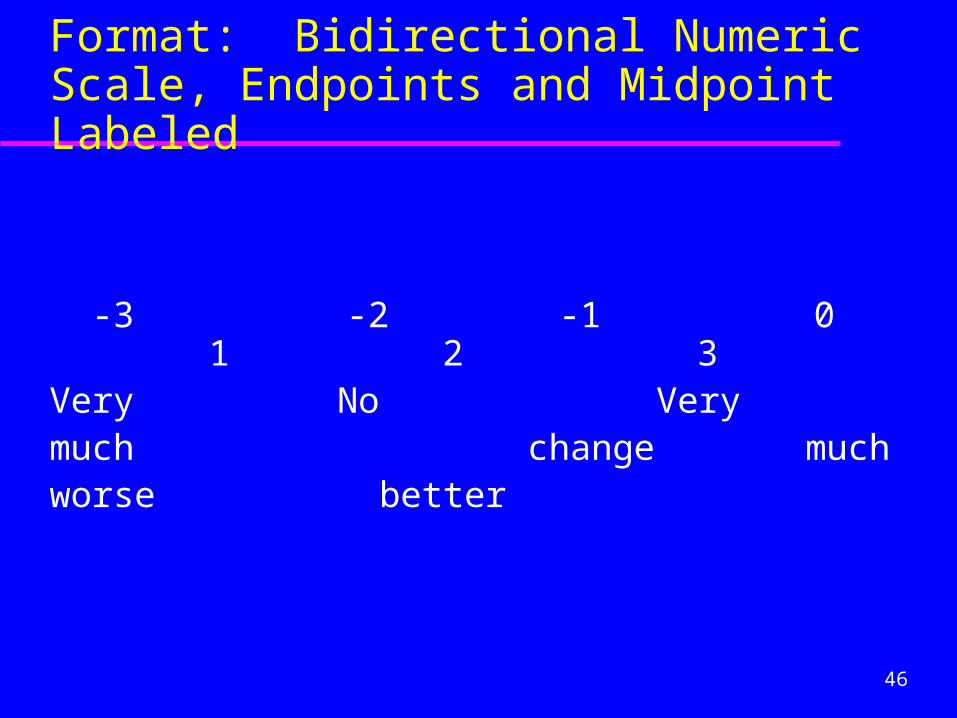
Format: Bidirectional Numeric Scale, Endpoints and Midpoint Labeled
-3 -2 -1 0 1 2 3Very No Very much change muchworse better

47
Visual Analogue Scale (VAS) 10 cm Line:A Non-Numeric Scale
Nopain
Pain asbad as you canimagine
48
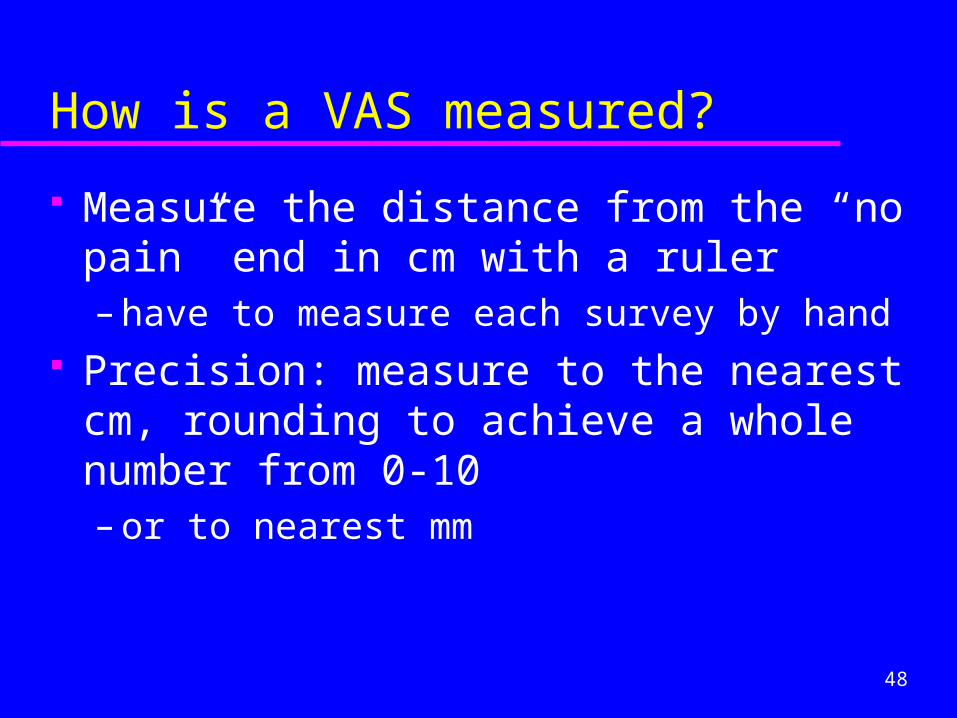
How is a VAS measured?
Measure the distance from the “no pain” end in cm with a ruler– have to measure each survey by hand
Precision: measure to the nearest cm, rounding to achieve a whole number from 0-10– or to nearest mm

49
Another Numeric Scale with Verbal Descriptors of Endpoints Only
0 1 2 3 4 5 6 7 8 9 10 11 12 13 14 15 16 17 18 19 20
No Pain pain as bad
as you can imagine

50
Format: Numeric Scale with Verbal Descriptors of Endpoints Only
0 1 2 3 4 5 6 7 8 9 10 No Pain pain as bad
as you can imagine
51
Optimal Number of Response Choices
Are 100 levels better than 5? 5-points is optimal for items
– Especially if items combined into multi-item scales For single-item measures
– 7 points preferred– Allows distribution over 5 points since people
seldom use endpoints

52
Magic Number 7 + 2 (George Miller)
Seven “chunks” of information is the most that can be retained in short-term memory– Plus or minus two (5 to 9 chunks)
Seven (+ 2) may be the most that people can discriminate on a continuum
Principle has held up well in measurement
Miller, GM Psychol Bull, 63:81-97, 1956

53
Can You Label a 7-point Intensity Scale? (How physically active were you this week?)
1 - Not at all active
2 - A little bit active
3 - Moderately active
4 - Quite active
5 - Extremely active
1 - Not at all active
2 - A little active
3 - Fairly active
4 - Quite active
5 - Very active
6 - Extremely active

54
Overview of Class 2
Measurement terminology– Confusion, variation, and overlap
Items and response scales Locating measures

55
Locating Specific Measures
Multi-item measures with known psychometric properties– For major dependent or independent variables
Standardized survey measures of various concepts for background variables– Patients: comorbidity, use of health care
demographics– Physicians: practice characteristics, specialty

56
Locating Specific Measures
Compendia Organizations and research centers Government agencies National and state surveys Large research studies related to your topic Universities and individual researchers Wikipedia (new)
57
Handout: Locating Measures for Health Disparities Research
To link to websites, log on to the Center for Aging in Diverse Communities
http://dgim.ucsf.edu/cadc/cores/measurement/resourcescode.html
58
Locating Measures: Compendia
Specific measures of various concepts are compiled, reviewed, listed, or otherwise provided– Books
» Many books review and critique various measures
– Web» A few websites
59
Best Compendium: “McDowell and Newell”
Ian McDowall and Claire Newell, Measuring Health: A Guide to Rating Scales and Questionnaires.Oxford University Press, 2006
60
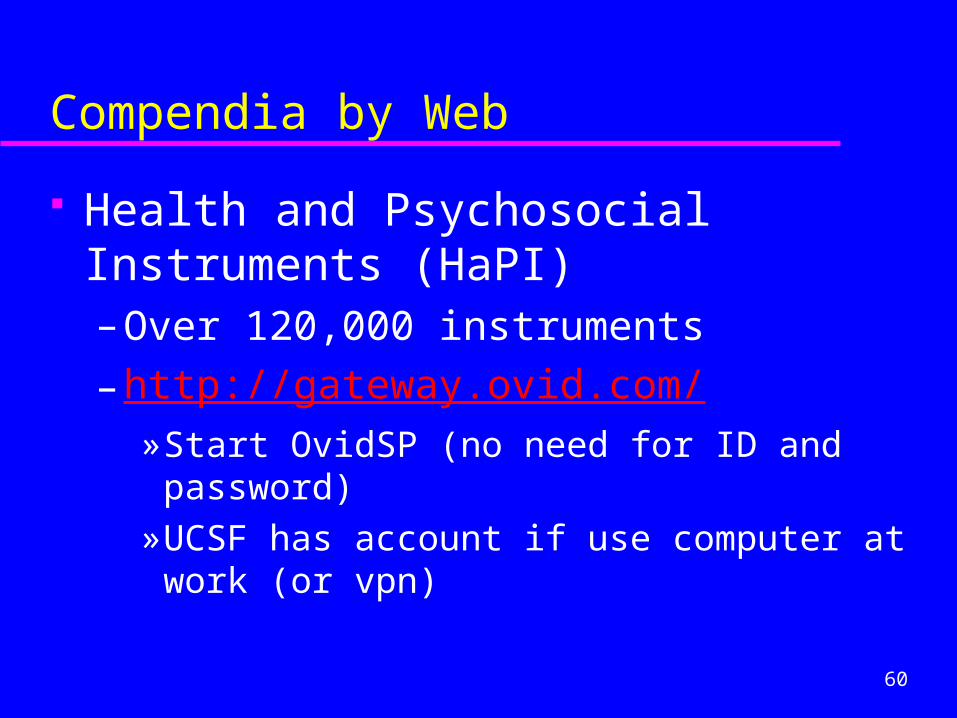
Compendia by Web
Health and Psychosocial Instruments (HaPI)– Over 120,000 instruments
– http://gateway.ovid.com/» Start OvidSP (no need for ID and password) » UCSF has account if use computer at work (or
vpn)

61
Compendia by Web
National Cancer Institute website Health behavior constructs: theory,
measurement, and research– Reviews concepts and measures of
constructs such as perceived control, social support, and perceived vulnerability
http://dccps.cancer.gov/brp/constructs/index.html
62
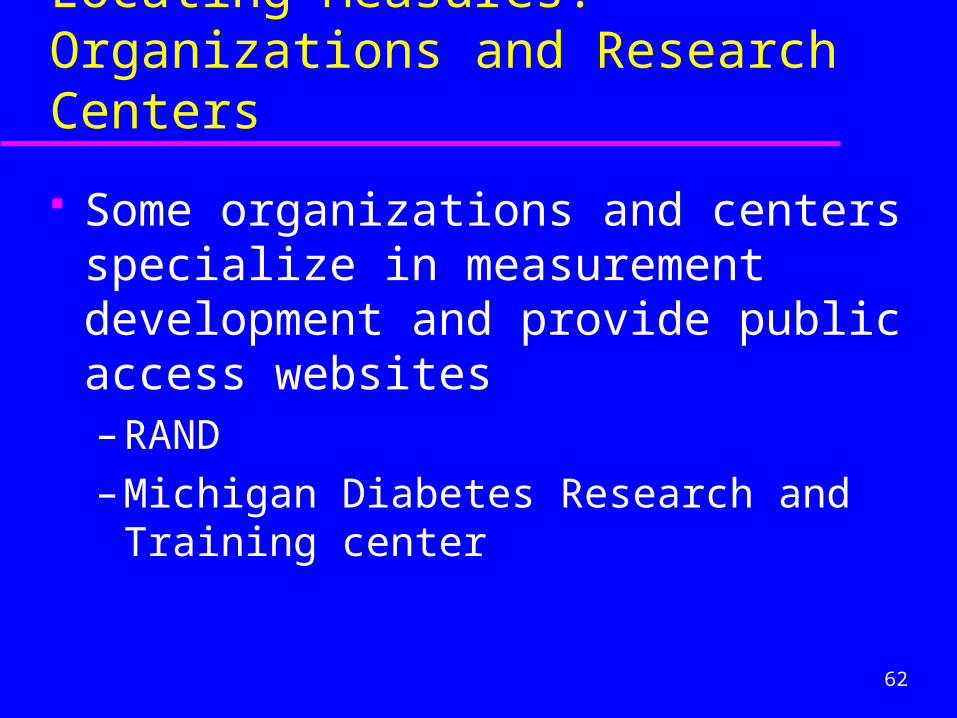
Locating Measures: Organizations and Research Centers
Some organizations and centers specialize in measurement development and provide public access websites– RAND
– Michigan Diabetes Research and Training center

63
RAND Health Program
Publishes measures, scoring manuals, and lists citations– Quality of care, patient satisfaction– Health-related quality of life– Mental health – Maternal, child, and adolescent health– Medical Outcomes Study (MOS) measures
http://www.rand.org/health/surveys_tools.html

64
RAND Measures of Maternal, Child, and Adolescent Health
Cognitive-Behavioral Intervention for Trauma in Schools (CBITS)
Pediatric Asthma Symptom Scale Pediatric Quality of Life Inventory
(PedsQL Measurement Model) Trauma tool-kit for schools
65
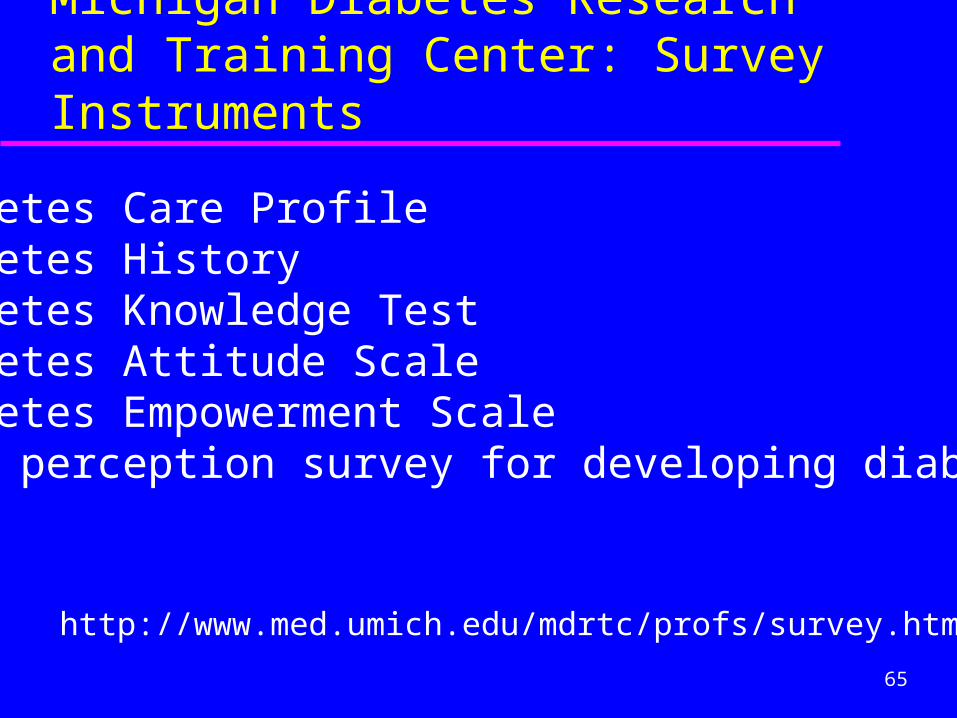
Michigan Diabetes Research and Training Center: Survey Instruments
•Diabetes Care Profile •Diabetes History •Diabetes Knowledge Test •Diabetes Attitude Scale •Diabetes Empowerment Scale •Risk perception survey for developing diabetes
http://www.med.umich.edu/mdrtc/profs/survey.html

66
MacArthur Research Network on Socioeconomic Status and Health
Reviews measures in several domains:– Psychosocial– Social and physical environment– Socioeconomic status (SES)
»SES across the lifecourse MacArthur Network on SES and Health
http://www.macses.ucsf.edu/Research/overview.htm
67
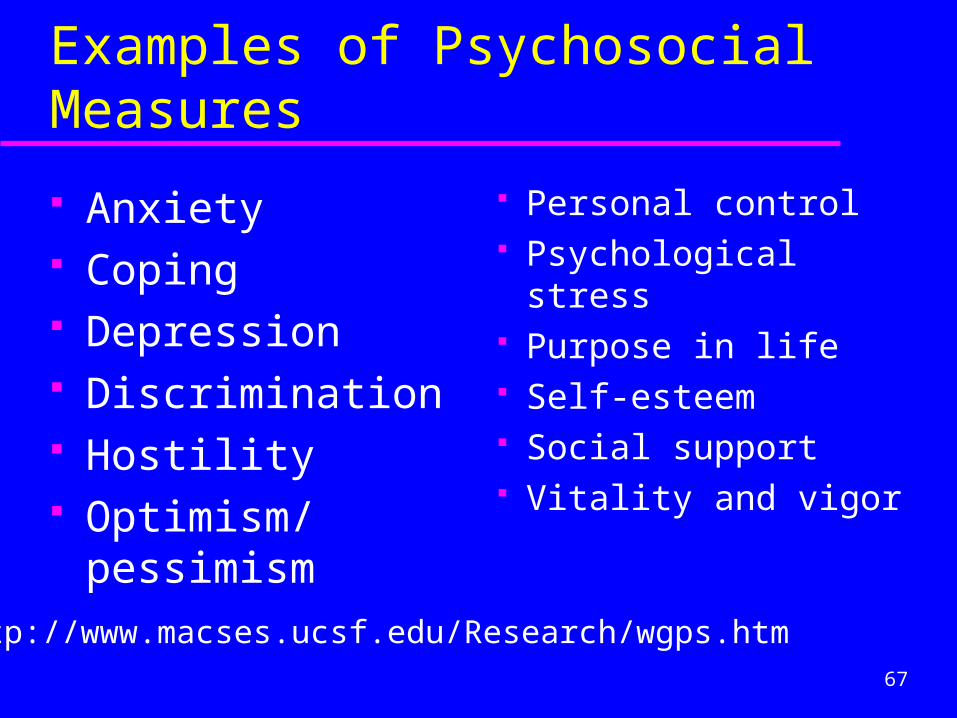
Examples of Psychosocial Measures
Anxiety Coping Depression Discrimination Hostility Optimism/pessimism
Personal control Psychological stress Purpose in life Self-esteem Social support Vitality and vigor
http://www.macses.ucsf.edu/Research/wgps.htm

68
Examples of Environmental Measures
Individual level Economic status Occupation Education Sociodemographic
characteristics
Neighborhood level Residential
segregation Physical environment Stress in environment Availability of
healthy foodshttp://www.macses.ucsf.edu/Research/Social%20Environment/chapters.html

69
Ottawa Health Decision Centre
Patient and physician decision aids– http://www.ohri.ca/centres/DecisionAids/
default.asp Patient measures
– Decisional conflict, decisional regret, stage of decision making, decision self-efficacy, and others
– http://decisionaid.ohri.ca/eval.html
70
Commonwealth Fund Surveys
Health insurance, Medicare Health system performance Health care quality, patient centered care,
underserved populations Child health development, care of the elderly State health policy, international health policy Opinion leaders
http://www.commonwealthfund.org/surveys/
71
Example: Commonwealth Fund Quality of Care Survey
2001 Health Care Quality Survey Racial and ethnic differences in patient
experiences with health care– focus on quality measures such as patient–
physician communication and access to care
72
Locating Measures: Government Agencies
Several federal and state government agencies provide measures for use in health and health disparities research– Information about measures (e.g.
clearinghouse)
– Actual measures

73
Agency for Healthcare Research and Quality (AHRQ)
Medical Expenditure Panel Survey (MEPS) – http://www.ahrq.gov/data/
National Quality Measures Clearinghouse Consumer Assessment of Health Plans
Survey (CAHPS)– http://www.ahrq.gov/qual/

74
Department of Veterans Affairs
National Survey of Veterans, 2001
– http://www1.va.gov/vetdata/page.cfm?pg=5
Includes measures of demographics and socioeconomic status, military background, health, health insurance, and VA and non-VA benefits usage.
75
National Cancer Institute
Special initiatives on measures Health Information National Trends
Survey (HINTS)– Compiled cancer screening questions,
identified best ones, conducted extensive pretesting
http://hints.cancer.gov/

76
National Cancer Institute: HINTS
Also measures of cancer knowledge, cancer communication, risk perception
Spanish and English Surveys can be downloaded
http://hints.cancer.gov/instrument.jsp
77
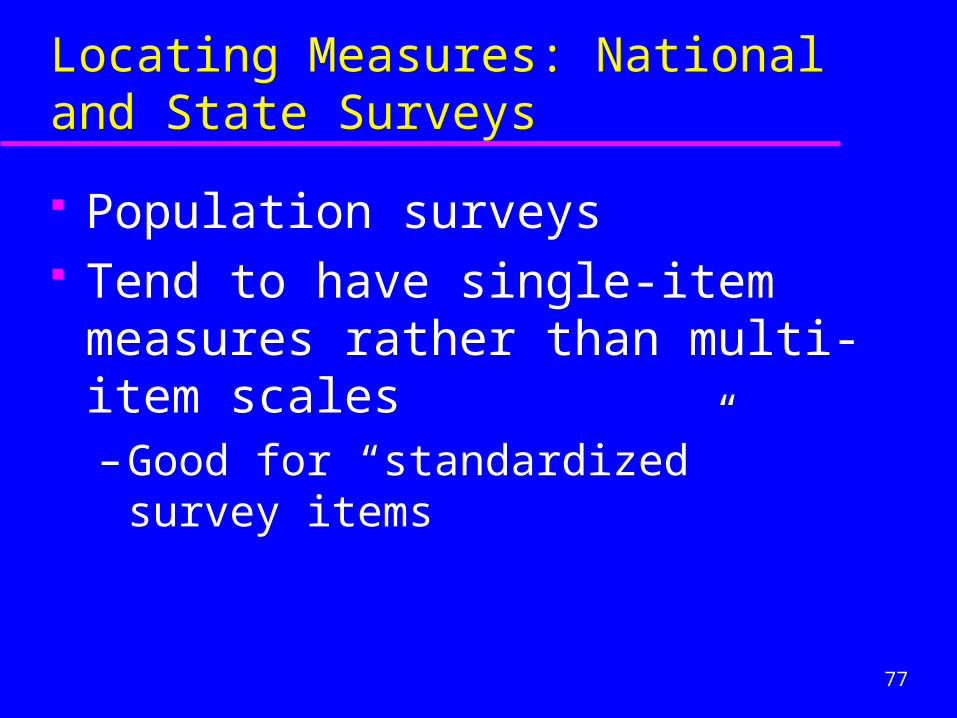
Locating Measures: National and State Surveys
Population surveys Tend to have single-item measures rather
than multi-item scales– Good for “standardized” survey items

78
Centers for Disease Control and Prevention
Behavioral Risk Factor Surveillance System (English and Spanish)– Surveys health behaviors
» tobacco, physical activity, alcohol, oral health, sleep
http://www.cdc.gov/brfss/questionnaires/index.htm

79
CDC: National School-Based Youth Risk Behavior Survey (YRBS)
Survey conducted every other year– random national sample of youth in grades 9-12
– Most states conduct survey Measures of substance use, risky sexual
behaviors, diet, physical activity, overweight
http://www.cdc.gov/HealthyYouth/yrbs/index.htm
80
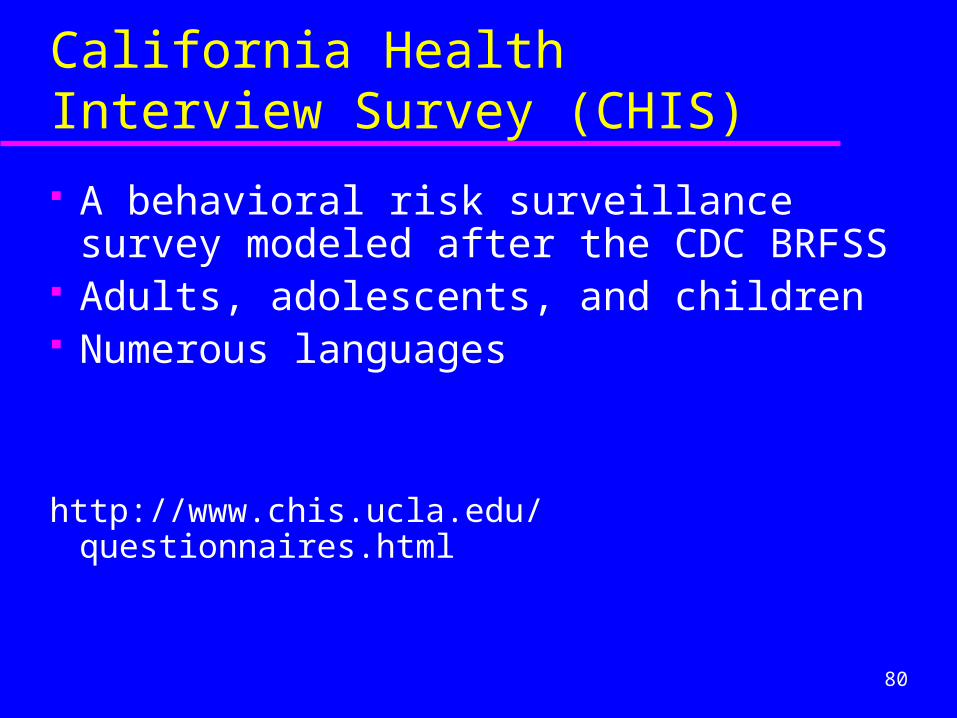
California Health Interview Survey (CHIS)
A behavioral risk surveillance survey modeled after the CDC BRFSS
Adults, adolescents, and children Numerous languages
http://www.chis.ucla.edu/questionnaires.html

81
National Center for Health Statistics (NCHS)
Surveys and data collection systems Can download
– Any survey or portion of survey See handouts for class 10
– Summary of all surveys
– Instructions for downloading
82
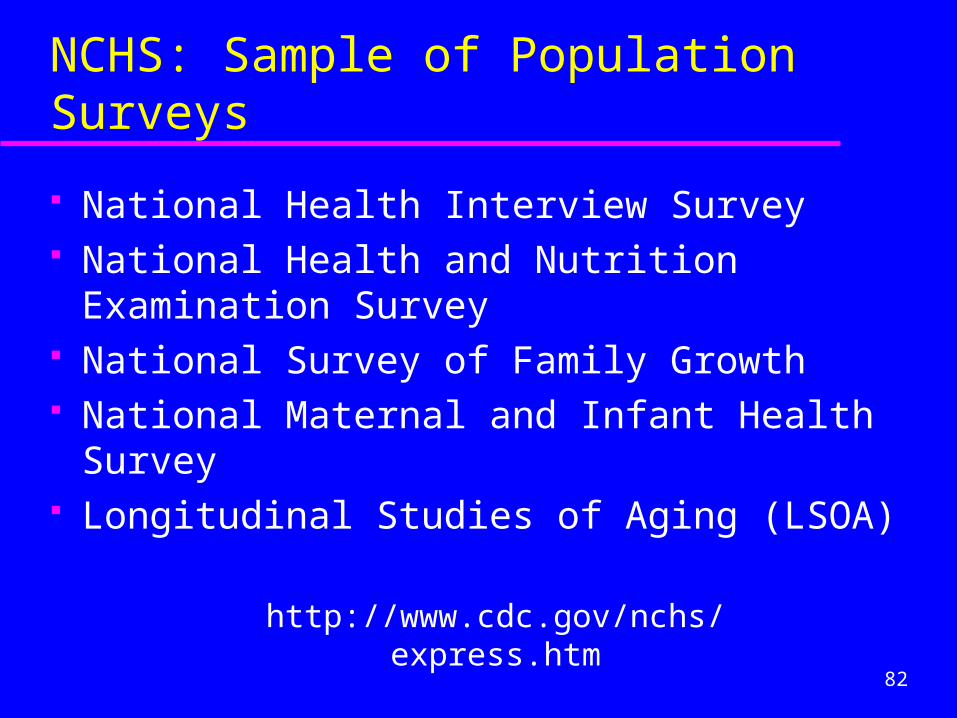
NCHS: Sample of Population Surveys
National Health Interview Survey National Health and Nutrition Examination
Survey National Survey of Family Growth National Maternal and Infant Health Survey Longitudinal Studies of Aging (LSOA)
http://www.cdc.gov/nchs/express.htm
83
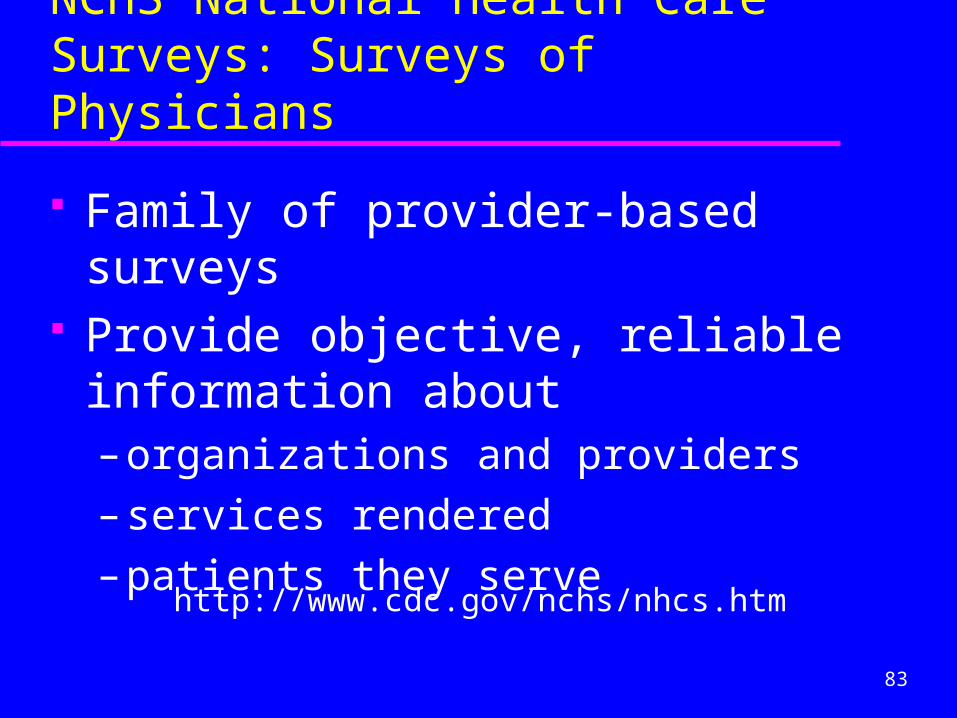
NCHS National Health Care Surveys: Surveys of Physicians
Family of provider-based surveys Provide objective, reliable information
about– organizations and providers
– services rendered
– patients they serve
http://www.cdc.gov/nchs/nhcs.htm
84
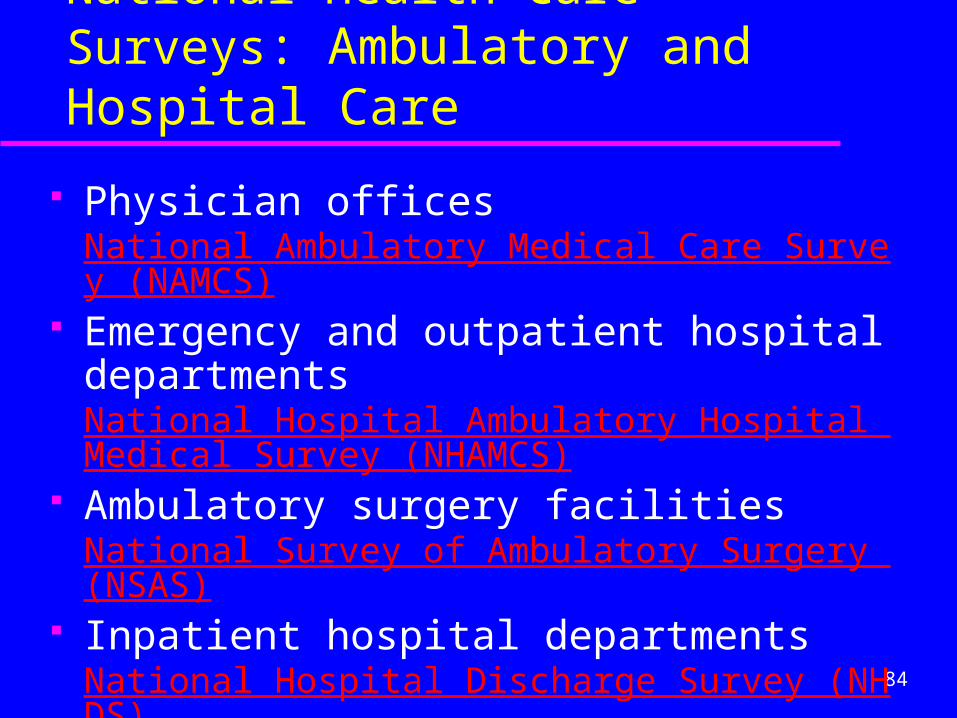
National Health Care Surveys: Ambulatory and Hospital Care
Physician officesNational Ambulatory Medical Care Survey (NAMCS)
Emergency and outpatient hospital departments National Hospital Ambulatory Hospital Medical Survey (NHAMCS)
Ambulatory surgery facilities National Survey of Ambulatory Surgery (NSAS)
Inpatient hospital departmentsNational Hospital Discharge Survey (NHDS)

85
Locating Measures: Large Research Studies
Many large-scale, multi-center and longitudinal studies have developed and used measures on health-related topics
Increasingly, they are posting these on “study” websites

86
Study of Women’s Health Across the Nation (SWAN)
Physical, biological, psychological, and social changes of women during their middle years
www.edc.gsph.pitt.edu/swan/public Questionnaire can be downloaded

87
Sacramento Area Latino Study on Aging (SALSA) Study
NIA funded longitudinal study of Latinos in the Sacramento region
Started in 1996– each person followed for up to 5 years
http://sitemaker.umich.edu/salsa.study/home
88
Locating Measures: Universities and Individual Researchers
Individual investigators who specialize in measurement and some universities have begun to post measures for public use
Some of these include large research studies posted on university websites

89
University of Michigan Institute for Social Science Research
Two studies on antecedents and consequences of retirement (with NIA)– Health and Retirement Study– Asset and Health Dynamics Among the Oldest Old
(AHEAD) Measures of health insurance, savings, and
economic well-being including life course patterns of wealth accumulation and consumption

90
Dr. James Sallis, Ph.D., San Diego State University
Expert in physical activity and diet interventions in children
Provides nearly 50 relevant measures– English and Spanish– Parent and child measures– Influences on physical activity– Environmental measures
http://www-rohan.sdsu.edu/faculty/sallis/measures.html

91
Duke University Center for Demographic Studies
National Long Term Care Survey (with NIA) Prevalence and patterns of functional
limitations, medical conditions, recent medical problems, use of health care, and housing and neighborhood characteristics
http://www.nltcs.aas.duke.edu/index.htm
92
Tool Kit of Instruments to Measure End of Life Care (TIME)
www.chcr.brown.edu/pcoc/toolkit.htm Instruments to measure “patient-focused,
family centered” care Annotated bibliographies of instruments
that measure outcomes of care at the end of life

93
TIME Annotated Bibliographies Available:
Quality of life Pain and other
symptoms Emotional and
cognitive symptoms Advance care
planning
Spirituality Continuity of care Caregiver well-being Grief and
bereavement and more

94
UCSF CINAHL (Nursing and Allied Health Literature)
Database at UCSF, can search for measures
http://www.library.ucsf.edu/db/record.html?idrecord=197
95
Roadmap K12 Data Resource Center
http://www.epibiostat.ucsf.edu/courses/RoadmapK12/PublicDataSetResources/
Links to over 2 dozen national and state surveys
Provides overview for each: domains, time frame, population, scope, sample size, and contacts

96
Locating Measures: Finding Authors of Measures
Published research using measure you are interested in– Unpublished measures often described in
methods– Authors may provide measures
97
Wikipedia
Some wikis are being developed around specific measures
http://en.wikipedia.org/wiki/Hamilton_Depression_Rating_Scale
http://en.wikipedia.org/wiki/Beck_Depression_Inventory

98
Homework
Locate several measures/instruments that assess your concept– The more the better at this point
For each measure, list name of measure and key citation, and note how and where you found it (i.e., process of finding it and location)