1 Can We Predict Earthquakes? Can We Predict Earthquakes? Andrea Nemeth Advisor: Dr. Mark Schilling.
19
1 Can We Predict Can We Predict Earthquakes? Earthquakes? Andrea Nemeth Advisor: Dr. Mark Schilling
-
date post
21-Dec-2015 -
Category
Documents
-
view
219 -
download
3
Transcript of 1 Can We Predict Earthquakes? Can We Predict Earthquakes? Andrea Nemeth Advisor: Dr. Mark Schilling.

1
Can We Predict Earthquakes?Can We Predict Earthquakes?
Andrea NemethAdvisor: Dr. Mark Schilling

2
Earthquake PredictionEarthquake Prediction
location
time
magnitude
probability of
occurrence
reliable
accurate The collapse of part of Jefferson Junior High
School in Long Beach in 1933.(Photo: Portland Cement Association)

3
Methods Employed In Methods Employed In Earthquake PredictionEarthquake Prediction
statistical probability
physical measurements
geochemical observations
observations of animal behavior
Seismicity of California (USGS)

4
Real Data or Simulated?Real Data or Simulated?
Significant CA Earthquakes1 (1800-2003)(Magnitude M>=6)
6
6.2
6.4
6.6
6.8
7
7.2
7.4
7.6
7.8
8
0 10 20 30 40 50 60 70 80
Significant CA Earthquakes 2 (1800-2003)(Magnitude M>=6)
6
6.2
6.4
6.6
6.8
7
7.2
7.4
7.6
7.8
8
0 10 20 30 40 50 60 70 80

5
Popular media statementsPopular media statements
“the Big One is overdue”
“the longer it waits, the bigger it will be”
(USGS)

6
Statistical ModelsStatistical Modelstime-independent
Poisson (exponential)model
time-dependent Gaussian gamma log-normal Weibull distributionsBrownian Passage Time

7
Poisson ModelPoisson Model Weibull Model Weibull Model
Magnitudes of EQs and the time intervals between EQs are each assumed to be independently distributed.
memoryless
The probability of rupture is a function of the accumulated strain.
F t e t( ) 1 F t e t n
( ) 1

8
Parkfield and WrightwoodParkfield and Wrightwood
Parkfield area medium-sized EQs occur here fairly regularly
Wrightwood arealong term data is available
LA
(USGS)

9
1857, 1881, 1901, 1922, 1934, 1966
USGS prediction:an earthquake of ~M6 would occur in Parkfield between 1983 and 1993
The The ExperimentExperiment

10
So how regular are the recurrence So how regular are the recurrence times of these earthquakes?times of these earthquakes?
Mean:
24.5 years
Standard deviation:
9.25 years.
The Recurrence Times of the EQs in the Parkfield Experiment
0
5
10
15
20
25
30
35
40
0 1 2 3 4 5 6 7
Tim
e (y
ears
)
The intervals between these EQs: 24, 20, 21, 12, 32, 38

11
Probability PlotsProbability Plots
0 50 100 150 200 250
1030
506070
80
90
95
97
98
99
Data
Per
cen
t
Exponential Probability Plot for T in the PE
ML Estimates
Mean: 24.5
10 100
1
2
3
5
10
20
3040506070809095
99
Data
Per
cen
t
Weibull Probability Plot for T in the PE
ML Estimates
Shape:
Scale:
3.20754
27.4210
12
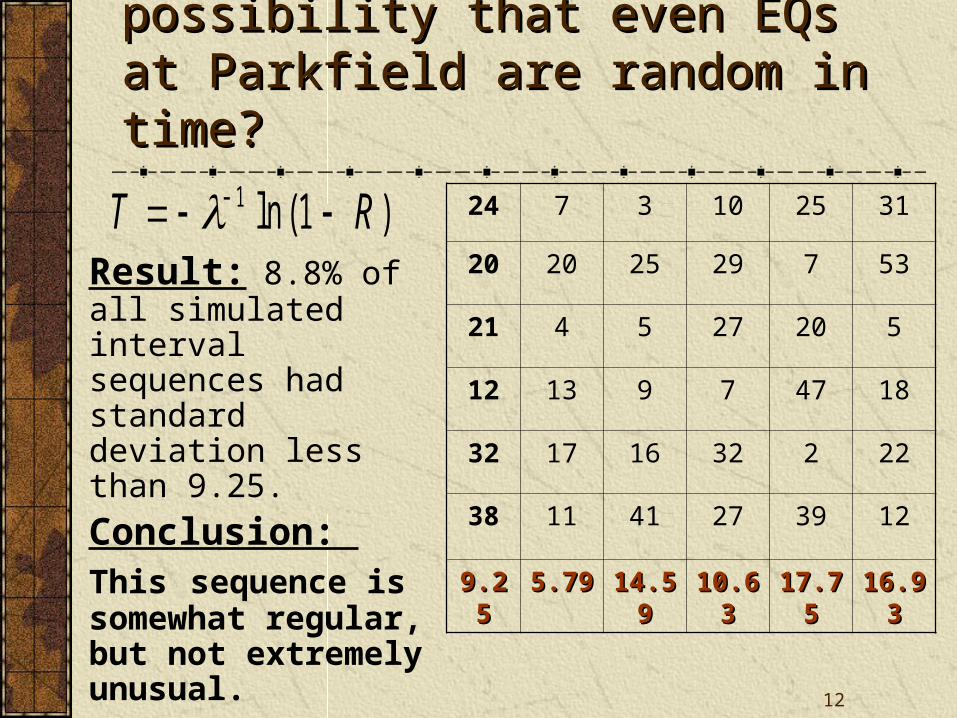
Can we rule out the possibility that even Can we rule out the possibility that even EQs at Parkfield are random in time?EQs at Parkfield are random in time?
Result: 8.8% of all simulated interval sequences had standard deviation less than 9.25.
Conclusion: This sequence is somewhat regular, but not extremely unusual.
T R 1 1ln ( ) 24 7 3 10 25 31
20 20 25 29 7 53
21 4 5 27 20 5
12 13 9 7 47 18
32 17 16 32 2 22
38 11 41 27 39 12
9.259.25 5.795.79 14.5914.59 10.6310.63 17.7517.75 16.9316.93

13
WrightwoodWrightwood534, 634, 697, 722, 781, 850, 1016, 1116, 1263, 1360,
1470, 1536, 1610, 1690, 1812, 1857

14
The Recurrence Times of the The Recurrence Times of the EQs at WrightwoodEQs at Wrightwood
The time intervals between successive EQs:100, 63, 25, 59, 69, 166, 100, 147, 97, 110, 66, 74, 80, 122, and 45 years.
mean:
88.2 years
standard
deviation:
37.8 years.0
20
40
60
80
100
120
140
160
180
0 2 4 6 8 10 12 14 16
EQ Interval Index (1-15)
Tim
e (y
ears
)

15
Probability PlotsProbability Plots
0 100 200 300 400 500 600
1030
506070
80
90
95
97
98
99
Data
Per
cen
t
between EQs at WrightwoodExponential Probability Plot for the Time Intervals
ML Estimates
Mean: 88.2000
10 100
1
2
3
5
10
20
3040506070809095
99
Data
Per
cen
t
Intervals between EQs at WrightwoodWeibull Probability Plot for the Time
ML Estimates
Shape:
Scale:
2.59754
99.4288
16
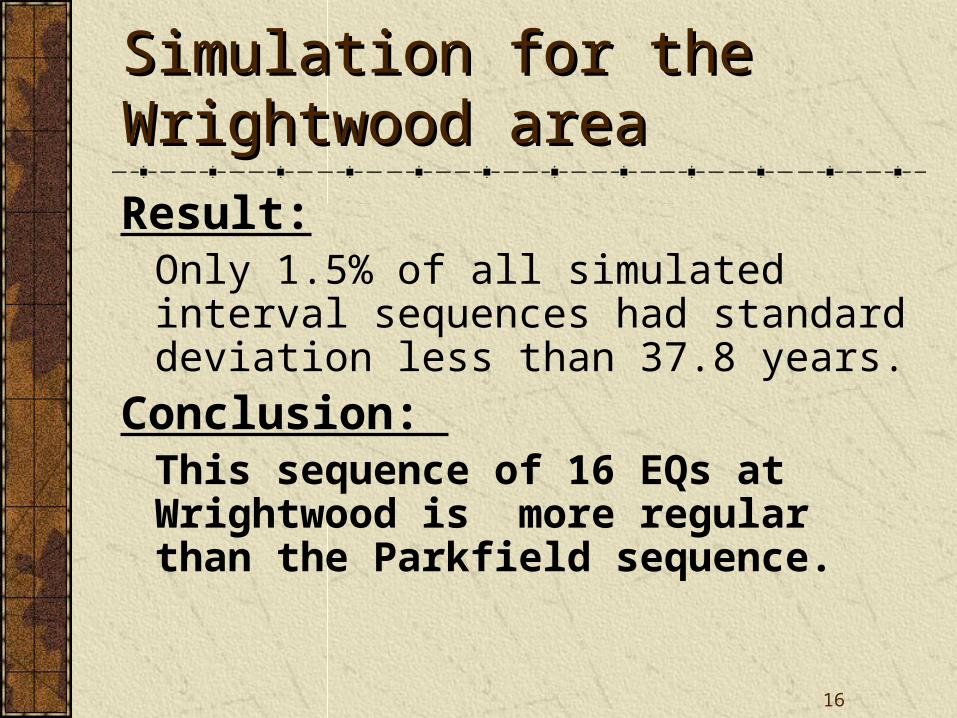
Simulation for the Wrightwood Simulation for the Wrightwood areaarea
Result:
Only 1.5% of all simulated interval sequences had standard deviation less than 37.8 years.
Conclusion: This sequence of 16 EQs at Wrightwood is more regular than the Parkfield sequence.

17
SummarySummary
Several factors make EQ prediction difficult:the cycle of EQs is long
the fundamental physics of EQ faulting is not yet understood
no clearly recognizable precursor has been observed
EQ history is short for most faults

18
Potential Future WorkPotential Future Work
Further investigation of the Wrightwood data
Analysis of other data sets from the
San Andreas Fault
Study of other statistical models with our data

19
AcknowledgmentsAcknowledgments
This project was sponsored by the NASA/JPL PAIR program.
I thank Dr. Carol Shubin for her continuous support, interest and encouragement.
I’m very grateful to Dr. Mark Schilling, my advisor, for his comments on the data analysis and preparation, for his valuable insights andobservations.


![Words for Production 1. predict [ prI`dIkt ] vt. to say that something will happen before it happens 預測 Scientists still cannot predict when earthquakes.](https://static.fdocuments.us/doc/165x107/56649cdb5503460f949a5894/words-for-production-1-predict-pridikt-vt-to-say-that-something-will.jpg)