1 AFRICAN DEVELOPMENT BANK African Economic Outlook 2006 African Economic Outlook 2006 African...
31
1 AFRICAN DEVELOPMENT BANK AFRICAN DEVELOPMENT BANK African Economic Outlook 2006 African Economic Outlook 2006 African Development Bank / OECD Development Centre Prof. Louka T. Katseli, Director, OECD Development Centre www.oecd.org/dev Hellenic-African Chamber of Commerce & Development and ADGI-INERPOST Athens, 1 December 2006
-
Upload
alannah-neal -
Category
Documents
-
view
219 -
download
1
Transcript of 1 AFRICAN DEVELOPMENT BANK African Economic Outlook 2006 African Economic Outlook 2006 African...

1 AFRICAN DEVELOPMENT BANKAFRICAN DEVELOPMENT BANK
African Economic Outlook 2006African Economic Outlook 2006African Development Bank / OECD Development Centre
Prof. Louka T. Katseli, Director, OECD Development Centrewww.oecd.org/dev
Hellenic-African Chamber of Commerce & Developmentand ADGI-INERPOST
Athens, 1 December 2006

2 AFRICAN DEVELOPMENT BANKAFRICAN DEVELOPMENT BANK
11 What is the African Economic Outlook What is the African Economic Outlook Project?Project?African Performance: A two Speed Africa?African Performance: A two Speed Africa? 22
Promoting Transport InfrastructurePromoting Transport Infrastructure33

3 AFRICAN DEVELOPMENT BANKAFRICAN DEVELOPMENT BANK
What is the AEO Project?What is the AEO Project?Joint Publication ofJoint Publication of the AfDB and the OECD Development the AfDB and the OECD Development Centre, supported by the ECCentre, supported by the EC – 5 – 5thth edition released on May 16. edition released on May 16.
Independent, comprehensive and comparative Independent, comprehensive and comparative analysis of 30 analysis of 30 African countries, combining economic, social and political African countries, combining economic, social and political review and short-term macroeconomic forecastsreview and short-term macroeconomic forecasts..
An input for An input for African policy makersAfrican policy makers, incl. NEPAD APRM, aid , incl. NEPAD APRM, aid practitioners and investors.practitioners and investors.
Analysis of individual countries, comparative synthesis Analysis of individual countries, comparative synthesis review review and and focus on a major theme focus on a major theme each year – promoting and each year – promoting and financing transport Infrastructure in 2006 issue.financing transport Infrastructure in 2006 issue.
Improvements in successive editions Improvements in successive editions (More intensive peer-(More intensive peer-review process, Improved modelling and data review process, Improved modelling and data harmonisation, Broader Coverage…)harmonisation, Broader Coverage…)

4 AFRICAN DEVELOPMENT BANKAFRICAN DEVELOPMENT BANK
AEO 2006AEO 2006
Algeria
Libya Egypt
Mauritania
Mali
Niger
Chad
Dem.Rep. Congo
Sudan
Central AfricanRepublic
Equatorial Guinea
GabonCongo
Cameroon
Angola
Guinea-BissauGuinea
Sierra Leone
Liberia
Côted'Ivoire
Tunisia
BurkinaFaso
Ghana
NigeriaTogo Ethiopia
Somalia
Djibouti
Eritrea
Kenya
Tanzania
Mozambique
SouthAfrica
Botswana
Zimbabwe
Namibia
Zambia
Swaziland
Lesotho
Malawi
Uganda
BurundiRwanda
Madagascar
SenegalGambia
Morocco
Mauritius
Coverage 2006: 30 African countriesCoverage 2006: 30 African countries
90% of GDP90% of GDP
87% of 87% of populationpopulation

5 AFRICAN DEVELOPMENT BANKAFRICAN DEVELOPMENT BANK
11 What is the African Economic Outlook What is the African Economic Outlook Project?Project?African Performance: A two Speed Africa? African Performance: A two Speed Africa? 22
Promoting Transport InfrastructurePromoting Transport Infrastructure33

6 AFRICAN DEVELOPMENT BANKAFRICAN DEVELOPMENT BANK
Africa’s growth remains robustAfrica’s growth remains robust
Sources: African Economic Outlook 2006, IMF, OECD
0.0
1.0
2.0
3.0
4.0
5.0
6.0
7.0
1997 1998 1999 2000 2001 2002 2003 2004 2005(e) 2006(p) 2007(p)
grow
th r
ate
Total OECDTotal OECD
AFRICAAFRICA
%

7 AFRICAN DEVELOPMENT BANKAFRICAN DEVELOPMENT BANK
Oil producing countries are leading Oil producing countries are leading growthgrowth
3
4
5
6
7
1997
1998
1999
2000
2001
2002
2003
2004
2005
2006
2007
Rea
l G
DP G
row
th
Oil Exporting Countries Total Africa
0 5 10 15 20
GabonCameroon
TunisiaLibya
NigeriaEgypt
AlgeriaChad
Equat. GuineaSudanCongoAngola
Real GDP Growth 2005Source: African Economic Outlook 2006Source: African Economic Outlook 2006
Performance of oil producers
(%)
(%)

8 AFRICAN DEVELOPMENT BANKAFRICAN DEVELOPMENT BANK
Oil importers performed better than Oil importers performed better than expectedexpected
2
2.5
3
3.5
4
4.5
5
2000
2001
2002
2003
2004
2005
2006
2007
Oil Importing Countries
0 5 10
Oil importersMadagascar
ZambiaKenya
South AfricaSenegal
MaliBurkina FasoOil exporters
UgandaGhana
EthiopiaTanzania
Mozambique
Real GDP Growth 2005
Sources: African Economic Outlook 2006Sources: African Economic Outlook 2006
Best Performers in 2005 (%)
(%)

9 AFRICAN DEVELOPMENT BANKAFRICAN DEVELOPMENT BANK
TThanks to rising commodity prices and hanks to rising commodity prices and increased productionincreased production
40
80
120
160
200
240
280
Jan-
00
Jul-0
0
Jan-
01
Jul-0
1
Jan-
02
Jul-0
2
Jan-
03
Jul-0
3
Jan-
04
Jul-0
4
Jan-
05
Jul-0
5
Jan-
06
Petroleum Gold Copper Aluminium
Sources: African Economic Outlook 2006Sources: African Economic Outlook 2006

10 AFRICAN DEVELOPMENT BANKAFRICAN DEVELOPMENT BANK
Thanks to good harvest … and better Thanks to good harvest … and better internal policies internal policies
Lower inflationLower inflation
Sources: African Economic Outlook Sources: African Economic Outlook 20062006
(%)
024
68
101214
161820
Oil Importers Oil Exporters

11 AFRICAN DEVELOPMENT BANKAFRICAN DEVELOPMENT BANK
Fiscal discipline is maintainedFiscal discipline is maintained
Budget Balance to GDP Ratio
Region 1997-2003
2004 2005(e) 2006(p) 2007(p)
Central Africa -0.7 1.7 6.0 5.7 5.2 East Africa -3.2 -2.7 -3.4 -3.6 -3.3 North Africa -1.6 -0.9 3.2 3.9 3.4 Southern Africa -2.9 -1.8 -0.8 -0.6 -0.5 West Africa -2.5 3.1 6.6 6.3 4.2 Total -2.2 -0.5 2.1 2.3 1.8 Memorandum items: Oil-exporting countries -1.2 1.9 6.4 7.0 5.9 Non oil-exporting countries -3.1 -2.6 -2.4 -2.7 -2.7 Note: Due to lack of data, these aggregates do not include Liberia and Somalia. Source: African Economic Outlook 2006.
12 AFRICAN DEVELOPMENT BANKAFRICAN DEVELOPMENT BANK
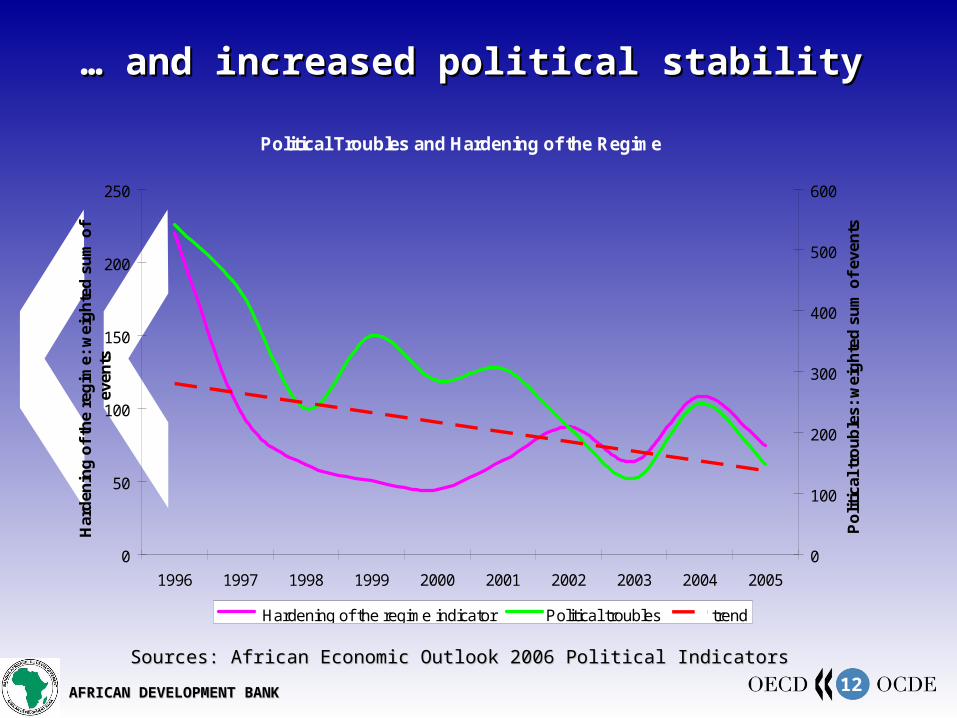
… … and increased political stabilityand increased political stability
Political Troubles and Hardening of the Regime
0
50
100
150
200
250
1996 1997 1998 1999 2000 2001 2002 2003 2004 2005
Har
den
ing
of
the
reg
ime:
wei
gh
ted
su
m o
f ev
ents
0
100
200
300
400
500
600
Po
litic
al t
rou
ble
s: w
eig
hte
d s
um
of
even
ts
Hardening of the regime indicator Political troubles trend
Sources: African Economic Outlook 2006 Political IndicatorsSources: African Economic Outlook 2006 Political Indicators

13 AFRICAN DEVELOPMENT BANKAFRICAN DEVELOPMENT BANK
Despite recent Despite recent improvements, major improvements, major development challenges development challenges remain…remain…

14 AFRICAN DEVELOPMENT BANKAFRICAN DEVELOPMENT BANK
Africa is still behind in reaching the MDGsAfrica is still behind in reaching the MDGs
Progress Towards Achieving Millennium Development Goals
0
20
40
60
80
100
120
Goal 1: Halvethe% of peoplesuffering from
hunger
Goal 2: Achieveuniversalprimary
education(netprimary enrol.
ratio)
Goal 3:Eliminategender
disparity(secondaryeducation)
Goal 4: Reduceby 2/3 under 5mortality rates
Goal 5: Reducematernal
mortality by 3/4
Goal 6: Halt andreverse thespread of
Tubercolosis
Satisfactory Non Statisfactory
Sources: African Economic Outlook 2006Sources: African Economic Outlook 2006

15 AFRICAN DEVELOPMENT BANKAFRICAN DEVELOPMENT BANK
Ratio of Trade Balance to GDP
Region 1997-2003
2004 2005(e) 2006(p) 2007(p)
Central Africa 11.3 19.7 27.8 28.9 26.3 East Africa -9.6 -12.3 -14.1 -14.3 -13.5 North Africa -1.7 3.5 6.9 7.0 5.0 Southern Africa 3.4 2.1 2.3 4.3 5.6 West Africa 7.2 12.9 14.3 12.9 10.3 Total 1.2 4.3 6.8 7.2 6.3 Memorandum items: Oil-exporting countries 4.4 14.2 19.8 20.1 18.1 Non oil-exporting countries -1.8 -4.2 -5.6 -5.7 -5.8 Note: Due to lack of data, these aggregates do not include Liberia and Somalia. Source: African Economic Outlook 2006.
Africa is divided…Africa is divided…
16 AFRICAN DEVELOPMENT BANKAFRICAN DEVELOPMENT BANK
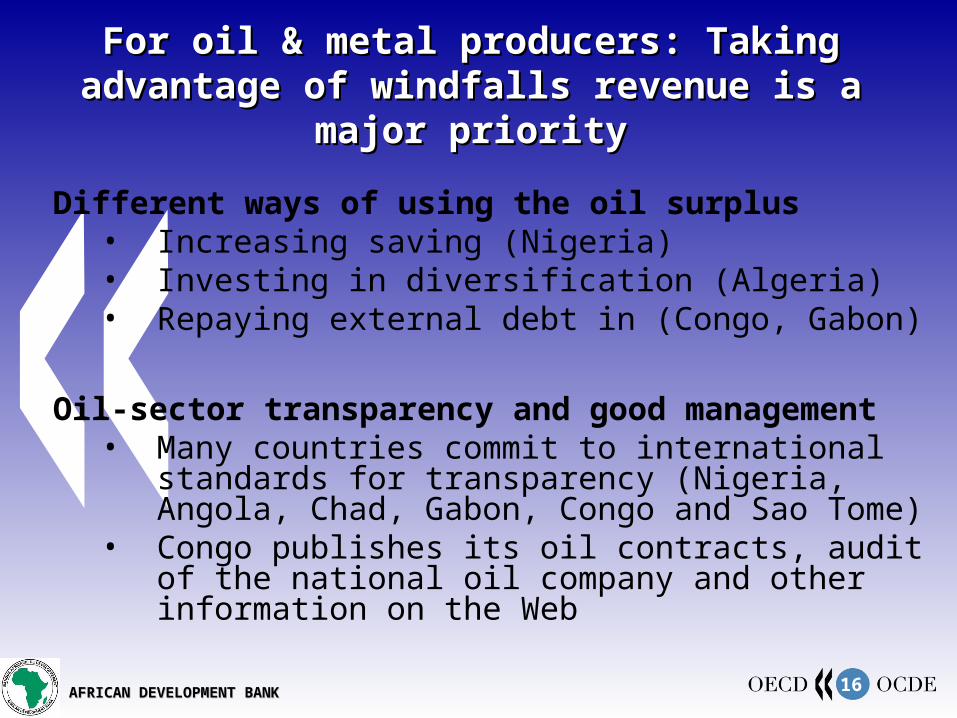
For oil & metal producers: Taking For oil & metal producers: Taking advantage of windfalls revenue is a advantage of windfalls revenue is a
major prioritymajor priority
Different ways of using the oil surplus• Increasing saving (Nigeria)• Investing in diversification (Algeria)• Repaying external debt in (Congo, Gabon)
Oil-sector transparency and good management• Many countries commit to international
standards for transparency (Nigeria, Angola, Chad, Gabon, Congo and Sao Tome)
• Congo publishes its oil contracts, audit of the national oil company and other information on the Web

17 AFRICAN DEVELOPMENT BANKAFRICAN DEVELOPMENT BANK
For most non oil and metal exporters: For most non oil and metal exporters: major challenge to manage aid major challenge to manage aid
effectivelyeffectively
Source: OECD/DAC Statistics (2006). DAC Members’ ODA: 1990-2004 and simulations to Source: OECD/DAC Statistics (2006). DAC Members’ ODA: 1990-2004 and simulations to 2006 and 2010, based on Monterrey and subsequent2006 and 2010, based on Monterrey and subsequent commitmentscommitments
0.33
0.22
0.26
0.30
0.36
0.00
0.05
0.10
0.15
0.20
0.25
0.30
0.35
0.4019
90
199
1
199
2
199
3
199
4
199
5
199
6
199
7
199
8
199
9
200
0
200
1
200
2
200
3
200
4
200
5
200
6
200
7
200
8
200
9
201
0
% o
f G
NI
0
20
40
60
80
100
120
140
OD
A (
2004
$ b
illio
n)
ODA as a % of GNI (left scale)
Total ODA(right scale)
Total ODA to Africa(right scale)

18 AFRICAN DEVELOPMENT BANKAFRICAN DEVELOPMENT BANK
……driven by debt relief and emergency driven by debt relief and emergency assistanceassistance
Total net official development assistance (ODA), non-aid official flows and private flows in Total net official development assistance (ODA), non-aid official flows and private flows in Africa, 1993-2004Africa, 1993-2004. (Source: OECD/DAC). (Source: OECD/DAC)
-5
0
5
10
15
20
25
30
1993 1994 1995 1996 1997 1998 1999 2000 2001 2002 2003 2004
2003 US$ billion
-5
0
5
10
15
20
25
30
other ODA Bilateral debt forgiveness Emergency aid Non-aid official flows Private flows

19 AFRICAN DEVELOPMENT BANKAFRICAN DEVELOPMENT BANK
For all African countries: need to sustain For all African countries: need to sustain resource mobilisation for developmentresource mobilisation for development
Strengthen national development strategies and associated operational frameworks
Promote investment to diversify and strategically position the economy
Improve infrastructure
Responsively restructure of public expenditures
Reform the tax system
20 AFRICAN DEVELOPMENT BANKAFRICAN DEVELOPMENT BANK
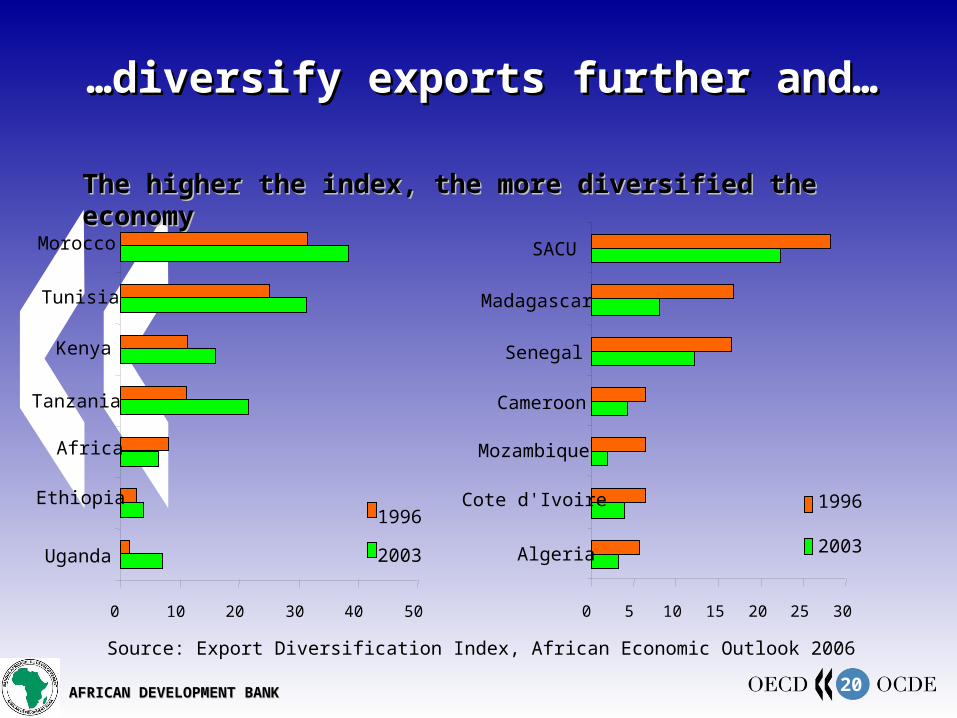
……diversify exports further and…diversify exports further and…
Source: Export Diversification Index, African Economic Outlook 2006
The higher the index, the more diversified the The higher the index, the more diversified the economyeconomy
0 10 20 30 40 50
Uganda
Ethiopia
Africa
Tanzania
Kenya
Tunisia
Morocco
1996
2003
0 5 10 15 20 25 30
Algeria
Cote d'Ivoire
Mozambique
Cameroon
Senegal
Madagascar
SACU
1996
2003

21 AFRICAN DEVELOPMENT BANKAFRICAN DEVELOPMENT BANK
MDG7Environmental sustainability
MDG6Combating
diseases MDG5Improving maternal health
MDG4Reducing child
mortality
MDG3Eliminate gender
disparity
MDG2Achieve universal
1ary education
MDG 1Eradicate extreme poverty
and hunger
Transport Infrastructure
Improve mobility
Reduce prices
Improve mobility
Free time
Women benefit the most
Better supply of food, water & medicines
Faster hospitalisation
Better supplies & staff
Better use of networks
Project selection
…promote transport infrastructure

22 AFRICAN DEVELOPMENT BANKAFRICAN DEVELOPMENT BANK
11 What is the African Economic Outlook What is the African Economic Outlook Project?Project?African Performance: A two Speed Africa?African Performance: A two Speed Africa? 22
Promoting Transport InfrastructurePromoting Transport Infrastructure33

23 AFRICAN DEVELOPMENT BANKAFRICAN DEVELOPMENT BANK
A continent of stranded mobility?
Source: Pourtier (2003)

24 AFRICAN DEVELOPMENT BANKAFRICAN DEVELOPMENT BANK
Transport / insurance costs as % of trade Transport / insurance costs as % of trade valuevalue
0 5 10 15 20 25 30 35
SSA Least Developed Landlocked
SSA Landlocked
SSA Coastal countries
All land locked Developing
All Developing Countries
OECD Countries IMPORT
EXPORT
Source: Faye, McArthur, Sachs and Snow (2004) and UNCTAD (2003)

25 AFRICAN DEVELOPMENT BANKAFRICAN DEVELOPMENT BANK
Critical condition of all transport modesCritical condition of all transport modes
Road– Only 19% is paved (against 27% in lat Am & 43% in South Asia)– 4% of registered vehicles, 10% of total deaths– Accidents cost 3% of GDP every year in Egypt
Rail– 3.5% of developing countries passenger flows, but 20% of GDP
& population
Air– <2% of developing countries passenger and freight flows– Few airports with international standard– 4.5% of traffic, 25% of accidents
Ports– Most ports are under equipped and have reached maximum
capacity– Inefficient: ZAF (17 c.u/h), Dar es Salam (21) ≠ Brazil (42)

26 AFRICAN DEVELOPMENT BANKAFRICAN DEVELOPMENT BANK
198
0
198
2
198
4
198
6
198
8
199
0
199
2
199
4
199
6
199
8
200
0
200
2
200
4
300
1300
2300
3300
4300
5300
6300
7300
To
tal a
mo
un
t ($
milli
on
20
03
)
Year
Total aid in transport Total aid in social and governance sectors
Source: OECD/DAC Creditor reporting System (commitments) data Source: OECD/DAC Creditor reporting System (commitments) data aggregated by sectors : 1980-2004aggregated by sectors : 1980-2004
Shift in ODA to social sectors

27 AFRICAN DEVELOPMENT BANKAFRICAN DEVELOPMENT BANK
Money is not enoughMoney is not enough
Strong regulation– Strong commitment / negotiation skills– Autonomous regulatory body (ex. Zambia)
Better planning (ex. Master Plan for Greater Cairo)– Selection of projects (between the different transport means,
trade-off between developing rural road networks and investing in corridors serving established higher density routes)
– Integration in poverty reduction strategy & medium-term expenditure framework
Community participation– Maximising employment generation and easing maintenance– Involving women
Regional cooperation– Benefiting from economies of scale– Partnering with NEPAD & regional unions

28 AFRICAN DEVELOPMENT BANKAFRICAN DEVELOPMENT BANK
Last but not Last but not least…least…

29 AFRICAN DEVELOPMENT BANKAFRICAN DEVELOPMENT BANK
African countries need to…African countries need to…
Maintain social safety nets during economic restructuring
Formalise the informal sector
Promote local development, employment and service delivery
Forge a coherent growth and social-policy agenda and…

30 AFRICAN DEVELOPMENT BANKAFRICAN DEVELOPMENT BANK
Provide effective leadership and Provide effective leadership and governance focal pointsgovernance focal points
Build wide-scale ownership of a continuous reform process
Strengthen feasible regional initiatives
Provide institutional empowerment and policy leadership

31 AFRICAN DEVELOPMENT BANKAFRICAN DEVELOPMENT BANK
Thank youThank youfor your attention!for your attention!
Contact:Contact:www.oecd.org/dev/aeowww.oecd.org/dev/aeo