1 AFB/1991-04-05 F-117A... · MEMORANDUM FOR RECORD: SUBJECT: West Ramp Contamination related to...
25
REPLY TO ATTN OF SUBJECT TO DEPARTMENT OF THE AIR FORCE 1 -( 6/u HEADQUARTERS 8330 COMBAT SUPPORT GROUP <TACI HOLL+JMAN AIR FORCE BASE. NM 88330·5000 I t 833 CSG/DE F-117A Realignment Construction Attn: Mr Rich Mayer US Environmental Protection First Interstate Bank Tower 1445 Ross Street Dallas, TX 75202-2733 Agency (6H-PS) 1. Attached is a Memorandum for Record from Ms Sharon Moore, Holloman AFB Envi- ronmental Coordinator, summarizing her conversations with the USEPA and NMEID personnel regarding the contamination found on the 49th West Ramp at Holloman AFB. The F-117A realignment construction is scheduled to begin in this immedi- ate area sometime in the spring/summer of 1991. Her memo discusses Holloman's intent to pursue corrective action, concurrent with the construction, in the event hazardous wastes/hazardous constituents are encountered at any time during the F-117A realignment construction. 2. We request your coordination and concurrence on the memorandum, or provide us your comments as soon as possible. We invite you to "take a look" at the area during construction activities, upon removal of the ramp, and prior to con- struction of the F-117A hangars. 3. We would like to thank you in advance for any assistance you can provide. Your rapid response on the memorandum would be appreciated. If you have any questions, please contact Sharon Moore at (505) 479-3931. '(( '£: ,J;;wt I{ HOWARD '.r; • MOFfiti/ / Deputy Base Civil Engineer Atch Memorandum for Record cc: w/Atch Dr Bruce Swanton, NMEID Ron Jahns, AFREE
Transcript of 1 AFB/1991-04-05 F-117A... · MEMORANDUM FOR RECORD: SUBJECT: West Ramp Contamination related to...

REPLY TO ATTN OF
SUBJECT
TO
DEPARTMENT OF THE AIR FORCE 1 -( 6/u HEADQUARTERS 8330 COMBAT SUPPORT GROUP <TACI
HOLL+JMAN AIR FORCE BASE. NM 88330·5000
I t
833 CSG/DE
F-117A Realignment Construction
Attn: Mr Rich Mayer US Environmental Protection First Interstate Bank Tower 1445 Ross Street Dallas, TX 75202-2733
Agency (6H-PS)
1. Attached is a Memorandum for Record from Ms Sharon Moore, Holloman AFB Environmental Coordinator, summarizing her conversations with the USEPA and NMEID personnel regarding the contamination found on the 49th West Ramp at Holloman AFB. The F-117A realignment construction is scheduled to begin in this immediate area sometime in the spring/summer of 1991. Her memo discusses Holloman's intent to pursue corrective action, concurrent with the construction, in the event hazardous wastes/hazardous constituents are encountered at any time during the F-117A realignment construction.
2. We request your coordination and concurrence on the memorandum, or provide us your comments as soon as possible. We invite you to "take a look" at the area during construction activities, upon removal of the ramp, and prior to construction of the F-117A hangars.
3. We would like to thank you in advance for any assistance you can provide. Your rapid response on the memorandum would be appreciated. If you have any questions, please contact Sharon Moore at (505) 479-3931.
C~/-t, '(( '£: ,J;;wt I{ HOWARD '.r; • MOFfiti/ / Deputy Base Civil Engineer
Atch Memorandum for Record
cc: w/Atch Dr Bruce Swanton, NMEID Ron Jahns, AFREE

MEMORANDUM FOR RECORD:
SUBJECT: West Ramp Contamination related to the Stealth (F-117A) Realignment Construction
1. In recent weeks I have been in contact with Dr Bruce Swanton, New Mexico Environmental Improvement Division, and Mr Sam Tates, USEPA Region VI, with regard to the contamination problem associated with the realignment of the F-117A. They have both indicated to me if the source of the contamination cannot be tied to an underground storage tank (UST), then the soils in the area must be evaluated by the toxicity characteristic leaching procedure (TCLP) to determine if they are characteristically hazardous wastes. Although we have not ruled out the possibility of a UST source in this area, we have reviewed our records and files and, at this time, have no indication that a UST exists or has ever existed in this area.
2. To identify the extent and depth of the contamination, 49 soil gas samples were taken in the area. A report is provided describing this effort with analytical results included (see Atch 1). The soil gas analyses indicate hydrocarbon constituents are widespread throughout the area, although they do not seem to extend too deep below the ramp (based on 8 soil gas samples at 2 and 4 foot depths).
3. Per the recommendations of Dr Swanton and Mr Tates, we are moving forward with TCLP testing on approximately 20 soil borings at the West Ramp. Also, we plan to install six groundwater monitoring wells to determine if a product plume exists under the ramp. Should hydrocarbon contaminated soils that fail the TCLP test be found, these soils must be handled as hazardous wastes when removed from the construction zone. Holloman AFB may stockpile the removed soils (hazardous wastes) for a period (up to 90 days) to allow us time to establish a contract for the packaging, transporting, and disposal off-site at an EPA-approved facility. According to the regulators, TC wastes are not yet prohibited from land disposal such that land treatment disposal options may be available. An alternative to off-site disposal would be treatment on-site via land farming. However, this would require us to obtain an emergency RCRA permit for a hazardous waste land treatment facility and a hazardous waste storage area for those soils awaiting land treatment.
4. If the soils in the construction zone are hazardous due to TC characteristics, the site would be defined as a solid waste management unit (SWMU) requiring corrective action, and could include areas adjacent to the construction zone. Corrective action within any excavation/future construction area would need to be completed prior to placement of the new F-117A facilities, and corrective action in adjacent areas may have to occur concurrently. Since corrective action for a SWMU must address hazardous constituents as well as hazardous waste, additional sampling and analyses may be required for substances listed in Appendix VIII of 40 CFR 261 or Appendix IX of 40 CFR 264. Also, even though the soils may "pass" the TCLP test (i.e., not hazardous wastes), the site may still be defined as a SWMU requiring additional sampling and analyses for Appendix VIII or IX substances and, potentially, corrective action.
5. I have also talked with Mr Rich Mayer, Permitting Section, USEPA Region VI; he said we do not need a special permit to clean up this SWMU or any other SWMU. He said we have the right to clean up a SWMU at any time without their approval, blessing, coordination, etc., but our actions will be subject to EPA's determination of adequacy/inadequacy at a later date. If we fail to adequately address
1

all areas of concern, then at some point in the future EPA may require additional sampling and possibly the installation of in-situ treatment systems, such as soil ventilation. Mr Mayer said our current HSWA permit requires the development of a safety and health plan, and a sampling and analysis plan which, although not yet completed, would be applicable to the clean-up of this site. He emphasized the need to carefully document how/where samples are collected, chain-of-custody procedures, and safety procedures practiced during the clean-up action. He further indicated a need to determine what constituents and parameters (specified by EPA) must be addressed for proper characterization of the site, along with the appropriate EPA action levels and clean--up standards.
6. Mr Mayer said we may be allowed to leave some contaminates, including hazardous wastes, in place if it can be demonstrated the wastes pose no threat to health or the environment. A risk assessment must be accomplished to justify this action.
7. It is my understanding that if the soils are not characteristically hazardous (exceed TCLP standards) and it is a non-UST source, we may also be regulated under the authority of the NMEID Groundwater Bureau. We do not anticipate any corrective action requirements from this bureau as their regulations only regulate groundwater that contains less than 10,000 ppm total dissolved solids (TDS) The groundwater below Holloman AFB contains greater than 10,000 ppm TDS. Consequently, I foresee no corrective action requirements from the NMEID Groundwater Bureau and am only mentioning it because we may need to coordinate with them.
8. On 13 Mar 1991, a meeting was held at the USEPA Region VI offices to discuss various soil and groundwater analyses to be cunducted prior to and during construction in the subject area. Meeting participants included Rich Mayer, USEPA; Roger Wilkson, Holloman AFB; Ron Jahns, Air Force Regional Environmental Office; Cedric Adams, Headquaters Tactical Air Command; David Morgan, New Mexico Environmental Improvement Division; and Larry Janis, US Army Corps of Engineers. It was decided during this meeting that the following constituents should be tested for during the upcoming sampling effort:
Benzene, Toluene, Ethylbenzene, Xylene (BETX) Metals, including cadmium, chromium, lead, zinc, and mercury Total Recoverable Petroleum Hydrocarbons, pH, & Specific Conductance
The above constituents shall be determined utilizing both the TCLP (where appropriate) and total concentration analytical methods.
9. Questions regarding this MFR may be directed to myself at (505) 479-3931 or DSN 867-3931.
SHARON N. MOORE Ch, Envrntl Plan Branch 833 CSG/DEV; Holloman AFB, NM 88330
I concur with this memorandum as written.
2
Atch Soil Gas Survey
RICH MAYER Permitting Section US EPA Region VI
Date
l I ' i
r ,-----~~--~--1
SOIL GAS SURVEY
HOLLOMAN AIR FORCE BASE
ALAMOGORDO, NEW MEXICO
' --:::.::;.;/ '.._ I I I I
~-- ~ENVIRONMENTAL SERVICES, INC. _,__,
SOIL GAS SURVEY
HOLLOMAN AIR FORCE BASE
ALAMOGORDO, NEW MEXICO
PREPARED FOR
U.S. ARMY CORPS OF ENGINEERS
P.O. BOX 1580
ALBUQUERQVE, NEW MEXICO 87103-1580
PREPARED BY
TARGET ENVIRONMENTAL SERVICES, INC.
9180 RUMSEY ROAD
COLUMBIA, MARYLAND 21045
(301) 992-6622
JANUARY 1991
EXECUTIVE SUMMARY
On January 22-24, 1991, TARGET Environmental Services, Inc.
(TARGET) conducted a soil gas survey at Holloman Air Force ·Base,
located in Alamogordo, New Mexico. The survey area was located on
the western side of the base in and around a concrete apron.
Analysis of the samples by GC/FID for petroleum hydrocarbons
revealed the presence of moderately low levels within the survey
area.
The Total Volatiles data for the soil gas samples show the
most extensive occurrence southwest of Building #877. Comparable
concentrations were present in the west ramp and west of Building
#868. A very lov: level of Total Volatiles was present in the
ambient air sample collected in the basement of Building #877.
The chromatogram signatures of the soil gas samples sho;,;
Analyte concentrations and chromatographic data observed in
samples from the survey area indicate that petroleum hydrocarbons
are present in the subsurface near Buildings #877 and #868 and in
several locations in the west ramp. Additional sampling and
analysis would be 'necessary to determine the extent and severity
of petroleum contamination· in the soil. Furthermore, the volatile
hydrocarbons present in the subsurface could pose a health hazard
to individuals during excavation activities within the survey area.
i
.,
Introduction
The u.s. Army corps of Engineers, Albuquerque Division, has
contracted TARGET Environmental Services, Inc. (TARGET) to perform
a soil gas survey at Holloman Air Force Base, Alamogordo, New
Mexico. The survey area is located in the western portion of the
base in and around a concrete apron and near Buildings #868, #877
and #890. The purpose of the survey was to determine the presence,
extent and nature of subsurface petroleum hydrocarbons within the
survey area. The field phase of this survey 'Was conducted on
January 22-24, 1991.
Detectability
The soil gas survey data presented in this report are the
result of precise sampling and measurement of contaminant concen-
.!- •'-- ·--...:3--- ..,,...."'"'0 ~n~lV~P OPtection at a partiCUlar
location is representative of vapor, dissolved, and/or liquid phase
contamination at that location. The presence of detectable levels
of target analytes in the vadose zone is dependent upon several
factors, including the presence of vapor-phase hydrocarbons or
dissolved or liquid concentrations adequate to facilitate volatil
ization into the unsaturated zone.
1
Terminology
In order to prevent misunderstanding of certain terms used in
this report, the following clarifications are offered:
The term "feature11 is used in reference to a discernible
pattern in the contoured data. It denotes a contour form rather
than a definite or separate chemical occurrence.
The term "occurrence" is used to indicate an area where
chemical compounds are present in sufficient concentrations to be
detected by the analysis of soil vapors. The term is not indica
tive of any specific mode of occurrence (vapor, dissolved, etc.),
and does not necessarily indicate or suggest the presence of "free
product" or "phase-separated hydrocarbons."
The term "anomaly" refers to an area where hydrocarbons were
measured in excess of what would normally be considered 11 natural 11
or "oacKg rouna ;, .1. ~v ~ .1.:::. •
The term "analyte" refers to any of the hydrocarbons standard
ized for quantification in the chromatographic analysis.
The term "vadose zone" represents the unsaturated zone between
the ground water table and the ground surface.
The term "indicates" is used when evidence dictates a unique
conclusion. The term "suggests" is used when several explanations
of certain evidence are possible, but one in particular seems more
likely. As a result, "indicates" carries a higher degree of
confidence in a conclusion than does "suggests."
2
Field Procedures
Soil gas samples were collected at a total of 49 locations at
the site, as shown in Figt:r-e 1. To collect the samples a 1/2 inch
hole was produced to a depth ranging from 0.5 - 4 feet (Table 1)
by using a drive rod. Concrete or asphalt covered most of the
survey area, and a rotary hammer drill was employed for penetration
prior to using the drive rod. Concrete was up to 2 feet thick at
some locations. The entire sampling system was purged with ambient
air drawn through an organic vapor filter cartridge, and a stain
less steel probe was inserted to the full depth of the hole and
sealed off frow the atmosphere. A sample of in-situ soil gas was
then withdrawn through the probe and used to purge atmospheric air
from the sampling system. A second sample of soil gas was
withdrawn through the probe and encapsulated in a pre-evacuated
sealing vial was detached from the sampling system, packaged,
labeled, and stored for laboratory analysis.
Soil gas samples were collected at dual depths (0.5- 1.5 feet
and 4 feet) at eight (8) sample locations near the western corner
of Building #877 (Samples 11-18). The 4 foot samples were
collected after obtaining the shallower sample and are designated
by a three digit number with the depth "4" as the first digit. A
comparison of data from both depths is shown in Table 2.
An ambient air sample (Sample 30) was collected over an open
sump in the basement of Building #877. This sample was obtained
by placing the sample probe over the sump area and collecting as
described above.
3

Prior to the day's field activities all sampling equipment,
slide hammer rods, and probes were decontaminated by washing with
soapy water and rinsing thoroughly. Internal surfaces were flushed
dry using pre-purified nitrogen or filtered ambient air, and
external surfaces were wiped clean using clean paper towels.
Field control samples were collected at the beginning and end
of each day's field activities. These QA/QC samples were obtained
by inserting the probe tip into a tube flushed by a 20 psi flow of
pre-purified nitrogen and collecting in the same manner as
described above.
4
Laboratory Procedures
All of the samples collected during the field phase of the
survey were analyzed according to EPA Method 602 {modified) on a
gas chromatograph equipped with a flame ionization detector
(GC/FID), but using direct injection instead of purge and trap.
Analytes selected for standardization were:
methyl tertiary butyl ether (MTBE) benzene toluene ethylbenzene meta- and para-xylene ortho-xylene
These compounds were chosen because of their utility in evaluating
the presence of petroleum products such as fuels, lubricating oils,
and non-halogenated solvents.
FID Total Volatiles values were generated by summing the areas
of all integrated chromatogram peaks and calculated using the in-
strurnent response factor for toluene. Injection peaks, which also
contain the light hydrocarbon methane, were excluded to avoid the
skewing of Total Volatiles values due to injection disturbances and
biogenic methane. For samples with low hydrocarbon concentrations,
the calculated Total Volatiles concentration is occasionally lower
than the sum of the individual analytes. This is because the re
sponse factor used for the Total Volatiles calculation is a con-
stant, whereas the individual analyte response factors vary with
concentration. It is important to understand that the Total
Volatiles levels reported are relative, not absolute, values.
The analytical equipment was calibrated using an instrument-
response curve and injection of known concentrations of the above
standards. Retention times of the standards were used to identify
5
the peaks in the chromatograms of the field samples, and their
response factors were used to calculate the analyte concentrations.
The tabulated results of the laboratory analysis of the soil gas
samples are reported in micrograms per liter (~g/1) in Table 2.
Although "micrograms per liter" is equivalent to "parts per billion
(vjv)" in water analyses, they are not equivalent in gas analyses,
due to the difference in the mass of equal volumes of water and gas
matrices.
Map sample points with no data shown indicate that the analyte
concentrations in the sample were below the detection limit.
Because MTBE and pentane co-elute, they are listed together in the
table.
For QA/QC purposes, a duplicate analysis was performed on
every tenth field sample. Laboratory blanks of carrier gas were
~h~ v~rv low level
of Total Volatiles observed in Laboratory Blank BCACH-4 is probably
due to carryover in the chromatographic column.
6

Discussion and Interpretation of Results
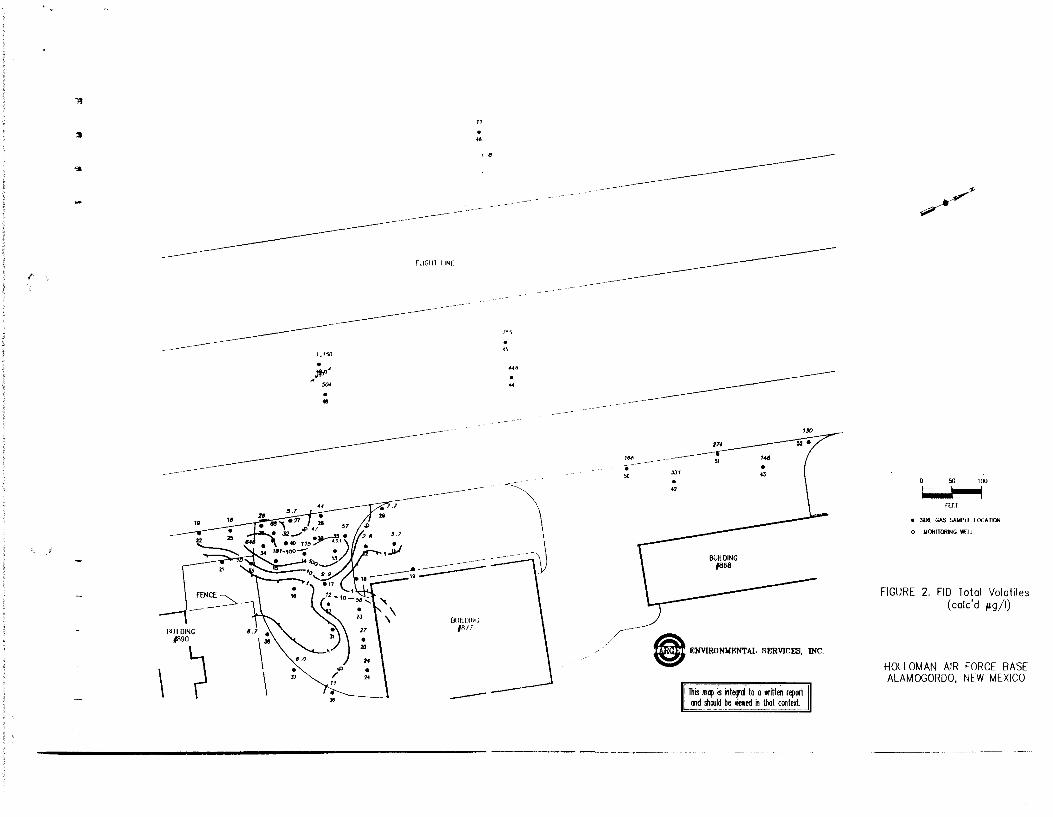
In order to provide graphic presentation of the results,
individual data sets in Table 2 have been mapped and contoured to
produce Figures 2 through 7. Dashed contours are used where pat-
terns are extrapolated into areas of less complete data, or as
auxiliary contours. The low sample density in some areas of the
site preclude meaningful contouring.
The Total Volatiles map (Figure 2) shows several areas of
moderately low concentrations. The most extensive occurrence is
observed southwest of Building #877 (Stations 13, 14 and 34), with
lo~er levels extending westward toward the west ramp and eastward
to the survey boundary. Comparable concentrations are prese~t in
the west ramp and west of Building #868.
Relatively low levels of the standardized analytes were
::---~-~ .... +- •.•'ho...-o 'T'nt-::.1 Vt:\1 ~+- i1 P!'; were hiahest. MTBE/pentane (Figure
3) map patterns resemble those of Total Volatiles but are less
extensive west and south of Building #877. Benzene_, ethylbenzene,
m- and p-xylene, o-xylene (Figures ;······
CHROMATOGRAM 1. GC/FID SIGNATURE OF SAMPLE 34
4-7) and toluene (not shown) were
even less extensive near Building
#877 and were not present above
the 1 ~g/1 detection limit along
the southern side of the building.
The chromatogram signatures of
samples with elevated levels of
volatile hydrocarbons, as exem-
plified by Sample 34, Chromatogram
7

1, show characteristics of jet fuel. It should be noted that the
chromatographic signatures of jet fuel, diesel fuel and fuel oil
are indistinguishable under TARGET's analytical conditions.
The Total Volatiles and analyte concentrations for samples
collected at dual depths (Table 2) near Building #877 were
comparable, and the chromatogram signatures of these samples were
similar.
A very low level of Total Volatiles was present in the ambient
air sample (Sample 30) collected over the sump area in the basement
of Building #877. None of the standardized analytes were observed
above the 1 ~g/1 detection limit in this sample.
Analyte concentrations and chromatographic data observed in
samples from the survey area indicate that petroleum hydrocarbons
are present in the subsurface near Buildings #877 and #868 and in
'"'!' ,, .•
~---- ... - ..... - .a...\-- .. ·- ~"- ---..... ~~.mpJ i no ;:~nd
analysis would be necessary to determine the extent and severity
of petroleum contamination in the soil. Furthermore, the volatile
hydrocarbons present in the subsurface could pose a health hazard
to individuals during excavation activities within the survey area.
8
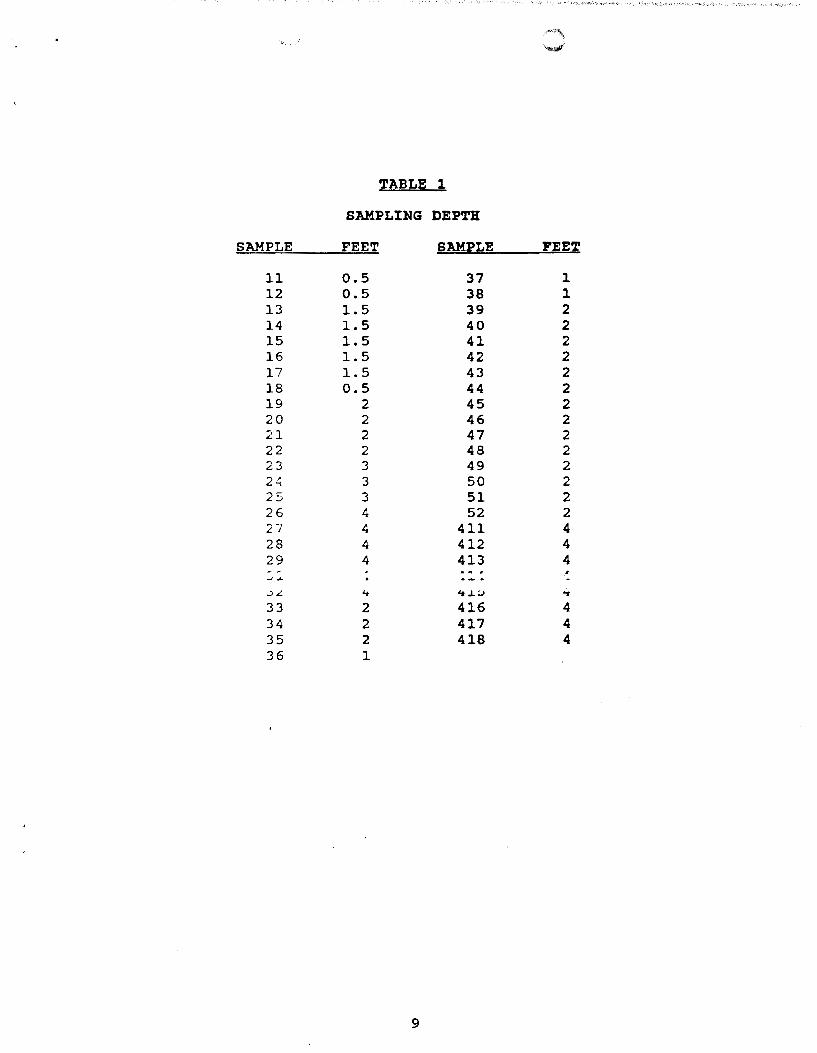
TABLE 1
SAMPLING DEPTH
SAMPLE FEET SAMPLE FEET
11 0.5 37 1 12 0.5 38 1 13 1.5 39 2 14 1.5 40 2 15 1.5 41 2 16 1.5 42 2 17 1.5 43 2 18 0.5 44 2 19 2 45 2 20 2 46 2 21 2 47 2 22 2 48 2 23 3 49 2 2~ 3 50 2 25 3 51 2 26 4 52 2 27 4 411 4 28 4 412 4 29 4 413 4
..)L. .. <t~::J .. 33 2 416 4 34 2 417 4 35 2 418 4 36 1
9

TABLE 2
LABORATORY RESULTS FLAME IONIZATION DETECTOR ANALYSIS
CONCENTRATIONS IN MICROGRAMS PER LITER
PENTANE/ ETHYL- m- ' p- o- 'l'OTAL SAMPLE MTBE 1 BENZENE TOLUENE BENZENE XYLENE XYLENE VOLATILES 2
11 <1. 0 <1.0 <1.0 <1.0 <1.0 <1.0 3.7 12 <1. 0 <1. 0 <1. 0 <1.0 <1.0 <1.0 2.6 13 53 /L£} 5.5 <1.0 4.1 1.4 433 14 6.9 <1. Q 2.6 <1.0 2.2 <1.0 115 15 11 1.1 i 3.5 <1. 0 3.4 1.2 181 16 <1. 0 <1. 0 <1. 0 <1.0 <1.0 <1.0 <1. 0 17 <1. 0 <1.0 <1.0 <1.0 <1.0 <1.0 9.9 18 <1.0 <1.0 <1.0 <1.0 <1.0 <1.0 <1. 0 19 <1. 0 <1. 0 <1. 0 <1. 0 <1. 0 <1. 0 <1. 0 20 1.9 <1. 0 <1. 0 <1. 0 <1.0 <1.0 27 21 <1. 0 <1.0 <1.0 <1. 0 <1. 0 <1.0 <l. 0 22 1.2 <1. 0 <1. 0 <1.0 <1. 0 <1. 0 19 23 3.8 <1.0 <1. 0 <1. 0 <1. 0 <1. 0 58 24 1.6 <1.0 <1. 0 <1. 0 <1. 0 <1.0 24 25 1.2 <1.0 <1. 0 <1. 0 <1.0 <1. 0 18
~ . .. .. :" ... "' ....... ('\ <1.0 ?h
27 <1. () <1. 0 <1. 0 <1.0 <1. 0 <1. 0 5.7 28 1 . .:., <1. 0 1.0 <1. 0 <1. 0 <1. 0 44 29 <1. 0 <1. 0 <1.0 <1. 0 <1.0 <1.0 7.7 31 <1. 0 <1. 0 <1. 0 <1.0 <1.0 <1.0 <1.0 32 <1. 0 <1. 0 <1.0 <1.0 <1.0 <1.0 12 33 <1.0 <1. 0 <1. 0 <1.0 <1.0 <1.0 10 34 48 3.0 9.9 1.4 10 3.1 646 35 <1. 0 <1. 0 <1.0 <1.0 <1.0 <1.0 57 36 <1. 0 <1.0 <1.0 <1.0 <1.0 <1.0 11 37 <1.0 <1.'0 <1. 0 <1.0 <1.0 <1.0 6.0 38 <1.0 <1.0 <1.0 <1.0 <1.0 <1.0 6.7 39 2.7 <1. 0 <1.0 <1.0 <1.0 <1.0 47 40 1.9 <1.0 <1.0 <1.0 <1.0 <1.0 32 41 7.0 <1.0 1.1 <1.0 1.1 <1.0 88 42 32 3.4 17 3.3 3.1 <1.0 331 43 12 13 12 4.1 4.8 1.9 148 44 45 25 22 6.6 6.6 2.8 448
1CONCENTRATIONS BASED ON RESPONSE FACTOR OF MTBE
2CALCULATED USING THE SUM OF THE AREAS OF ALL INTEGRATED CHROMATOGRAM PEAKS AND THE INSTRUMENT RESPONSE FACTOR FOR TOLUENE
10

TABLE 2 (cont)
LABORATORY RESULTS FLAME IONIZATION DETECTOR ANALYSIS
CONCENTRATIONS IN MICROGRAMS PER LITER
PENTANE/ ETHYL-SAMPLE MTBE 1 BENZENE TOLUENE BENZENE
m- ' p- o- TOTAL XYLENE XYLENE VOLATILES 2
45 46 47 48 49 50 51 52
83 10 65 47 93 12 22 10
36 6.2
29 39 89 17 24 13
27 6.9
25 26 85 16 18 11
8.0 1.7 6.4 7.2
24 5.1 6.4 3.7
COMPARISON OF SAMPLES COLLECTED AT 2 DEPTHS
11 411
12 l!i/
13 413
14 414
15 415
16 416
17 417
18 418
<1. 0 <1. 0
<1. 0 ..,., n
53 7.1
6.9 1.2
11 2.4
<1.0 <1.0
<1.0 <1. 0
<1.0 <1.0
<1.0 <1.0
<1.0 <1. n
3. 6 <1.0
<1. 0 <1. 0
1.1 <1.,0
<1.0 <1.0
<1.0 <1.0
<1.0 <1.0
<1. 0 <1.0
<1. 0 < l _I!
5.5 1.8
2.6 <1.0
3.5 1.8
<1.0 <1. 0
<1. 0 <1.0
<1.0 <1.0
<1. 0 <1.0
<1. 0 <1. 0
<1. 0 <1.0
<1. 0 <1. 0
<1.0 2~6
<1.0 <1.0
<1.0 <1.0
<1.0 <1.0
7.4 2.4 9.7 6.7
28 4.4 6.3 3.1
<1. 0 <1.0
<1. 0 <1. 0
4.1 1.4
2.2 <1.0
3.4 <1. 0
<1.0 <1.0
<1.0 <1.0
<1.0 <1.0
1CONCENTRATIONS BASED ON RESPONSE FACTOR OF MTBE
2.7 <1. 0 3.1 2.6
12 2.0 3.0 1.2
<1.0 <1. 0
<1.0 <1. 0
1.4 <1. 0
<1.0 <1.0
1.2 1.1
<1.0 <1.0
<1.0 <1.0
<1.0 <1.0
755 118 658 504
1,150 166 274 130
3.7 2.7
2. 6 1.8
92
115 34
181 70
<1. 0 <1.0
9.9 <1.0
<1. 0 <1. 0
2CALCULATED USING THE SUM OF THE AREAS OF ALL INTEGRATED CHROMATOGRAM PEAKS AND THE INSTRUMENT RESPONSE FACTOR FOR TOLUENE
11

TABLE 2 Ceont)
LABORATORY RESULTS FLAME IONIZATION DETECTOR ANALYSIS
CONCENTRATIONS IN MICROGRAMS PER LITER
PENTANE/ ETHYL-SAMPLE MTBE 1 BENZENE TOLUENE BENZENE
m- ' p- o- TOTAL XYLENE XYLENE VOLATILES2
AMBIENT AIR SAMPLE
30 <1. 0 <1.0
FIELD CONTROL SAMPLES
1 2 3 4 5 6
<1. 0 <1.0 <1. 0 <1.0 <1.0 <1.0
<1.0 <1. 0 <1.0 <1.0 <1. 0 <1.0
<1.0
<1.0 <1.0 <1.0 <1. 0 <1.0 <1.0
LABORATORY DUPLICATE ANALYSES
.1.J
15R
27 27R
37 37R
46 46R
11
<1.0 <1.0
<1. 0 <1.0
10 10
LABORATORY BLANKS
BCACH-1 <1. 0 BCACH-2 <1. 0 BCACH-3 <1.0 BCACH-4 <1. 0
l..L
<1.0 <1.0
<1.0 <1.0
6.2 6~4
<1.0 <1.0 <1.0 <1.0
<1. 0 <1.0
<1.0 <1.0
6.9 7.0
<1.0 <1.0 <1.0 <1.0
<1.0
<1.0 <1.0 <1.0 <1. 0 <1.0 <1. 0
..... , ('\
<.l..U
<1.0 <1.0
<1.0 <1.0
1.7 1.6
<1.0 <1.0 <1.0 <1.0
<1.0
<1.0 <1.0 <1.0 <1.0 <1. 0 <1.0
<1.0 <1.0
<1.0 <1.0
2.4 2.3
<1.0 <1.0 <1.0 <1.0
1CONCENTRATIONS BASED ON RESPONSE FACTOR OF MTBE
<1.0
<1.0 <1.0 <1. 0 <1. 0 <1. 0 <1.0
, • ?.
<1.0 <1.0
<1.0 <1.0
<1.0 <1.0
<1.0 <1.0 <1.0 <1.0
3.1
<1.0 <1. 0 <1. 0 <1. 0 <1.0 <1. 0
181
5.7 8.8
6.0 6.2
118 121
<1.0 <1.0 <1.0
3.9
2CALCULATED USING THE SUM OF THE AREAS OF ALL INTEGRATED CHROMATOGRAM PEAKS AND THE INSTRUMENT RESPONSE FACTOR FOR TOLUENE
12

• " •
" ..• . ' ..
---
~ l·r':.
•!It ,. n~ ..
-- .~ 22---:;-- I: ~ .: .. .. . "
-------fliGHT liNf
• .. (,.1-
J~
• 47
• "
--------------~ .. "
• 11 -j
• e40 ell :m •
~-------- .. • • •
!I lJ15,. 13 -_..J-----~ 111 -111 -.----------
fENCE \ --~ \ .~ BUILDING
1890
\) \~ \
• :51
•17
• l2
• l1
.~. __ "'
. 10
,.
BUILDING 1811
---
--
--
b
p
/
------------------
,, • ""
/------·
,4
• 42
,!
_--f·---" . 51 ..
• 4J
~ l<NVIRONMENTAl. SERVICES, INC.
[ lllis map is inte11~ to a written repoct ·11 onrl cilould be ~ewed n that cootcxt
y'~
?"
Fll'T
e SOIL GAS SAIIPLE LOCA 110N
* 11<1<1 TOR1NG WEll
FIGURE 1. Sample Locations
HOLLOMAN AIR FORCE BASE ALAMOGORDO, NEW MEXICO
"'II
:3
,.
l'
BUilDING f890
\ ~
1,.150
• lJI'' A'
.504 . ..
----
11 . .. ·~
FLIGIIl liNE
81JIIDING #811
--
7 .... 'i . ., HH . "
<~
-
Z74
"'" ---; -- 51 .--50
/----
JJ1 . 42
e ENVIRONVENTAL SERVICES, INC.
[This m~ is integ-ci to o written report J and shoold be viewed in that cootext --- ----··~~-~----------
~ ~---
ffiT
• SOIL GAS SAIAPl£ LOCATION
9 WOO/TORING ·~u
FIGURE 2. FID Total Volatiles (colc'd pg/1)
HOLLOMAN AIR FORCE RASE ALAMOGORDO, NEW MEXICO

•
I -·
"' :.
• J>
. Jo
• ..,
aJ
• .. <7
• ..
,,, • " "' • "
Fucru UNr
'
'·' . "
\
---/'
/'
u --.-"' ~ • ..
77
---.,,
EJIJiuiwG /1168
, •
<J
(® --.... ""'"""' me .
1hr,;;_ r;;~n a~~-;;_ ~~q;~ ] -~-~~11
~,r
I
~
• SOIL. GAs ~ LOCAI!oti <> li£Will)lmG 111:u
-z_
FiGURE J. PentaneJMeth)4 7erfior·; But14 Ether (MTBE) '
( fJg/1)
1-iOtLOMAN AIR FORCE BAS[ ALAMOGORDo, NEW MEXICO

"!!I
. 1
..
62
• .. 2> . "
-----~-
FLIGHl liNE
------------- . " -~-
s • ..
JR_
• ..
------ • - .v • 22 .. ~ 21 ~. •40 ... 35•
~·~ "" (;'I 21 • ,___, .~ ·J .~
JJ ,.
·~ ~ .. , BUll UIN: l
11
;
·""~ 1: : \ \ ~~ ~
·-----.., -
• 11
---
~-·
BUll DINt; #877
----///
---------------
--------, ~ ---. I
~ f
/-
.. • "
\
BUILDING 1868
8 F.NVIRONiiENTAL SERVICES, INC.
[---~~-----------1 lhis m~ is intecJ<i to o written report and mould be Yiered in !hot context.
- -- ---- - -- - - ---
/~
50 100
= rm
e SOIL GAS SAt.! Pl.£ LOCA llON
~ ~ONilORING 'lofll
FIGURE 4. Benzene ( J!g/1)
HOLLOMAN AIR FORCE BASE ALAMOGORDO, NEW MEXICO

,.
) ---------------.. • .. /..,..
7.2
• ..
--------FLIGHT LIN[
. .. ''
4J
p ,)
• <'
'' . ..
-~___.......---------r:- . 21 • " . . . . ~. '
'··.;;" ~ 040 OJI JIO ~· ; ,; .: : : ,; J \ ~ .:""- . . --- ' '• l " . =--- ----l)
BIJIIDING ~ \ """> \ ; . -I ·~·::" . ------ ' ---
----
, ' • 50
-----------~---
------------- _p--
"
~ ENVIRONMENTAL SERVICES, INC.
'I !hi~ mq> iS ilter~ to a written repcrl ond shoold be viewed n thai context
- -
/ ~~
rrn
e 5al GAS SAWPLE l 0CA TIOO
¢ WOOITORING YlfU
FIGURE 5. Ethyibenzene ( Jlg/1)
HOLLOMAN AIR FORCE BASE ALAMOGORDO, NEW MEXICO

• •
-
'-
2' . .. • 7 . 47
FLIGHT LINE
-----------------------------------211
45
• ..
1:\ BUILDING f890
~ •
\ \ n
. .. 4~ ..
48
• " .
J1 • ,.
BUilDING #B/7
'' . ..
----
---
/
-------------------
------------------~ ~--------·-·· 50 J J .
42
// ~ ENVIRONMENTAL SERVICES, INC
----~-~~--~·
llhis m~ is inleg~ lo a llill.en rep«i ! and S!oold be liewed in thai coo\ext
•
/~
0 50 100
FITT
e SOil GAS SAIM'I£ UlCA noo ~ IIOOITOOING WEll
FIGURE 6. meta- and para- Xyiene ( pg/1)
HOLLOMAN AIR FORCE BASE ALAMOGORDO, NEW MEXICO

• ...
.. • .. _..,r
J 1 . 47
-------~
---------------------~ FilCH I liNE
~~---------------~--~- ~~---- -12
• ,.,-2 •
• ..
-· 15 _) " -~ ., '"":~ l : =. " • l1 • BUlllJING \ J8 lll
\ ~'"~ I : :--
BUIWING #BTl
---
'R . •
______ ,.,
':' ')
/
-----------------~--
-------------------
8 ENVIRON1lENTAL SERVICES, INC.
I --·-~--~- ~~~- ~--~
!his m~ ~ illeq-al to o wiillen reprrl and ~ould be viewed in that context.
- --- ---·-
/~
e SOIL GAS SAWPL£ l DCA TION
Q MONITORING Wfli
FIGURE 7. ortho- Xyiene ( pg/1)
HOLLOMAN AIR FORCE BASE ALAMOGORDO, NFW MEXICO