(1- 26) Syrian Arab Republic Ministry of Agriculture and Agrarian Reform Agriculture in the Syrian...
28
(1 - 26) yrian Arab Republic nistry of Agriculture and Agrarian Reform Agriculture in the Syrian – EU Association Agreement Agricultural Policy Forum2005 Atieh El Hindi, NAPC Director 23 / 3 / 2005
-
Upload
michael-quinn -
Category
Documents
-
view
223 -
download
0
Transcript of (1- 26) Syrian Arab Republic Ministry of Agriculture and Agrarian Reform Agriculture in the Syrian...

(1- 26)
Syrian Arab RepublicMinistry of Agriculture and
Agrarian Reform
Agriculture in the Syrian – EU Association Agreement
Agricultural Policy Forum2005
Atieh El Hindi, NAPC Director
23 / 3/ 2005

(2- 26)
General Introduction about
Syrian Trade From1996 to 2003 :
• Total exports increased at an annual growth rate of 5.3%
( EU =57-62%, Arab countries= 20%)
• Total imports decreased by annual growing rate -0.8 %
( Asian countries = 21%, EU = 19%, Arab C= 13%)
• Trade values increased by 2.1% annually.
• Total trade balance was positive due to the universal increased of oil price.
• Total agricultural trade balance was positive with the Arab country, but negative with the European Union.

(3- 26)
Graph 1: Total Syrian trade indicators -19962003 Million SP
Source: Central Bureau Of Statistics General Department of Customs, various issues. Statistical Abstract
-200,000
0
200,000
400,000
600,000
1996*1997*1998*1999*2000200120022003
Total Exports
Total Imports
Total Trade Balance
Total Trade Value

(4- 26)
Source: CBS, Statistical Abstract, several years.*The exchange rate used for calculating values in Syrian Pounds was increased in 2000 from SP/US$ 11.25 to SP/US$ 46.5 for imports and from SP/US$ 11.20 to SP/US$ 46 for exports.
Region 1996 1996* 1997 1997* 1998 1998* 1999 1999* 2000 2001 2002 2003Annual growth
rateEU (15) 50.3 50.3 60.9 60.9 65.0 64.4 57.8 57.1 -1.2Other European Countries 4.0 4.0 3.0 3.0 4.4 2.5 2.1 1.4 -18.2Arab Countries 27.9 27.9 21.0 21.0 16.2 15.4 21.1 20.9 0.6Asian Countries 11.8 11.8 10.0 10.0 10.8 11.2 9.6 11.6 3.8American Countries 0.9 0.9 1.7 1.7 1.3 1.5 2.1 4.2 36.5Rest of the World 5.0 5.0 3.5 3.5 2.4 5.1 7.3 4.8 7.7World 100 100 100 100 100 100 100 100 -
Table 1- The share of Syrian total exports by regions, 1996-2003 (%).

(5- 26)
Region 1996 1996* 1997 1997* 1998 1998* 1999 1999* 2000 2001 2002 2003Annual growth
rate
EU (15) 32.5 32.5 32.1 32.1 32.7 32.7 30.5 30.5 29.7 33.1 24.9 19.0 -7.4Other European Countries 16.2 16.2 14.7 14.7 13.4 13.4 14.3 14.3 13.7 15.5 12.0 12.6 -3.6Arab Countries 7.7 7.7 8.5 8.5 7.9 7.9 8.3 8.3 10.8 9.4 12.0 13.4 8.2Asian Countries 15.8 15.8 15.4 15.4 15.6 15.6 16.0 16.0 17.0 15.1 16.3 20.6 3.9American Countries 11.3 11.3 10.8 10.8 8.6 8.6 8.4 8.4 9.2 8.8 10.1 8.7 -3.7Rest of the World 16.5 16.5 18.6 18.6 21.8 21.8 22.6 22.6 19.6 18.2 24.8 25.8 6.6World 100 100 100 100 100 100 100 100 100 100 100 100 -
Table 2- The share of Syrian total imports by regions, 1996-2003 (%).
Source: CBS, Statistical Abstract, several years*The exchange rate used for calculating values in Syrian Pounds was increased in 2000 from SP/US$ 11.25 to SP/US$ 46.5 for imports and from SP/US$ 11.20 to SP/US$ 46 for exports.

(6- 26)
Source: CBS, Statistical Abstract, several years, and GDC.*The exchange rate used for calculating values in Syrian Pounds was increased in 2000
from SP/US$ 11.25 to SP/US$ 46.5 for imports and from SP/US$ 11.20 to SP/US$ 46 for exports.
Imports 1996 1996* 1997 1997* 1998 1998* 1999 1999* 2000 2001 2002Annualgrowthrate
Total trade 60,520 250,149 45,312 187,289 43,725 180,730 43,010 177,775 187,535 220,744 235,754 -1.0
Agricultural trade 9,698 40,085 8,945 36,971 9,788 40,457 10,980 45,384 38,993 37,656 43,403 1.3
Agricultural/Total 16.0 16.0 19.7 19.7 22.4 22.4 25.5 25.5 20.8 17.1 18.4 2.3
Table 3- Syrian total and agricultural imports, 1996-2002, (Million SP, %)

(7- 26)
Exports 1996 1996* 1997 1997* 1998 1998* 1999 1999* 2000 2001 2002Annual growth
rate
Total trade 44,787 183,947 43,855 180,119 32,443 133,248 38,880 159,686 216,188 243,149 315,919 9.4
Agricultural trade 9,548 39,216 11,433 46,957 10,521 43,211 8,854 36,365 35,997 37,863 57,361 6.5
Agricultural/Total 21.3 21.3 26.1 26.1 32.4 32.4 22.8 22.8 16.7 15.6 18.2 -2.6
Table 4- Syrian total and agricultural exports, 1996-2002, (Million SP, %)
Source: CBS, Statistical Abstract, several years, and GDC.*The exchange rate used for calculating values in Syrian Pounds was increased in 2000 from SP/US$ 11.25 to SP/US$ 46.5 for imports and from SP/US$ 11.20 to SP/US$ 46 for exports.

(8- 26)
Trade Volume 1996 1996* 1997 1997* 1998 1998* 1999 1999* 2000 2001 2002Annual growth
rate
Total trade 105,307 434,096 89,167 367,408 76,168 313,978 81,890 337,460 403,723 463,893 551,673 4.1
Agricultural trade 19,246 79,301 20,378 83,928 20,309 83,668 19,834 81,749 74,990 75,519 100,763 4.1
Agricultural/Total 18.3 18.3 22.9 22.8 26.7 26.6 24.2 24.2 18.6 16.3 18.3 0.0
Table 5- Syrian total and agricultural trade volume, 1996-2002, (Million SP, %).
Source: CBS, Statistical Abstract, several years, and GDC.*The exchange rate used for calculating values in Syrian Pounds was increased in 2000 from SP/US$ 11.25 to SP/US$ 46.5 for imports and from SP/US$ 11.20 to SP/US$ 46 for exports.

(9- 26)
Trade Balance 1996 1996* 1997 1997* 1998 1998* 1999 1999* 2000 2001 2002
Total trade -15,733 -66,202 -1,457 -7,169 -11,282 -47,482 -4,130 -18,089 28,653 22,405 80,165
Agricultural trade -150 -869 2,489 9,987 733 2,754 -2,126 -9,019 -2,996 207 13,958
Table 6- Syrian total and agricultural trade balance, 1996-2002, (Million SP).
Source: CBS, Statistical Abstract, several years, and GDC.*The exchange rate used for calculating values in Syrian Pounds was increased in 2000 from SP/US$ 11.25 to SP/US$ 46.5 for imports and from SP/US$ 11.20 to SP/US$ 46 for exports.

(10- 26)
Table 7- Syrian main partners in terms of agricultural trade volume in 2002, (Million Sp and %)
Countries Imports Exports Volume Balance Standardized Balance % in V0lume
Saudi Arabia 264.2 19,122.8 19,387.0 18,858.6 0.97 19.2
EU 15 9,647.4 5,849.1 15,496.5 -3,798.3 -0.25 15.4
USA 6,110.9 602.0 6,712.9 -5,508.9 -0.82 6.7
Algeria 0.1 5,021.7 5,021.8 5,021.6 1.00 5.0
Argentina 4,117.9 21.8 4,139.7 -4,096.1 -0.99 4.1
UAE 836.7 2,904.8 3,741.5 2,068.1 0.55 3.7
Brazil 3,043.8 297.3 3,341.1 -2,746.5 -0.82 3.3
Lebanon 744.3 2,576.7 3,321.0 1,832.4 0.55 3.3
Kuwait 29.0 3,207.1 3,236.1 3,178.1 0.98 3.2
Thailand 1,822.0 1,134.9 2,956.9 -687.1 -0.23 2.9
Egypt 1,377.8 1,505.8 2,883.6 128.0 0.04 2.9
Sir Lanka 2,506.1 0.0 2,506.1 -2,506.1 -1.00 2.5
Turkey 801.9 1,716.1 2,518.0 914.2 0.36 2.5
Jordan 264.6 2,154.5 2,419.1 1,889.9 0.78 2.4
Malaysia 875.4 613.3 1,488.7 -262.1 -0.18 1.5
Others 10,960.6 10,632.8 21,593.4 -327.9 -0.02 21.4
Total 43,403 57,360.7 100,763.4 13,958.0 0.14 100
Source: General Department of Customs

(11- 26)
EU (15) 1996 1996* 1997 1997* 1998 1998* 1999 1999* 2000 2001 2002Annual growth
rate
Syrian agricultural imports 2,389 9,876 2,401 9,924 2,554 10,557 2,858 11,812 9,295 7,819 9,647 -0.4
Syrian agricultural exports 1,699 6,977 2,028 8,329 1,604 6,588 1,334 5,479 7,981 7,337 5,849 -2.9
Agricultural trade volume 4,088 16,853 4,429 18,254 4,158 17,145 4,192 17,291 17,275 15,156 14,539 -2.4
Agricultural trade balance -691 -2,899 -373 -1,595 -950 -3,969 -1,524 -6,332 -1,314 -482 -3,798 4.6
Table 8- Syrian agricultural trade balance with EU 15, 1996-2002, (Million SP).
Source: General Department of Customs and NAPC Database*The exchange rate used for calculating values in Syrian Pounds was increased in 2000 from SP/US$ 11.25 to SP/US$ 46.5 for imports and from SP/US$ 11.20 to SP/US$ 46 for exports.

(12- 26) Table 9- Syrian most important agricultural exports to EU 15 by products, 2002, (Million SP, Ton, and %).
Source: General Department of Customs
Product Code Product NameQuantity
(Ton)
Value
MSP
Cotton, not carded or combed (Other) 72,532.1 2,629.5 45.0
Other Leather further prepared after tanning or crusting of sheep or lamb, tanned, grained, stamped or printed etc
6,847.0 902.0 15.4
Seeds of cumin 4,523.9 586.2 10.0
Cotton linters 30,830.3 314.5 5.4
Tomatoes, fresh or chilled 11,887.4 250.7 4.3
Guts 623.0 235.7 4.0
Capers, in brine, sulfur water or water with other added materials 1,206.0 158.3 2.7
Tobacco, partly or wholly stemmed/stripped (Leaf tobacco) 906.0 98.9 1.7
Onions, dried 901.2 59.3 1.0
Apricot kernels 662.6 46.5 0.8
Wool, degreased, not carbonized (Other) 1,260.0 45.7 0.8
Other plants and parts of plants (including seeds and fruits) 394.4 38.8 0.7
Other potatoes, fresh or chilled 2,160.3 35.7 0.6
Other bread pastry cakes biscuits and other bakers/ wares, whether or not containing cocoa
291.0 27.0 0.5
Licorice roots 360.3 24.5 0.4
Total 149,100.0 5,849.1 100.0

(13- 26) Table 10- Syrian most important agricultural imports from EU 15 by products, 2002, (Million SP, Ton, and %).
Product Code
Product NameQuantity
(Ton)Value MSP
%
1.7E+07 Other chemically pure sucrose in solid from refined 329,251.9 3,830.5 39.7
2.1E+07 Food preparations not elsewhere specified or included (Other) 1,463.4 1,641.9 17.0
4022110
Milk , In powder, granules or other solid forms, of a fat content, by weight, exceeding 1.5%,Not containing added sugar or other sweetening matter, For children, in airtight tins containing not more than 2,500 g
3,531.9 635.8 6.6
2.4E+07 Cigarettes containing tobacco 958.9 598.6 6.2
4059010 Ghee 5,944.1 459.8 4.8
1.2E+07 Vegetable seeds suitable only for sowing 59.1 380.1 3.9
1.7E+07Glucose and glucose syrup, not containing fructose or containing in the dry state less than 20% by weight of fructose (Other)
14,339.4 176.2 1.8
1E+07 Maize (Corn) 25,315.0 129.5 1.3
1051900Fowls of the species gallous domestics, weighing not more than 185g,(Other)
66.2 116.5 1.2
2E+07Rectangular chips made of potato flour, salted, with added preservatives, dried for consumption upon frying
1,500.0 93.6 1.0
1.2E+07 Seeds of forage plants, for sowing. 255.3 84.9 0.9
4051000 Butter 1,814.9 80.5 0.8
1.2E+07 Sunflower seeds whether or not broken . 4,870.7 70.9 0.7
1.9E+07Other malt extract food preparations of flour, grouts, meal, starch or malt extract
6,457.8 61.6 0.6
Total 429,429.1 9,647.4 100.0
Source: General Department of Customs

(14- 26)
Overview on The Syrian & European Union
Relations
• 1977 Cooperation Agreement:
- Syrian Industrial Products: complete tariff exemption
- Syrian Agricultural Products : tariff exemption for some of them and an exemption part for limited period for some others.
• 1995 Barcelona meeting:
- Establishing EU & Mediterranean Countries partnership relations, to attain the free trade area in 2010.
- EU provides assistance to modernize sectors and legislations.

(15- 26)
EU Association Negotiations
• 1996 - 1998: exploratory rounds.
• 1998 - 2003: twelve rounds of negotiations.
• 2004: Association Agreement was initialed in Brussels.
• AA will be applied after the final ratification by the parliament in Syria and Europe.
• Transitional Agreement: starting 60 days after the ratification.
(16- 26)
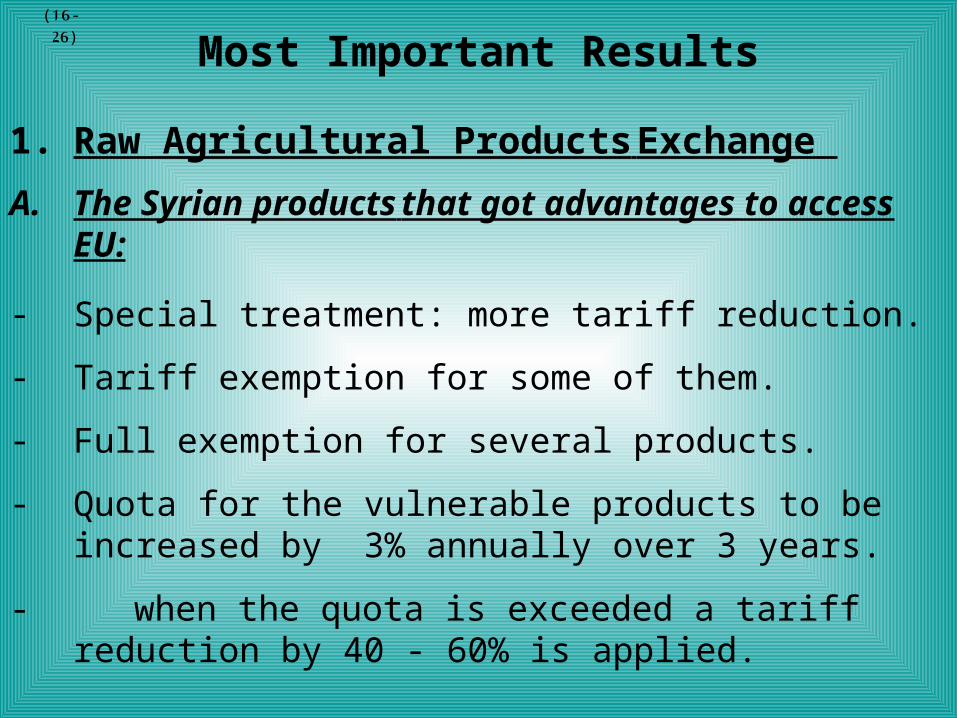
Most Important Results
1. Raw Agricultural Products Exchange
A. The Syrian products that got advantages to access EU:
- Special treatment: more tariff reduction.
- Tariff exemption for some of them.
- Full exemption for several products.
- Quota for the vulnerable products to be increased by 3% annually over 3 years.
- when the quota is exceeded a tariff reduction by 40 - 60% is applied.

(17- 26)
B. The European products that got advantages to access Syria:
• Quota for two European products with full exemption :
2.250 Tons orange, 2.500 Tons apple
• Tariff Less 5% will be eliminated immediately.
• Tariff 5 - 10% gradual dismantle over 4 years.
• Tariff 10 - 40% gradual dismantle over 7 years
• Tariff 40 - 100% transfer to 40% then dismantled over 12 years
• Tariff 100% and over transfer to 70% then dismantled over 12 years

(18- 26)
2. The Processed Agricultural Products
A. The Syrian products that got advantages to access EU:
- Preferential tariff treatment .
- Full tariff exemption for many Syrian agricultural processed products.
- Quota for some processed products.
- Full tariff exemption for many processed products, keeping others ( Surcharge per Kg, Sugar Tax, Flower tax)
- Gradual reduction for other tariff over 12 years.
(19- 26)
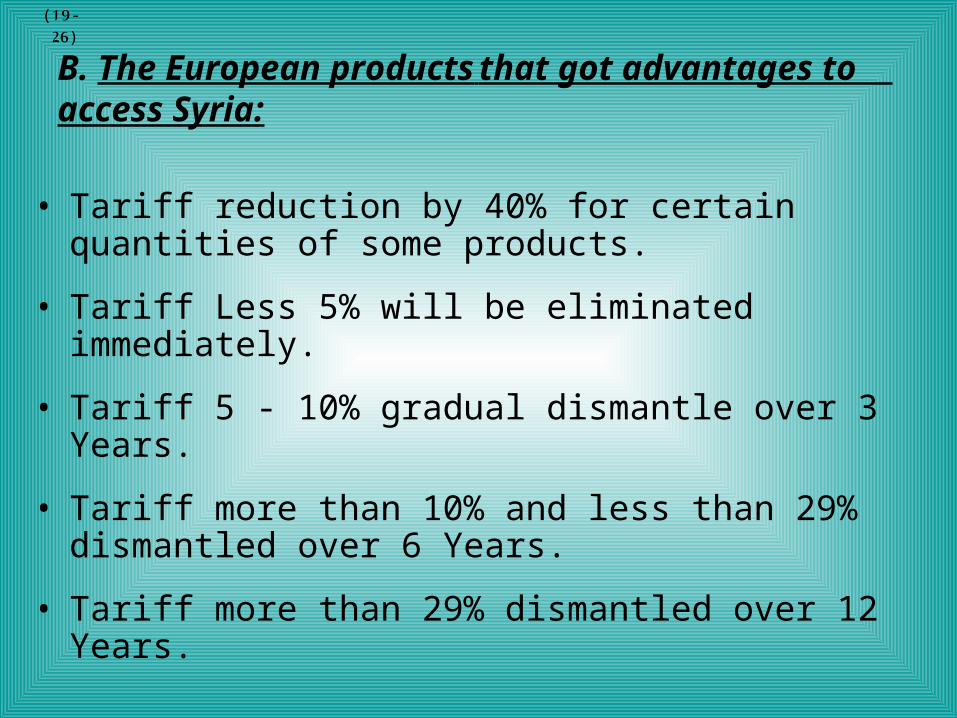
B. The European products that got advantages to access Syria:
• Tariff reduction by 40% for certain quantities of some products.
• Tariff Less 5% will be eliminated immediately.
• Tariff 5 - 10% gradual dismantle over 3 Years.
• Tariff more than 10% and less than 29% dismantled over 6 Years.
• Tariff more than 29% dismantled over 12 Years.

(20- 26)
3. Fish
A. The Syrian products that will export to EU:
- Preferential tariff treatment.
- Reduction for all tariffs applied to all kind of fish: from 6% or less will be eliminated.
- The remaining tariff will become 6% gradually:
reduction by 60% upon entry into force of the agreements, first year 80%,second year 100%
- Exemption for quota of 100 tons for some species in the second item, upon entry into force.
(21- 26)
B. The European products that will export to Syria:
• For less than10% tariff: upon entry into force exemption.
• 10% -30% tariff reduction over 5 years.
• 30% - 80% tariff reduction over 7 years.
• Tariff over 80% reduce to 80% then dismantle over 12 years.

(22- 26)
Fields of Cooperation
The EU will assist Syria in different areas:
A. In agriculture & fish production through various modalities:
- Supporting product diversification policies.
- Encouraging the improvement of private sector.
- Supporting environmental friendly agriculture.
- Protecting and reasonable managing for fish production.
- Strengthening the relations among business, groups, and organizations that represented trade and carriers in both Syria & EU countries, by voluntary basis.
- Supporting private investments.

(23- 26)
- Providing technical assistance & training.
- Enhancing agricultural researches & technology transfer.
- Cooperating in livestock & plant health.
- Modernizing infrastructures & distribution process.
- Applying Integrated rural development, including
improvement of basic services.
- Cooperating among rural regions and exchanging expertise.
- Cooperating in any other agreed field.
B. Transferring modern technique, projects corporation, and training programmes.

(24- 26)
Actions Made For The Implementation Of AA• A study on AA
• A study on “Syrian Vegetables & Fruits Export Windows To EU Markets”
• Explaining the concept, advantages and obligations of AA in local newspapers
• Meetings with deferent sectors in provinces
• A workshop held by the state planning commission & Spanish Embassy about AA
• Projects proposals through ISMF to improve agricultural products: -marketing information system -agricultural product quality, and establishing typical workshops for vegetables & fruit preparation.
(25- 26)
Required Actions For Future
• Speeding up the establishment of a marketing information system.
• Complying with the environmental & technical specifications.
• Applying the conditions of Sanitary & Phyto-sanitary Agreement.
• Encouraging the establishment of specific commodities unions ( exporters & importers).
• Establishing a Government export supervision body equipped with internationally acknowledge certification.
(26- 26)
• Selecting international quality certification companies.
• Enhancing agricultural scientific researches to produce new varieties.
• Facilitating the administration procedures and setting strict technical conditions to guarantee quality control.
• Speeding up the establishment of a single desk to ease the required procurements.
• Issuing legislations to comply with WTO rules.
• Facilitating the marketing chain process: transportation, sorting, grading, packaging, etc…

(27- 26)
Conclusion
the Association Agreement concluded has satisfactory to all partners, as it will Facilitate trade flows.
EU will provide the needed assistance and Syria will adjust its economy to apply to the new conditions. In
addition to enhance the capacity of government bodies and economic institutions to benefit from the agreement and deal with the possible implementation challenges.

(28- 26)
Thank you