
09 4 15 data driven hr impacts of talent management bus case slideshare
41
Don’t Be Left Behind… As HR Shifts To A Data-Driven, High Business Impact Approach © Dr John Sullivan 43 www.drjohnsullivan.com • The most dramatic shift in HR in decades is occurring right now… and it will soon make your current HR approach obsolete. • You can welcome it or fear it, but this shift is inevitable
-
Upload
dr-john-sullivan -
Category
Business
-
view
311 -
download
0
Transcript of 09 4 15 data driven hr impacts of talent management bus case slideshare
Don’t Be Left Behind… As HR
Shifts To A Data-Driven, High
Business Impact Approach
© Dr John Sullivan
43www.drjohnsullivan.com
• The most dramatic shift in HR in decades is occurring
right now… and it will soon make your current HR
approach obsolete.
• You can welcome it or fear it, but this shift is inevitable

3
I’m from the Silicon Valley…
They asked me to highlight the most advanced
data-driven talent practices
• Obviously you can’t adopt all of them
• So pick & choose and adapt whatever practices
that you find are best for your organization
4
A definition of
data-driven HR (ddHR)

5
A definition of data-driven HR (ddHR)
A strategic proactive approach to talent mgmt.
It replaces the currently common… opinions,
beliefs, intuition, hunches, speculation, trial & error
learning & automatically continuing with past practices.
It instead relies on… data, facts, analysis, charts,
metrics, algorithms, science and predicted trends…
to improve the accuracy, speed and business
impacts of major people management decisions…
that are made by managers and HR professionals.
And finally, it reveals “why” programs work.

6
2 quick examples of:
How data-driven HR can
improve retention and
recruiting
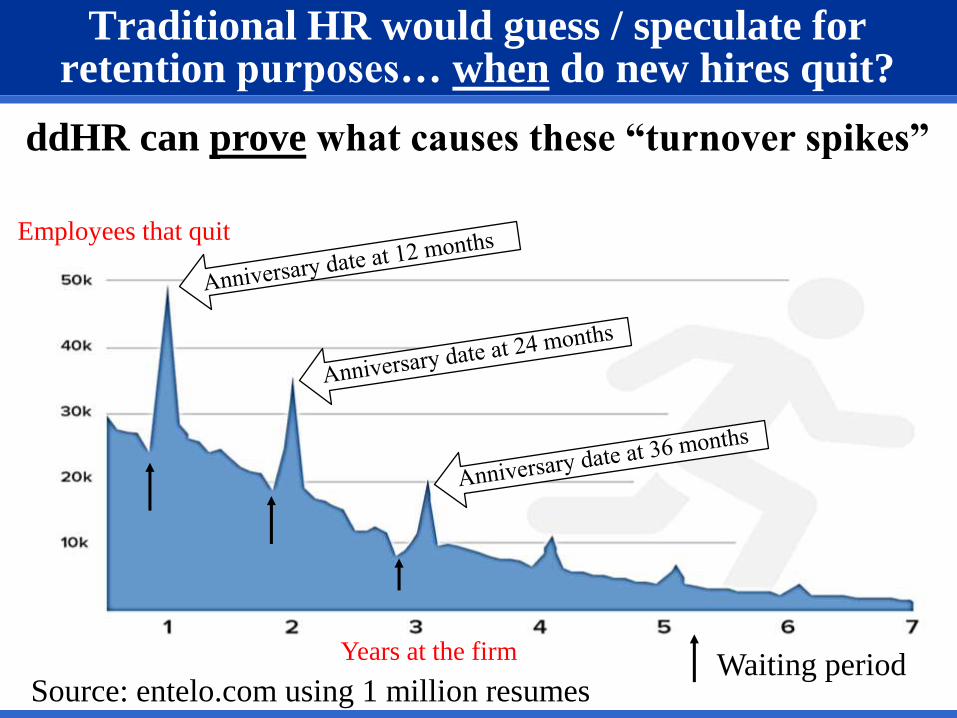
Traditional HR would guess / speculate for retention purposes… when do new hires quit?
Source: entelo.com using 1 million resumesWaiting period
ddHR can prove what causes these “turnover spikes”
Employees that quit
Years at the firm

8
During what month do most salespeople quit?
I
Source: Entelo 2015
Turnover seems even… until you add December
9
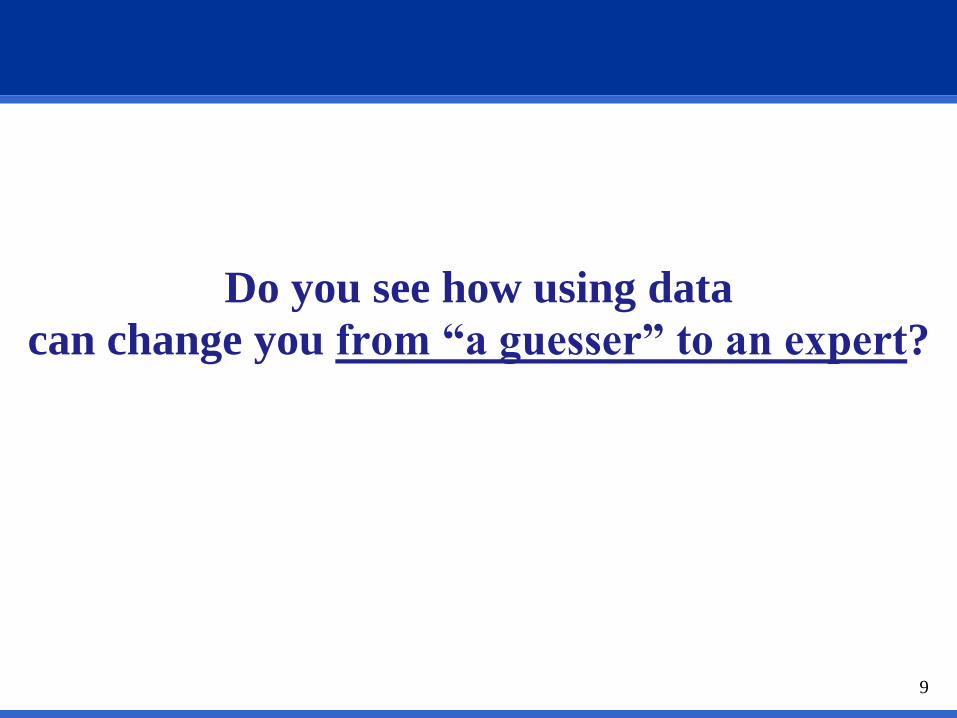
Do you see how using data
can change you from “a guesser” to an expert?
10
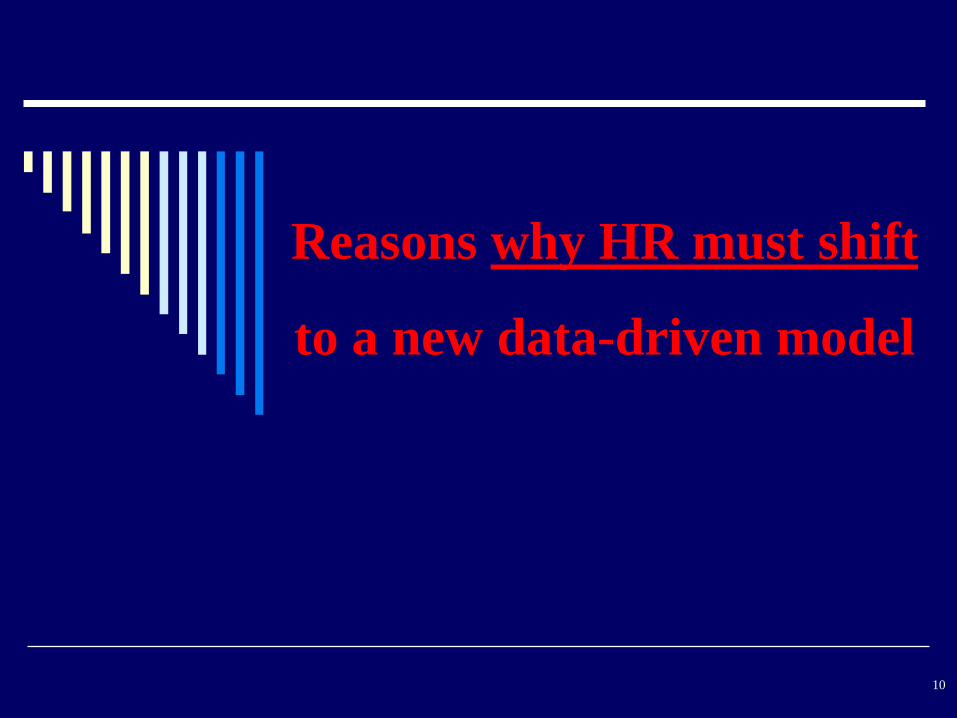
Reasons why HR must shift
to a new data-driven model
11
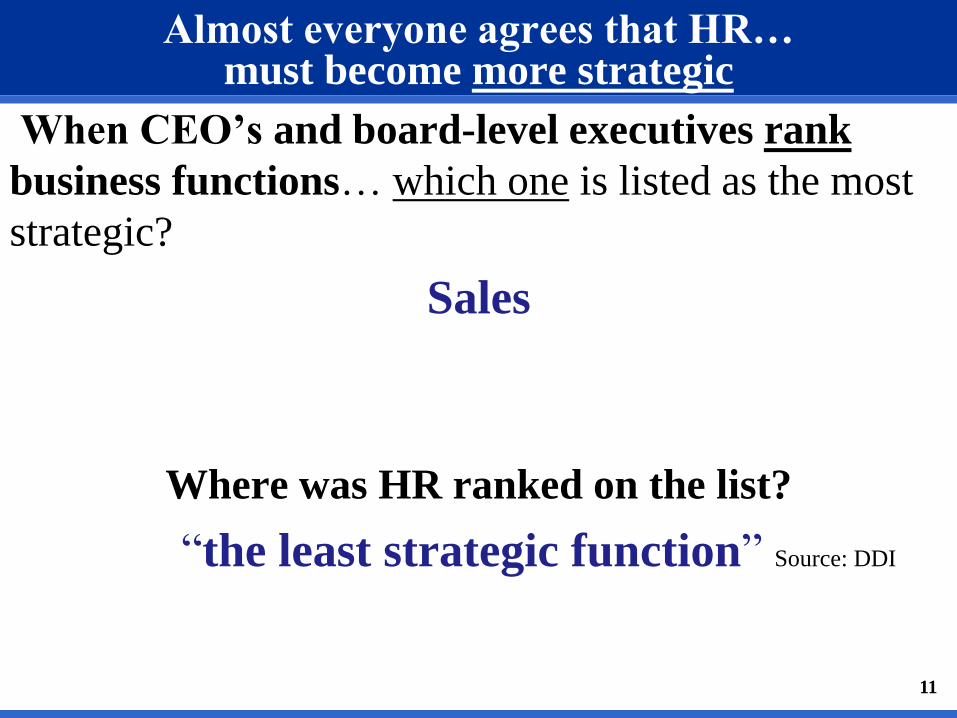
Almost everyone agrees that HR…must become more strategic
When CEO’s and board-level executives rank
business functions… which one is listed as the most
strategic?
Sales
Where was HR ranked on the list?
“the least strategic function” Source: DDI
11
12
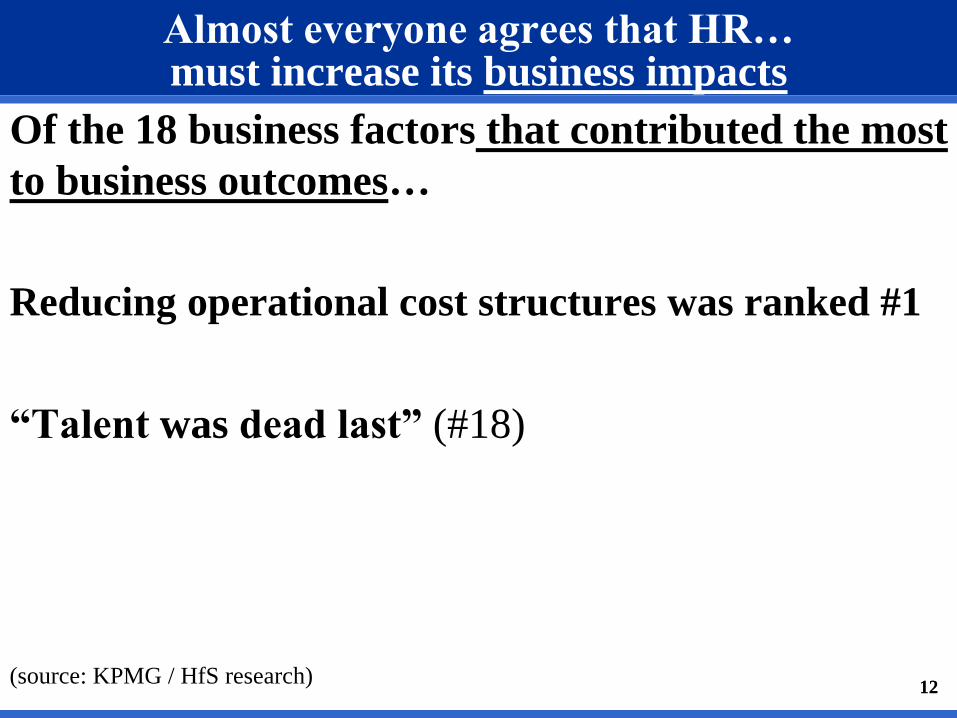
Almost everyone agrees that HR…must increase its business impacts
Of the 18 business factors that contributed the most
to business outcomes…
Reducing operational cost structures was ranked #1
“Talent was dead last” (#18)
(source: KPMG / HfS research)12
13
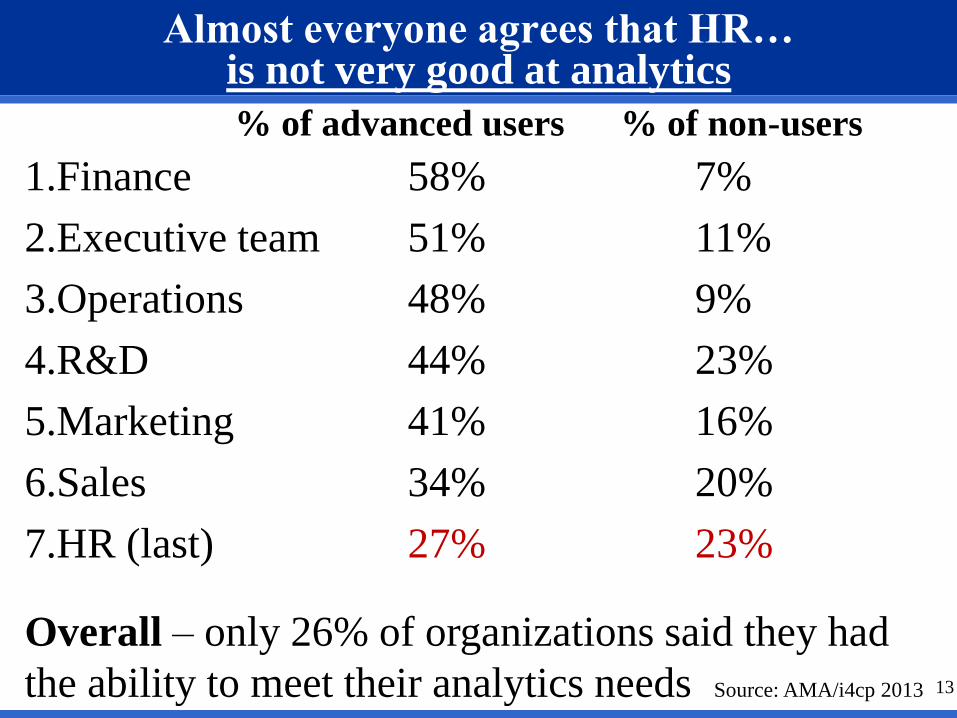
Almost everyone agrees that HR… is not very good at analytics
% of advanced users % of non-users
1.Finance 58% 7%
2.Executive team 51% 11%
3.Operations 48% 9%
4.R&D 44% 23%
5.Marketing 41% 16%
6.Sales 34% 20%
7.HR (last) 27% 23%
Overall – only 26% of organizations said they had
the ability to meet their analytics needs Source: AMA/i4cp 2013
14
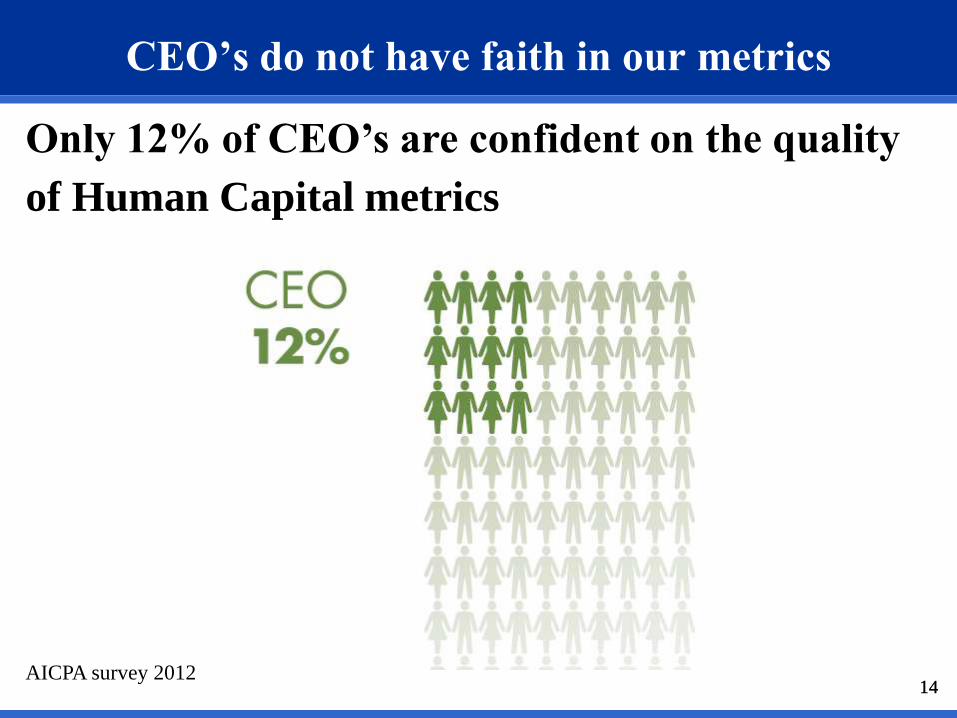
CEO’s do not have faith in our metrics
Only 12% of CEO’s are confident on the quality
of Human Capital metrics
14AICPA survey 2012

15
Do you argue we should keep the black phone?
It’s time to drop the black phone approach to HR
Std. excuse… “our HR model has served for years &
it seems to us that it works fine just the way it is”
Answer… the old ways must be abandoned
because HR’s capabilities have not kept pace with…
the higher expectations of executives
and the expanded capabilities of technology and
big data 15

16
Additional reasons why HR must adapt to a changing world
1.Every other business function has long ago shifted
and managers have learned to expect/ demand data
2.A volatile world history doesn’t repeat itself very
often anymore (HR has 100% historical metrics)
3.The speed of change requires fast but accurate
decision making (VUCA = volatility, uncertainty, complexity and ambiguity)
4.The mobile phone makes data instantly accessible
5.You can’t fix / improve programs if you don’t
know “why” they work and fail
17
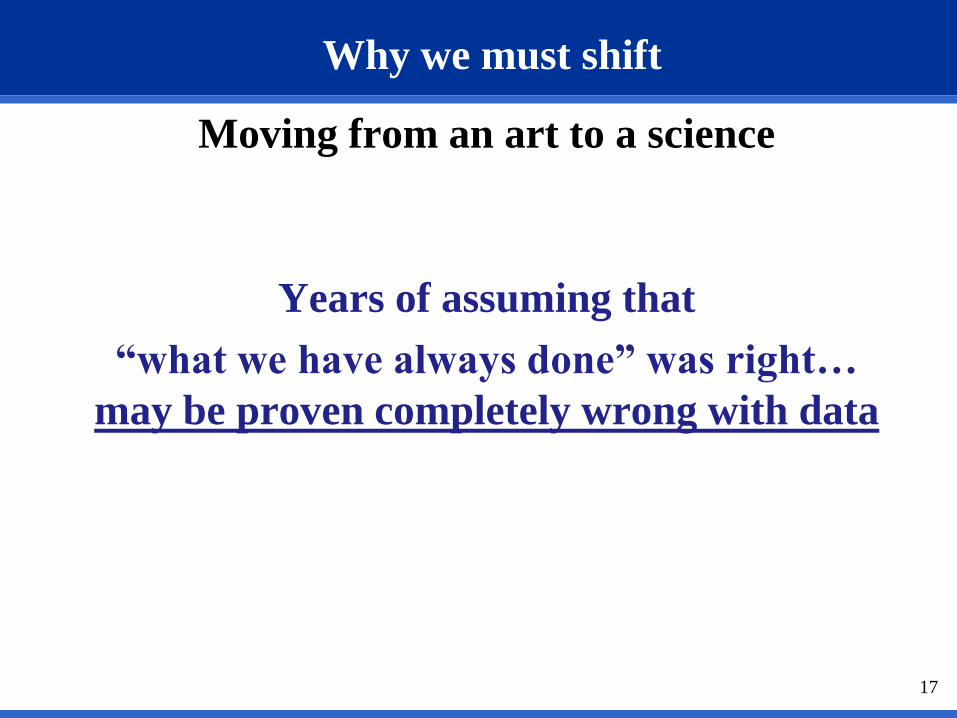
Moving from an art to a science
Years of assuming that
“what we have always done” was right…
may be proven completely wrong with data
Why we must shift

This Google data… shows they were wrong about what predicts new hire success
“GPA’s
“Test scores
“Brainteasers
Interviews – “many managers, recruiters, and HR staffers think they have a special ability to sniff
out talent. They’re wrong” “it’s a complete random mess”… “we found a
zero relationship” (between interview scores and on-the-job performance)
No value is added “after 4 interviews”
College –“the proportion of people at Google without any college education… has increased over time”
What predicts? – “capability & learning ability”18
are worthless as a criteria for hiring”
are worthless”are a complete waste of time”
Laszlo Bock, Senior VP of people operations at Google The New York Times

19
Let’s look at a quick case study
A snapshot of
how Google does ddHR
20
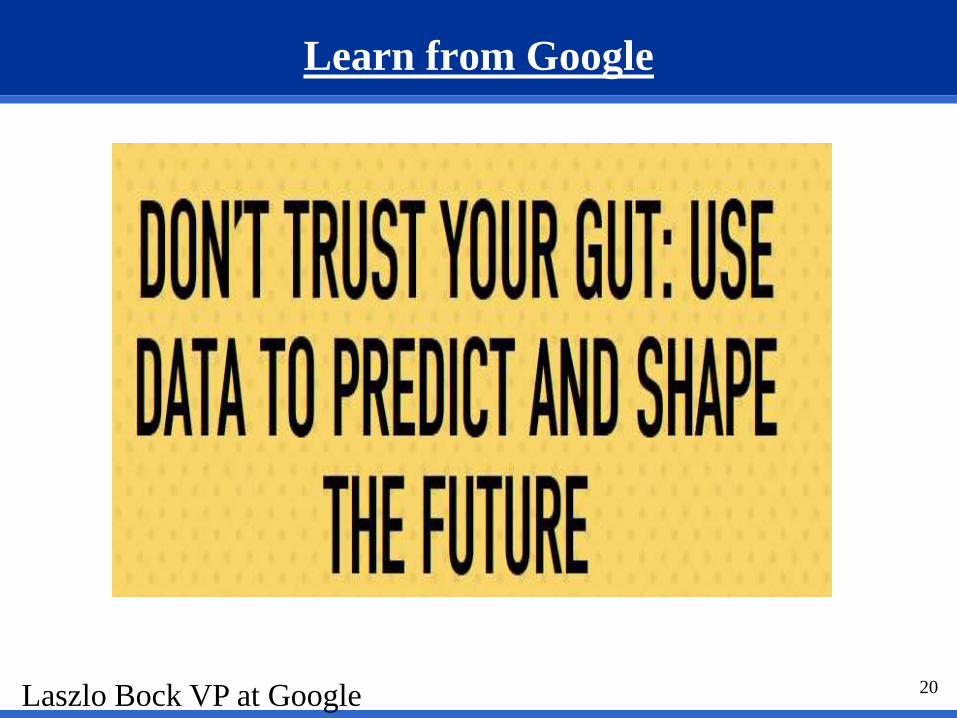
Learn from Google
Laszlo Bock VP at Google
21
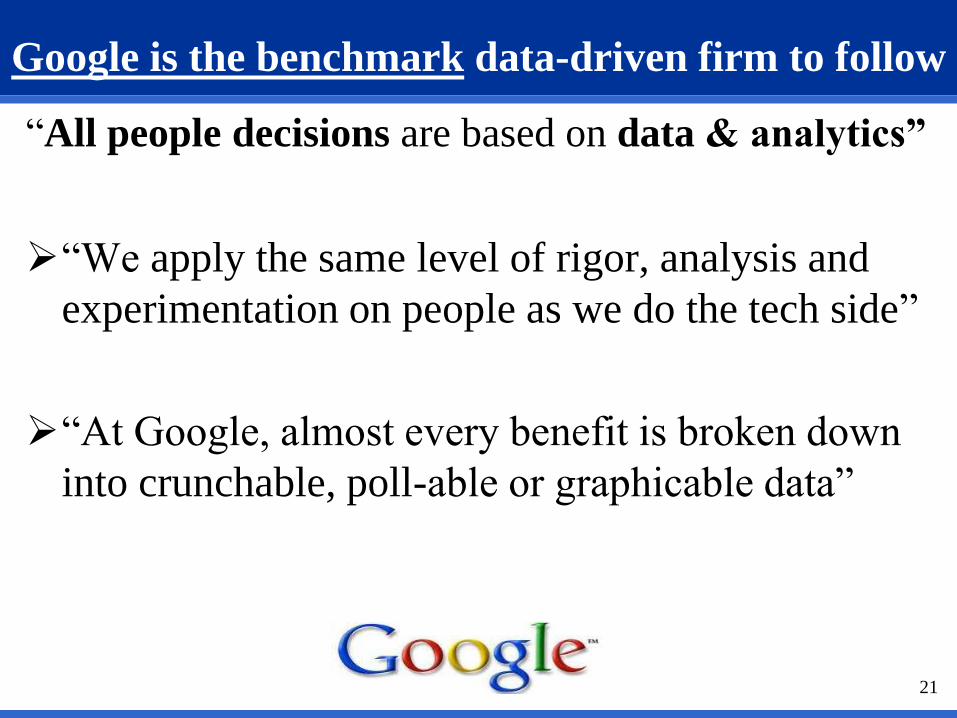
Google is the benchmark data-driven firm to follow
“All people decisions are based on data & analytics”
“We apply the same level of rigor, analysis and
experimentation on people as we do the tech side”
“At Google, almost every benefit is broken down
into crunchable, poll-able or graphicable data”

22
ddHR goal # 1Data-driven experimentation
Google has an R&D team in Talent Management
People & Innovation Lab (PiLab) - it runs dozens
of experiments on employees in an effort to
answer questions about the best way to manage
a large firm (on-boarding, diversity, pay,
retirement savings & employee weight)
23
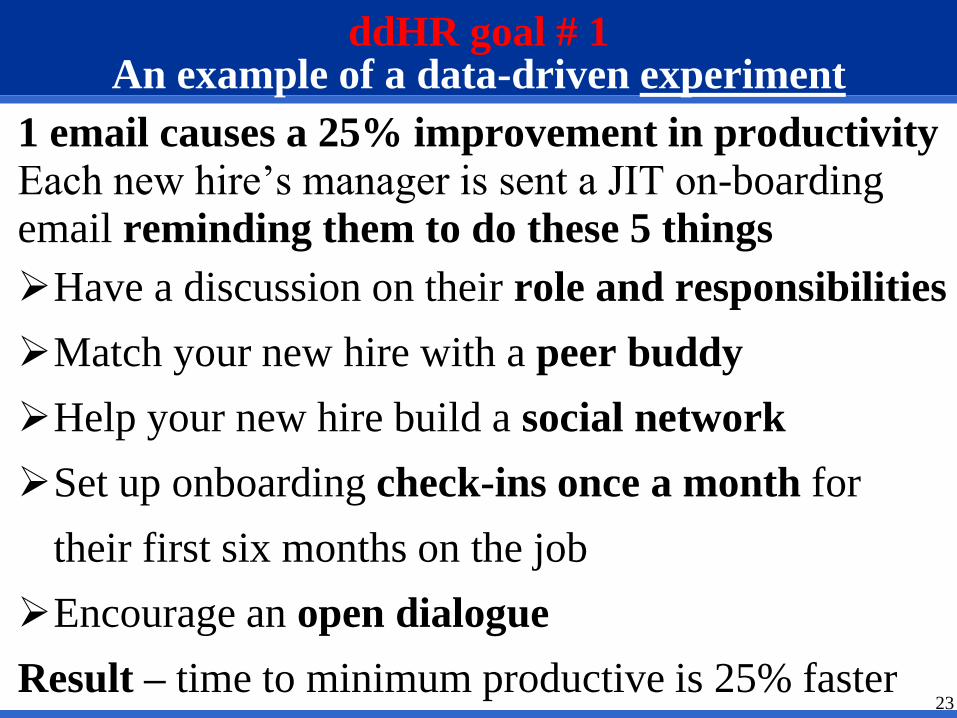
ddHR goal # 1An example of a data-driven experiment
1 email causes a 25% improvement in productivity
Each new hire’s manager is sent a JIT on-boarding email reminding them to do these 5 things
Have a discussion on their role and responsibilities
Match your new hire with a peer buddy
Help your new hire build a social network
Set up onboarding check-ins once a month for
their first six months on the job
Encourage an open dialogue
Result – time to minimum productive is 25% faster
24
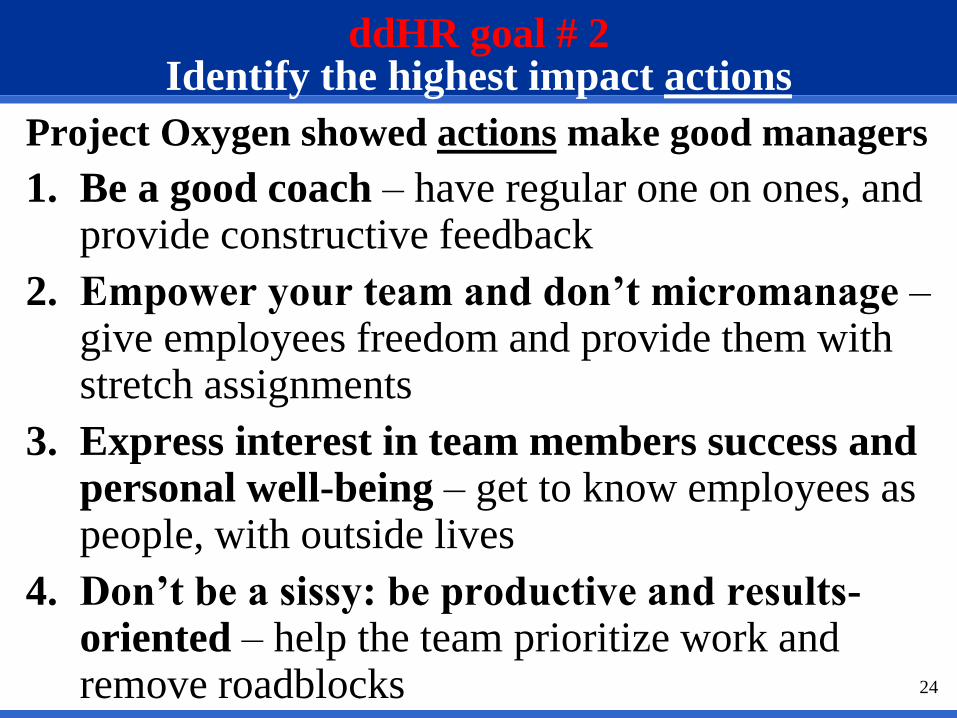
ddHR goal # 2Identify the highest impact actions
Project Oxygen showed actions make good managers
1. Be a good coach – have regular one on ones, and provide constructive feedback
2. Empower your team and don’t micromanage –give employees freedom and provide them with stretch assignments
3. Express interest in team members success and personal well-being – get to know employees as people, with outside lives
4. Don’t be a sissy: be productive and results-oriented – help the team prioritize work and remove roadblocks

26
Examples covering each of the
remaining ddHR goals

27
Replace them with…
I know
The data proves that…
This chart / graph proves
Our algorithm shows it works
A predictive trendline shows
An A/B test shows B is better
It’s a science
ddHR goal # 4 Use the language of business ($ and #’s)
Outdated phrases
I think/I believe/ I feel
My opinion is…
My gut tells me
We tried that once…
Historical metrics show
We always do it this way
It’s an art
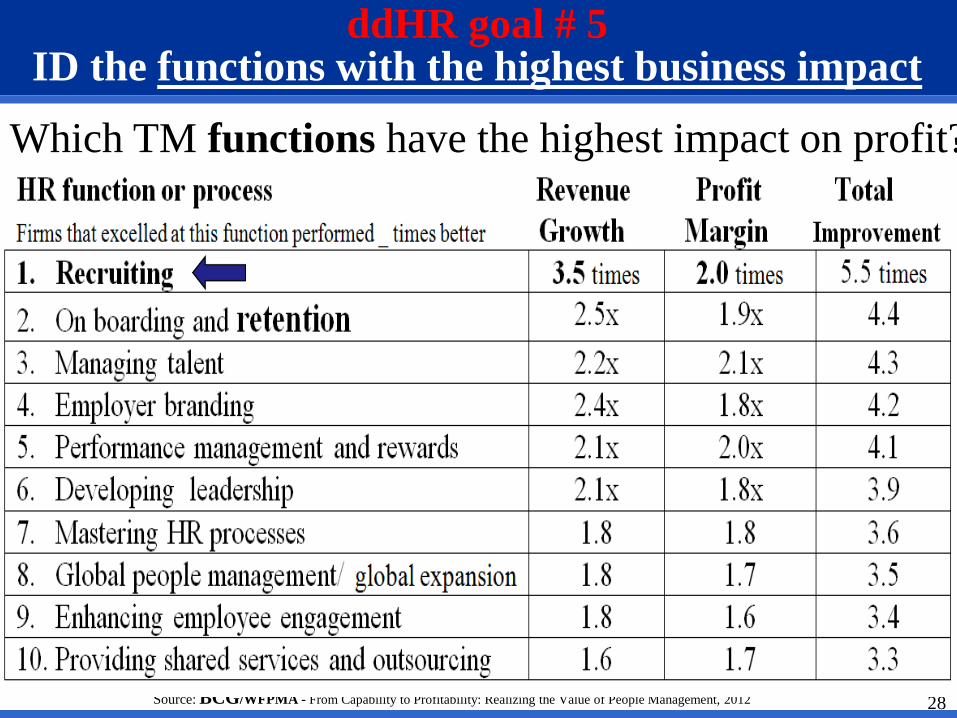
ddHR goal # 5 ID the functions with the highest business impact
28Source: BCG/WFPMA - From Capability to Profitability: Realizing the Value of People Management, 2012
Which TM functions have the highest impact on profit?
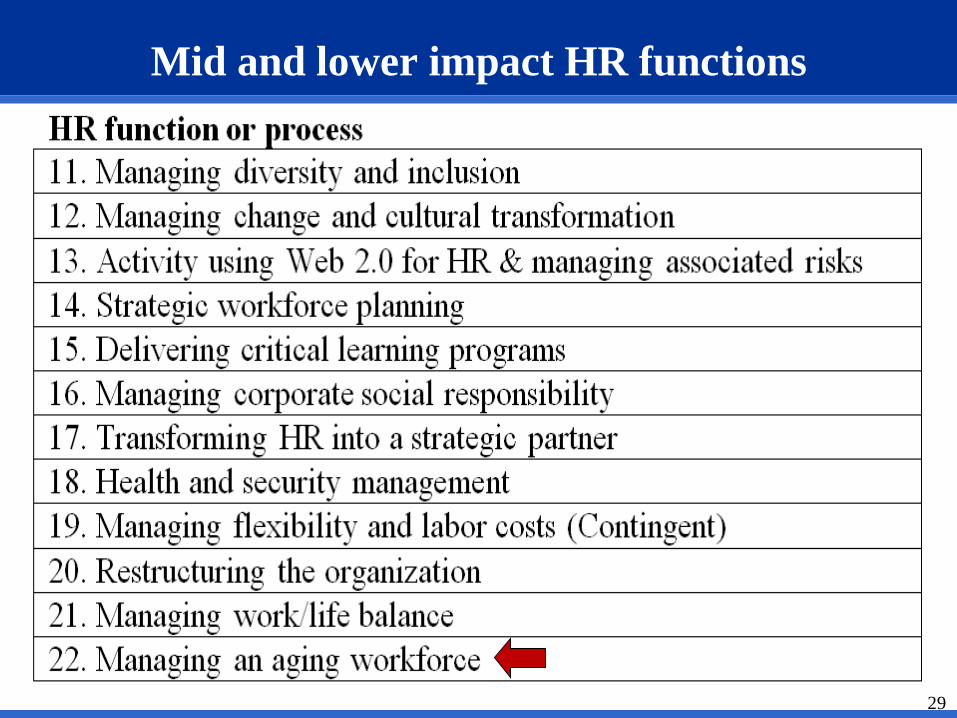
Mid and lower impact HR functions
29

30
ddHR goal # 6 HR quantifies its business impacts in $
A revised data-driven recruiting program was
implemented that focused exclusively on
salespeople
After acclimation, newly hired salespeople now
sell nearly 15% more each month (+ $15,100)
With over 100 hires per year, the CFO
calculated that the revenue impact exceeded
$1.5 million
Which was nearly double the overall recruiting
budget

What happened here?
Hockey stick approach
31
Turnover %
TimeOctober 2014
Steady turnover of 9 %
Personalized retention plans were implemented
4 % turnover
ddHR goal # 7Use charts to prove that things work
32
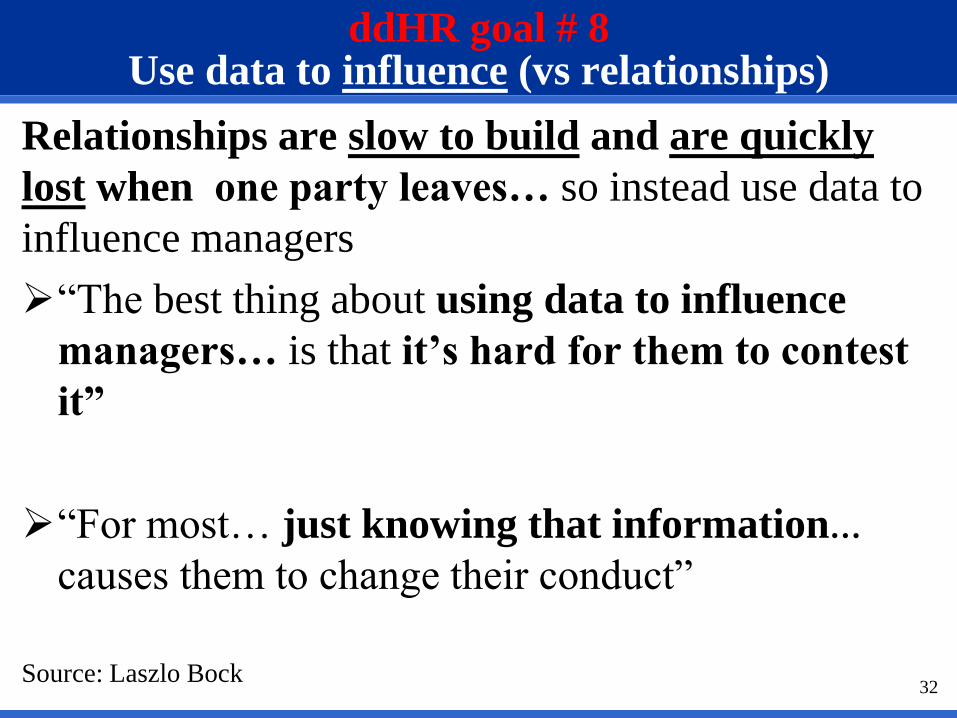
ddHR goal # 8Use data to influence (vs relationships)
Relationships are slow to build and are quickly
lost when one party leaves… so instead use data to
influence managers
“The best thing about using data to influence
managers… is that it’s hard for them to contest
it”
“For most… just knowing that information…
causes them to change their conduct”
Source: Laszlo Bock
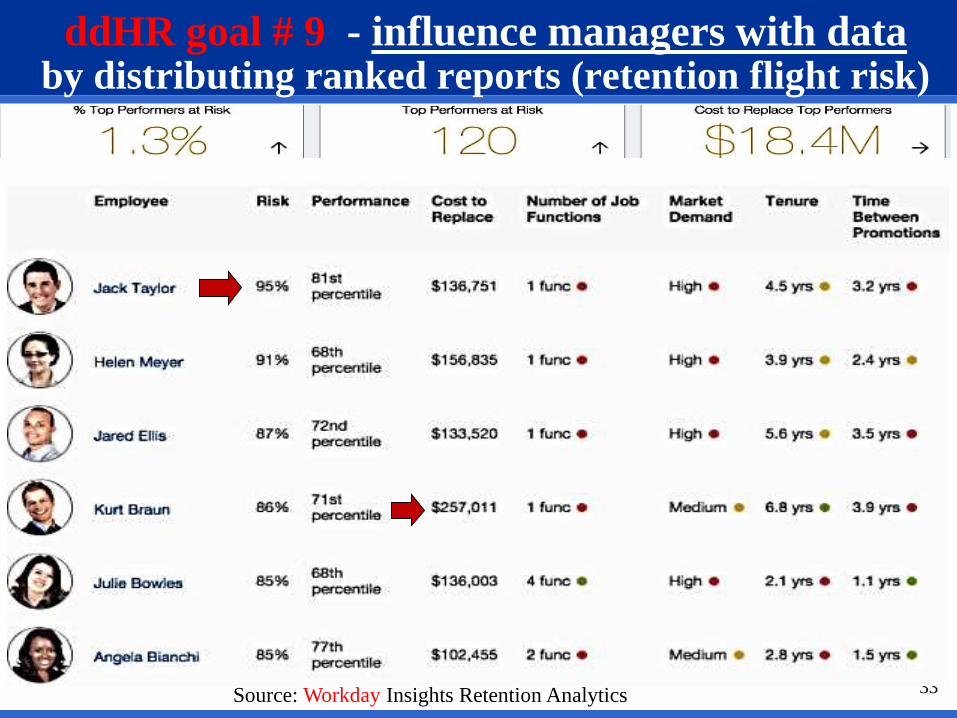
33Source: Workday Insights Retention Analytics
ddHR goal # 9 - influence managers with databy distributing ranked reports (retention flight risk)

34
This is what data-driven retention looks like (Workday)
Source: Workday Insights Retention Analytics
Software makes decision-making easy
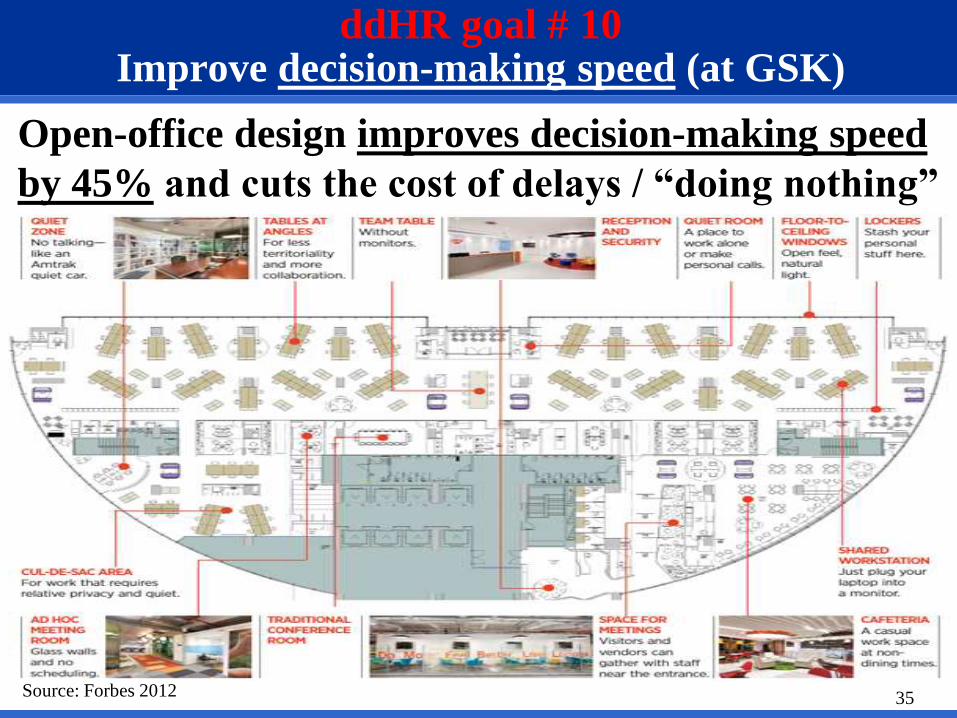
ddHR goal # 10Improve decision-making speed (at GSK)
Open-office design improves decision-making speed
by 45% and cuts the cost of delays / “doing nothing”
35Source: Forbes 2012
36
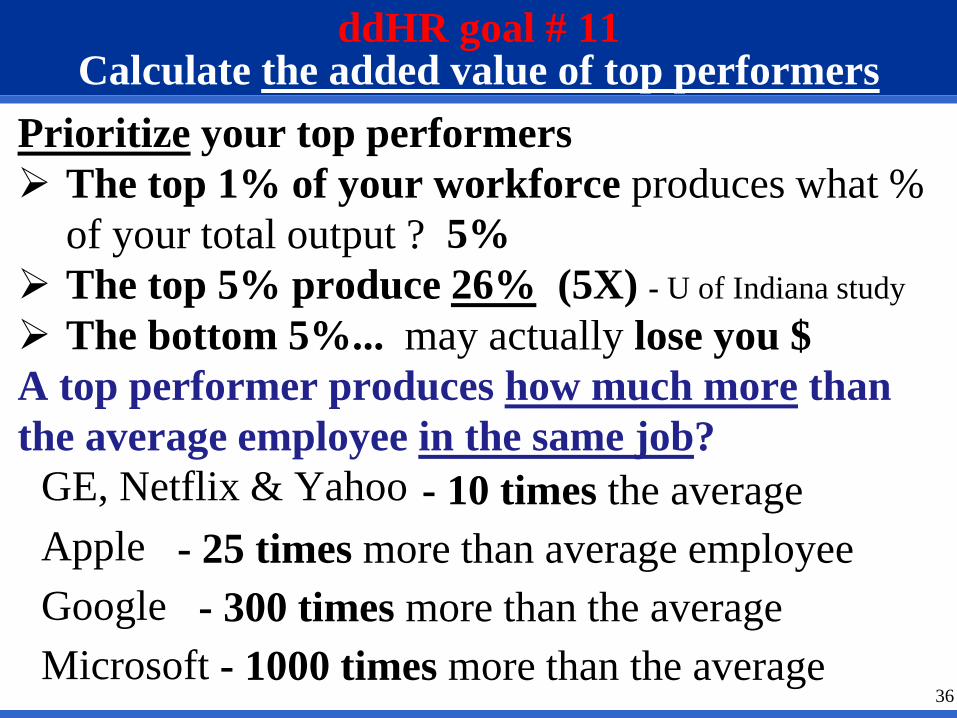
ddHR goal # 11Calculate the added value of top performers
Prioritize your top performers
The top 1% of your workforce produces what %
of your total output ?
The top 5% produce
The bottom 5%...
A top performer produces how much more than
the average employee in the same job?
- 10 times the average
- 25 times more than average employee
- 300 times more than the average
- 1000 times more than the average
GE, Netflix & Yahoo
5%
Apple
Microsoft
26% (5X) - U of Indiana study
may actually lose you $

37
ddHR goal # 12Calculate the cost of weak performers
A weak employee may cause errors and disruption
each year up to 2 ¼ times their annual salary
(O’Boyle and Aguinis)
They take up a manager’s time because their
managers must spend nearly one day a week
(17%) dealing with them (Source: Robert Half)
Toxic employees make their teammates 54% more
likely to quit Source: Cornerstone Selection survey
Bad ones stay forever… weak hires may stay 20
years, multiplying their negative impact
38
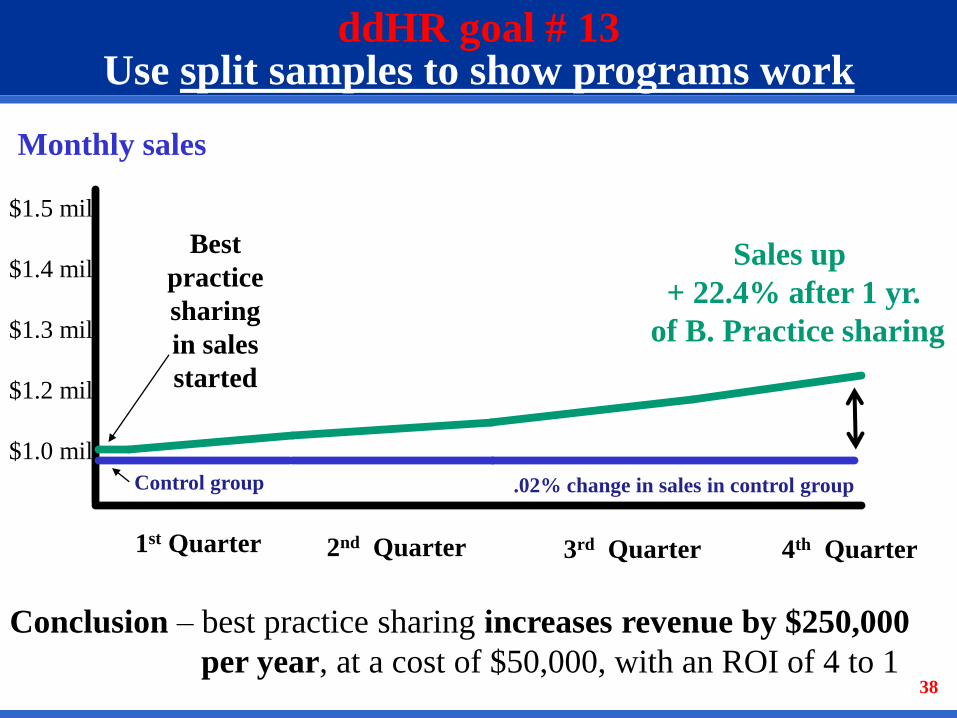
Conclusion – best practice sharing increases revenue by $250,000
per year, at a cost of $50,000, with an ROI of 4 to 1
Monthly sales
Best
practice
sharing
in sales
started
Sales up
+ 22.4% after 1 yr.
of B. Practice sharing
1st Quarter
$1.5 mil
$1.4 mil
$1.3 mil
$1.2 mil
$1.0 mil
.02% change in sales in control group
2nd Quarter 3rd Quarter 4th Quarter
Control group
ddHR goal # 13Use split samples to show programs work
39
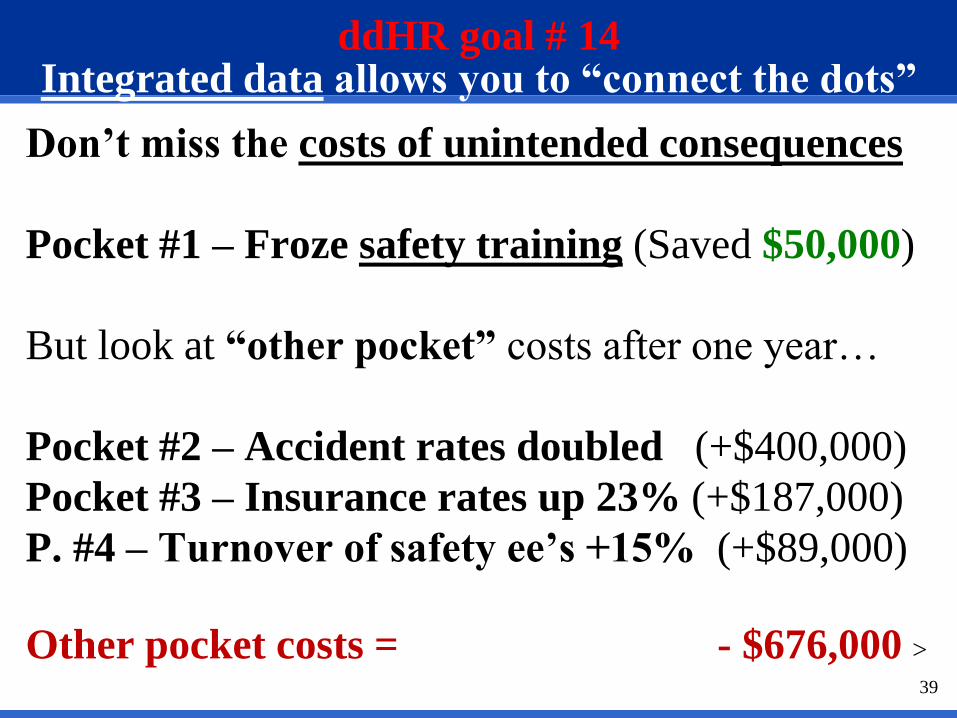
ddHR goal # 14 Integrated data allows you to “connect the dots”
Don’t miss the costs of unintended consequences
Pocket #1 – Froze safety training (Saved $50,000)
But look at “other pocket” costs after one year…
Pocket #2 – Accident rates doubled (+$400,000)
Pocket #3 – Insurance rates up 23% (+$187,000)
P. #4 – Turnover of safety ee’s +15% (+$89,000)
Other pocket costs = - $676,000 >
40
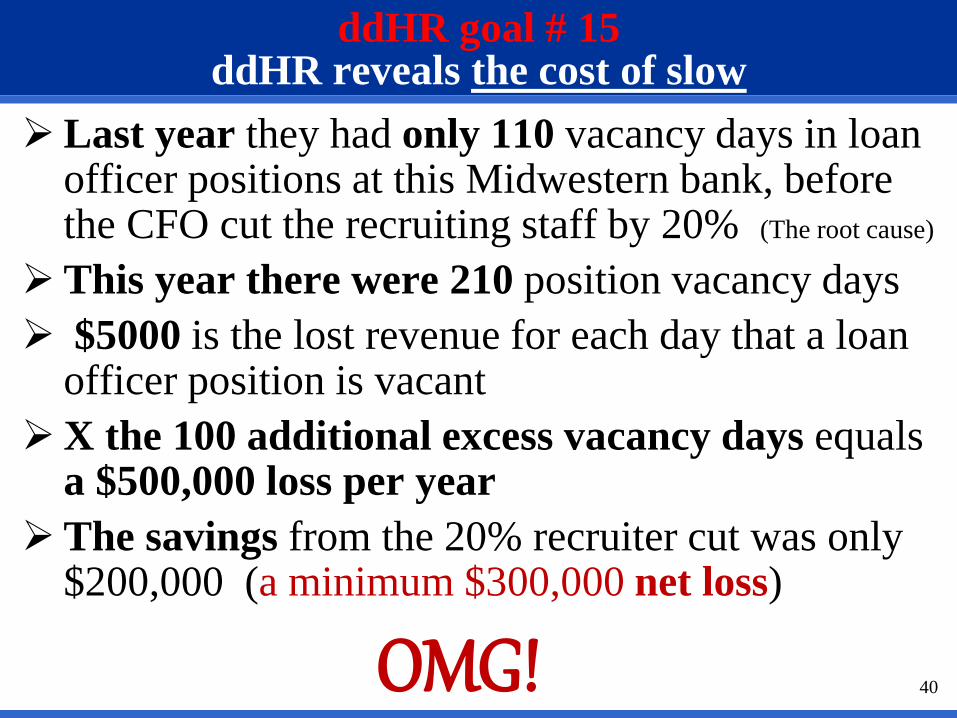
ddHR goal # 15 ddHR reveals the cost of slow
Last year they had only 110 vacancy days in loan officer positions at this Midwestern bank, before the CFO cut the recruiting staff by 20% (The root cause)
This year there were 210 position vacancy days
$5000 is the lost revenue for each day that a loan officer position is vacant
X the 100 additional excess vacancy days equals a $500,000 loss per year
The savings from the 20% recruiter cut was only $200,000 (a minimum $300,000 net loss)
OMG!
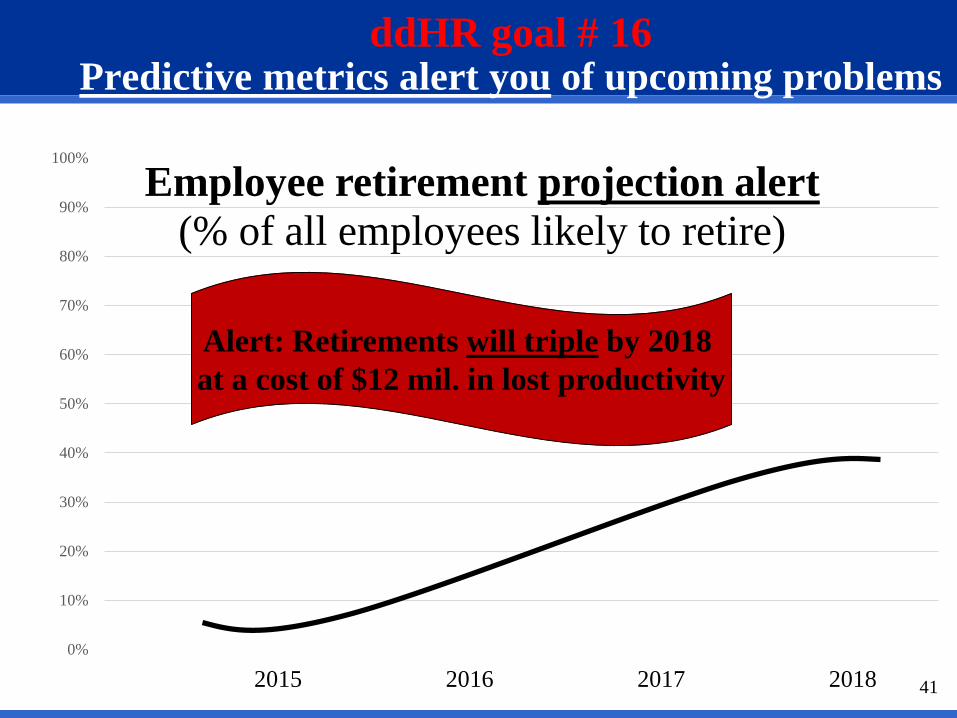
ddHR goal # 16Predictive metrics alert you of upcoming problems
41
0%
10%
20%
30%
40%
50%
60%
70%
80%
90%
100%
Employee retirement projection alert
(% of all employees likely to retire)
2015 2016 2017 2018
Alert: Retirements will triple by 2018
at a cost of $12 mil. in lost productivity

42
Benchmark Google (read Work Rules)
Put together an HR analytics team
Hire HR pro’s with data/analytics skills
Work with exec’s to prioritize HR areasShift from historical to real-time and
predictive metrics to alert
Start with retention –predict who will quit
Next rec. – ID factors that predict success
Run a small split sample/ control group
Use stats to ID what correlates with perf.
Initial action steps to consider under ddHR

Do we have time for questions?
43
Did I make you think?
JohnS@ sfsu.edu or www.drjohnsullivan.com


![[Slideshare] istighfar](https://static.fdocuments.us/doc/165x107/5469375caf79596a1b8b6c94/slideshare-istighfar.jpg)