09 -1180 - Minnesota
16
This document is made available electronically by the Minnesota Legislative Reference Library as part of an ongoing digital archiving project. http://www.leg.state.mn.us/lrl/lrl.asp 09 - 1180 Quantifying parcelization potential of forest lands in Itasca County, north central Minnesota George E. Host and Terry N. Brown Natural Resources Research Institute University of Minnesota Duluth 5013 Miller Trunk Hwy Duluth, MN 55811-1442 Submitted to: Dr. David Zumeta, Project Officer Minnesota Forest Resources Council Final report in fulfillment of 2007 Minn. Laws Chapter 57 Art. 1 Sec. 4 Subd. 4 December 2009 NRRI Technical Report NRRI/TR-2009/37
Transcript of 09 -1180 - Minnesota

This document is made available electronically by the Minnesota Legislative Reference Library as part of an ongoing digital archiving project. http://www.leg.state.mn.us/lrl/lrl.asp
09 - 1180
Quantifying parcelization potential of forest lands in Itasca County,north central Minnesota
George E. Host and Terry N. BrownNatural Resources Research Institute
University of Minnesota Duluth5013 Miller Trunk Hwy
Duluth, MN 55811-1442
Submitted to:
Dr. David Zumeta, Project OfficerMinnesota Forest Resources Council
Final report in fulfillment of2007 Minn. Laws Chapter 57
Art. 1 Sec. 4 Subd. 4
December 2009
NRRI Technical Report NRRI/TR-2009/37

Introduction
Land parcelization is one of several factors contributing to forest fragmentation, which in turn
has been linked to numerous environmental degradations, including declines in water quality
(Dillon et al. 1994), wildlife habitat (Brooks 2003), and reduced access to the public for hunting
and recreational pursuits. Parcelization, the division of tracts of land into smaller holdings, is
often accompanied by changes in ownership, land use/land cover and public access, and
development. The increased trend toward divestiture of land holdings by forest product
companies, which potentially leads to parcelization, is well-documented in Minnesota and
elsewhere. The Phase 1 report of the Minnesota Statewide Conservation and Preservation Plan
identified habitat degradation, fragmentation, and consumptive use of land (conversion of land
through development and associated infrastructure) as three of the main drivers of change
affecting Minnesota's land resources (Swackhamer et al. 2008).
Mundell et al (Mundell et al. 2009) recently completed an analysis of forest parcelization using
land records from Itasca County. Additionally, by using Minnesota Department of Revenue
records from 1995 through 2006, they were able to identify subdivisions of rv40 acre parcels.
They were also able to quantify changes in property tax classifications (e.g. forest undeveloped
land to residential land), and assess the number and rate at which parcels were ultimately
developed (changes in land value associated with presence of structures on the property). They
found that parcelization rates for Itasca County were about 0.4% per year, or approximately
half the typical rate of forest harvest (rv1.0% per year). With the exception of 2002, when the
elimination of Minnesota's Tree Growth Tax Law caused a spike in the percentage of parcels
classified as forest undeveloped land, the rate of parcelization has been relatively constant at
45-50 divisions per year across the county.
There were strong spatial variations associated with parcelization. Parcelization was greatest
near municipalities - high rates were observed near the cities of Grand Rapids and Deer River.
Parcelization was positively associated with proximity to water and to public lands. The findings
from this and other research provide a basis for a county-scale regional assessment of the
relative potential for parcelization of private lands. The objectives of this study were to assessand map the relative potential for parcelization on private lands within Itasca County, and relateparcelization risk to a critical habitat database developed as part of the Statewide Plan forConservation and Preservation. Understanding the distribution and ownership patterns of these
lands can help land managers select the most appropriate conservation strategies. In addition,
the analyses described here demonstrate a spatial modeling approach that can be used to help
target conservation efforts in other regions of the state.
2
G. Host revision 12.06.09

Methods
Study area
This study was conducted in Itasca County, which covers approximately 3,000 mi2 in north
central Minnesota, and includes 16 municipalities and 42 organized townships. The county is
heavily forested, contains over 1,000 lakes, and comprises a broad mix of public and private
lands. The county contains segments of three diverse ecological sections: the Minnesota and
Ontario Peatlands, the Drift and Lake Plains, and the Northern Superior Uplands (MN DNR). This
north central region of the state has been subject of a large body of research, including spatial
analyses of disturbance patterns (White & Host 2008), modeling the range of natural variation
(White & Host 2000), a conse.rvation legacy assessment for Itasca County, and numerous
habitat and water resource studies.
Spatial Analyses: Parcelization Risk
Parcelization risk was modeled usin·g a number of factors known to be correlated with
parcelization. Geospatial data used in the model are presented in Table 1. All data sets were
gridded to 30 m, the resolution of the original LANDSAT data that formed the basis for many of
the MN DNR GAP habitat data sets (land use, ownership, land stewardship, and others). Many
'distance variables' were modified with weighting functions - for example 'distance from water,'
a negative factor, was described by the actual distance up to 500 meters, and clipped to 500
beyond that, effectively removing the influence of this variable (Table 2). All of the variables
were 'normalized,' i.e., the minimum value of a given data set (usually zero) was subtracted
from all values in the data set, and the resulting values were divided by the difference between
the minimum and maximum values in the data set. Normalizing the values in this way makes it
possible to map their combined effects simply by adding them up for any given piece of land.
Table 1. Spatial data sources and analysis models for parcelization risk modeling. Percentages representcontribution of layer to composite parcelization index
Factor
Distance to water
Wetland density
Proportion of public land
land stewardshipcategory
Distance to municipality
Distance to major road
G. Host revision 12.06.09
Data Source
DNR 1:24,000 hydrography
National Wetland Inventory
DNR Gap Ownership
DNR Gap Stewardship
ESRI municipalities
TIGER roads
3
Analysis model
Distance to lakes> 32 ac,negative linear to 500 m, 25.8%
Proportion of wetland in 1 km radiUS, negative linear,3.2%
Proportion of public land in 1 km radius, positivelinear, 3.2%
Categories 1-4, positive parabolic, 32.3%(approx. redline)
Negative linear up to 10,000 m, 3.2%
Negative linear up to 3,000 m, 32.3%

Potential for parcelization was determined for each 30 m pixel as a weighted index function of
the above factors. The mean parcelization risk was calculated for each individual parcet and
parcels ranked by the risk index. The composite parcelization index was used to generate maps
showing the top 0.5% and 1% at-risk parcels (summarized by area).
Table 2. Weighting models for parcelization risk variables.
Curve 1: H Curve 2: 1. - H Curve 3: pou(H,e)
1 1 1
0.8 0.80.8
G)
G) ::I::I G) ...c 0.6...c ::I 1010 0.6 ...c 0.6 :It:li> 10 ...c:It
~Q) 0.4
0.4 ...c "I:l"I:l Q) 0.4 ClCl "I:l :c:c Cl 0.2lC
0.2 0.20
0 0 0.2 0.4 0.6 0.8 100 0.2 0.4 0.6 0.8 1 Hornalized input
0 0.2 0.4 0.6 0.8 :I.Hornalized input
Hornalized input e =3 e =0.4
Positive linear model: Negative linear model: Parabolic model:
Distance to water, Proportion of wetlands GAP land stewardship
proportion of public land category
Spatial Analyses: Critical Habftat
As part of the Statewide Plan for Conservation and Preservation, we developed maps of critical
terrestrial and aquatic habitat. The primary goal of this habitat mapping was to compile
information available on a statewide basis that could be used to prioritize important areas for
conservation. The analyses integrated both positive (resources) and negative (threats to
resources) information on biodiversity, habitat quality, outdoor recreation (e.g., hunting and
fishing), and water quality. Positive components included features such as known occurrences
of rare species, sites of biodiversity significance, or high levels of game species abundance.
Negative components included the dominant drivers of environmental change as identified in
Phase I of the Statewide Conservation and Preservation Plan. Negative influences on natural
resources included human development, land use, and road density. By acquiring and
objectively processing information related to these components, it was possible to rank areas in
Minnesota according to their conservation priority. As in the parcelization analyses, data were
derived or gridded to 30 m cells. Twelve terrestrial data sets were identified and compiled from
a variety of sources (Table 3).
4
G. Host revision 12.06.09

Table 3. Input datasets and weightings for critical habitat analyses.
Input Weighting Description
Sites of biodiversitysignificance
MN DNRGAPterrestrial vertebratemodels - GamespeciesMN DNRGAPterrestrial vertebrateSGCN modelsBird potential habitatmodels - USGS
MN DNR GAP Habitatby protection level
Wildland UrbanInterface
Wildland UrbanIntermix
CRPlandsRoad density
Housing density 2000
Projected housingdensity 2030Housing densitychange 2000 to 2030
33
7
10
9
8
6
5
5
5
4
4
5
A multi-faceted assessment of this land for its importance froma regional perspective in terms of biodiversity and ecosystemfunction. Higher values indicate higher biodiversity significance.The number of game species for which this land may be habitat.Higher values indicate higher numbers of game speciespotentially using this land.
The number of Species of Greatest Conservation Need (SGCN)for which this land may be habitat. Higher values indicate highernumbers of SGCN species potentially using this land.Probable number of bird species (from a set of 17) using thisland. Higher values indicate a greater number of species.
Number of terrestrial vertebrate species potentially using thisland weighted by the current level of habitat protectionstatewide for each species. Higher values indicate more speciespotentially using this land, weighted as described.Wildland Urban Interface maps initial encroachment ofdevelopment into areas of largely intact natural cover. Decisionsmade here determine whether natural areas are preserved orpressured. Higher values indicate land classified as WildlandUrban Interface, this is a binary yes / no input.Wildland Urban Intermix map intermixing of development andsignificant natural cover. Connectivity can be maintained or lostby decisions made in these areas. Higher values indicate landclassified as Wildland Urban Intermix, this is a binary yes / noinput.Lands enrolled in the Conservation Reserve Program, USDA.A measure of the density of roads within the township. Majorroads receive a higher weighting. Higher values indicate higherdensity of roads in the township.Housing density from census data (census blocks) for 2000 forthis land. Higher values indicate higher housing density.Projected housing density by census blocks for 2030 for thisland. Higher values indicate higher projected housing density.Projected change in housing density by census blocks for 2000 to2030 for this land. Higher values indicate higher housing densityincrease.
5
G. Host revision 12.06.09
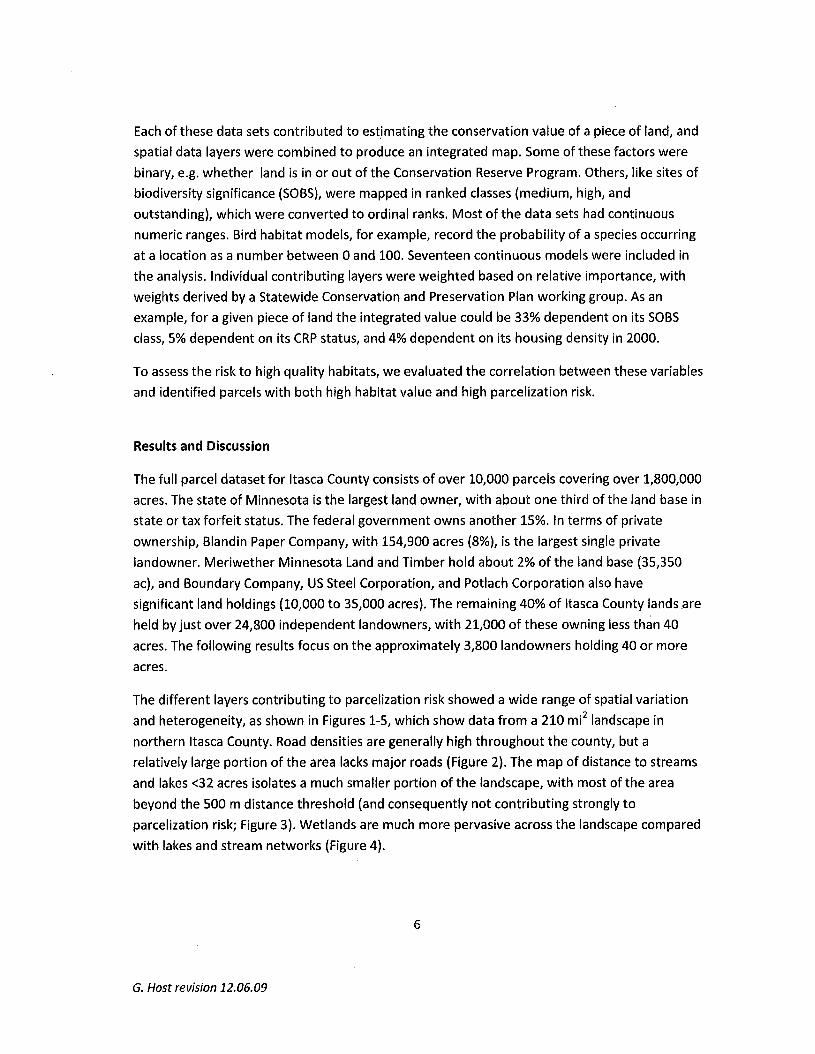
Each of these data sets contributed to est,imating the conservation value of a piece of land, and
spatial data layers were combined to produce an integrated map. Some of these factors were
binary, e.g. whether land is in or out of the Conservation Reserve Program. Others, like sites of
biodiversity significance (SOBS), were mapped in ranked classes (medium, high, and
outstanding), which were converted to ordinal ranks. Most of the data sets had continuous
numeric ranges. Bird habitat models, for example, record the probability of a species occurring
at a location as a number between 0 and 100. Seventeen continuous models were included in
the analysis. Individual contributing layers were weighted based on relative importance, with
weights derived by a Statewide Conservation and Preservation Plan working group. As an
example, for a given piece of land the integrated value could be 33% dependent on its SOBS
class, 5% dependent on its CRP status, and 4% dependent on its housing density in 2000.
To assess the risk to high quality habitats, we evaluated the correlation between these variables
and identified parcels with both high habitat value and high parcelization risk.
Results and Discussion
The full parcel dataset for Itasca County consists of over 10,000 parcels covering over 1,800,000
acres. The state of Minnesota is the largest land owner, with about one third of the land base in
state or tax forfeit status. The federal government owns another 15%. In terms of private
ownership, Blandin Paper Company, with 154,900 acres (8%), is the largest single private
landowner. Meriwether Minnesota Land and Timber hold about 2% of the land base (35,350
ac), and Boundary Company, US Steel Corporation, and Potlach Corporation also have
significant land holdings (10,000 to 35,000 acres). The remaining 40% of Itasca County lands ,are
held by just over 24,800 independent landowners, with 21,000 of these owning less than 40
acres. The following results focus on the approximately 3,800 landowners holding 40 or more
acres.
The different layers contributing to parcelization risk showed a wide range of spatial variation
and heterogeneity, as shown in Figures 1-5, which show data from a 210 mi2 1andscape in
northern Itasca County. Road densities are generally high throughout the county, but a
relatively large portion of the area lacks major roads (Figure 2). The map of distance to streams
and lakes <32 acres isolates a much smaller portion of the landscape, with most of the area
beyond the 500 m distance threshold (and consequently not contributing strongly to
parcelization risk; Figure 3). Wetlands are much more pervasive across the landscape compared
with lakes and stream networks (Figure 4).
6
G. Host revision 12.06.09

Figure 1 Aerial photo of 210 mi example region of northern Itasca County. Figures 2-5 and Figure 7 are based onthis footprint.
Figure 2 Distance to major roads in northern Itasca County - light colors indicate close proximity.
7
G. Host revision 12.06.09

Figure 3. Distance to streams and lakes in northern Itasca County - light colors indicate close proximity.
Figure 4 Wetland density in northern Itasca County - light colors indicate close proximity.
8
G. Host revision 12.06.09

Figure 5 Distance to population centers in northern Itasca County -light colors indicate close proximity.
The risk index, formed as the sum of the weighted layers, scaled between 0.0 and 0.15. The
distribution of the risk index was bimodal, with peaks at intermediate low and intermediate
high values (0.7 and 0.11, respectively; Figure 6). The distribution also varied from normality by
having extended tails, with the right tail of the distribution represent parcels with the highest
parcelization potential.
---
-•
II • • III I I I • •. . .
1400
1200lit
Gi 1000u...nIQ.
800-0... 600(II.aE 400:::JZ
200
o
~<, tt> b" b" ~" fb<' ~<-> ~" {> ,,<-> "," tt> <,<->~t:;> ~c:;; ~t:;> ~~ ~9 ~9 ~C;; ~~ ~'> ~'> ~'> ~~ ~"'>'
Risk class
Figure 6. Frequency distribution of parcels by risk index.
9
G. Host revision 12.06.09

The resulting map of the parcelization risk index isolates areas where the combined effect of
individual layers leads to high levels of parcelization risk (Figure 7). The map shows
heterogeneity at several spatial scales - risk is distributed at fine spatial scales along key areas
such as lakeshores, but also more broadly in areas of low-density development. The analysis
also shows numerous privately held areas where probability of parcelization is low.
Parcelization risk distributed across the entire county is presented in Figure 8. The 'protected'
lands are within theChippewa National Forest or have some existing protection status (e.g.
scientific and natural areas, state parks). Itasca County also has numerous parcels currently
under conservation easements, including over 10,000 on Forest Capital Partners lands in
northeastern Itasca County (part of a 50,000+ ac easement shared with Koochiching County,
and a 1,660 ac tract of northern hardwoods in southern Itasca Co.
Figure 7. Composite map of parcelization risk in northern Itasca County. Red - high risk, green -low risk, grayprotected area, blue - water.
10
G. Host revision 12.06.09

Figure 8. Map of parcelization risk for Itasca County Composite map of parcelization risk in northern ItascaCounty. Red - high risk, green -low risk, gray - protected area, blue - water.
11
G. Host revision 12.06.09

We assessed patterns of ownership in the highest risk categories, defined as the top 0.5% basedon acreage - the half-percent cutoff was approximately 7,500 acres (Figure 9). Of these highrisk ownerships, 66% of the land was in 'family forest,' 25% was held by corporations (includingfoundations and camps), and 10% was in public ownership (municipalities, counties). A fewgroups had relatively large land holdings (US Steel Corporation - 412 ac; city of Deer River 322ac), but most parcels ranged from 40-60 acres. This indicates that privately-held family forestsmight be the most effective group for targeting conservation easements or other policy toolsdesigned to reduce forest land parcelization.
Figure 9. 40 acre tracts with the highest parcelization risk (black top 5%, gray top 5-10%).
12
G. Host revision 12.06.09
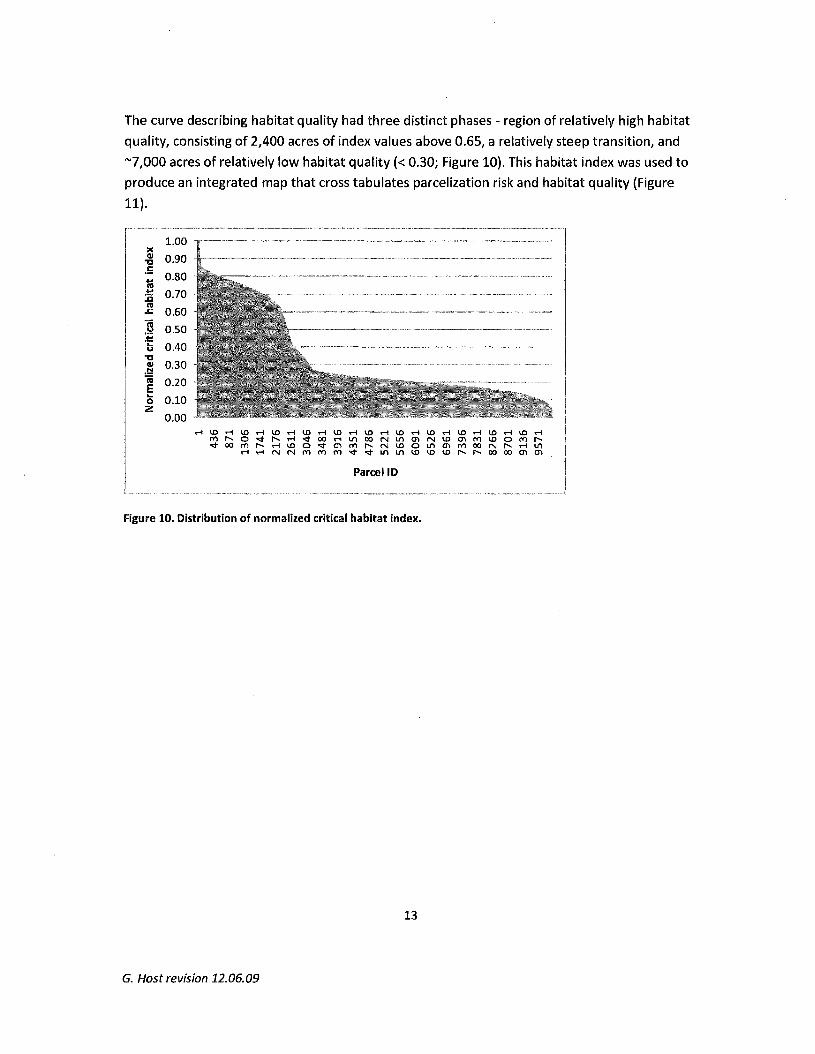
The curve describing habitat quality had three distinct phases - region of relatively high habitat
quality, consisting of 2,400 acres 'of index values above 0.65, a relatively steep transition, and
"'7,000 acres of relatively low habitat quality « 0.30; Figure 10). This habitat index was used to
produce an integrated map that cross tabulates parcelization risk and habitat quality (Figure
11).
1.00xell 0.90-a.5
0.80~.... 0.70:cnl.c 0.60
~ 0.50.~b 0.40 .u-aell 0.30
.!::!iU 0.20Eb
0.100z
0.00
Parcel 10
Figure 10. Distribution of normalized critical habitat index.
13
G. Host revision 12.06.09

o 5
~waler
Public
Study Area
Figure 11. Integrated map showing intersection of parcelization risk and habitat value from the StatewideConservation and Preservation Plan. Areas with both high risk and high value shown in orange.
The habitat index was not correlated with parcelization risk (r2 =0.002); Le. highly ranked
habitat parcels were not selectively subjected to increase risk of parcelization. It is possible,
however, to identify a set of parcels having both high habitat value and high parcelization risk.
We identified 33 parcels totaling 1,428 acres with habitat values> 0.70 and parcelization risk
>0.15 (Figure 9). Twenty-four of these were 'family forest' parcels; others were held by Limited
Liability Partnerships (LLPs), foundations, or companies. The ability to integrate habitat quality
and risk provides a means for resource management agencies to target specific key properties
for acquisition, conservation easements, or other conservation efforts.
14
G. Host revision 12.06.09

The maps and analyses produced in this study identify parcels that, based on multiple criteria
including distance to water, roads, and public lands, are at increased risk of being subdivided.
The maps further show which classes of owners currently hold high-risk lands, and provides
guidance on where to target conservation and protection efforts. The inclusion of critical
habitat data from the Statewide Conservation and Preservation Plan shows that there is not a
significant correlation between habitat quality and conservation risk. The use of this critical
habitat data, however, provides a further filter to identify those high quality lands that also
have high risk of parcelization.
Acknowledgements
This project benefited from ongoing discussions with members of the Statewide Conservationand Preservation Plan and other researchers working on forest land parcelization, includingJean Coleman, Mark White, Steven Taff, Michael Kilgore, Calder Hibbard and David Zumeta.Modeling was based on the Forest Legacy Ecological Evaluation Tool (FLEET) previouslydeveloped for the Nature Conservancy. This work was funded by the Minnesota Legislature(2007 Minn. Laws Chapter 57 Art. 1 Sec. 4 Subd. 4) via a grant to MN Forest Resources Councilin conjunction with the MN Statewide Plan for Conservation and Preservation.
Literature Cited
Brooks, R. T. 2003. Abundance, distribution, trends and ownership patterns of earlysuccessional forests in the northeastern United States. Forest Ecology and Management185:65-74.
Dillon, P. 1, W. A. Scheider, R. A. Reid, and D. S. Jeffries. 1994. Lakeshore capacity study: Part 1 test of effects of shoreline development on the trophic status of lakes. Lake andReservoir Management 8:121-129.
Mundell, 1, S. 1 Taff, M. A. Kilgore, and S. A. Snyder. 2009. Using real estate records to assessforest land parcelization and development: A Minnesota case study. Landscape andUrban Planning In Press.
Swackhamer D.L., Coleman 1 & Shardlow 1 Minnesota Statewide Conservation andPreservation Plan. 1-414. 2008. St. Paul, MN, Legislative Council on MinnesotaResources.Ref Type: Report
White M.A. & Host G.E. Mapping range of natural variation ecosystem classes for the NorthernSuperior Uplands: map and analytical methods. NRRI/TR-2000/39, 1-13. 2000. Duluth,
15
G. Host revision 12.06.09

MN, Natural Resources Research Institute.Ref Type: Report
White, M. A., and G. E. Host. 2008. Forest disturbance frequency and patch structure from preEuropean settlement to present in the Mixed Forest Province of Minnesota, USA.Canadian Journal of Forest Research 38:2212-2226.
16
G. Host revision 12.06.09


![SERIES 1180 SERIES 1180Delivery package Proximity switch, 2 fixing nuts, instructions. [mm] s [mm] a 700 600 500 400 300 200 100 80 40 0 80 40 s a LTK-1180-301-LTS-1180-301-LTK-1180-303-LTS-1180-303-G,](https://static.fdocuments.us/doc/165x107/5fd8adb449e21042a454e611/series-1180-series-delivery-package-proximity-switch-2-fixing-nuts-instructions.jpg)