07 - Sensing the Environment
56
L L b ! L ! s SENSING THE ENVIRONMENT E verything an animal does depends on receiving and correctly interpreting information from its external and internal environments. A bird listening for calls from its competitors, a gazelle sniffing the air as a lion passes up- wind, and a hawk hovering over a meadow and peering with one eye and then the other at the brush below-all need accurate information about their surroundings in or- der to decide what to do next. Their decisions can be ap- propriate only if data gathered from the environment are faithfully coded into signals that can be received and processed by neurons in the brain. In fact, sensory organs provide the only channels of communication from the external world into the nervous system. Sensory input is gathered constantly from the envi- ronment, and it interacts with the organization and prop- erties of the nervous system, which are inherited genetically and organized during embryogenesis, to provide each ani- mal with its entire store of "knowledge." This concept was recognized two millennia ago by Aristotle when he said, "Nothing is in the mind that does not pass through the senses." An understanding of how environmental infor- mation is converted into neuronal signals and of how these signals are then processed is therefore of deep philosophi- cal, as well as scientific, interest. Sensory reception begins in organs containing cells, called receptor cells, that are specialized to respond to particular kinds of stimuli. Sensory organs are positioned at many locations both on the surface and inside of the body, and they constitute the first step in gathering sensory information. (Neurons that carry information from the pe- riphery toward and into the central nervous system are called afferent neurons. Neurons that carry information away from the central nervous system are called efferent neurons.) In contrast with this initial coding step, sensa- tions are part of our subjective experience, and they arise when signals that are initiated in sensory receptor cells are transmitted through the nervous system to particular parts of the brain, producing signals in the brain that we experi- ence as subjective phenomena closely associated with the stimulus. Stimulus types possess features that distinguish them from one another. For example, the mechanical stimulation that produces the sensation of touch is different from the light that produces a visual response. In addition, stimuli of a particular type may differ in some features. Light can be red or blue; sounds can be high or low. The features that characterize stimuli are called qualities. Human subjects are able to describe the perceived sen- sation resulting from a particular kind of stimulus, and dif- ferent subjects generally agree on the kind of sensation that is produced by that stimulus, even though such subjective sensations are not really inherent in the stimuli themselves. For example, when sugar is placed on the tongues of many subjects, all are likely to report that it is "sweet." Similarly, light with a wavelength of 650- 700 nm is described by most subjects as being "red." In both cases, these perceptions are not inherent in the stimuli themselves. Instead, the percep- tion depends entirely on the subjects' neuronal processing of the stimulus. Thus, a description of sensory physiology must include the properties of receptor cells that allow them to re- ceive information from the environment and a consideration of how the nervous system processes information from the sensory cells to produce recognizable sensations. Notice that any distortions that are produced by the sensory cells or the subsequent processing will shape our perceptions of the stim- uli and will seem to be intrinsic to the stimuli themselves. A listing of sensory modalities (i.e., types of sensory in- formation that we can distinguish) typically includes vision, hearing, touch, taste, and smell, but this list leaves out im- portant internal sensory systems, as well as sensory modal- ities that nonhuman animals possess. For example, many in- teroceptive (internal) receptors respond to signals from within the body and communicate the information to the brain by pathways that often are not brought into con- sciousness. For example, proprioceptors monitor the posi- tion of muscles and joints, and other receptors monitor the orientation and chemical and thermal state of the body. These internal receptor systems play crucial roles in provid- ing information to the brain about the state of the body and its position in space, but we normally are not consciously
-
Upload
juan-carlos-sanchez-bermudez -
Category
Documents
-
view
52 -
download
4
Transcript of 07 - Sensing the Environment

L
L
b
! L
! s S E N S I N G T H E E N V I R O N M E N T
E verything an animal does depends on receiving and correctly interpreting information from its external and
internal environments. A bird listening for calls from its competitors, a gazelle sniffing the air as a lion passes up- wind, and a hawk hovering over a meadow and peering with one eye and then the other at the brush below-all need accurate information about their surroundings in or- der to decide what to do next. Their decisions can be ap- propriate only if data gathered from the environment are faithfully coded into signals that can be received and processed by neurons in the brain.
In fact, sensory organs provide the only channels of communication from the external world into the nervous system. Sensory input is gathered constantly from the envi- ronment, and it interacts with the organization and prop- erties of the nervous system, which are inherited genetically and organized during embryogenesis, to provide each ani- mal with its entire store of "knowledge." This concept was recognized two millennia ago by Aristotle when he said, "Nothing is in the mind that does not pass through the senses." An understanding of how environmental infor- mation is converted into neuronal signals and of how these signals are then processed is therefore of deep philosophi- cal, as well as scientific, interest.
Sensory reception begins in organs containing cells, called receptor cells, that are specialized to respond to particular kinds of stimuli. Sensory organs are positioned at many locations both on the surface and inside of the body, and they constitute the first step in gathering sensory information. (Neurons that carry information from the pe- riphery toward and into the central nervous system are called afferent neurons. Neurons that carry information away from the central nervous system are called efferent neurons.) In contrast with this initial coding step, sensa- tions are part of our subjective experience, and they arise when signals that are initiated in sensory receptor cells are transmitted through the nervous system to particular parts of the brain, producing signals in the brain that we experi- ence as subjective phenomena closely associated with the stimulus.
Stimulus types possess features that distinguish them from one another. For example, the mechanical stimulation that produces the sensation of touch is different from the light that produces a visual response. In addition, stimuli of a particular type may differ in some features. Light can be red or blue; sounds can be high or low. The features that characterize stimuli are called qualities.
Human subjects are able to describe the perceived sen- sation resulting from a particular kind of stimulus, and dif- ferent subjects generally agree on the kind of sensation that is produced by that stimulus, even though such subjective sensations are not really inherent in the stimuli themselves. For example, when sugar is placed on the tongues of many subjects, all are likely to report that it is "sweet." Similarly, light with a wavelength of 650- 700 nm is described by most subjects as being "red." In both cases, these perceptions are not inherent in the stimuli themselves. Instead, the percep- tion depends entirely on the subjects' neuronal processing of the stimulus. Thus, a description of sensory physiology must include the properties of receptor cells that allow them to re- ceive information from the environment and a consideration of how the nervous system processes information from the sensory cells to produce recognizable sensations. Notice that any distortions that are produced by the sensory cells or the subsequent processing will shape our perceptions of the stim- uli and will seem to be intrinsic to the stimuli themselves.
A listing of sensory modalities (i.e., types of sensory in- formation that we can distinguish) typically includes vision, hearing, touch, taste, and smell, but this list leaves out im- portant internal sensory systems, as well as sensory modal- ities that nonhuman animals possess. For example, many in- teroceptive (internal) receptors respond to signals from within the body and communicate the information to the brain by pathways that often are not brought into con- sciousness. For example, proprioceptors monitor the posi- tion of muscles and joints, and other receptors monitor the orientation and chemical and thermal state of the body. These internal receptor systems play crucial roles in provid- ing information to the brain about the state of the body and its position in space, but we normally are not consciously
Administrador
Resaltado
Administrador
Resaltado
Administrador
Resaltado
Administrador
Resaltado
aware of these signals. Imagine how complicated walking would be if we had to pay conscious attention to the posi- tion of every muscle and joint taking part in the process.
Many species of animals use sensory modalities that are unavailable to human beings. For example, some species of snakes, the pit vipers, can detect emitted heat energy (in- frared radiation), which they can use to locate their mam- malian prey because these warm-bodied animals stand out against a cold background. The fish species that are called "weakly electric fish" (to distinguish them from the electric fish that can stun or kill prey by using electric shocks) use very low frequency electric signals to communicate in murky water, allowing them to find one another and to ne- gotiate with one another regarding reproduction and ter- ritory. Some animals appear to sense Earth's magnetic field and use it as a navigational guide. (These examples are con- sidered later in this chapter.) Obviously, we can have very little idea about the subjective quality of such sensory in- formation, because we do not possess these receptors, but important principles of organization that apply to these sys- tems also apply to other systems discussed in this chapter. In this chapter, we consider chemoreceptors, rnechanore- ceptors, electroreceptors, thermoreceptors, and photore- ceptors. The names of receptors are based on the forms of energy to which they are most sensitive: chemical, me- chanical, electrical, thermal, and light.
In the course of evolution, sensory systems have devel- oped from single, independent receptors into specialized sense organs in which the receptor cells are arranged in well-organized spatial arrays and are associated with ac- cessory structures. The cellular organization of sensory or- gans allows stimuli to be sampled more accurately than can be accomplished by isolated receptor cells. The vertebrate eye includes several structural adaptations (considered later in this chapter) that improve both our visual sensitivity and our ability to perceive images. The vertebrate eye can be contrasted with the simpler eyes of many invertebrates- for example, barnacles. Without a lens to form an image, a barnacle eye can detect changes in light, but it cannot form images. Barnacle photoreceptors can sense information only about changes in light intensity, so a barnacle's re- sponse to visual input can be based only on this simple form of information. In contrast, the vertebrate eye pro- vides a remarkably high-quality optical image to the recep- tor cells. These cells, in turn, encode features of the scene and pass it along to the brain to be interpreted, which re- sults in our subjective experience of "vision." Seeing well seems to have made an important contribution to evolu- tionary success, because about 85% of all living animal species have image-forming eyes.
Until very recently, the extraordinary diversity of stim- uli and the corresponding receptor types were considered a tribute to the wide variety of solutions that could be gen- erated by natural selection, because no unifying principles were apparent among these receptors. However, recent ev- idence has revealed surprising similarities among cellular mechanisms in sensory receptors. This chapter presents the
general principles of how sensory receptors encode and transmit information and compares the events in the re- ceptors of several major sensory systems. The ways in which sensory information is used to generate and to shape behavior are considered in Chapter 11.
GENERAL PROPERTIES OF SENSORY RECEPTION
Until recently, physiologists were struck by the wide variety of sensory receptors and the large functional differences ob- served among the receptor cells in different sensory modal- ities. However, we now know that several features are shared by many-even most-sensory receptors, regard- less of modality. We begin this chapter with a discussion of several of these common features to provide background for the consideration of some specific sensory modalities that follows.
Properties of Receptor Cells
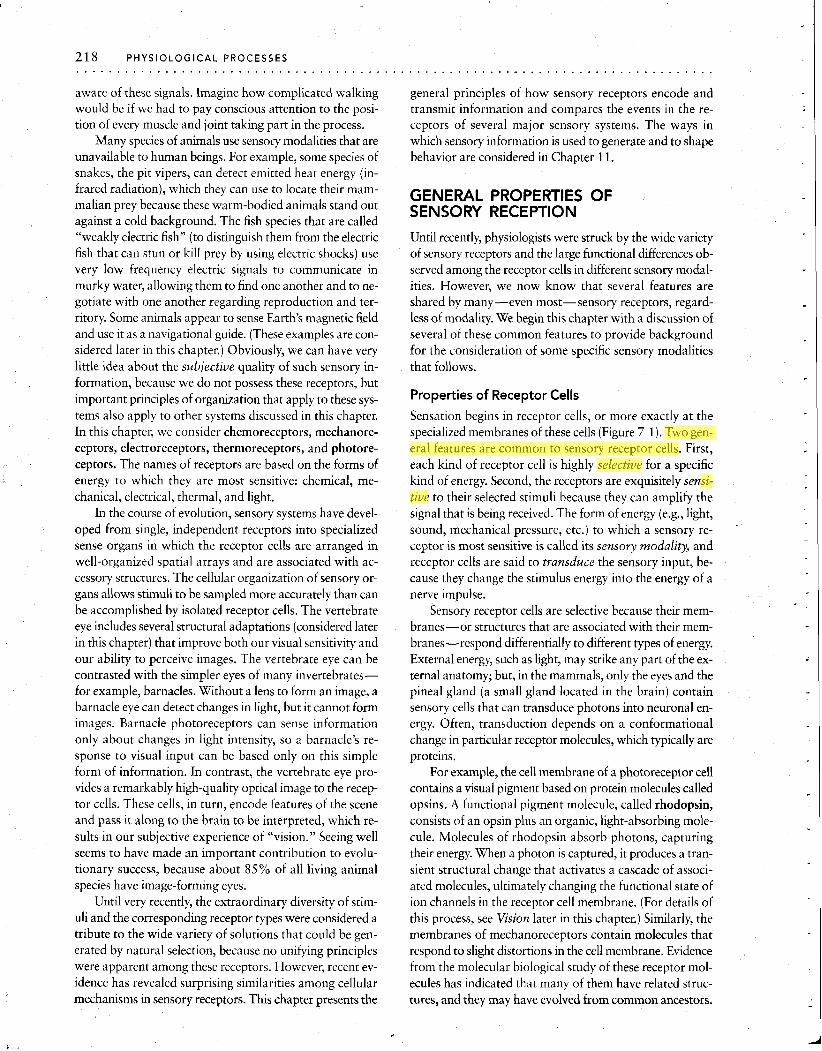
Sensation begins in receptor cells, or more exactly at the specialized membranes of these cells (Figure 7-1). Two gen- eral features are common to sensory receptor cells. First, each kind of receptor cell is highly selective for a specific kind of energy. Second, the receptors are exquisitely sensi- tive to their selected stimuli because they can amplify the signal that is being received. The form of energy (e.g., light, sound, mechanical pressure, etc.) to which a sensory re- ceptor is most sensitive is called its sensory modality, and receptor cells are said to transduce the sensory input, be- cause they change the stimulus energy into the energy of a nerve impulse.
Sensory receptor cells are selective because their mem- branes-or structures that are associated with their mem- branes-respond differentially to different types of energy. External energy, such as light, may strike any part of the ex- ternal anatomy; but, in the mammals, only the eyes and the pineal gland (a small gland located in the brain) contain sensory cells that can transduce photons into neuronal en- ergy. Often, transduction depends on a conformational change in particular receptor molecules, which typically are proteins.
For example, the cell membrane of a photoreceptor cell contains a visual pigment based on protein molecules called opsins. A functional pigment molecule, called rhodopsin, consists of an opsin plus an organic, light-absorbing mole- cule. Molecules of rhodopsin absorb photons, capturing their energy. When a photon is captured, it produces a tran- sient structural change that activates a cascade of associ- ated molecules, ultimately changing the functional state of ion channels in the receptor cell membrane. (For details of this process, see Vision later in this chapter.) Similarly, the membranes of mechanoreceptors contain molecules that respond to slight distortions in the cell membrane. Evidence from the molecular biological study of these receptor mol- ecules has indicated that many of them have related struc- tures, and they may have evolved from common ancestors.
Administrador
Resaltado
Administrador
Resaltado
Administrador
Resaltado
Stimuli
Receptor cell
Neuronal signal to CNS
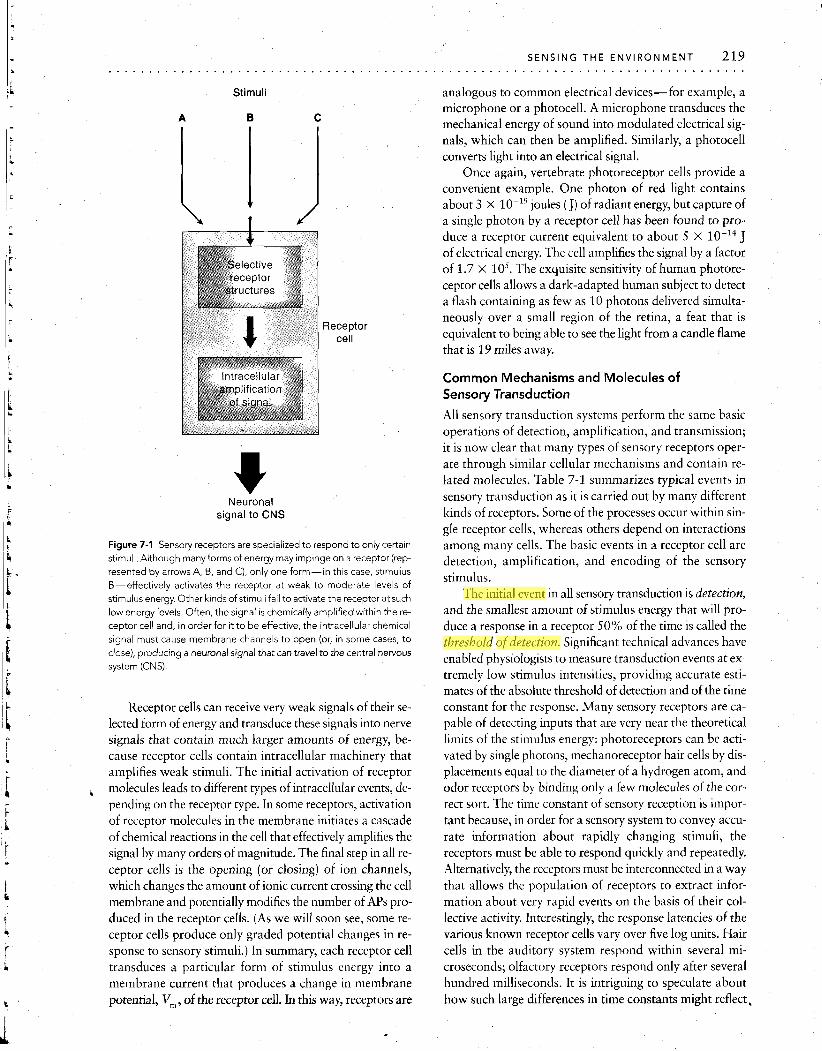
Figure 7-1 Sensory receptors are specialized to respond to only certain stimuli. Although many forms of energy may impinge on a receptor (rep-
resented by arrows A, B, and C), only one form-in this case, stimulus B-effectively activates the receptor at weak to moderate levels of stimulus energy. Other kinds of stimuli fail to activate the receptor at such
low energy levels. Often, the signal is chemically amplified within the re- ceptor cell and, in order for it to be effective, the intracellular chemical
signal must cause membrane channels to open (or, in some cases, to close), producing a neuronal signal that can travel to the central nervous system (CNS).
Receptor cells can receive very weak signals of their se- lected form of energy and transduce these signals into nerve signals that contain much larger amounts of energy, be- cause receptor cells contain intracellular machinery that amplifies weak stimuli. The initial activation of receptor
, molecules leads to different types of intracellular events, de- pending on the receptor type. In some receptors, activation of receptor molecules in the membrane initiates a cascade of chemical reactions in the cell that effectively amplifies the signal by many orders of magnitude. The final step in all re- ceptor cells is the opening (or closing) of ion channels, which changes the amount of ionic current crossing the cell membrane and potentially modifies the number of APs pro- duced in the receptor cells. (As we will soon see, some re- ceptor cells produce only graded potential changes in re- sponse to sensory stimuli.) In summary, each receptor cell transduces a particular form of stimulus energy into a membrane current that produces a change in membrane potential, Vm, of the receptor cell. In this way, receptors are
analogous to common electrical devices-for example, a microphone or a photocell. A microphone transduces the mechanical energy of sound into modulated electrical sig- nals, which can then be amplified. Similarly, a photocell converts light into an electrical signal.
Once again, vertebrate photoreceptor cells provide a convenient example. One photon of red light contains about 3 X joules ( J ) of radiant energy, but capture of a single photon by a receptor cell has been found to pro- duce a receptor current equivalent to about 5 x 10-l4 J of electrical energy. The cell amplifies the signal by a factor of 1.7 x lo5. The exquisite sensitivity of human photore- ceptor cells allows a dark-adapted human subject to detect a flash containing as few as 10 photons delivered simulta- neously over a small region of the retina, a feat that is equivalent to being able to see the light from a candle flame that is 19 miles away.
Common Mechanisms and Molecules of Sensory Transdudion
All sensory transduction systems perform the same basic operations of detection, amplification, and transmission; it is now clear that many types of sensory receptors oper- ate through similar cellular mechanisms and contain re- lated molecules. Table 7-1 summarizes typical events in sensory transduction as it is carried out by many different kinds of receptors. Some of the processes occur within sin- gle receptor cells, whereas others depend on interactions among many cells. The basic events in a receptor cell are detection, amplification, and encoding of the sensory stimulus.
The initial event in all sensory transduction is detection, and the smallest amount of stimulus energy that will pro- duce a response in a receptor 50% of the time is called the threshold of detection. Significant technical advances have enabled physiologists to measure transduction events at ex- tremely low stimulus intensities, providing accurate esti- mates of the absolute threshold of detection and of the time constant for the response. Many sensory receptors are ca- pable of detecting inputs that are very near the theoretical limits of the stimulus energy: photoreceptors can be acti- vated by single photons, mechanoreceptor hair cells by dis- placements equal to the diameter of a hydrogen atom, and odor receptors by binding only a few molecules of the cor- rect sort. The time constant of sensory reception is impor- tant because, in order for a sensory system to convey accu- rate information about rapidly changing stimuli, the receptors must be able to respond quickly and repeatedly. Alternatively, the receptors must be interconnected in a way that allows the population of receptors to extract infor- mation about very rapid events on the basis of their col- lective activity. Interestingly, the response latencies of the various known receptor cells vary over five log units. Hair cells in the auditory system respond within several mi- croseconds; olfactory receptors respond only after several hundred milliseconds. It is intriguing to speculate about how such large differences in time constants might reflect,
Administrador
Resaltado
Administrador
Resaltado
Administrador
Resaltado

220 PHYSIOLOGICAL PROCESSES . . . . . . . . . . . . . . . . . . . . . . . . . . . . . . . . . . . . . . . . . . . . . . . . . . . . . . . . . . . . . . . . . . . . . . . . . . . . . . . TABLE 7-1 General features and processes common t o many types of sensory receptors . - - Transduct~on operations* Found wlthln slngle cells Found in cell populations
- -- -- - --
Detection
1 Mechanisms that select stimulus modality: filters, Mechanisms that select stimulus modality: filters, carriers, tuning, inactivation carriers, tuning, inactivation
~ r n ~ i l f l c a t ~ o n Positlve feedback among chemlcal reactions or Posltlve feedback among cells
I membrane channels Slgnal/noise enhancement Slgnal/noise enhancement
1 Active processes in membranes
Encoding and discrimination Intensity coding
Temporal differentiation
Quality coding
Different dynamic ranges among cells
Independent coding of quality and intensity
Center-surround antagonisms
1 Opponent mechanisms
Adaptat~on and termlnatlon Desenslt~zatlon Temporal d~scrim~nat~on
I Negative feedback
Temporal dlscrlmlnatlon
Repetitive responses
Gating of ion channels Channels open or close J.
Electrical response of membrane Depolarization or hyperpolarization J.
Transmission to brain .Electrotonic spread Spatial patterns: maps and image formation
Action potentials; number and frequency Temporal patterns; directional selectivity, etc.
Synaptic transmlsslon - -- " - "- - -" -.- - - *Arrows lndlcate that these operations are a serles of steps
fundamental differences in the roles played in the life of an animal by different sensory modalities.
Recent evidence indicates that in vertebrates the recep- tors for three of the senses-vision, olfaction, and, proba- bly, sweet and bitter tastes-have in their cell membranes receptor proteins with a common structural motif. The sec- ondary structure of these membrane proteins includes seven transmembrane a helix domains, and transduction in all three senses requires G proteins as ~ntermediaries (Figure 7-2). This pattern is also found in several neuro- transmitter receptor molecules, including the muscarinic acetylcholine receptor (see Chapter 6).
A Muscarinic acetylcholine receptor
Neurotransmitter
Ion channel I
G protein Effector Second-messenger enzyme molecule
Figure 7-2 The molecular mechanism of sensory reception in visual re- ceptors resembles the molecular mechanism of transmission at many synapses. For the examples shown, both processes begin with a struc- tural change in a transmembrane protein (the receptor molecule), which
By far, the most detailed knowledge available is about the molecules responsible for detecting photons: the protein opsin and its associated molecules (Figure 7-3), which will be discussed in more detail later in this chapter. However, the close relation among sensory receptors was recently un- derscored when the DNA sequence that codes for opsin was used to identify putative olfactory receptor molecules (Chess et al., 1992). The sequences in this new family of ol- factory receptor molecules are expressed only in the cells of the olfactory epithelium, and the family appears to be very large (containing several hundred different gene prod- ucts-perhaps even as many as a thousand). The sequences
B Photoreceptor
Light
Ion channel I
/ protein Effector \
Second- enzyme messenger
interacts with a GTP-binding protein (G protein) to alter intracellular sec- ond-messenger pathways. The second-messengers modify conductance through ion channels, eitherdiredly or indirectly, and can thus modify the pattern of APs in afferent neurons. [Adapted from Bear et a1.,1996.]
SENSING THE ENVIRONMENT 221 . . . . . . . . . . . . . . . . . . . . . . . . . . . . . . . . . . . . . . . . . . . . . . . . . . . . . . . . . . . . . . . . . . . . . . . . . . . . . . .
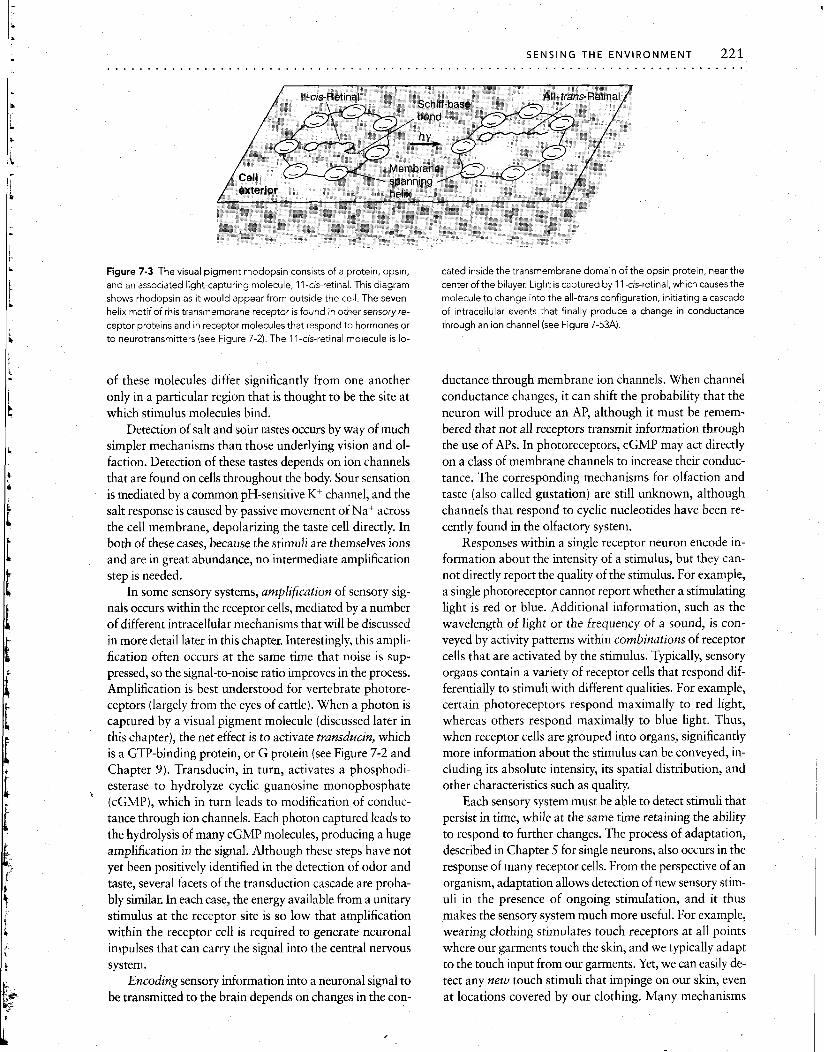
i Figure 7-3 The visual pigment rhodopsin consists of a protein, opsin, cated inside the transmembrane domain of the opsin protein, near the and an associated light-capturing molecule, 1 I-cis-retinal. This d~agram center of the bilayer. Light is captured by 1 I-cis-retinal, which causes the
[ shows rhodopsin as it would appear from outside the cell. The seven- molecule to change into the all-transconfiguration, initiating a cascade helix motif of this transmembrane receptor is found in other sensory re- of intracellular events that finally produce a change in conductance
I ceptor proteins and in receptor molecules that respond to hormones or through an ion channel (see Figure 7-53A). 6 to neurotransmitters (see Figure 7-2). The I I-cis-retinal molecule is lo-
of these molecules differ significantly from one another only in a particular region that is thought to be the site at which stimulus molecules bind.
Detection of salt and sour tastes occurs by way of much simpler mechanisms than those underlying vision and ol- faction. Detection of these tastes depends on ion channels that are found on cells throughout the body. Sour sensation is mediated by a common pH-sensitive K+ channel, and the salt response is caused by passive movement of Na+ across the cell membrane, depolarizing the taste cell directly. In both of these cases, because the stimuli are themselves ions and are in great abundance, no intermediate amplification step is needed.
In some sensory systems, amplification of sensory sig- nals occurs within the receptor cells, mediated by a number of different intracellular mechanisms that will be discussed in more detail later in this chapter. Interestingly, this ampli- fication often occurs at the same time that noise is sup- pressed, so the signal-to-noise ratio improves in the process. Amplification is best understood for vertebrate photore- ceptors (largely from the eyes of cattle). When a photon is captured by a visual pigment molecule (discussed later in this chapter), the net effect is to activate transducin, which is a GTP-binding protein, or G protein (see Figure 7-2 and Chapter 9). Transducin, in turn, activates a phosphodi- esterase to hydrolyze cyclic guanosine monophosphate
a (cGMP), which in turn leads to modification of conduc- tance through ion channels. Each photon captured leads to the hydrolysis of many cGMP molecules, producing a huge amplification in the signal. Although these steps have not yet been positively identified in the detection of odor and taste, several facets of the transduction cascade are proba- bly similar. In each case, the energy available from a unitary stimulus at the receptor site is so low that amplification within the receptor cell is required to generate neuronal impulses that can carry the signal into the central nervous system.
Encoding sensory information into a neuronal signal to be transmitted to the brain depends on changes in the con-
ductance through membrane ion channels. When channel conductance changes, it can shift the probability that the neuron will produce an AP, although it must be remem- bered that not all receptors transmit information through the use of APs. In photoreceptors, cGMP may act directly on a class of membrane channels to increase their conduc- tance. The corresponding mechanisms for olfaction and taste (also called gustation) are still unknown, although channels that respond to cyclic nucleotides have been re- cently found in the olfactory system.
Responses within a single receptor neuron encode in- formation about the intensity of a stimulus, but they can- not directly report the quality of the stimulus. For example, a single photoreceptor cannot report whether a stimulating light is red or blue. Additional information, such as the wavelength of light or the frequency of a sound, is con- veyed by activity patterns within combinations of receptor cells that are activated by the stimulus. Typically, sensory organs contain a variety of receptor cells that respond dif- ferentially to stimuli with different qualities. For example, certain photoreceptors respond maximally to red light, whereas others respond maximally to blue light. Thus, when receptor cells are grouped into organs, significantly more information about the stimulus can be conveyed, in- cluding its absolute intensity, its spatial distribution, and other characteristics such as quality.
Each sensory system must be able to detect stimuli that persist in time, while at the same time retaining the ability to respond to further changes. The process of adaptation, described in Chapter 5 for single neurons, also occurs in the response of many receptor cells. From the perspective of an organism, adaptation allows detection of new sensory stim- uli in the presence of ongoing stimulation, and it thus makes the sensory system much more useful. For example, wearing clothing stimulates touch receptors at all points where our garments touch the skin, and we typically adapt to the touch input from our garments. Yet, we can easily de- tect any new touch stimuli that impinge on our skin, even at locations covered by our clothing. Many mechanisms

222 PHYSIOLOGICAL PROCESSES . . . . . . . . . . . . . . . . . . . . . . . . . . . . . . . . . . . . . . . . . . . . . . . . . . .
Stimuli
Muscle 1 % q ) v ~ e n d r i t e s
Receptor potentials
Spikeinitating, 1 1 Weak Strong
Impulse frequency
underlying adaptation take place within individual recep- tor cells, and several of them appear to depend on Ca2+ (e.g., in vision, olfaction, and mechanoreception). In addi- tion, some adaptation depends on negative feedback from higher brain centers. ,
From Transduction to Neuronal Output
Electrical measurements are important sources of insight into the steps that lie between sensory transduction and the generation of neuronal responses. One of the first such ex- periments was done on receptor cells, called stretch recep- tors, that sense muscle length in the abdomen of crayfish and lobsters (Figure 7-4). Because each stretch receptor is a relatively large cell, its soma can be impaled with micro- electrodes. It is also possible to record extracellularly from the axon of the cell. The dendrites of each stretch receptor are attached across the surface of muscle fibers, and if the muscle is stretched, a steady train of impulses can be recorded from the axon. The frequency of the APs varies di- rectly with the amount of stretch applied. To understand the source of the APs, the intracellular potential can be recorded by inserting a microelectrode into the cell body. A small stretch applied to the relaxed muscle leads to a small depolarization called the receptor potential (see Figure 7-4). A stronger stretch produces a larger depolar- izing receptor potential. This change in Vm indicates that an underlying receptor current must flow across the mem- brane and that this receptor current must carry positive charge into the cell to produce the depolarization. If recep- tor potentials are sufficiently large, they trigger one or more APs in the cell (Figure 7-5).
What is the relation between stimulus, receptor cur- rent, receptor potential, and APs? Action potentials can be eliminated (see Figure 7-5B) by blocking the electrically ex- cited sodium channels with tetrodotoxin. When APs are blocked, the receptor potential remains, indicating that it must be produced by a different mechanism from the one that generates the all-or-none upstroke of the AP.
Integration
Conversion from graded signal into APs
Impulse conduction
Figure 7-4 Stretch receptors in the tail of a crayfish transmit information about the amount that the tail muscles are stretched. The receptor consists of a sensory neuron that has its stretch-sensitive dendrites em- bedded in a special muscle bundle located on the dorsal surface of the tail muscles. When the tail of the crayfish bends, the mus- cle is stretched, and the receptor is activated. On the left side of the diagram, intracellular records from the soma and extracellular recordsfrom the axon show how the receptor responds to small and large stretches of the muscle. The parts of the neuron are function- ally d~fferentiated, as labeled at the right. Graded receptor potentials from the stretch- sensitive membrane of the dendrites are con- verted into all-or-none APs at the spike-initi- ating zone. The arrow indicates the direction of AP propagation.
Moreover, the size of the receptor potential varies with the strength of the stimulus, in contrast with APs that are all- or-none. In these respects, receptor potentials resemble excitatory postsynaptic potentials at the postsynaptic membrane of muscle and nerve cells and are quite distinct from APs.
Stimulating current
B In normal saline In l T X
Stretch stimulus 7 1 lntracellular record
Extracellular T
record Jlo m v
2 s
Figure 7-5 The response of some crayfish stretch receptors IS phaslc, the response of others IS tonlc (A) Responses of a phasrcstretch receptor to a weak (left) and to a strong (rrght) st~mulus A stronger stlmulus gener- ates more APs than a weak stlmulus Even when the stlmulus IS maln- tamed, the cell produces only one or a few APs (6) Responses of a tonlc stretch receptor In normal sallne (left) and after the addltlon of tetro- dotoxln (TTX, rrght) Tetrodotoxln blocks APs, revealing the underlying receptor potent~al [Part A adaptedfrom Eyzagu~rre and Kuffler, 1955, part B adapted from Loewensteln, 1971 ]

Sensory receptors differ in how faithfully they repro- duce the timing of a stimulus. A phasic receptor produces APs during only part of the stimulation-often only at the onset or at the offset of the stimulus-and thus cannot by itself convey information about the duration of the stimu- lus. In contrast, tonic receptors continue to fire APs Sp~ke-~n~t~ating
zone throughout the stimulation and can thus directly convey in-
APs recorded formation about the duration of the stimulus. (See Recep- by extracellular tor Ada~tation later in this chapter for a more complete electrode discussion.) Local stimulation of the stretch receptor cell was used to test the ability of various parts of a single cell to produce sustained trains of APs. In these experiments (Figure 7-6), a steady stimulus current produced a sus- tained discharge only when the current depolarized the low-threshold, spike-initiating zone of the receptor. When other regions of the cell were stimulated, APs were pro- duced, but there was no sustained train of impulses. This difference implies that the ion channels at the spike- initiating zone have different properties from ion channels along the rest of the axon.
In summary, a general sequence of steps leading from a stimulus to a train of impulses in a sensory neuron can be formulated from the results obtained with the crayfish stretch receptor (Figure 7-7). Stimulus energy produces an alteration in a receptor protein, generally located in a mem- brane. The receptor protein may be part of an ion channel, or it may modulate the activity of membrane channels in- directly through an enzyme cascade, which amplifies the signal. In either case, the absorption of stimulus energy by a receptor molecule eventually causes a population of ion channels to open or to close. This change in membrane per- meability produces a shift in V,,, in accord with principles presented in Chapter 5. As the intensity of the stimulus in-
Transduction
Amplification
J. Change in conductance produces a receptor current
1 Receptor current changes V,,
n
Stimulus reaches receptor cells
1 Receptor protein is activated
1 - Cascade of protein interactions
modifies intracellular second- messengers
1 - Ion channels open (or close)
I
stimulus ci;Y Stimulus current L
t i m u s 1 1 - kF Recording
electrode
Figure 7-6 Sustained stimulation of a crayfish stretch receptor produces a long train of APs only when the stimulus depolarizes the spike-initiating zone. Other areas of the cell adapt rapidly to steady stimulation. [Adapted from Nakajima and Onodera, 1969.1
creases, more channels respond, producing an increased (or decreased) receptor current, and hence a larger receptor potential. Thus, all the steps leading to, and including, the receptor potential are graded in amplitude. Unlike the
Change in V, spreads electrotonically Change in amount of transmitter to spike-initiating zone released from receptor cell
Number and/or frequency of APs conducted along the axon changes
Figure 7-7 Several steps l~nk the onset of a st~mulus to the production of APs In a sensory pathway In some sensory systems, the receptor cells themselves generate and carry APs Into the central nervous system (lower left) In other sys- tems, receptor cells synaptically modulate APs In other neurons that carry the s~gnal Into the central nervous system (lower rrght)
Graded events
Number and/or frequency All-or-none of APs conducted along axon of second-order neuron changes

224 PHYSIOLOGICAL PROCESSES . . . . . . . . . . . . . . . . . . . . . . . . . . . . . . . . . . . . . . . . .
current carried by sodium during an AP, the receptor cur- rent is not regenerative, even if it is carried by Naf, and it therefore must spread through the cell electrotonically (see Chapter 6). If sensory information is to be propagated over
I long distances into the central nervous system, the infor- mation contained in the receptor potential must be con- verted into Ms. This conversion occurs in one of two ways:
1. In some receptors, a depolarizing receptor potential spreads electrotonically from its site of origin in the re- ceptor zone to the spike-initiating zone in the axon membrane, which then generates APs. The receptor zone may be a part of the same neuron that carries APs to the central nervous system (Figure 7-8A and B). When the receptor potential spreads to the electrically excitable membrane without intervention of a synapse and directly modulates the generation of APs at the spike-initiating zone, it is sometimes also termed a gen- erator potential. In a variation on this theme, the re- ceptor zone in some systems is located in an inex- citable receptor cell that is electrically coupled to the afferent neuron (not shown in Figure 7-8).
2. In other sensory systems, the receptor and the con- ducting elements are separated by a chemical synapse. In this case, a depolarizing or hyperpolarizing receptor potential spreads electrotonically from the sensory re- gion of the receptor cell to the presynaptic part of that same cell, modulating the release of a neurotransmit- ter (Figure 7-8C). The transmitter produces a post-
Action potent~a l
Receptor potentlal
Stimulus
\ b Spike-initiating zone
synaptic potential in this second neuron of the chain, called a second-order neuron, modulating the fre- quency of APs in the postsynaptic neuron. In all cases, the cell that contains the receptor membrane is called the primary sensory neuron. The axon that carries APs to the central nervous system can be referred to as a sensory fiber, an afferent fiber, or a sensory neuron.
Encoding Stimulus Intensities
Individual APs originating in different sense organs are in- distinguishable from one another, as first noted in the 1830s by Johannes Miiller, who called this the law of specific nerve energies. Miiller hypothesized that the modality of a stimulus is encoded not by any characteristics inherent in the individual APs but depends instead on the anatomical region in the brain to which the information is sent. Thus, stimulation of the photoreceptors in the eye produces the sensation of light, whether the photoreceptors are stimu- lated in the normal way by incident light or abnormally by an intense blow to the eye.
Because APs are all-or-none phenomena, the only way in which information carried along a single nerve fiber can be encoded, other than by the specificity of anatomical con- nectivity, is in the number and the timing of impulses. Thus, a high frequency of impulses normally represents a strong stimulus, and a reduced frequency of ongoing impulses sig- nals a reduction in the strength of the stimulus. There is no simple rule for sensory coding, because the relations be- tween a stimulus and the sensory response differ in differ-
Figure 7-8 Sensory signals are carried into the central nervous sys- tem by action potentials. In two types of primary sensory neurons (A and B), the receptor current arises in the receptor membrane and spreads electrotonically to depolarize the spike-initiating zone. In both cell types, the axon of the receptor cell extends into the central nervous system. The difference between cells A and B is that the cell body of cell A is located relatively far away from the central nervous system, whereas that of cell B is located near the central nervous sys- tem. Many invertebrate sensory neurons are like cell A. Vertebrate touch receptors are like cell B. (C) In this arrangement, the receptor cell does not produce impulses but instead releases transmitter at a synapse that modulates AP produalon by an afferent neuron. This arrangement is found in the mammalian auditory and visyal systems. Red arrows show the pattern of current flow, and the records at the upper right were made by an intracellular electrode in the soma of neuron A.
s t i h i u s chemical synapse

ent kinds of receptors. For example, some receptors that re- ceive a particular kind of stimulus information are tonic, whereas others are phasic. Nevertheless, some generaliza- tions can be made about how the intensity of stimuli can be encoded. As the intensity of a stimulus is increased, the re- ceptor current increases, and a greater depolarization (or, in some cases, hyperpolarization) is produced. In many re- ceptors, the spike-initiating zone (see Figure 7-4) will con- tinue to produce a steady train of impulses as long as it is held depolarized.
Input-Output Relations
An ideal sensory system would be able to translate stimuli of all intensities into useful signals. However, biological sensory systems can actually encode stimulus intensity only over a limited range. The range of stimulus intensities over which a receptor can encode higher intensity by producing more APs at a higher frequency is called the dynamic range of the receptor (or sense organ). Three major factors serve to set the maximum response that a receptor cell can pro- duce to strong stimuli:
1. There is an upper limit on the receptor current that can flow in response to a strong stimulus because there are a finite number of receptor current channels.
2. There is an upper limit on the amplitude of the recep- tor potential because it cannot exceed the reversal po- tential of the receptor current (see Reversal Potential in Chapter 6).
3. There is an upper limit on the frequency of APs carried along each axon, because refractoriness (see General Properties of Action Potentials, Chapter 5 ) determines the minimum time between APs propagating along the axon. Typically, the maximum frequency of APs is sev- eral hundred APs per second or less.
Biophysical properties cause most sensory responses to be linear with the logarithm of the stimulus intensity. The amplitude of the receptor potential in most receptor cells is
A Ampl~tude limited
U 0
= _ L
E la a X
?! Log of s t~mulus ~ n t e n s ~ t y
approximately proportional to the logarithm of the stimu- lus intensity (Figure 7-9A), and the frequency of sensory impulses varies approximately linearly with the amplitude of the receptor potential (Figure 7-9B), up to the limit set by the length of the refractory period. As a consequence of these two relations, the frequency of APs in a slowly adapt- ing receptor is typically a function of the logarithm of the stimulus intensity (Figure 7-9C). When the APs reach the central terminals of sensory neurons, they generate post- synaptic potentials that sum and undergo synaptic facili- tation as a function of the frequency of impulses. Thus, the postsynaptic potential produced in the central sensory neu- ron is graded as a function of the stimulus intensity, and it remains an analog of the stimulus, although with some- what altered characteristics.
The logarithmic relation between stimulus energy and the frequency of sensory impulses that is found in many sensory systems has important implications for how sen- sory information is processed. Most sensory systems en- counter an enormous range of stimulus intensities. For ex- ample, sunlight is lo9 times more intense than moonlight, and the human auditory system can perceive without sig- nificant distortion sounds that range over twelve orders of magnitude. This ability of sense organs to function over such enormous ranges of stimulus intensity is quite re- markable and is based on several physiological mecha- nisms. First, the transduction process itself has a broad dy- namic range. In addition, prolonged exposure to a stimulus causes a change in the amplification of the receptor events, shifting the intensity-coding characteristics of the receptor, a process called adaptation. Furthermore, neuronal net- works that process sensory signals have features that ex- tend the dynamic range of the system beyond the capabili- ties of individual receptor neurons.
At low stimulus intensities, the receptor potential in a nonadapted receptor neuron represents a very large ampli- fication of energy. The amplification factor is, however, pro- gressively reduced as the intensity of the stimulus increases. The logarithmic relation between intensity of a stimulus
Frequency limited I by refractqry period
L - Amplitude of receptor potential Log of stimulus intensity
Figure 7-9 The response in most sensory receptors is proportional to the ceptor neuron depends linearly on the amplitude of the receptor poten- logarithm of stimulus intensity (A) In many receptors, the amplitude of tial. The refractory period of the neuron sets an upper limit on the fre- the receptor potential is linearly related to the logarithm of stimulus in- quency. (C) As a result of the relations illustrated in parts A and B, the fre- tensity over a large-but finite-range. The amplitude of the receptor quency of APs in many sensory axons varies linearly with the log of the potential cannot increase infinitely, because it is limited by the reversal stimulus intensity The broken parts of the curves in parts B and C indicate potential of the receptor current and by other biophysical properties of that refractoriness limits the maximum frequency of APs. the receptor cell. (B) Within a certain range, the frequency of APs in a re-
226 PHYSIOLOGICAL PROCESSES . . . . . . . . . . . . . . . . . . . . . . . . . . . . . . . . . . . . . . . . .
and the amplitude of the receptor potential is explained, at least in part, by the Goldman equation (see Chapter S), which predicts that Vm should vary with the log of the membrane's permeability to the ion (or ions), Pi,, involved in the receptor potential. After stimulation, the change in Vm should be proportional to the log of the change in the permeability to sodium, (P,,), that was produced by the stimulus. Normal stimulus intensities lie within the loga- rithmic part of the input-output curve (see Figure 7-9A). Not all receptors follow this general rule. In some recep- tors, there is, instead, a power-function relation: the log of the response amplitude is proportional to the log of the stimulus intensity. For practical purposes, either a log- arithmic function or a power function describes the rela- tion between stimulus intensity and receptor response very well in the range of stimulus intensities commonly encoun- tered by animals. The differences between the two func- tions become apparent only at extreme values of stimulus intensity.
As a consequence of the logarithmic relation between the intensity of a stimulus and the amplitude of the recep- tor potential, any given percentage of change in stimulus in- tensity evokes the same increment of change (i.e., same number of millivolts) in the receptor potential over a large range of intensities. In other words, a doubling of the stim- ulus intensity at the low end of the intensity range will evoke the same increment in the amplitude of the receptor potential as will a doubling of the intensity of the stimulus near the high end of the range up to the limit where the re- ceptor potential cannot increase. So we have
where I is the stimulus intensity and K is a constant. The logarithmic relation between the intensity of the stimulus and the intensity of the response (Figure 7-9C) thus "com- presses" the high-intensity end of the scale, which greatly extends the range of discrimination. This relation is similar to that which governs subjectively perceived changes in stimulus intensity, a relation known in psychology as the Weber-Fechner law.
This feature of sensory systems confers great advan- tage. For example, this property allows us to recognize the objects in a particular scene, even when we see the scene under very different lighting conditions. If we observe the scene in very bright sunlight, each object is distinguished by its relative brightness. If we observe the same scene by moonlight, the absolute brightness of each object is very different from its brightness in sunlight-in fact, the dif- ference in an object's brightness under the two conditions of lighting may be far greater than the difference in bright- ness of various objects in the scene when illuminated by bright sunlight. However, we are able to recognize the ob- jects in the scene on the basis of their relative intensities, in- dependent of the absolute level of illumination. Detecting relative intensities and changes in intensity within a given
scene are far more informative to a viewer than is the ab- solute energy content of each stimulus. Thus, a deer in a field or in a forest is acutely attuned to movements (changes in the distribution of visual stimuli) independent of changes in the lighting conditions.
Range Fractionation
The dynamic range of a multineuronal sensory system is typically much broader than is the range of any single re- ceptor or afferent sensory fiber. The extended dynamic range of the entire system is possible because individual af- ferent fibers of a sensory system cover different parts of the full spectrum of sensitivity. The most sensitive receptors produce a maximal response at stimulus intensities that are below threshold or only slightly above threshold for other, less sensitive receptors in the population. Above that inten- sity, the most sensitive receptors become saturated, but the less sensitive receptors can take over at the higher intensi- ties. Thus, at the lowest stimulus energies, a few especially sensitive sensory fibers will respond weakly. If the stimu- lus energy is increased a little, their discharge frequencies will increase, whereas new, less sensitive fibers will join in weakly. With still greater stimulus intensities, another, for- merly quiescent lower-sensitivity population of afferents will join in. As the stimulus intensity is increased, receptors that are less and less sensitive will become active, a phe- nomenon called recruitment, until the least sensitive sen- sory fibers will finally be recruited, and all receptors will re- spond maximally. At that point, the system will be saturated and therefore unable to detect further increases in intensity. This range fractionation, in which individual receptors or sensory afferents cover only a fraction of the total dynamic range of the sensory system (Figure 7-10), enables the sensory processing centers of the central ner- vous system to discriminate stimulus intensities over a range much greater than that of any single sensory recep- tor. One example of range fractionation are the photo- receptors of the vertebrate eye. Rod photoreceptors are more sensitive to light and respond to dimmer stimuli; cones respond to bright light that saturates the rods (see Vi- sual receptor cells of vertebrates later in this chapter).
Control of Sensory Sensitivity
How accurate are our sensations? That is, how do sense organs compare with physical transducers such as ther- mometers, light meters, and strain gauges? From our own experience, we know that biological sensory systems may not be very trustworthy indicators of absolute energy levels. Moreover, many sensations change over time. For example, when a person dives into an unheated pool for a swim, the water initially feels colder than it does a minute or two later. A pleasantly sunny day may seem painfully bright for a few minutes after a person emerges from a dimly lit house; for this reason, even an experienced pho- tographer requires a light meter to make accurate judg- ments of camera exposure settings. These changes of perceived intensity, when the intensity of the stimulus

Figure 7-10 Range fractionation extends the dynamic range of sets of sensory receptors Each curve In thls
a b c graph represents the dlschargefrequency of an indlv~d- ual sensory afferent, plotted as a funct~on of stlmulus In- tensity In thls hypothetical example, each of the four sensory fibers, labeled a through d, has a dynamlc range of about three to four log unlts of stimulus ~ntenslty, whereas the overall dynamlc range of the four neurons taken together covers seven log unlts of ~ntenslty
1
Log stimulus intensity
has not itself changed, are lumped under the general term sensory adaptation. Where does the adaptation take place? There is no simple answer. Some adaptation takes place in the receptor cells, some as a result of time-dependent changes in accessory tissues, and some in the central nervous system.
Mechanisms of adaptation Different classes of receptors exhibit different degrees of adaptation. Tonic receptors continue to fire steadily in response to a constant stimulus, as illustrated in Figure 7-11A, which shows a receptor that responds to the displacement of a hair; this receptor produces APs at an al- most constant frequency when the hair is displaced and
held in the new position. In contrast, phasic receptors adapt quickly. In one class of phasic receptors, for example, APs occur only during changes in the strength of the stimulus, as illustrated in Figure 7-1 1B by a mechanoreceptor that fires only when the displacement of the hair changes, and the frequency of APs depends on the rate of change.
Adaptation can take place at any of a number of dif- ferent stages in the processes that link a stimulus to the out- put of a sensory neuron (Figure 7-12):
1. The mechanical properties of the receptor cell may act as a filter that preferentially passes transient, rather than sustained, stimuli. This mechanism is common among mechanoreceptors.
A Displacement detector
Stimulus intensity (g)
6 Velocity detector
A x h a n i c a ~ displacement
Figure 7-1 1 A displacement detector fires toni- cally, whereas a velocity detector fires phasically. (A) Behavior of a tonic displacement detector. This mechanoreceptor responded to a steady dis- placement (shown by red trace) with APs at a rela- tively constant frequency throughout the stimula- tion. (Top) Extracellularly recorded APs elicited by three different amounts of disolacement, which in- creased from bottom to top. The amount of dis- placement is indicated below each record. (Bot- tom) Steady-state frequency of APs plotted against the number of grams of tension applied. (B) Behavior of a phasic velocity detector. This rapidly adapting mechanoreceptor responded to the rate at which the posltion changed. (Top)Ac- tion potentials elicited by three different rates of change (red traces) Higher velocities produced more APs. (Bottom) The number of impulses pro- duced during a 0.5 second stimulus was pro- portional to the log of the veloclty of displace- ment. [Adapted from Schmidt, 1971.1
I
1 0 I l l I L
0.2 0.5 1 2 5 10
Displacement velocity (pm . ms-')
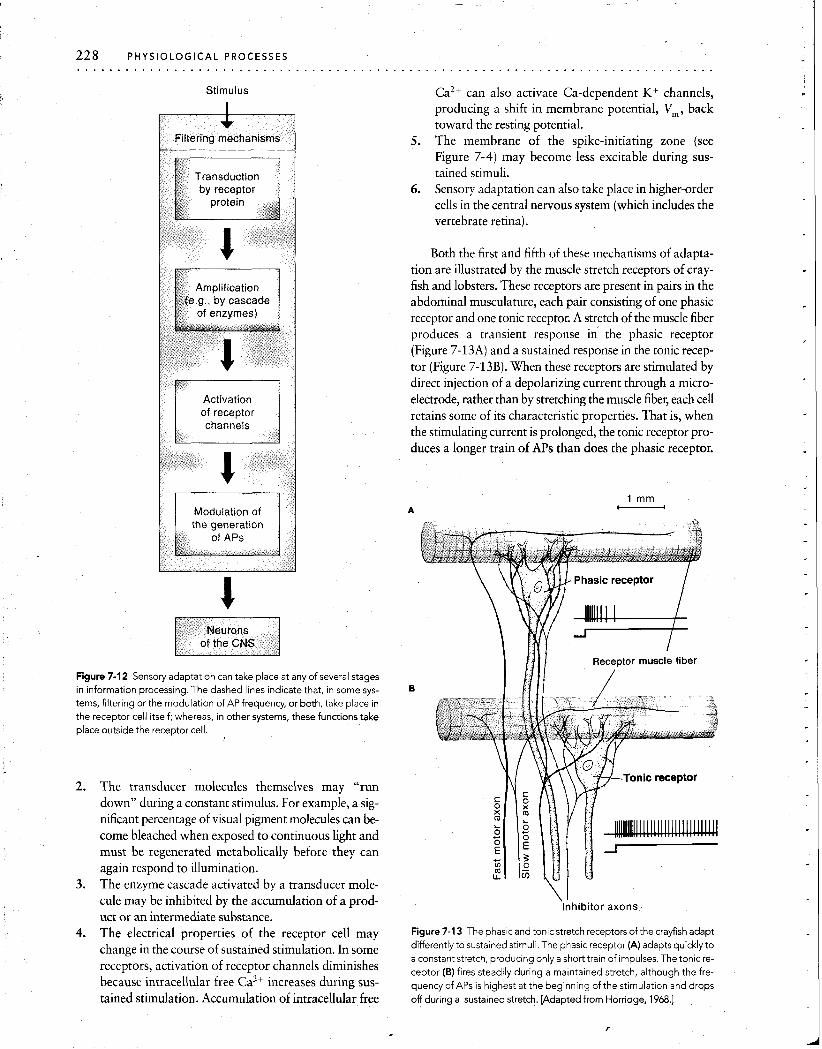
Modulation of
3 of the CNS
Stimulus Ca2+ can also activate Ca-dependent K+ channels, I producing a shift in membrane potential, Vm, back
toward the resting potential. 5. The membrane of the spike-initiating zone (see
Figure 7-4) may become less excitable during sus- tained stimuli.
6. Sensory adaptation can also take place in higher-order cells in the central nervous system (which includes the vertebrate retina).
Both the first and fifth of these mechanisms of adapta- tion are illustrated by the muscle stretch receptors of cray- fish and lobsters. These receptors are present in pairs in the abdominal musculature, each pair consisting of one phasic receptor and one tonic receptor. A stretch of the muscle fiber produces a transient response in the phasic receptor (Figure 7-13A) and a sustained response in the tonic recep- tor (Figure 7-13B). When these receptors are stimulated by direct injection of a depolarizing current through a micro- electrode, rather than by stretching the muscle fibel; each cell retains some of its characteristic properties. That is, when the stimulating current is prolonged, the tonic receptor pro- duces a longer train of APs than does the phasic receptor.
Figure 7-12 Sensory adaptation can take place at any of several stages in information processing. The dashed lines indicate that, in some sys- tems, filtering or the modulation of AP frequency, or both, take place in the receptor cell itself; whereas, in other systems, these functions take place outside the receptor cell.
2. The transducer molecules themselves may "run down" during a constant stimulus. For example, a sig- nificant percentage of visual pigment molecules can be- come bleached when exposed to continuous light and must be regenerated metabolically before they can again respond to illumination.
3. The enzyme cascade activated by a transducer mole- cule may be inhibited by the accumulation of a prod- \ 1
Inhibitor axons,, uct or an intermediate substance.
4. The electrical properties of the receptor cell may Figure 7-1 3 The phasic and tonic stretch receptors of the crayfish adapt
change in the course of sustained some differently to sustained stimuli. The phasic receptor (A) adapts quickly to a constant stretch, producing only a short train of impulses. The tonic re-
activation of receptor channels diminishes ceptor (B) fires steadily during a maintained stretch, although the fre- because intracellular free Ca" increases during sus- quency of APs is highest at the beginning of the stimulation and drops tained stimulation. Accumulation of intracellular free off during a sustained stretch. [Adapted from Horridge, 1968.1

Hook electrode \ Amplifier
Myelin
Crystal 'Ore \ \ &=-
Nerve ou te r Node of ending layer Ranvier
Figure 7-14 Adaptation in the Pacinian corpuscle depends on the me- chanical properties of accessory structures. (A) Experimental arrange- ment for tapping a Pacinian corpuscle receptor with a piezoelectric crystal-driven stylus. The electrical recording was made between the hook electrode on the axon and the oil-water interface. (B) Electrical re- sponse of the intact corpuscle. The neuron depolarized transiently at the onset and the offset of the stimulus (dashed red lines). (C) In contrast, af-
A change in the filtering that is produced by accessory structures (mechanism 1) contributes importantly to the rapid adaptation of the Pacinian corpuscle, a pressure and vibration receptor found in the skin, muscles, mesentery, tendons, and joints of mammals (Figure 7-14A). Each Pacin-
"ian corpuscle contains a region of receptor membrane that is sensitive to mechanical stimuli and that is surrounded by concentric lamellae of connective tissue resembling the lay- ers of an onion. When something presses on the corpuscle, deforming it, the disturbance is transmitted mechanically through the layers to the sensitive membrane of the receptor neuron. The receptor membrane normally responds with a brief, transient depolarization at both the onset and the off- set of the deformation (Figure 7-14B). However, when the layers of the corpuscle are peeled away, permitting a me- chanical stimulus to be applied directly to the naked axon, the receptor potential obtained is sustained much longer, producing a more accurate representation of the stimulus (Figure 7-14C). Although the receptor potential still shows some degree of adaptation (there is sag in the record shown in Figure 7-14C), there is no distinctive response at the off- set of the stimulus. The mechanical properties of the intact corpuscle, which preferentially pass rapid changes in pres- sure, confer on the receptor neuron its normally phasic re- sponse. This behavior explains, in part, why we quickly lose awareness of moderate, sustained pressures, such as the stimuli that wearing clothing produces on our skin.
Regardless of its site or mechanism of origin, adapta- tion plays a major role in extending the dynamic range of sensory reception. Together with the logarithmic nature of the primary transduction process, sensory adaptation al- lows an animal to detect changes in stimulus energy against background intensities that range over many orders of magnitude.
I A Stimulus
terthe lamellae were removed, the neuron remained depolarized during most of the stimulus. (D) Receptor current flow in response to deforma- tion at the sensory zone of the axon. The generator potential is con- ducted electrotonically to the spike-initiating zone at the first node of Ranvier. If the generator potential is sufficiently large, it will bring the sp~ke-initiating zone to threshold, producing APs in the axon. [Adapted from Loewenstein, 1960.1
Mechanisms that enhance sensitivity Many receptor cells produce APs-or release neurotrans- mitter independent of APs-spontaneously in the absence of stimuli. (The amount of transmitter released from non- spiking receptors varies with the membrane potential, V,,, .) When these spontaneously active receptors are stim- ulated, the frequency of their APs-or their non-spiking release of transmitter-is increased or decreased above its baseline level. Several mechanisms enhance the sensitivity of receptors to sustained stimuli, and one important mech- anism modifies the properties of the receptor's on-going spontaneous activity. The spontaneous release of trans- mitter from receptor cells-whether it is mediated by APs or by graded changes in Vm-has two important conse- quences. First, any small increase in stimulus energy will produce an increase in the rate of firing above the spon- taneous level. Small receptor currents in response to weak stimuli modulate the impulse frequency by shortening the intervals between impulses (Figure 7-15). This modulation of impulse frequency allows the receptors to be much more sensitive to changes in stimuli than would be feasi- ble if the receptor current had to bring a completely qui- escent spike-initiating zone to threshold. The input-output relations of such a sensory fiber are described by the sig- moid curve in Figure 7-16. In the unstimulated condition, the firing frequency is already on the steep part of the curve, so even a small input will produce a significant in- crease in firing frequency.
Second, in some spontaneously active sensory neurons, stimuli can either increase or decrease impulse frequency, permitting the receptor to convey information about the polarity or direction of a stimulus. For example, in some mechanoreceptors, such as hair cells, movement of the hair in one direction increases the rate of firing in the sensory

Stimulus I decreases intervals
I I I
Time
Figure 7-15 In a spontaneously firing receptor cell, the Interval between
APs depends on stimulus conditions. The interval can be decreased by extremely small stimuli, because a stimulus increases the slope of the in- ternally generated depolarization. (In cases where APs are generated in
second-order sensory fibers, synaptic potentlais, rather than internally generated depolarizations, are enhanced.)
Stin~ulus energy
Figure 7-16 The input-output relation of a spontaneously active recep- tor cell or second-order sensory fiber) is sigmoidal. In the absence of any
input (0 on the abscissa), the receptor cell, or second-order sensory fiber, fires spontaneously This spontaneous output lies on the steep part of the curve relating the stimulus intensity to the frequency of APs, so even a
very small stlmulus will increase the rate of flring. In some receptors, stim- uli can also decrease the rate of firlng, indicated by the black dashed part of the curve.
fiber, whereas movement in the other direction decreases the rate of firing. If these receptors were silent when they were not stimulated, it would be impossible to encode in- formation about movement in the second direction.
The existence of numerous parallel sensory pathways provides another mechanism for enhancing the distinction between a signal and ongoing background noise. In this situation, signals from many receptor cells can be summed by the central nervous system. All of the signals produced by the stimulus will arrive at central neurons nearly si- multaneously, whereas noise will be random and will tend to be canceled out at central synapses. By reducing noise, this arrangement allows small changes in input to be de- tected. For example, a human observer cannot reliably perceive a single photon absorbed by a single receptor cell; but, if each of several receptors sim~~ltaneously absorbs a single photon, the observer experiences the sensation of light.
Efferent control of receptor sensitivity The responsiveness of some sense organs is influenced by the central nervous system through efferent axons that in- nervate the sense organ itself. For example, the muscles to which muscle stretch receptors in skeletal muscles of verte- brates and crustaceans are attached are innervated by ef- ferent fibers. By controlling the length of the receptor mus- cles, this efferent innervation sets the sensitivity of the stretch receptor to changes in overall muscle length.
In crayfish and lobsters, when the tail extensor muscle shortens, the receptor muscles (which run parallel to the extensor muscle) shorten too, driven by efferent neurons. If there were no such mechanism, when the tail extensor muscle shortened, the stretch receptors would go slack and would be unable to detect any further change in the length of the extensor muscle. Instead, contraction of the recep- tor muscles, in response to the efferent input, maintains a fairly constant tension on the sensory parts of the receptor, and the receptor retains its sensitivity to flexion of the tail, regardless of the tail's position in space. In addition to this mechanism by which the receptors maintain high sensitiv- ity, the abdominal stretch receptors are innervated by ef-
Figure 7-17 Steady stretching of crayfish muscles produces reflex inhi- bition of crayfish stretch receptors. (A) The muscle stretch receptors of
one segment are removed with their innervation intact, and record~ngs are made as shown. Electrode 1 records activity in an intact receptor;
electrode 2 records activlty in a receptorthat has been removed from the tail. (0) At the beginning of the record, electrode 1 records a steady train of APs from the intact tonic receptor in response to a steady stretch of the
tail. When the isolated tonic receptor is stretched, electrode 2 records a train of sensory impulses, and there 1s a simultaneous drop in the fre-
quency of APs recorded by electrode 1 in the intact receptor. Activity in the stretch receptor monitored by electrode 2 increases activity in an in-
hibitory neuron, which reduces the steady output of the neuron that is
rnonltored by electrode 1 [Adapted from Eckert, 1961 .I
ferent neurons that form inhibitory synapses directly on the stretch receptor cells (see Figure 7-13). When the in- hibitory efferent neuron is active, the size of the receptor potential in the stretch receptor is diminished, reducing the frequency of APs in the axon or even abolishing them al- together. The interplay of these two mechanisms-one that enhances the responsiveness and the other that in- hibits it-allows activity in the central nervous system ei- ther to increase or to decrease the sensitivity of these stretch receptors.
Feedback inhibition of receptors The sensitivity of sensory receptors is also controlled through feedback inhibition. In this mechanism, activity in - the receptors produces signals that are sent more or less di- rectly back to the receptors, inhibiting them. The crus- tacean abdominal stretch receptors provide one example of this (Figure 7-17). Activation of the sensory neuron by stretch produces a reflex output-initiated in the central nervous system-that travels in the efferent inhibitory nerves leading to the stimulated sensory neuron (autoinhi- bition) and to its anterior and posterior neighbors (lateral inhibition). At low stimulus intensities, the feedback plays little or no role, because it takes a relatively strong sensory signal to evoke the reflex activation of the inhibitory neu- rons. However, stronger stimuli produce stronger in- hibitory feedback; as a result, strong stimuli are preferen- tially inhibited. This mechanism acts to keep the receptor within its operating range (i.e., it keeps the frequency of APs less than the maximum frequency possible in the cell), and the net effect of the inhibitory feedback is to extend the dynamic range of the receptor.
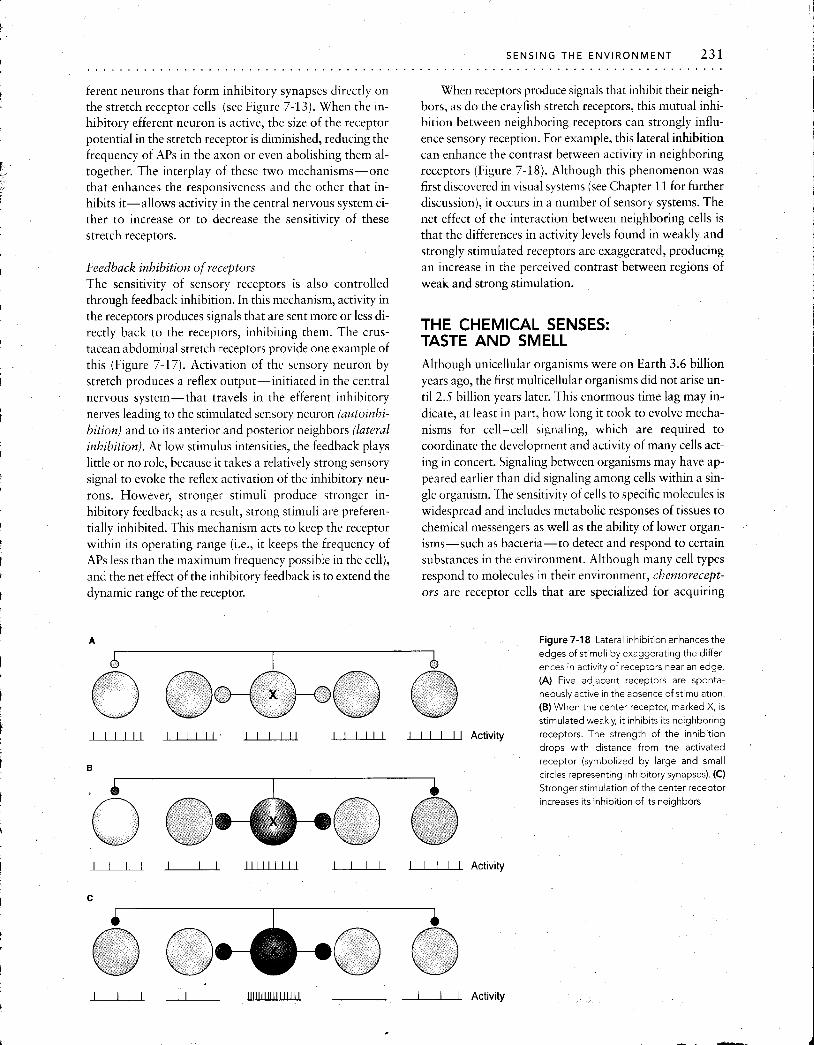
When receptors produce signals that inhibit their neigh- bors, as do the crayfish stretch receptors, this mutual inhi- bition between neighboring receptors can strongly influ- ence sensory reception. For example, this lateral inhibition can enhance the contrast between activity in neighboring receptors (Figure 7-18). Although this phenomenon was first discovered in visual systems (see Chapter 11 for further discussion), it occurs in a number of sensory systems. The net effect of the interaction between neighboring cells is that the differences in activity levels found in weakly and strongly stimulated receptors are exaggerated, producing an increase in the perceived contrast between regions of weak and strong stimulation.
THE CHEMICAL SENSES: TASTE AND SMELL Although unicellular organisms were on Earth 3.6 billion years ago, the first multicellular organisms did not arise un- til 2.5 billion years later. This enormous time lag may in- dicate, at least in part, how long it took to evolve mecha- nisms for cell-cell signaling, which are required to coordinate the development and activity of many cells act- ing in concert. Signaling between organisms may have ap- peared earlier than did signaling among cells within a sin- gle organism. The sensitivity of cells to specific molecules is widespread and includes metabolic responses of tissues to chemical messengers as well as the ability of lower organ- isms-such as bacteria-to detect and respond to certain substances in the environment. Although many cell types respond to molecules in their environment, chemorecept- ors are receptor cells that are specialized for acquiring
Activity
Figure 7-18 Lateral lnhlbition enhances the
edges of stimuli by exaggerating the differ- ences in activity of receptors near an edge. (A) Five adjacent receptors are sponta- neously active In the absence of stimulation. (B) When the center receptor, marked X, is stimulated weakly, it inhibits its neighboring receptors. The strength of the inhibition drops with distance from the activated '
receptor (symbolized by large and small circles representing lnhlbitory synapses). (C) Stronger stimulation of the center receptor
increases its inhibition of its neighbors.
Activity
Activity

232 P H Y S I O L O G I C A L PROCESSES . . . . . . . . . . . . . . . . . . . . . . . . . . . . . . . . . . . . . . . . . . . . . . . . . . . . . . . . . . . . . . . . . . . . . . . . . . . . . . .
information about the chemical environment and trans- mitting it to other neurons. According to one widely ac- cepted classification scheme, chemoreceptors can be divided into two categories: gustatory (taste) receptors, which respond to dissolved molecules, and olfactory (smell) receptors, which respond to airborne molecules. This di- chotomy, however, rapidly breaks down. By these defini- tions, aquatic organisms, such as fishes, could have no smell receptors; all of their chemical sensation would be taste. Furthermore, even in terrestrial organisms, airborne molecules must pass through a layer of aqueous solution before they reach the olfactory receptors.
If taste and smell are legitimately different senses, there must be a more useful distinction between them. Indeed, as we will see, the receptors of taste and the receptors of smell operate quite differently from one another, making it pos- sible to distinguish between the two senses at the cellular level. In addition, there are alternative schemes to distin- guish between taste and smell at a more global level. For example, smell can be considered as the chemoreception of signals from distant sources and "taste" as the chemore- ception of signals from material that is in direct contact with the receptive structure (e.g., masticated food in the mouth or material at the bottom of a pond in which a cat- fish is living).
Chemosensory systems can be extraordinarily sensitive. The antennal chemoreceptors of the male silkworm moth (Bombyx mori) for bombykol, the female's sex-attractant pheromone, provide a spectacular example. In the labora- tory, a male moth responds behaviorally to concentrations of the pheromone that are as low as one molecule per loi7 molecules of air. These receptors are highly specific, re- sponding only to bombykol and a few of its chemical analogs. This highly evolved stimulant-receptor system al- lows the male Bombyx moth to locate a single female at
night from several miles downwind, an ability that confers obvious reproductive advantage in a widely dispersed species.
To investigate the sensitivity of the receptors to bom- bykol, the electrical responses of antennal olfactory recep- tors of Bombyx have been recorded. When only about 90 bombykol molecules per second impinge on a single recep- tor cell, the rate at which the cell fires APs increases signif- icantly. However, a male moth reacts behaviorally (e.g., flaps his wings excitedly) when only about 40 receptor cells (out of a total of 20,000 per antenna) each intercept one molecule per sqcond. No change can be detected in the fre- quency of APs fired by a single receptor cell in response to a single odorant molecule. As a result, it is inferred that the moth's central nervous system is capable of sensing very slight average increases in impulse frequency arriving along numerous chemosensory channels, as described earlier in this chapter (see Mechanisms that enhance sensitivity).
Mechanisms of Taste Reception
Electrophysiological studies of the contact chemoreceptors (taste hairs) of insects have revealed generally useful infor- mation about how chemoreception works. These receptor cells send fine dendrites to the tips of hollow hairlike pro- jections of the cuticle, called sensilla (plural; singular, sen- sillum). Each sensillum has a minute pore that allows stim- ulant molecules to reach the sensory cells (Figure 7-19). In the proboscis or on the feet of an ordinary housefly, every sensillum contains several cells, each of which is sensitive to a different chemical stimulus (e.g., water, cations, anions, or carbohydrates).
The electrical activity of these chemoreceptors can be recorded through a crack made in the wall of the sensillum, and such records have revealed both a receptor potential and APs. The receptor potential is produced at the ends of
potent~al here Pore at t ~ p of sens~llum
b
Spikes originate here
Figure 7-19 The response of a housefly2 contact chemoreceptors can be recorded extracellularly. The dendrites of several neurons share a single sensillurn. The dendrite of each individual neuron within thesen-
sillum is sensitive t o a particular class o f substances (e.g., sugars, cations, anions, or water). Stirnull are pre- sented through a cannula slipped over the t ip of the sensillum, and electrical responses (in red at right) are
recorded through a crack made in the cuticle covering the sensillurn.

the dendrites that extend to the tip of the sensillum, whereas the APs originate near the cell body.
Appropriate chemical stimulation of even a single sen- sillum will evoke a behavioral response in a fly. For exam- ple, a small drop of sugar solution applied to a single sen- sillum on the foot will cause the fly to lower its proboscis to feed, and the effectiveness of various compounds to evoke this stereotyped behavior has been tested. All compounds that release the feeding reflex also evoke electrical activity in the sugar receptor. This receptor cell is known to respond to only certain carbohydrates, and those compounds that do not trigger feeding behavior, such as D-ribose, also fail to stimulate the sugar receptor. Interestingly, the sugar re- ceptor of the fly shows the same sequence of sensitivity (fructose > sucrose > glucose) as do the sweetness recep- tors of the human tongue.
Like insects, many vertebrates have taste receptors on the body. The bottom-dwelling sea robin fish, for example has modified pectoral (anterior) fins with taste receptors at the tips of the fin rays, which it uses to probe the muddy bottom for food. In terrestrial vertebrates, taste receptors are found on the tongue and epiglottis, in the back of the mouth, and in the pharynx and upper esophagus.
In vertebrates, taste receptor cells are located in taste buds, which have some organizational features in common with olfactory organs (Figure 7-20). The taste receptors are surrounded by support cells and by basal cells, which are progenitor cells that give rise to new taste receptors. Basal cells are derived from epithelial cells, and they regularly gen- erate new sensory receptor cells; taste receptor cells live for only about 10 days. This remarkable turnover of primary sensory cells also occurs in vertebrate olfactory organs and in specialized parts, called outer segments, of photorecep- tor cells. All of these cells, or cell parts, that are regularly re- newed directly interact with physical stimuli from outside the organism: taste and smell molecules in gustatory and ol- factory cells, respectively, and photons in photoreceptor outer segments. The turnover of all sensory cells poses a problem for the maintenance of sensory specificity in an or- ganism because, unless the new cells were precisely inte- grated into the existing network, specificity would be lost. Just how the integrity of taste and smell sensations is main- tained remains an unsolved, but actively studied, mystery.
Although our subjective experience would suggest that there is a wonderfully large spectrum of possible tastes, these sensations can be grouped into four distinct qualities: sweet, salt, sour, and bitter. In evolutionary terms, these categories may be related to some basic properties of food. Sweet foods are likely to be rich in calories and thus useful; salt is essen- tial for maintaining water balance (see Chapter 14); a sour taste can signal danger if it is in excess; and many bitter sub- stances are toxic. The discovery that vertebrates respond to only four fundamental categories of tastes suggests that all perceived tastes must depend on various combinations of these fundamental characteristics. In addition, it generated
-the hypothesis that there is a separate, identifiable sensory pathway associated with each of the four tastes.
A Microvilli of apical membrane
\ iaste
Vertebrate taste bud to brain
Nasal ,, cavity
~i r MUCUS layer Pore----1
? Afferent axons
Vertebrate olfactory receptor
Insect olfactory receptor
Figure 7-20 Chemosensory organs typ~cally consist of receptor cells sur- rounded by supporting structures. (A) In vertebrate taste buds, the re- ceptor cells are surrounded by basal cells, which generate new receptor cells, and by supporting cells. Transduction takes place across the apical
membrane. The receptor cells do not themselves send axons to the cen- tral nervous system, although they can produce APs Instead, they synap- tlcally exc~te afferent neurons that carry the ~nforrnat~on to the CNS In contrast, vertebrate (B) and Insect (C) olfactory receptors themselves send primary afferent axons to the CNS. Structures that are analagous be- tween vertebrates and insects are drawn similarly in parts B and C. All
three types of receptors extend fine processes into a mucous layer that covers the epithelium. In insects, these fine processes are true dendrites.
[Part A adapted from Murray and Murray, 1970; part C adapted from
Steinbrecht, 1969.1
How do molecules interact with membranes to pro- duce distinct tastes? In the past few years, the use of patch- clamp recording has allowed the mechanisms responsible for each taste modality to be identified (Figure 7-21). Each individual taste receptor cell reacts to particular stimuli, and each class of taste stimuli activates a distinctive cellular pathway in the receptors that respond to it. Salty
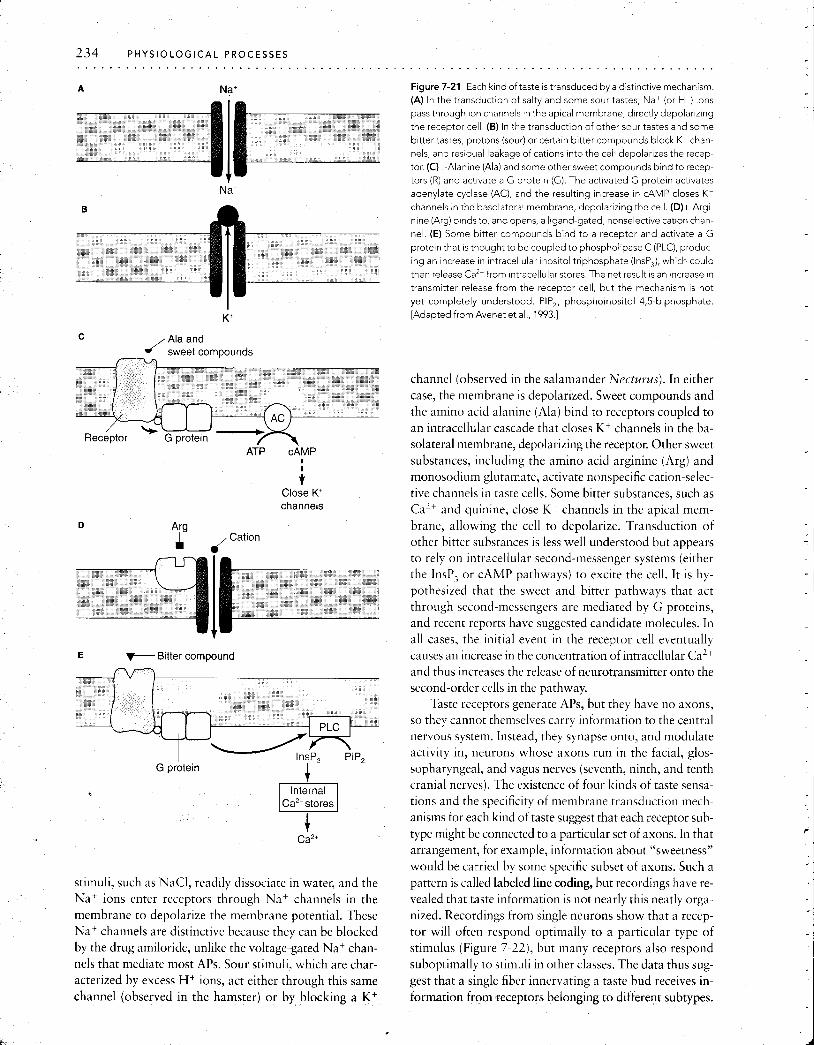
K+
c / Ala and
4' sweet compounds -n
' +%$id-x Receptor
i Close K+ channels
E B~tter compound
n n
G protein
Ca2+ stores
1 Ca2+
s t ~ m u l ~ , such as NaCI, read~ly d~ssociate In water, and the Na+ Ions enter receptors through Na+ channels In the membrane to depolar~ze the membrane potent~al. These Na+ channels are d ~ s t ~ n c t ~ v e because they can be blocked by the drug am~lor~de, unl~ke the voltage-gated Na+ chan- nels that med~ate most APs. Sour s t ~ m u l ~ , w h ~ c h are char- acter~zed by excess H+ Ions, act e~ther through t h ~ s same channel (observed in the hamster) or by blocking a K+
Figure 7-21 Each kind oftaste is transduced by a dist~nct~ve mechanism. (A) In the transduction of salty and some sour tastes, Na+ (or H-) ions pass through ion channels in the apical membrane, directly depolar~z~ng the receptor cell (B) In the transduction of other sour tastes and some
b~tter tastes, protons (sour) or certain bitter compounds block Ki chan- nels, and residual leakage of cations into the cell depolarizes the recep- tor. (C) L-Alan~ne (Ala) and some other sweet compounds bind to recep- tors (R) and actlvate a G protein (G). The activated G protein activates adenylate cyclase (AC), and the resulting increase in cAMP closes K t channels in the basolateral membrane, depolarizing the cell. (D) L-Argi- nine (Arg) binds to, and opens, a ligand-gated, nonselective cation chan- nel. (E) Some bitter compounds bind to a receptor and activate a G protein that IS thought to be coupled to phospholipase C (PLC), produc- ing an Increase In intracellular ~nositol triphosphate (InsP,), which could then release CaZ' from ~ntracellular stores. The net result 1s an increase in transmitter release from the receptor cell, but the mechanism is not yet completely understood. PIP,, phosphoinositol 4.5-biphosphate. [Adapted from Avenet et al., 1993.1
channel (observed in the salamander Nectuuus). In either case, the membrane is depolarized. Sweet compounds and the amino acid alanine (Ala) bind to receptors coupled to an intracellular cascade that closes K+ channels in the ba- solateral membrane, depolarizing the receptor. Other sweet substances, including the amino acid arginine (Arg) and - -
monosodiuin glutamate, activate nonspecific cation-selec- tive channels in taste cells. Some bitter substances, such as Ca2+ and quinine, close K + channels in the apical mem- brane, allowing the cell to depolarize. Transduction of other bitter substances is less well understood but appears to rely on intracellular second-messenger systems (either the InsP; or cAMP pathways) to excite the cell. It is hy- pothesized that the sweet and bitter pathways that act through second-messengers are mediated by G proteins, and recent reports have suggested candidate molecules. In all cases, the initial event in the receptor cell eventually causes an increase in the concentration o f intracellular Ca'+ and thus increases the release of neurotransmitter onto the second-order cells in the pathway.
Taste receptors generate APs, but they have no axons, so they cannot themselves carry information to the central nervous system. Instead, they synapse onto, and modulate activity in, neurons whose axons run in the facial, glos- sopharyngeal, and vagus nerves (seventh, ninth, and tenth cranial nerves). The existence of four kinds of taste sensa- tioils and the specificity of membrane transduction mech- anisms for each kind of taste suggest that each receptor sub- type might be connected to a particular set of axons. In that arrangement, for example, information about "sweetness" would be carried by some specific subset of axons. Such a pattern is called labeled line coding, but recordings have re- vealed that taste information is not nearly this neatly orga- nized. Recordings from single neurons show that a recep- tor will often respond optimally to a particular type of stimulus (Figure 7-22), but many receptors also respond suboptimally to stimuli in other classes. The data thus sug- gest that a single fiber innervating a taste bud receives in- formation fromseceptors belonging to different subtypes.
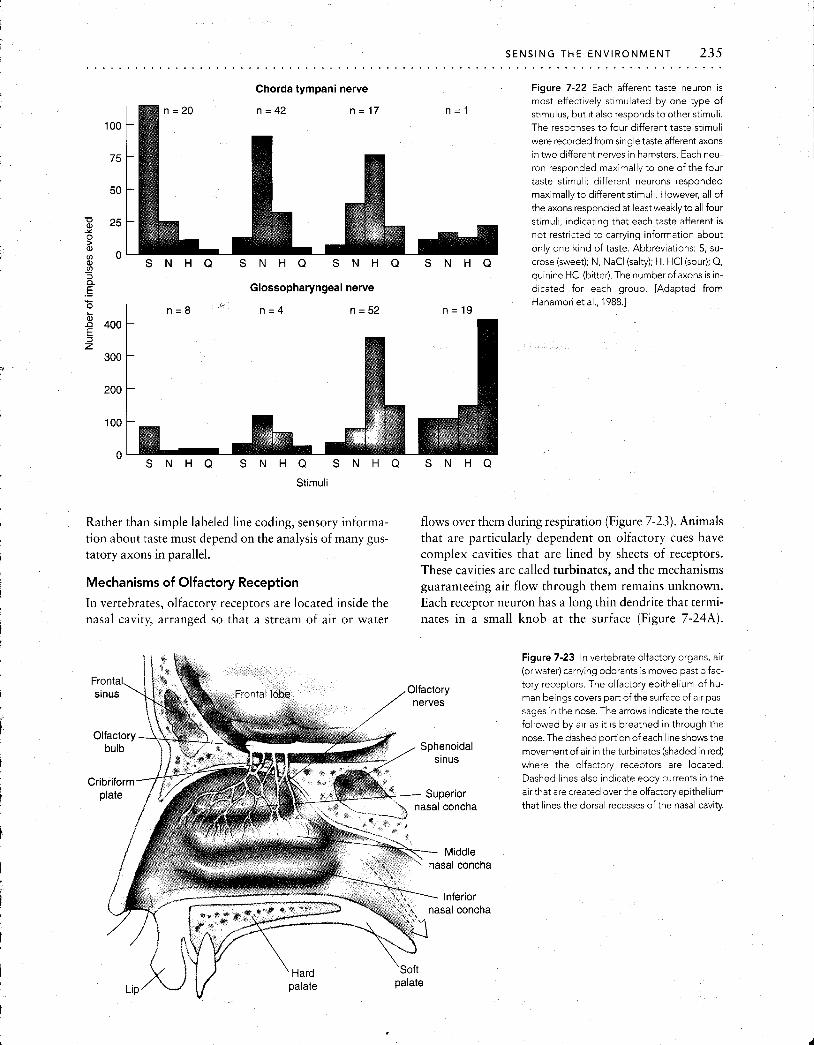
Chorda tympani nerve
m u a, m - S N H Q S N H Q S N H Q - 2
E .- Glossopharyngeal nerve
" S N H Q S N H Q S N H Q
Figure 7-22 Each afferent taste neuron is most effectively stimulated by one type of stimulus, but it also responds to other stimuli. The responses to four different taste stimuli were recorded from sinqle taste afferent axons - in two different nerves in hamsters. Each neu- ron responded maximally to one of the four taste stimuli; different neurons responded maximally to different stimuli. However, all of the axons responded at least weakly to all four stimuli, indicating that each taste afferent is not restricted to carrying information about only one kind of taste. Abbreviations: S, su-
S N H Q crose (sweet), N, NaCl (salty), H, HCI (sour), Q, qulnlne HCI (b~tter) The number of axons IS In- d~cated for each group [Adapted from Hanamor~ et al ,1988 ]
n = 1 9
S N H Q
Stimuli
Rather than simple labeled line coding, sensory informa- flows over them during respiration (Figure 7-23). Animals tion about taste must depend on the analysis of many gus- that are particularly dependent on olfactory cues have tatory axons in parallel. complex cavities that are lined by sheets of receptors.
These cavities are called turbinates, and the mechanisms Mechanisms of Olfactory Reception guaranteeing air flow through them remains unknown. In vertebrates, olfactory receptors are located inside the Each receptor neuron has a long thin dendrite that termi- nasal cavity, arranged so that a stream of air or water nates in a small knob at the surface (Figure 7-24A).
Figure 7-23 In vertebrate olfactory organs, air (or water) carrying odorants is moved past olfac- tory receptors. The olfactory epithelium of hu- man beings covers part of the surface of air pas- sages in the nose. The arrows indicate the route followed by air as it is breathed in through the nose. The dashed portion of each line shows the movement of air in the turbinates (shaded in red)
where the olfactory receptors are located. Dashed lines also indicate eddy currents in the air that are created over the olfactory epithelium that lines the dorsal recesses of the nasal cavity.
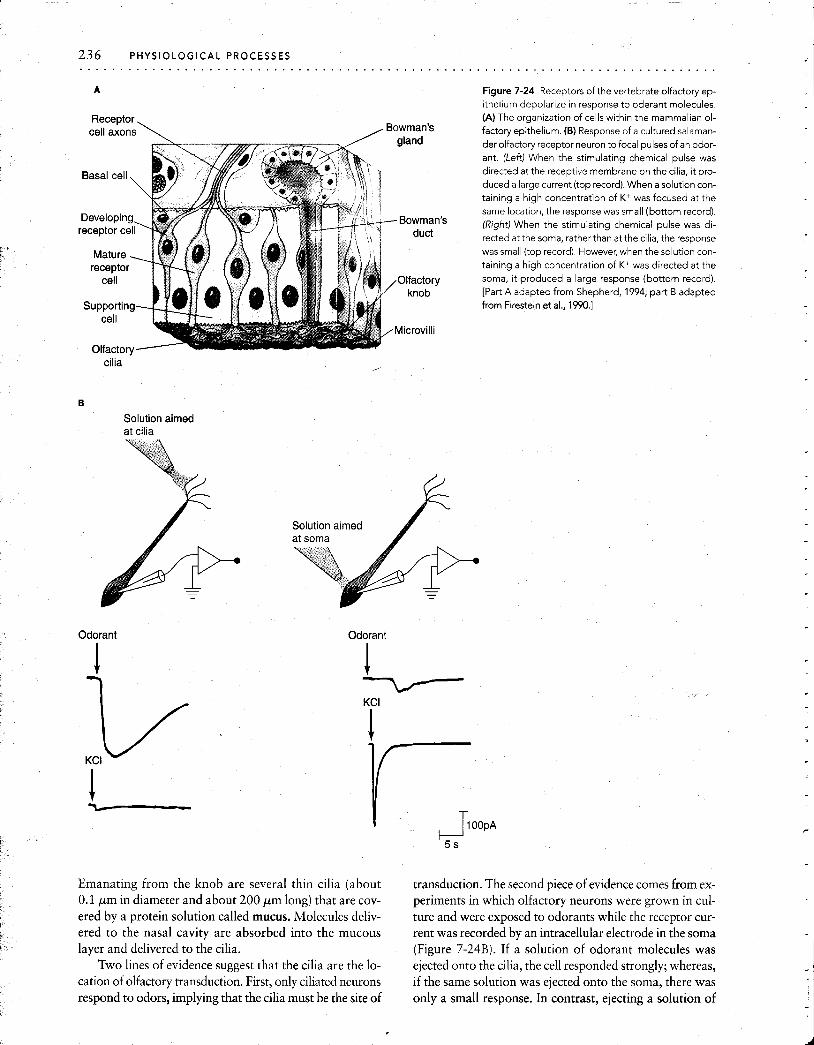
cilia ,
Solution aimed at cilia
Odorant
Figure 7-24 Receptors of the vertebrate olfactory ep- ithelium depolarize in response to oderant molecules. (A) The organization of cells within the mammalian ol- factory epithelium. (B) Response of a cultured salaman-
der olfactory receptor neuron to focal pulses of an odor- ant. (Left) When the stimulating chemical pulse was directed at the receptive membrane on the cilia, it pro- duced a large current (top record). When a solution con- taining a high concentration of K+ was focused at the same location, the response was small (bottom record). (Right) When the stimulating chemical pulse was di- rected at the soma, rather than at the cilia, the response was small (top record). However, when the solution con-
taining a high concentration of K+ was directed at the soma, it produced a large response (bottom record). [Part A adapted from Shepherd, 1994; part B adapted from Firestein et al., 1990.1
Solution aimed at soma
Odorant
Emanating from the knob are several thin cilia (about transduction. The second piece of evidence comes from ex- 0.1 pm in diameter and about 200 pm long) that are cov- periments in which olfactory neurons were grown in cul- ered by a protein solution called mucus. Molecules deliv- ture and were exposed to odorants while the receptor cur- ered to the nasal cavity are absorbed into the mucous rent was recorded by an intracellular electrode in the soma layer and delivered to the cilia. (Figure 7-24B). If a solution of odorant molecules was
Two lines of evidence suggest that the cilia are the lo- ejected onto the cilia, the cell responded strongly; whereas, cation of olfactory transduction. First, only ciliated neurons if the same solution was ejected onto the soma, there was respond to odors, implying that the cilia must be the site of only a small response. In contrast, ejecting a solution of

KC1 (which would depolarize the membrane of the recep- tor) onto the cilia produced a small response, whereas eject- ing KC1 onto the soma produced a large response. These data imply that only the cilia were able to respond to the odorant, causing V,,, to change significantly.
The olfactory transduction cascade includes an ade- nylate cyclase that is linked to a G protein. (See the discus- sion of transduction earlier in the chapter.) A very large family of proteins has recently been found to be expressed only in olfactory epithelial cells. The structure of each pro- tein includes seven transmembrane domains, and other fea- tures also indicate that these molecules are homologous to proteins that mediate other transduction processes. The large size of this family of proteins suggests that there could be many individual receptor subtypes for distinct odors, in
contrast with the small number of receptor types that code for taste.
Olfactory coding in vertebrates has been studied electrically in the olfactory epithelium of the frog (Figure 7-25A) In these experiments, activity of single receptor axons was recorded by one electrode while the summed potential of large numbers of olfactory recep- tors in the epithelium (the electro-olfactogram, or EOG) were recorded simultaneously by another electrode (Figure 7-25B). Impulses from individual receptors were then superimposed electronically on the electro- olfactogram. This technique permits the activity in a single receptor to be compared with the total response of many receptors when a single odorant, or a combination of odor- ants, is presented.
A Figure 7-25 Olfactory reception can be studled at
I I Flow meter \
I Odors
Moist, cleaned
air
B EOG
Electrode 1 7
Mucous
layer\
Electrode 2/+',~=~
Olfactory cilia
Olfactory cell
L ' - olfactory nerve
the cell and organ level simultaneously in the olfactory epithelium of the frog. (A) Various odorants can be applied to the nasal epithelium while the summed electro-olfactogram (EOG) and spikes from single re- ceptor cells are recorded. The two kinds of records can then be electronically summed to give a compos- ite recording (right). (B) Detail of tissue and elec- trodes. Electrode 1 records the overall EOG potential, because it is far from any one axon, while electrode 2 records the activity of the single axon to which it is closest. [Adapted from Gesteland, 1966.1
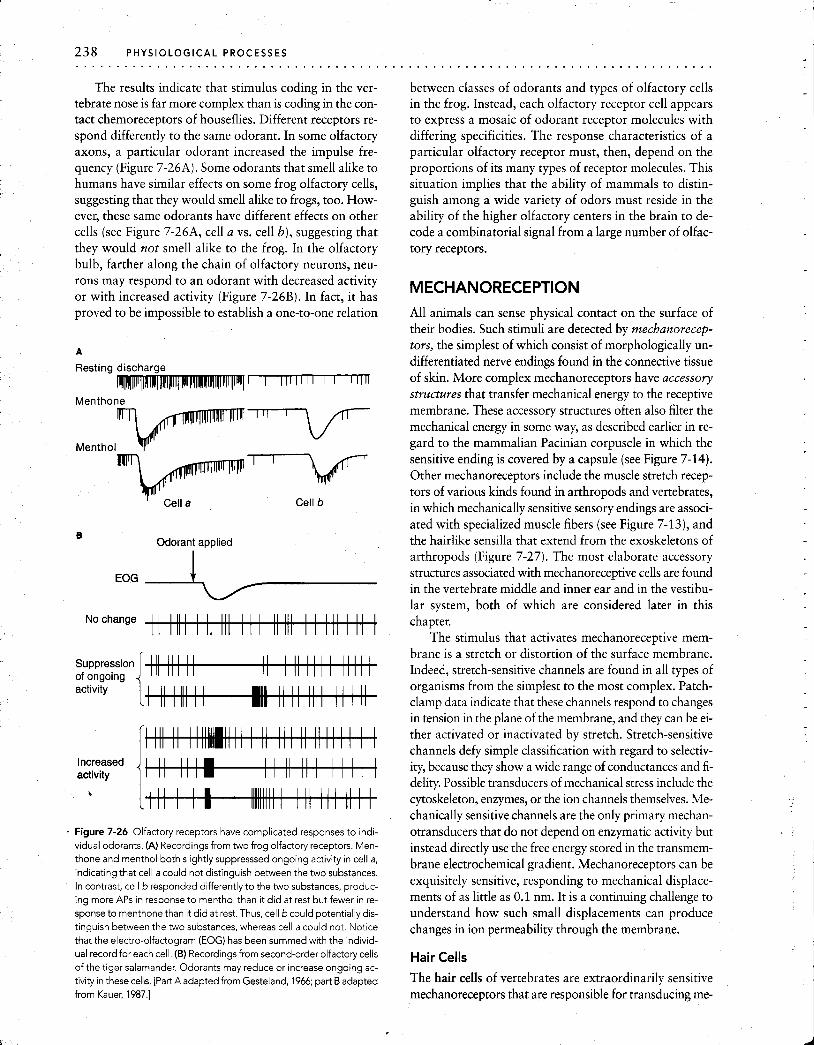
The results indicate that stimulus coding in the ver- tebrate nose is far more complex than is coding in the con- tact chemoreceptors of houseflies. Different receptors re- spond differently to the same odorant. In some olfactory axons, a particular odorant increased the impulse fre- quency (Figure 7-26A). Some odorants that smell alike to humans have similar effects on some frog olfactory cells, suggesting that they would smell alike to frogs, too. How- ever, these same odorants have different effects on other cells (see Figure 7-26A, cell a vs. cell b), suggesting that they would not smell alike to the frog. In the olfactory bulb, farther along the chain of olfactory neurons, neu- rons may respond to an odorant with decreased activity or with increased activity (Figure 7-26B). In fact, it has proved to be impossible to establish a one-to-one relation
Resting discharge - Menthone
Menthol
Cell a Cell b
Odorant applied
Suppression of ongoing
Increased activity I
Figure 7-26 Olfactory receptors have complicated responses to indi- vidual odorants. (A) Recordings from two frog olfactory receptors. Men- thone and menthol both slightly suppresssed ongoing activity in cell a,
indicating that cell a could not distinguish between the two substances. In contrast, cell b responded differently to the two substances, produc- ing more APs in response to menthol than it did at rest but fewer in re- sponse to menthone than it did at rest. Thus, cell b could potentially dis- tinguish between the two substances, whereas cell a could not. Notice that the electro-olfactogram (EOG) has been summed with the individ- ual record for each cell. (B) Recordings from second-order olfactory cells of the tiger salamander. Odorants may reduce or increase ongoing ac- tivity in these cells. [Part A adapted from Gesteland, 1966; part B adapted from Kauer, 1987.1
between classes of odorants and types of olfactory cells in the frog. Instead, each olfactory receptor cell appears to express a mosaic of odorant receptor molecules with differing specificities. The response characteristics of a particular olfactory receptor must, then, depend on the proportions of its many types of receptor molecules. This situation implies that the ability of mammals to distin- guish among a wide variety of odors must reside in the ability of the higher olfactory centers in the brain to de- code a combinatorial signal from a large number of olfac- tory receptors.
MECHANORECEPTION All animals can sense physical contact on the surface of their bodies. Such stimuli are detected by mechanorecep- tors, the simplest of which consist of morphologically un- differentiated nerve endings found in the connective tissue of skin. More complex mechanoreceptors have accessory structures that transfer mechanical energy to the receptive membrane. These accessory structures often also filter the mechanical energy in some way, as described earlier in re- gard to the mammalian Pacinian corpuscle in which the sensitive ending is covered by a capsule (see Figure 7-14). Other mechanoreceptors include the muscle stretch recep- tors of various kinds found in arthropods and vertebrates, in which mechanically sensitive sensory endings are associ- ated with specialized muscle fibers (see Figure 7-13), and the hairlike sensilla that extend from the exoskeletons of arthropods (Figure 7-27). The most elaborate accessory structures associated with mechanoreceptive cells are found in the vertebrate middle and inner ear and in the vestibu- lar system, both of which are considered later in this chapter.
The stimulus that activates mechanoreceptive mem- brane is a stretch or distortion of the surface membrane. Indeed, stretch-sensitive channels are found in all types of organisms from the simplest to the most complex. Patch- clamp data indicate that these channels respond to changes in tension in the plane of the membrane, and they can be ei- ther activated or inactivated by stretch. Stretch-sensitive channels defy simple classification with regard to selectiv- ity, because they show a wide range of conductances and fi- delity. Possible transducers of mechanical stress include the cytoskeleton, enzymes, or the ion channels themselves. Me- chanically sensitive channels are the only primary mechan- otransducers that do not depend on enzymatic activity but instead directly use the free energy stored in the transmem- brane electrochemical gradient. Mechanoreceptors can be exquisitely sensitive, responding to mechanical displace- ments of as little as 0.1 nm. It is a continuing challenge to understand how such small displacements can produce changes in ion permeability through the membrane.
Hair Cells The hair cells of vertebrates are extraordinarily sensitive mechanoreceptors that are responsible for transducing me-
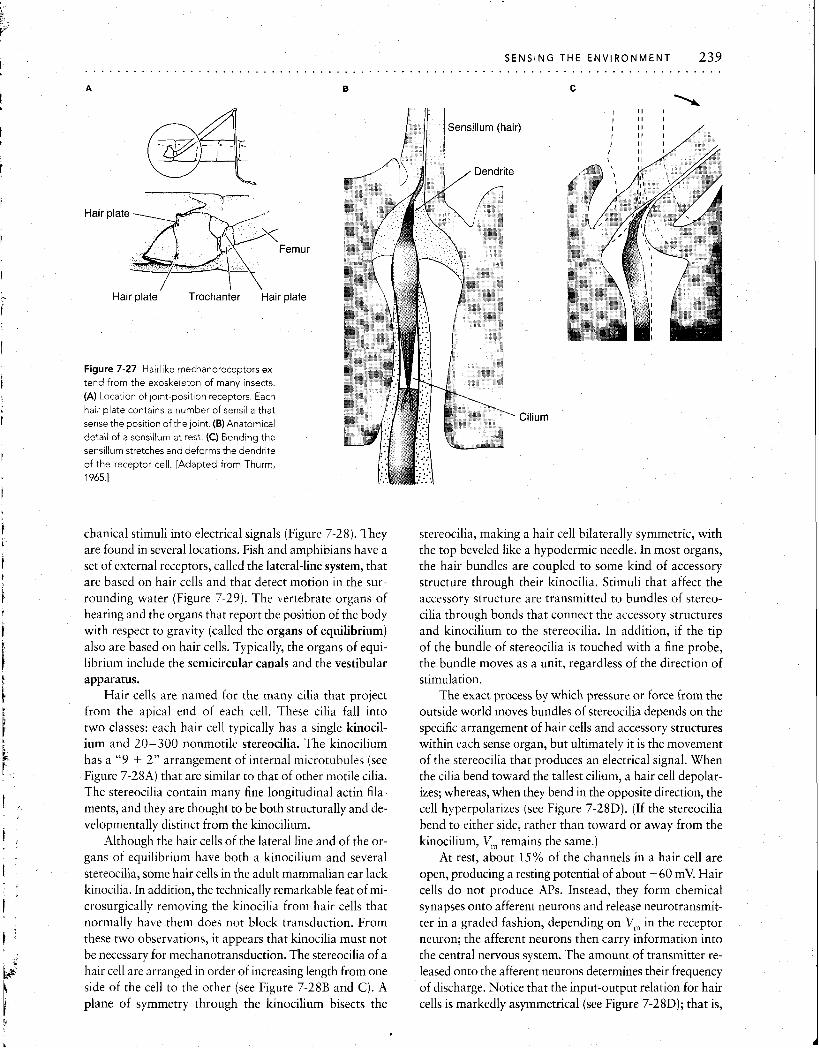
Hair plate
Femur
-/ w ;I- Hair plate' ~ rochanter air plate
Figure 7-27 Hairlike mechanoreceptors ex- tend from the exoskeleton of many insects.
(A) Location of jo~nt-position receptors. Each
hair plate conta~ns a number of sensilla that sense the position of the joint. (B) Anatomical
detail of a sensillum at rest. (C) Bending the sensillum stretches and deforms the dendr~te
of the receptor cell. [Adapted from Thurm, 1965.1
SENSING THE ENVIRONMENT 2 3 9 . . . . . . . . . . . . . . . . . . . . . . . . . . . . . . . . . . . . . . . . . . . . .
chanical stimuli into electrical signals (Figure 7-28). They are found in several locations. Fish and amphibians have a set of external receptors, called the lateral-line system, that are based on hair cells and that detect motion in the sur- rounding water (Figure 7-29). The vertebrate organs of hearing and the organs that report the position of the body with respect to gravity (called the organs of equilibrium) also are based on hair cells. Typically, the organs of equi- librium include the semicircular canals and the vestibular apparatus.
Hair cells are named for the many cilia that project from the apical end of each cell. These cilia fall into two classes: each hair cell typically has a single kinocil- ium and 20-300 nonmotile stereocilia. The kinocilium has a "9 + 2" arrangement of internal microtubules (see Figure 7-28A) that are similar to that of other motile cilia. The stereocilia contain many fine longitudinal actin fila- ments, and they are thought to be both structurally and de- velopmentally distinct from the kinocilium.
Although the hair cells of the lateral line and of the or- gans of equilibrium have both a kinocilium and several stereocilia, some hair cells in the adult mammalian ear lack kinocilia. In addition, the technically remarkable feat of mi- crosurgically removing the kinocilia from hair cells that normally have them does not block transduction. From these two observations, it appears that kinocilia must not be necessary for mechanotransduction. The stereocilia of a hair cell are arranged in order of increasing length from one side of the cell to the other (see Figure 7-28B and C). A plane of symmetry through the kinocilium bisects the
Cilium
stereocilia, making a hair cell bilaterally symmetric, with the top beveled like a hypodermic needle. In most organs, the hair bundles are coupled to some kind of accessory structure through their kinocilia. Stimuli that affect the accessory structure are transmitted to bundles of stereo- cilia through bonds that connect the accessory structures and kinocilium to the stereocilia. In addition, if the tip of the bundle of stereocilia is touched with a fine probe, the bundle moves as a unit, regardless of the direction of stimulation.
The exact process by which pressure or force from the outside world moves bundles of stereocilia depends on the specific arrangement of hair cells and accessory structures within each sense organ, but ultimately it is the movement of the stereocilia that produces an electrical signal. When the cilia bend toward the tallest cilium, a hair cell depolar- izes; whereas, when they bend in the opposite direction, the cell hyperpolarizes (see Figure 7-28D). (If the stereocilia bend to either side, rather than toward or away from the kinocilium, Vm remains the same.)
At rest, about 15% of the channels in a hair cell are open, producing a resting potential of about -60 mV. Hair cells do not produce APs. Instead, they form chemical synapses onto afferent neurons and release neurotransmit- ter in a graded fashion, depending on V, in the receptor neuron; the afferent neurons then carry information into the central nervous system. The amount of transmitter re- leased onto the afferent neurons determines their frequency of discharge. Notice that the input-output relation for hair cells is markedly asymmetrical (see Figure 7-28D); that is,

240 PHYSIOLOGICAL PROCESSES . . . . . . . . . . . . . . . . . . . . . . . . . . . . . . . . . . . . . . . . . . . . . . . . . . . . . . . . . . . . . . . . . . . . . . . . . . . . . . .
-C3 e+ St~mulus movements
l n h ~ b ~ t ~ o n Exc~tation
+ -
lntracellular receptor potent~al
! iLP Nerve ~mpulses
I
Displacement (prn)
Ha~r cell
Efferent synapse Afferent synapse (sensory)

SENSING THE E N V I R O N M E N T 241 . . . . . . . . . . . . . . . . . . . . . . . . . . . . . . . . . . . . . . . .
Figure 7-28 (At left) The membrane potential of hair cell receptors changes when the cilia are moved away from a rest position. (A) Electron micrograph of a cross sect~on through the cilia of a hair cell. The large cil- ium, containing a typical 9 + Zstructure of microtubules, is the kinocil- ium; the others are stereocilia. (B) Scanning electron micrograph show- ing the structure of a hair cell from the neuromast of a giant Danio fish. (C) Diagram of a typical hair cell showing the anatomical relations of the stereocilia and the kinocilium The hair cell releases transmitter onto an af- ferent neuron, which carries the sensory signal t o the central nervous sys- tem. It also receives synapses from efferent neurons. Depending on the direction in which the cilia are bent, the hair cell can either increase or de-
crease the frequency of APs in the afferent fiber. A linear back-and-forth motion applied t o the cilia produces intracellular potential changes that can be recorded with a microelectrode. Extracellular recording from the afferent axon shows APs associated with changes in Vm in the receptor cell. (D) Input-output relation for a hair cell. Note that the depolarization produced by movementtoward the kinocilium is largerthan the hyper-
polarization in response t o movement away from the kinocilium. [PartA from Flock, 1967; part B courtesy of Christopher Braun; part C adapted from Harris and Flock, 1967; part D adapted from Russell, 1980.1
airs embedded
- Figure 7-29 The lateral-line sensory system of fish and amphibians is
based on hair cells. The drawing shows the location of these receptive or- gans along the body of an African clawed frog, Xenopus. The lower dia-
gram shows a cross-section through part of the lateral line, illustrating the cupula, an accessory structure that bends cilia when it is displaced by mo-
tion of the surrounding water. Compare the structure of this organ with
the hair cells shown in Figure 7-28.
the depolarization produced by a given amount of dis- placement toward the tallest cilium is larger than the hy- perpolarization produced by a similar displacement of the cilia in the opposite direction. This asymmetry is important because, when hair cells are subjected to symmetrical vi- brations such as sound waves, changes in the membrane potential can faithfully follow the alternating phases of the stimulus only up to frequencies of several hundred hertz (Hz) but sound frequencies are often much higher than this value. At higher frequencies, the response to the vibrations fuses into a steady depolarization; even if the stimulus dis- places the cilia in both directions by equal amounts away from zero displacement, the hair cell will depolarize. This steady depolarization in response to high frequency stimuli produces steady, rather than modulated, transmitter release by the hair cell and, hence, high frequency firing of the af- ferent neurons. The details of transduction by hair cells are presented later (see Excitation of cochlear hair cells).
Organs of Equilibrium
The simplest organ that has evolved to detect an animal's position with respect to gravity or its acceleration is the statocyst. Forms of this type of organ are found in a num- ber of animal groups, ranging from jellyfish to vertebrates. (Interestingly, insects lack these sense organs and appar- ently depend entirely on other senses, such as vision or joint proprioceptors, for orientational information.) A statocyst consists of a hollow cavity lined with ciliated mechanore- ceptor cells that make contact with a statolith, which can be sand grains, calcareous concretions, or some other rel- atively dense material (Figure 7-30A). The statolith is either taken up from the animal's surroundings or secreted by the epithelium of the statocyst. For example, a lobster loses its statoliths at every molt and replaces them with new grains of sand. In either case, the statolith must have a higher spe- cific gravity than the surrounding fluid.
As the position of the animal changes, the statolith rests on different regions of the statocyst. When a lobster is tilted to the right about its longitudinal axis, the statolith rests on the receptor cells on the right side of the statocyst, stimu- lating them and causlng a tonic discharge in the sensory fibers from the stimulated receptor cells (Figure 7-30B). Recordings from many different fibers of a statocyst reveal that each cell fires maximally in response to a certain ori- entation of the lobster (Figure 7-30C). Information from these receptors travels to the central nervous system and sets up reflex movements of the appendages. This pattern of information processing was confirmed in a clever exper- iment in which molting lobsters were presented with iron filings, rather than with sand. They replaced their statoliths with iron filings, allowing the position of the iron statolith to be manipulated by a magnet. As the magnet was moved through space, pulling on the iron statolith, the lobster- whose position with respect to gravity had not changed- produced a series of compensatory postural responses.

242 P H Y S I O L O G I C A L PROCESSES . . . . . . . . . . . . . . . . . . . . . . . . . . . . . . . . . . . . . . . . . . . . . . . . . . . . . . . . . . . . . . . . . . . . . . . . . . . . . . .
nule
C
0 20 40 60 Degrees
Figure 7-30 Statocysts sense accelerat~on and the pos~t~on of an an~rnal w~th respectto grav~ty (A) Structure of a statocyst In a lobster Astatol~th rests on the receptor part of an array of ha~r cells (B) Act~on potent~als recorded from ~nd~v~dually d~ssected nerve f~bers wh~le the lobster was tllted Each recording shown here was made from a d~fferent f~ber The
The Vertebrate Ear
The ears of vertebrates perform two sensory functions, each of which is based on the activity of hair cells. Some structures of the ear, the organs of equilibrium, perform like the statocysts of invertebrates, reporting on the animal's po- sition with respect to gravity and acceleration through space. Other structures, the organs of hearing, provide in- formation about vibrational stimuli in the environment- stimuli that are called sound if they fall within a particular frequency range.
Vertebrate organs of equilibrium In vertebrates, the organs of equilibrium reside in a mem- branous labyrinth that develops from the anterior end of the lateral-line system. It consists of two chambers, the sac- culus and the utriculus, that are surrounded by bone and filled with endolymph, a specialized fluid. Endolymph dif- fers from most extracellular fluids because it is high in K+ (about 150 mM in human beings) and low in Na+ (about 1 mM in human beings); the significance of this unusual composition is considered in the section titled The mam- malian ear. The utriculus gives rise to the three semicircular canals of the inner ear, which lie in three mutually perpen- dicular planes (Figure 7-31). Hair cells in the three orthog- onal semicircular canals detect acceleration of the head. As the head is accelerated in one of the planes of the canals, the inertia of the endolymphatic fluid in the corresponding canal ~roduces a relative motion of the endolymph past a gelatinous projection, the cupula, which moves the cupula. When the cupula moves with respect to the cilia of the hair cells at its base, V, of the hair cells changes. All hair cells in the canal are oriented with the klnocilium on the same side, so all hair cells attached to the cupula are excited when the
trace below each recording indicates the time course of the tilt and the angle to which the animal was tilted. (C) Frequencies of APs recorded from different fibers plotted as a function of the position of the animal. Each cell responded with a maximum rate of discharge at a different po- sition. [Adapted from Horridge, 1968.1
fluid moves in one direction and inhibited when it moves in the opposite direction. The orthogonal arrangement of the three canals allows them to detect any movement of the head in three-dimensional space.
Below the semicircular canals, larger bony chambers contain three more patches of hair cells called maculae. Mineralized concretions termed otoliths are associated with the maculae, similar to the statoliths associated with stato- cysts. The otoliths signal position relative to the direction of gravity; in the lower vertebrates, they can also detect vi- brations, such as sound waves, in the surrounding medium. Sensory signals from the semicircular canals are integrated with other sensory input in the brain stem and in the cere- bellum for the control of postural and other motor reflexes.
The mammalian ear Sound in the environment has led to the evolution of hear- ing in many phyla. Hearing allows an animal to detect predators or prey and to estimate their location and dis- tance while they are still relatively far away. Sound also plays an important role in intraspecific acoustic communi- cation, which often requires subtle tuning of both produc- tion and reception. Sound is a mechanical vibration that propagates through air or water, traveling as waves of al- ternating high and low pressure, accompanied by a back- and-forth movement of the medium in the direction of propagation. The nature of sound, particularly the differ- ences in how it is conducted through air and through wa- ter, has set distinct constraints on its detection. The evolu- tion of hearing illustrates many different mechanisms that have evolved to solve the various problems presented by the physical nature of sound. A well-studied example, which we examine here, is the mammalian ear.

SENSING THE ENVIRONMENT 2 4 3 . . . . . . . . . . . . . . . . . . . . . . . . . . . . . . . . . . . . . . . . . . . . . . . . . . . . . . . . . . . . . . . . . . . . . . . . . . . . . . .
Tem~oral bone
. . . . __- -
canals
/ Cochlear nerve (VIII)
Incus I
'External in oval auditory window > ,
Tragus canal Eustachian tube
B
Superior
Endolymphatic r/ duct
Endolymphatic
Scala media ,
I I window \
; Cochlea \ Scala I I vestibuli
, I
C , I I Otoconia I ,
;' ,Gelatinous mass Gelatinous I of cupula layer ; i \ 1
fiber
Figure 7-31 The human auditory organs and organs of equilibrium are ceptors in a semicircular canal are embedded in the gelatinous cupula. located in the ear. (A) The major parts of the ear. (B) The semicircular When fluid moves in the canal, the cupula bends the cilia (left). Particles canals and cochlea. Thestapes has been removed to reveal the oval win- called otoconia rest on the cilia of receptors in the sacculus (one of the dow. The pathway taken by auditory signals is shown by black arrows. At maculae). Changes in the position of the head cause the otoconia to shift the far right, a section has been removed from the cochlea to reveal the posit~on, changing how much the cilia are bent (right). [Parts A and B inner structure. (Figure 7-33 shows this structure in more detail.) (C) De- adapted from Beck, 1971; part C adapted from Williams et al., 1995.1 tailed structure of two parts of the organs of equilibrium. The cilia of re-
External ear, auditory canal, and middle ear The structure of the external ear acts as a funnel that collects sound waves in the air from a large area and concentrates the oscillating air pressure onto a specialized surface, the eardrum or tym- panic membrane. The external structures of the ear-the pinna and tragus-facilitate the collection of sound waves. The shell-like outer structures, and in some species the mo- bility of the shell, can modify the directional sensitivity of the auditory system. In some species, including human be- ings, the acoustical properties of the external ear amplify sound in particular frequency ranges. In addition, the hu- man ear emphasizes the spatial distribution of stimuli by amplifying sounds coming from some directions more than it does sounds from other directions (Figure 7-32).
To be detected, airborne vibrations must be transmitted to the fluid-filled inner ear, where the receptor hair cells re- side. The difficulty of communicating across a air-liquid in- terface can be appreciated by trying to talk with someone who is under water. Most of the sound energy generated in air is reflected back from the water's surface, so it is difficult to generate sufficient energy with airborne sounds to move the water at the required frequency and displacement. This kind of situation is called acoustical impedance mismatch. In the ear, this mismatch is partially overcome by a series of three small bones connected in series that are attached to the tympanic membrane at one end and to the oval window of the cochlea at the other. These bones, the auditory ossi- cles (labeled incus, malleus, and stapes in Figure 7-31A),

Figure 7-32 The structure of the human plnna and tragus selectively ampl~f~es spe- clf~cfrequenc~es of sound Thls graph shows
the galn In pressure at the eardrum over what the pressure would be ~f sound Irn-
plnged on the ear canal w ~ t h all external ear structures removed If there were no ampll- f~cat~on, the graph would be a hor~zontal l ~ n e lntersectlng w ~ t h the ordinate at an arnpltfi- cat~on factor of 1 Values above 1 lnd~cate
* # = ampl~f~catlon, values below 1 lndlcate sup- 0.316
- I I I I I I I I I I I I presslon The galn varles as a funct~on of fre-
0.2 0.3 0.4 0.5 0.7 1.0 1.4 2 3 4 5 7 10 12 quency, and sounds emanating from d~ffer-
Frequency (kHz) ent d~rect~ons are ampl~fied d~fferent~ally
Zero degrees 1s stra~ght in front o f the face. [Adapted from Shaw, 1974.1
evolved from the articulation points of the posterlor jaw and are now located in the middle ear. Changes In air pres- sure produced by sound waves in the external auditory canal cause the eardrum to move, whlch transfers the en- ergy first to the ossicles, and then to the structures of the in- ner ear. In the inner ear, the first structure to receive the me- chanical input is the oval window, which forms the outermost surface of a fluld-filled chamber (the cochlea) that contains the receptor hair cells. At the other end of the fluid-filled compartment is another membrane, the round window.
There are two important consequences of this arrange- ment. First, the properties of the mechanical coupling be- tween the eardrum, ossicles, and oval window amplify the signal by about 1.3 times. Second, the pressure of the signal is greatly amplified between the eardrum and the oval win- dow because the eardrum has an area of about 0.6 cm2, whereas the oval wlndow is smaller, about 0.032 cm2. This ratio of about 17: 1 between the areas of the two mem- branes means that the sound pressure onto the typanum is concentrated onto the smaller area of the oval wlndow, producing a much greater pressure, whlch IS important be- cause the inertia of the cochlear fluid on the other side of the oval window is greater than that of alr. The increase in pressure helps to efficiently transfer airborne vibrations to the cochlear fluld. As a consequence of these two mechan- ical features, signals arriving at the eardrum are amplified by at least a factor of 22 by the tlme they reach the cochlea.
Structure and function of the cochlea This mechanically amplified sound input is transduced into neuronal signals by the hair cells of the inner ear. The hair cells of the mam- malian ear are located in the organ of Corti in the cochlea (Figure 7-33). The movement of fluid in the cochlea causes a vibration of the hair cells, which displaces their stere- ocilia; the hair cells, in turn, excite the sensory axons of the auditory nerve. The hair cells in the organ of Corti resem- ble the hair cells of the lateral-line system in lower verte- brates, except that the kinocilium is absent from some cochlear hair cells in adults.
The cochlea, a tapered tube encased in the mastoid bone, is coiled somewhat like the shell of a snail (see
Figure 7-31A and B). It is divided internally into three lon- gitudinal compartments (see Figure 7-33A). The two outer compartments (scala tympani and scala vestibuli) are con- nected by the helicotrema, an opening located at the api- cal end of the cochlea (see Figure 7-35B). The scala tympani and scala vestibuli are filled with an aqueous fluid called the perilymph, which resembles other extracellular fluids in having a relatively high concentration of Na+ (about 140 mM) and a low concentration of K+ (about 7 mM). Between these compartments-and bounded by the basi- lar membrane and Reissner's membrane-is another com- partment, the scala media, which is filled with endolymph (high in K+ and low in Na+), the same type of fluid that sur- rounds the cilia of hair cells in the organs of equilibrium. The unusual ionic composition of endolymph contributes importantly to the process of auditory transduction. The organ of Corti, which bears the hair cells that transduce au- ditory stimuli into sensory signals, lies within the scala me- dia and sits on the basilar membrane, and signal transduc- tion by the cochlear hair cells depends in part on this anatomical arrangement.
Among the vertebrates, only mammals possess a true cochlea, although birds and crocodilians have a nearly straight cochlear duct that contains some of the same fea- tures, including the basilar membrane and the organ of Corti. The other vertebrates have no cochlea. Some of the lower vertebrates are able to detect sound waves through the activity of hair cells associated with the otoliths of the utriculus and sacculus and with the lagena, one of the three maculae in the organs of equilibrium.
The hair cells of the mammalian cochlea encode both the frequency (i.e., the pitch) and the intensity of sound. The adult human cochlea contains four rows of hair cells, one inner and three outer rows, with about 4000 hair cells in each row (see Figure 7-33B). The stereocilia of the hair cells contact the overlying tectorial membrane. The cilia are bent by shearing forces (i.e., a force perpendicular to the axis of the cilia) that arise when the hairs move through the gelatinous mucus that coats the tectorial membrane.
Sound vibrations are transferred by the ossicles to the oval window and then pass through the cochlear fluids and the membranes that separate the cochlear compartments

SENSING THE ENVIRONMENT 245 . . . . . . . . . . . . . . . . . . . . . . . . . . . . . . . . . . . . . . . . . . . . . . . . . . . . . . . . . . . . . . . . . . . . . . . . . . . . . . . A
Reissner's membrane \
Spiral glnnlinn
\Afferent and efferent nerve fibers
U Rods of Corti membrane
Figure 7-33 Sound stimuli are transduced by hair cells in the cochlea. basilar membrane in the central canal. (B) Enlargement of the organ of (A) Cross section through cochlear canal, made at about the location il- Corti. The cilia of the hair cells are embedded in the gelatinous layer of lustrated in Figure 7-31B, showing the two outer chambers (the scala the tectorial membrane, whereas their cell bodies are fixed with respect vestibuli and the scala tympani) and the organ of Corti attached to the to the basilar membrane.
(both Reissner's membrane and the basilar membrane) be- fore their energy is dissipated through the membrane-cov- ered round window. The distensibility of the round and oval windows is an important adaptation because, if the fluid-filled cochlea were encased entirely by solid bone, the displacements of the oval window, the fluid, and the inter- nal tissues would be very small. The distribution of the per- turbations within the cochlea depends on the frequencies of vibrations entering the oval window. To visualize this,
imagine a displacement of the eardrum transferred through the ossicles of the middle ear to the oval window. Vibra- tions displace the incompressible perilymph along the scala vestibuli, through the helicotrema, and back through the scala tympani toward the round window.
Excitation of cochlear hair cells Electrical recordings made at various locations in the cochlea show fluctuations in elec- trical potential that are similar in frequency, phase, and

2 4 6 PHYSIOLOGICAL PROCESSES . . . . . . . . . . . . . . . . . . . . . . . . . . . . . . . . . . . . . . . . .
amplitude to the sound waves that produced them. These cochlear microphonics.result from the summation of re- ceptor currents from the numerous hair cells that were stimulated by movements of the basilar membrane. The ac- tual transduction event occurs when a perturbation of the basilar membrane forces the tips of the stereocilia to bend laterally, because the basilar membrane has moved with re- spect to the tectorial membrane (Figure 7-34). This me- chanical deflection directly causes ion channels in the tips of the stereocilia to open. In the past few years, our under- standing of these events has grown dramatically, although questions still remain about the details of transduction.
The perceptual threshold of cochlear hair cells cor- responds to a deflection of 0.1-1.0 nm, which is equiva- lent to a change in membrane current of only about 1 pA through ion channels in the hair cell membrane. These channels have been experimentally shown to be permeable to many small, monovalent cations (e.g., Li+, Na+, K+, Rb+, and Cs+). When they open in uiuo, K+ ions and some Ca2+ ions enter the cell from the endolymph. (The high concentration of K+ in the endolymph produces a net in- ward driving force on K+, unlike the usual situation in which V, - E, is an outward force. This inward K+ cur- rent depolarizes hair cells, because it adds positive charge to the inside of the cells.)
On the basis of measurements of current flow, it has been estimated that there are about 30-300 channels per bundle of stereocilia, which implies that as few as one to five channels per stereocilium may be responsible for trans- duction. The channels are thought to be opened directly by a mechanical stimulus because, when isolated bundles of stereocilia are abruptly deflected in experiments, the trans- duction current increases with an extremely short latency (about 40 ps). The brevity of this latency period makes it unlikely that an enzymatic or biochemical step is included in this process. This interpretation is reinforced by patch- clamp experiments indicating that the channels open faster when the deflection is larger, again suggesting a direct
Tectorial membrane
hair cells membrane hair cell
Figure 7-34 Movement of the bas~lar membrane w~th respect to the tector~al membrane produces shear on the stereoc~l~a of cochlear ha~r cells The tector~al membrane sl~des over the organ of Cort~, because the tector~al membrane and the bas~lar membrane p~vot about d~fferent
mechanical influence on the conformational states of the channel.
Several factors affect the sensitivity of hair cells. Each hair cell in the cochlea appears to be tuned to a particular band of sound frequency as a result of both mechanical and channel properties. Each cell has a resonance frequency that is determined by the length of the stereocilia in the hair bundle. Cells with long hairs are most sensitive to low- frequency sounds, whereas cells with short hairs are tuned to high-frequency sounds. In addition, each cell responds maximally to a particular frequency of electrical stimula- tion. This electrical resonance frequency is determined by the balance of currents through voltage-gated Ca2+ chan- nels and through Ca2+-sensitive K+ channels in the basal membrane (which is exposed to perilymph).
The outer hair cells of the cochlea may contribute to tuning in the cochlea by modifying the mechanical proper- ties of the organ of Corti. The outer hair cells make-few af- ferent connections, but they receive a large number of ef- ferent synapses. When these cells are stimulated electrically during experiments, they shorten when depolarized and elongate when hyperpolarized. Thus, it is possible that the outer hair cells could modify the mechanical coupling be- tween the inner hair cells and the tectorial membrane, which would change transduction. It remains to be demon- strated that this mechanism actually affects audition.
Hair cells adapt to changes in the position of their stere- ocilia, a process that has been particularly well studied in the bullfrog sacculus. When the cilia of frog hair cells are deflected by a probe and held at the new position, the op- erating range of the cell adapts within milliseconds to this new tonic position, causing the hair cell to then respond to small changes in position away from this new set point. Calcium ions have been shown to play a pivotal role in the process, evidently by modifying the tension in the spring that opens the transduction channels. Finally, efferent input onto a hair cell can decrease the cell's response to sound and broaden its frequency selectivity by opening inhibitory
Hinge point
deflected up
point
polnts when they are d~splaced by waves travel~ng along the cochlea The movements are greatly exaggerated In thls d~agram [Adapted from Dav~s, 1968 ]
SENSING THE ENVIRONMENT 247 . . . . . . . . . . . . . . . . . . . . . . . . . . . . . . . . . . . . . .
K+ channels, which short-circuit the cell's electrical reso- nance. Taken togetheq the attributes of the hair cells reveal their exquisite tuning. However all of the adaptations that make hair cells so extremely sensitive also make them highly vulnerable to overstimulation, which can cause rup- ture at the base of the stereocilia. Acoustic trauma can pro- duce permanent hearing loss that is worst at the frequencies of sound that actually damaged the hair cells. Although some cold-blooded vertebrates can recover from such trauma, the loss is permanent in mammals.
The receptor currents of the hair cells faithfully trans- duce the movements of the basilar membrane over the whole spectrum of audible sound frequencies. The cells transmit their excitation through chemical synapses onto sensory axons of auditory neurons that have cell bodies located in the spiral ganglion. Release of neurotransmitter by the hair cells modulates the firing rate of these axons, which travel in the uestibulocochlear (eighth cranial) nerve and synapse onto neurons in the cochlear nucleus. In fact, the hair cells in the inner row receive about 90% of the contacts made by neurons of the spiral ganglion, suggest- ing that the inner row of cells is largely responsible for detecting sound. In contrast, hair cells of the outer three rows receive many efferent synapses and may participate in modulating the sensitivity of the cochlea by changing the mechanical relation between the basilar and tectorial membranes.
Frequency analysis by the cochlea Pioneering studies of the exposed cochlea, carried out by Georg von Btktsy, greatly enhanced our understanding of how the auditory system can encode information about the frequency of stimuli. His studies showed that:
1. In response to a pure sine wave tone, the perturbations of the basilar membrane have the same frequency as the tone.
2. Low frequency perturbations move as a traveling wave along the whole length of the basilar membrane.
3. The location where the basilar membrane is displaced maximally by a tone is a function of the frequency of the tone. High frequencies displace only the initial parts of the membrane, whereas low frequencies dis- place more distant parts.
Thus, each point along the basilar membrane is displaced most effectively by some unique frequency, and that point
varies in an orderly fashion with higher frequencies dis- placing the basilar membrane close to the oval window and lower frequencies displacing the basilar membrane farthest from the oval window. For sounds up to about 1 kHz, APs in the auditory sensory axons appear to follow the funda- mental frequency. Above this level, the time constant of the hair cells and the electrical properties of the axons in the au- ditory nerve prevent a one-to-one correspondence between sound waves and electrical signals. In this higher frequency range, some other mechanism must inform the central ner- vous system of the sound frequency.
Hermann von Helmholtz noted in 1867 that the basi- lar membrane consists of many transverse bands that in- crease gradually in length from the proximal end to the api- cal end of the basilar membrane (from about 100 pm long at the base to about 500 pm long at the apex), which re- minded him of the strings of a piano and led him to pro- pose his resonance theory. He proposed that various loca- tions along the basilar membrane vibrate in resonance with a specific tonal frequency while the other locations remain stationary, just as the appropriate string of a piano res- onates in response to a tone from a tuning fork. This theory was later challenged by von Btktsy (1960), who found that the movements of the basilar membrane are not standing waves, as Helmholtz suggested, but consist in- stead of traveling waves that move from the narrow base of the basilar membrane toward the wider apical end (Figure 7-35). These waves have the same frequency as the sound entering the ear, but they move much more slowly than sound moves through air.
A familiar example of a traveling wave can be seen by moving the free end of a rope that is secured at the other end. Unlike a rope, however, the basilar membrane has me- chanical properties that change along its length. The com- pliance of the membrane (the amount that the membrane will stretch in response to a given amount of force) increases from its narrow end to its broad end, which causes the am- plitude of a traveling wave to change along the length of the membrane (see Figure 7-35). The position along the cochlea at which the displacement of the basilar membrane is max- imal-causing the hair cells at that location to be stimu- lated maximally-depends on the frequency of the travel- ing waves and consequently on the frequency of the stimulating sound. The traveling waves produce maximum displacements near the basal end of the cochlea when the stimulating sound has a high frequency. The region of max- imal displacement moves along the basilar membrane to- ward the apex as the frequency of the sound drops. The ex- tent of membrane displacement at any point along the basilar membrane determines how strongly the hair cells are stimulated, so it also determines the rate of discharge in sen- sory fibers arising from different parts of the basilar mem- brane. Even at maximum amplitude, all of the movements are very tiny: the loudest sounds produce displacements of the basilar membrane of only about 1 pm. The movement of the hair cell cilia is much smaller, and the threshold of stimulus detection is at the lirmt of the thermal noise.
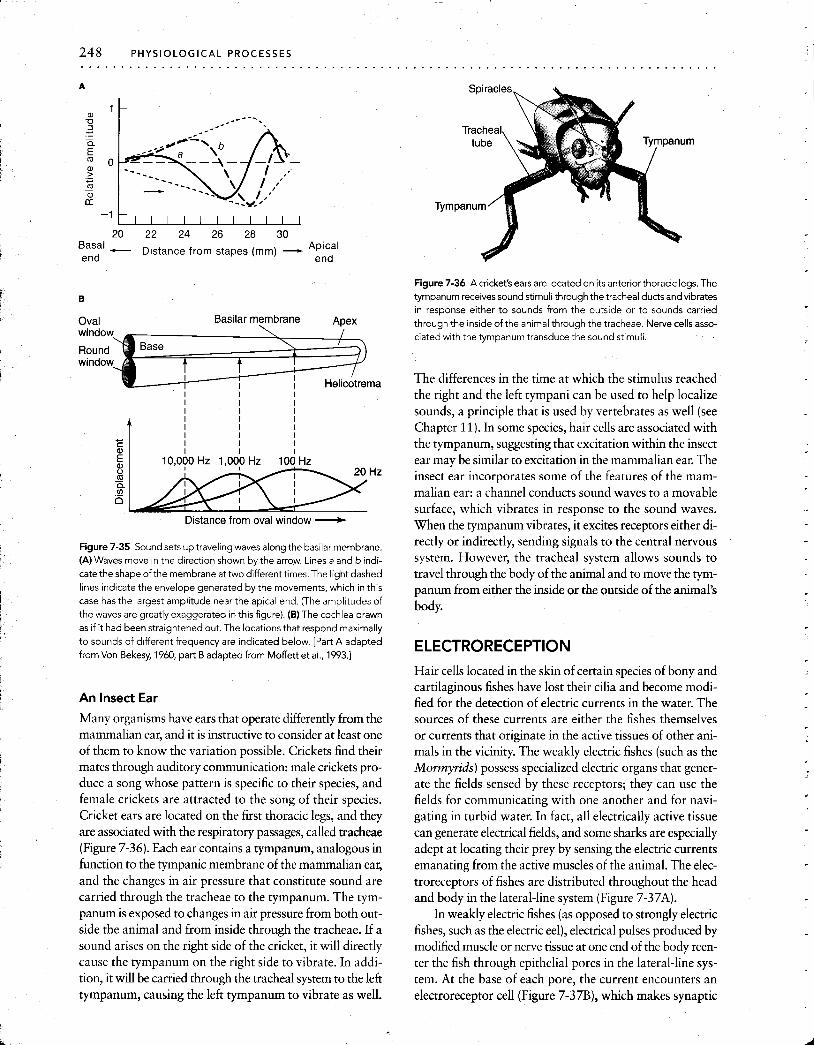
20 22 24 26 28 30 Basal -
Distance from stapes (rnm) - Apical end end
Oval Basilar membrane Apex
Distance from oval window
Figure 7-35 Sound sets up traveling waves along the basilar membrane. (A) Waves move in the direction shown by the arrow. Lines a and b indi- cate the shape of the membrane attwo differenttimes. The light dashed
lines indicate the envelope generated by the movements, which in this case has the largest amplitude near the apical end. (The amplitudes of the waves are greatly exaggerated in this figure). (B) The cochlea drawn as if it had been straightened out. The locations that respond maximally
to sounds of d~fferent frequency are indicated below. [Part A adapted
from Von Bekesy, 1960; part B adapted from Moffett et al., 1993.1
An Insect Ear
Many organisms have ears that operate differently from the mammalian ear, and it is instructive to consider at least one of them to know the variation possible. Crickets find their mates through auditory communication: male crickets pro- duce a song whose pattern is specific to their species, and female crickets are attracted to the song of their species. Cricket ears are located on the first thoracic legs, and they are associated with the respiratory passages, called tracheae (Figure 7-36). Each ear contains a tympanum, analogous in function to the tympanic membrane of the mammalian ear, and the changes in air pressure that constitute sound are carried through the tracheae to the tympanum. The tym- . -
panum is exposed to changes in air pressure from both out- side the animal and from inside through the tracheae. If a sound arises on the right side of the cricket, it will directly cause the tympanum on the right side to vibrate. In addi- tion, it will be carried through the tracheal system to the left tympanum, causing the left tympanum to vibrate as well.
Figure 7-36 A cricket's ears are located on its anterior thoracic legs. The tympanum receives sound stimuli through the tracheal ducts and vibrates in response either to sounds from the outside or to sounds carried through the inside of the animal through the tracheae. Nerve cells asso- ciated with the tympanum transduce the sound stimuli.
The differences in the time at which the stimulus reached the right and the left tympani can be used to help localize sounds, a principle that is used by vertebrates as well (see Chapter 11). In some species, hair cells are associated with the tympanum, suggesting that excitation within the insect ear may be similar to excitation in the mammalian ear. The insect ear incorporates some of the features of the mam- malian ear: a channel conducts sound waves to a movable surface, which vibrates in response to the sound waves. When the tympanum vibrates, it excites receptors either di- rectly or indirectly, sending signals to the central nervous system. However, the tracheal system allows sounds to travel through the body of the animal and to move the tym- panum from either the inside or the outside of the animal's body.
ELECTRORECEPTION Hair cells located in the skin of certain species of bony and cartilaginous fishes have lost their cilia and become modi- fied for the detection of electric currents in the water. The sources of these currents are either the fishes themselves or currents that originate in the active tissues of other ani- mals in the vicinity. The weakly electric fishes (such as the Mormyrids) possess specialized electric organs that gener- ate the fields sensed by these receptors; they can use the fields for communicating with one another and for navi- gating in turbid water. In fact, all electrically active tissue can generate electrical fields, and some sharks are especially adept at locating their prey by sensing the electric currents emanating from the active muscles of the animal. The elec- troreceptors of fishes are distributed throughout the head and body in the lateral-line system (Figure 7-3712).
In weakly electric fishes (as opposed to strongly electric fishes, such as the electric eel), electrical pulses produced by modified muscle or nerve tissue at one end of the body reen- ter the fish through epithelial pores in the lateral-line sys- tem. At the base of each pore, the current encounters an electroreceptor cell (Figure 7-37B), which makes synaptic
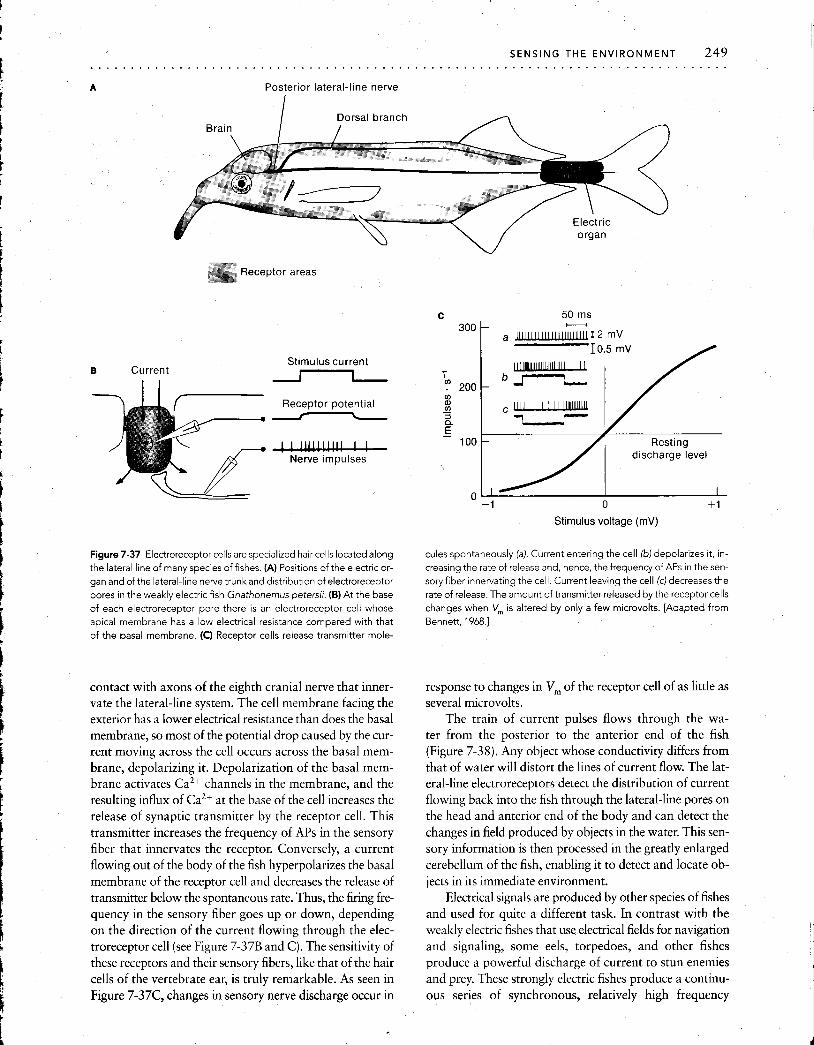
A Posterior lateral-line nerve
orsal branch
B Current
I I
Receptor areas
Stimulus current
Receptor potential - Nerve impulses
Figure 7-37 Electroreceptor cells are specialized hair cells located along the lateral line of many species of fishes. (A) Positions of the electric or- gan and of the lateral-line nerve trunk and distribution of electroreceptor pores in the weakly electric fish Gnathonernus peters;;. (B) At the base of each electroreceptor pore there is an electroreceptor cell whose apical membrane has a low electrical resistance compared with that of the basal membrane. (C) Receptor cells release transmitter mole-
contact with axons of the eighth cranial nerve that inner- vate the lateral-line system. The cell membrane facing the exterior has a lower electrical resistance than does the basal membrane, so most of the potential drop caused by the cur- rent moving across the cell occurs across the basal mem- brane, depolarizing it. Depolarization of the basal mem- brane activates Ca2+ channels in the membrane, and the resulting influx of Ca2+ at the base of the cell increases the release of synaptic transmitter by the receptor cell. This transmitter increases the frequency of APs in the sensory fiber that innervates the receptor. Conversely, a current flowing out of the body of the fish hyperpolarizes the basal membrane of the receptor cell and decreases the release of transmitter below the spontaneous rate. Thus, the firing fre- quency in the sensory fiber goes up or down, depending on the direction of the current flowing through the elec- troreceptor cell (see Figure 7-37B and C). The sensitivity of these receptors and their sensory fibers, like that of the hair cells of the vertebrate ear, is truly remarkable. As seen in Figure 7-37C, changes in sensory nerve discharge occur in
Y - Resting
discharge level
" -1 0 +1
Stimulus voltage (mV)
cules spontaneously (a) Current enter~ng the cell (b) depolar~zes ~t, In- creasing the rate of release and, hence, the frequency of APs In the sen- sory f~ber ~nnervatlng the cell Current leav~ng the cell (c) decreases the rate of release The amount of transm~tter released by the receptor cells changes when V,,, IS altered by only a few m~crovolts [Adapted from Bennett, 1968 ]
response to changes in V, of the receptor cell of as little as several microvolts.
The train of current pulses flows through the wa- ter from the posterior to the anterior end of the fish (Figure 7-38). Any object whose conductivity differs from that of water will distort the lines of current flow. The lat- eral-line electroreceptors detect the distribution of current flowing back into the fish through the lateral-line pores on the head and anterior end of the body and can detect the changes in field produced by objects in the water. This sen- sory information is then processed in the greatly enlarged cerebellum of the fish, enabling it to detect and locate ob- jects in its immediate environment.
Electrical signals are produced by other species of fishes and used for quite a different task. In contrast with the weakly electric fishes that use electrical fields for navigation and signaling, some eels, torpedoes, and other fishes produce a powerful discharge of current to stun enemies and prey. These strongly electric fishes produce a continu- ous series of synchronous, relatively high frequency

250 PHYSIOLOGICAL PROCESSES . . . . . . . . . . . . . . . . . . . . . . . . . . . . . . . . . . . . . . . . . . . . . . . . . . . . . . . . . . . . . . . . . . . . . . . . . . . . . . .
Figure 7-38 Electroreception allows electric fishes to recognize and to locate objects In their environment. An object that has a conductivity greater than that of water deflects current toward the axls of flow. An object whose conductivity is lower than that of water (inset) diverts the current away from the axis of flow. [From "Electric Location by Fishes," by H. W. Lissman. Copyright 0 1963 by Scientific American, Inc. All rights resewed.]
Lateral-line system
depolarizations with their electric organs, and the way in tions, and the endings appear to detect changes in tissue which the electrical discharges of these fishes are generated temperature, rather than the radiant energy itself. The and used resembles the way in which muscles are con- mechanisms by which temperature changes can alter re- trolled to produce movement (see Chapter 10). ceptor output are not known. The sensory axons from the
pit organs of the rattlesnake increase their firing rate tran-
THERMORECEPTION Temperature is an important environmental variable, and many organisms acquire sensory information about tem- perature from the action of specialized nerve endings, or thermoreceptors, in the skin. Higher-order neurons re- ceive input from thermoreceptors and contribute to the mechanisms that regulate the temperature of the body (see Chapter 16). In addition, some of the neurons in the hypo- thalamus of vertebrates are able to detect changes in body temperature.
Temperature receptors can be remarkably sensitive. The infrared (radiant heat) detectors in the facial pits of rat- tlesnakes provide an example (Figure 7-3912). The receptor membrane consists of the branched endings of sensory nerve fibers, with no readily apparent structural specializa-
siently when the temperature inside the pit increases as lit- tle as 0.002"C, and this change in receptor firing rate can modify behavior. For example, a rattlesnake can detect the radiant heat emitted by a mouse that is 40 cm away if the body temperature of the mouse is at least 10°C above the ambient temperature. Furthermore, the temperature recep- tors lie deep within the facial pits, and this arrangement al- lows the snake to detect the direction of a source of radiant heat (Figure 7-39B).
Both the external skin and the upper surface of the - -
tongue of mammals contain two kinds of thermoreceptors: those that increase their firing when the skin is warmed ("warmth" receptors) and those that increase their firing when the skin is cooled ("cold" receptors). These receptors, too, are quite sensitive. Human beings can detect a change in skin temperature of as little as O.Ol°C. The two cate-

SENSING THE ENVIRONMENT 251 . . . . . . . . . . . . . . . . . . . . . . . . . . . . . . . . . . . . . .
A
0 Cold Outer
chamber Membrane
\
Temperature (OC)
1n6er ~rdnnch of chamber trigeminal nerve
B Object in front
stimulates both pits
Figure 7-39 The facial pits of rattlesnakes contain extremely sensi- tive thermoreceptors. (A) Structure of a facial pit in the rattlesnake Crotalus viridis. (B) The position of the facial pits makes thermoreception by the pit organs directionally sensitive. [Adapted from Bullock and Diecke, 1956.1
gories of thermoreceptors are distinguished from one an- other in accord with how they respond to temperature changes near the normal temperature of the human body (about 37°C). Both warmth and cold receptors increase their firing rate as the temperature becomes increasingly dif- ferent from 30"-35°C (Figure 7-40A): warmth receptors fire faster as the temperature gets warmer; cold receptors fire faster as the temperature gets colder. However, when the temperature becomes sufficiently different from
Time (s)
Figure 7-40 The frequency of APs in mammalian thermoreceptors varies with temperature at the surface of the body. (A) The steady-state firing rate of cold and warmth receptors that arborize in the surface of a mammal's tongue. (B) Time course of a cold receptor's response when the tongue was f~rst cooled and then rewarmed as shown In black. [After Zotterman, 1959.1
30"-3S°C, this pattern changes for both kinds of receptors, and the frequency of APs drops (see Figure 7-40A). The re- sponse of the thermoreceptors consists of a large transient change in firing rate, followed by a longer-lasting, steady- state phase. The transient phase is an accurate response to any change in temperature (Figure 7-40B), even though the steady-state phase behaves as shown in Figure 7-40A.
VISION
Since the Earth formed more than 5 billion years ago, sun- light has been an extremely potent selective force in the evo- lution of living organisms, and most organisms are able to respond to light in some way. Photoreception consists of transducing photons of light into electrical signals that can be interpreted by the nervous system, and photoreceptive organs-typically called eyes-have evolved into many shapes and sizes and with many distinct designs. Interest- ingly, although the physical structure of eyes varies greatly among species, visual transduction is based upon a very highly conserved set of protein molecules that provide an optical pathway leading light to the photoreceptive surface and that capture photons within the photoreceptors.
This conservation of visual molecules suggests that, when suitable biochemical means had evolved to solve the

252 PHYSIOLOGICAL PROCESSES . . . . . . . . . . . . . . . . . . . . . . . . . . . . . . . . . . . . . . . . . . . . . . . . . . . . . . . . . . . . . . . . . . . . . . . . . . . .
problem of capturing light's energy, the sequences were conserved even though they were packaged into organs with highly diverse structural properties. For example, the opsins are protein visual pigment molecules. Each molecule includes seven transmembrane domains. Opsins are cou- pled to photopigment molecules, which are structurally al- tered by the absorption of photons and which in turn mod- ify the properties of the opsin protein (see Figure 7-3). Opsins are found widely in the animal kingdom, even in photoreceptive structures that are extremely simple and that lack the features that would constitute an eye. In many organisms, the structure of the eye has evolved to collect and focus incident light rays before they arrive at the site of transduction. Eyes refract light through highly concen- trated soluble proteins that are formed into lenses, and these refractive structures also have an interesting evolu- tionary history. We first consider how eyes collect and fo- cus light.
Optic Mechanisms: Evolution and Function
The physics of light tightly constrains the structure of an eye that will produce a usable image. Most of the possible designs have been "discovered" in the course of evolution, giving rise to similar structures in unrelated animals. One of the most well known examples of convergent evolution is the similarity of eyes in the phylogenetically unrelated squid and fishes. These eyes are similar in many details be- cause optical laws have dictated convergent solutions to the problem of seeing under water. In contrast, the eyes of hu- man beings and fishes are similar because they share com-
mon evolutionary descent, although they differ to some ex- tent because the two species live in different optical media.
The evolution of eyes has proceeded in two stages. Vir- tually all major animal groups have evolved simple eyespots consisting of a few receptors in an open cup of screening pigment cells (Figure 7-41A). Some biologists estimate that such photon detectors have evolved independently between 40 and 65 times. Eyespots provide information about the surrounding distribution oflight and dark, but they do not provide enough information to allow detection of either predators or prey. For pattern recognition or for controlling locomotion, animals need an eye with an optical system that can restrict the acceptance angle of individual receptors and form some kind of image. This stage of optical evolution happened less frequently, occurring in only 6 of the 33 meta- zoan phyla (Cnidaria, Mollusca, Annelida, Onychophora, Arthopoda, and Chordata). Because these phyla contain about 96% of all extant species, it is tempting to speculate that having eyes confers significant selective benefits.
Ten optically distinct designs for image-forming eyes have been discovered to date. They include nearly all the possibil- ities known from physical optics except Fresnel and zoom lenses. In addition, there are some variations, such as array optics, that have not been used by physicists studying optics.
Simple eyespots are typically less than 100 pm in di- ameter and contain between 1 and 100 receptors. Even simple eyespots allow some visually guided behavior. In protozoa and flatworms, the direction of a light source is detected with the help of a screening pigment that casts a shadow on the photoreceptors. Some flagellates, for exam-
A C E Figure 7-41 The structures of eyes Incorpo- rate many different optlcal prlnc~ples (A) The slmplest eye conslsts of a shallow open plt llned wlth photoreceptor cells (B) In sllghtly more complicated eyes, the aperture of the eye IS small In proportion to the slze of the eye, and the eye operates slmllarly to a pin- - + 6 hole camera (C) An alternative Improvement allowlng Image format~on IS the addltlon of a refracting element between the aperture and
Shallow pit the layer of photoreceptors (D)Three lenses
Vertebrate arranged In serles Improve the optlcal prop-
eye ertles of the eye In Pontella, a cope-
I ' pod (E) The vertebrate eye IS an elaborat~on of a slmple eye to wh~ch a small aperture and a lens have been added Arrows ~nd~cate pos-
B D slble evolutionary relations among types of eyes [Adapted from Land and Fernald, 1992.1
Pinhole eye Many lenses in series

ple, have a light-sensitive organelle, near the base of the fla- gellum, that is shielded on one side by a pigmented eyespot. This shielded organelle provides a crude, but effective, in- dication of directionality. As the flagellate swims along, it rotates about its longitudinal axis roughly once per second. If it enters a beam of light shining from one side and per- pendicular to its path of locomotion, the eyespot is shaded each time the shielding pigment passes between the source of the light and the photosensitive part of the base of the fla- gellum. Each time this happens, the flagellum moves just enough to turn the flagellate slightly toward the side bear- ing the shielding pigment. The net effect is to, turn the fla- gellate toward the source of the light.
The simplest eyes are improvements on eyespots that have been achieved by reducing the size of the aperture to produce a pinhole eye (Figure 7-41B) or by adding a re- fracting structure (Figure 7-41C). The evolutionarily an- cient cephalopod mollusc Nautilis has a pinhole eye that, except for the absence of a lens, is quite advanced. It is nearly 1 cm in diameter and the aperture is variable, ex- panding from 0.4 to 2.8 mm. In addition, extraocular mus- cles compensate for the rocking motion produced when the animal swims, stabilizing the eye.
Most aquatic animals have a single-chambered eye with a spherical lens (see Figure 7-41C). This type of lens provides the high refractive power needed to focus images under water, but it poses the problem of spherical aberra- tion. The lenses found in fishes and cephalopods avoid this
Compound eye
SENSING THE ENVIRONMENT 253 . . . . . . . . . . . . . . . . . . . . . . . . . . . . . . . . . . . . . .
difficulty because the material of the lens is not homoge- neous. Instead, it is dense with a high refractive index in the center and has a gradient of decreasing density and refrac- tive index toward the periphery. This pattern was first noted in 1877 by Matthiessen, who showed that a conse- quence of the density gradient is a short focal length, about 2.5 times the radius (known as Matthiessen's ratio). This remarkable gradient in density has evolved eight times among aquatic animals, suggesting that it is a very good so- lution and perhaps the simplest. Other aquatic species have eyes with multiple lenses. For example, the eye of the cope- pod Pontella (Figure 7- 4 ID) contains three lenses in series that together correct for spherical aberration.
The vertebrate eye (Figure 7-41E) combines a relatively small aperture with a refractile lens. These two features to- gether provide a very high quality image that is focused on the layer of photoreceptors in the retina, located at the back of the eye.
Compound Eyes
The compound eyes of arthropods are image-forming eyes composed of many units, each of which has the features of the eye shown in Figure 7-41C. Each optic unit, called an ommatidium, is aimed at a different part of the visual field (Figure 7-42A), and each samples an angular cone that takes in about 2-3 degrees of the visual field. In contrast, in the vertebrate eye, each receptor may sample as little as 0.02 degree of the visual field. Because the receptive field of
Figure 7-42 Compound eyes pro- duce mosaic images. (A) In a com- pound eye, each ommatidium sam- ples a different part of the visual field through a separate lens. The image at the right illustrates a mosaic image of a butterfly as it would be perceived by a dragonfly at a distance of 10 cm. (B) In a simple eye, each receptor cell samples part of the field through a lens that is shared by all receptor cells. For comparison, the image at the right illustrates the same butterfly as it would be perceived by a simple verte- brate eye. Arrows indicate that the op- tics of the vertebrate eye invert the im- aqe on the retina, whereas the optics - of the compound eye do not. [Adapted from Kirschfeld, 1971, and Mazokhin-Porshnyakov, 1969.1
Vertebrate eye
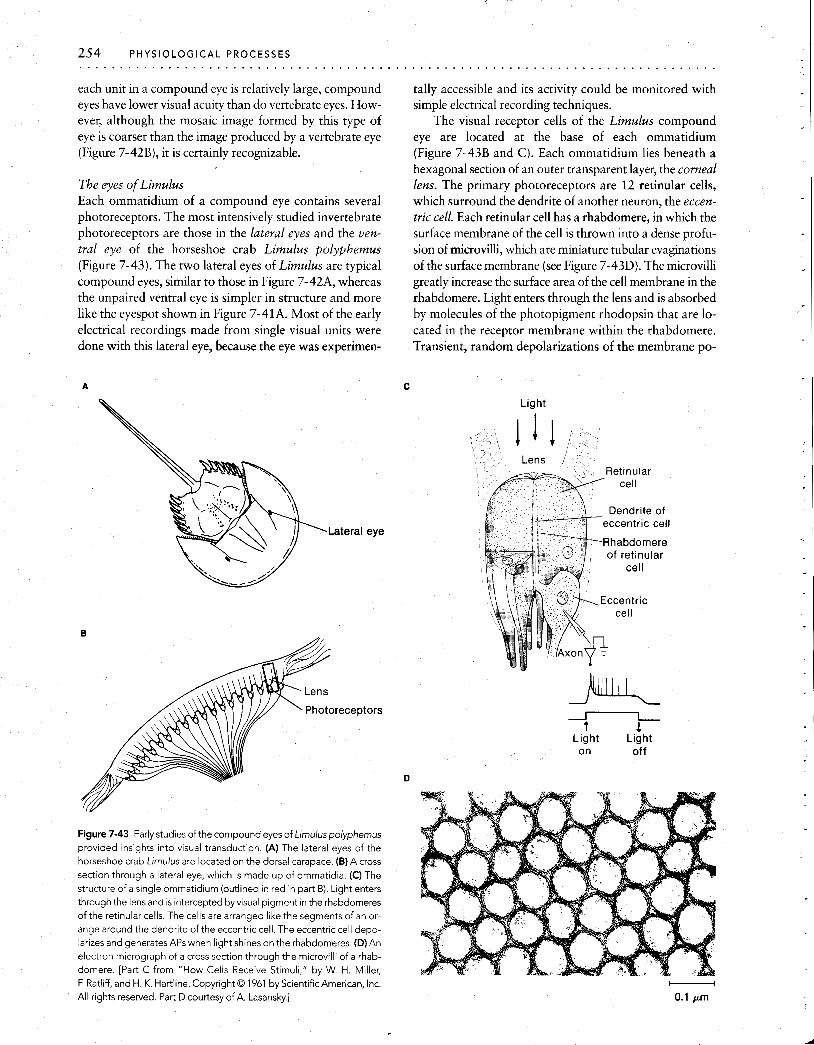
2 5 4 PHYSIOLOGICAL PROCESSES . . . . . . . . . . . . . . . . . . . . . . . . . . . . . . . . . . . . . . .
each unit in a compound eye is relatively large, compound eyes have lower visual acuity than do vertebrate eyes. How- ever, although the mosaic image formed by this type of eye is coarser than the image produced by a vertebrate eye (Figure 7-42B), it is certainly recognizable.
The eyes of Limulus Each ommatidium of a compound eye contains several photoreceptors. The most intensively studied invertebrate photoreceptors are those in the lateral eyes and the ven- tral eye of the horseshoe crab Limulus polyphemus (Figure 7-43). The two lateral eyes of Limulus are typical compound eyes, similar to those in Figure 7-42A, whereas the unpaired ventral eye is simpler in structure and more like the eyespot shown in Figure 7-41A. Most of the early electrical recordings made from single visual units were done with this lateral eye, because the eye was experimen-
tally accessible and its activity could be monitored with simple electrical recording techniques.
The visual receptor cells of the Limulus compound eye are located at the base of each ommatidium (Figure 7-43B and C). Each ommatidium lies beneath a hexagonal section of an outer transparent layer, the corneal lens. The primary photoreceptors are 12 retinular cells, which surround the dendrite of another neuron, the eccen- tric cell. Each retinular cell has a rhabdomere, in which the surface membrane of the cell is thrown into a dense profu- sion of rniaovilli, which are miniature tubular evaginations of the surface membrane (see Figure 7-43D). The microvilli greatly increase the surface area of the cell membrane in the rhabdomere. Light enters through the lens and is absorbed by molecules of the photopigment rhodopsin that are lo- cated in the receptor membrane within the rhabdomere. Transient, random depolarizations of the membrane po-
C
Light
eccentric cell
- t 1
L ~ g h t Light on off
Figure 7-43 Early studies of the compound eyes of Limuluspolyphemus provided Insights into visual transduction. (A) The lateral eyes of the horseshoe crab Limulus are located on the dorsal carapace. (B) A cross section through a lateral eye, which is made up of ommatidia. (C) The structure of a s~ngle ommatidium (outlined in red in part B). Light enters through the lens and is intercepted by visual pigment in the rhabdomeres of the retinular cells. The cells are arranged like the segments of an or- ange around the dendrite of the eccentric cell. The eccentric cell depo- larizes and generates APs when light shines on the rhabdomeres. (D)An electron micrograph of a cross section through the microvilli of a rhab- domere. [Part C from "How Cells Receive Stimuli," by W. H. Miller, F. Ratliff, and H. K. Hartline. Copyright 0 1961 by Scientific American, Inc. All r~ghts resewed. Part D courtesy of A. Lasansky.] 0.1 pm
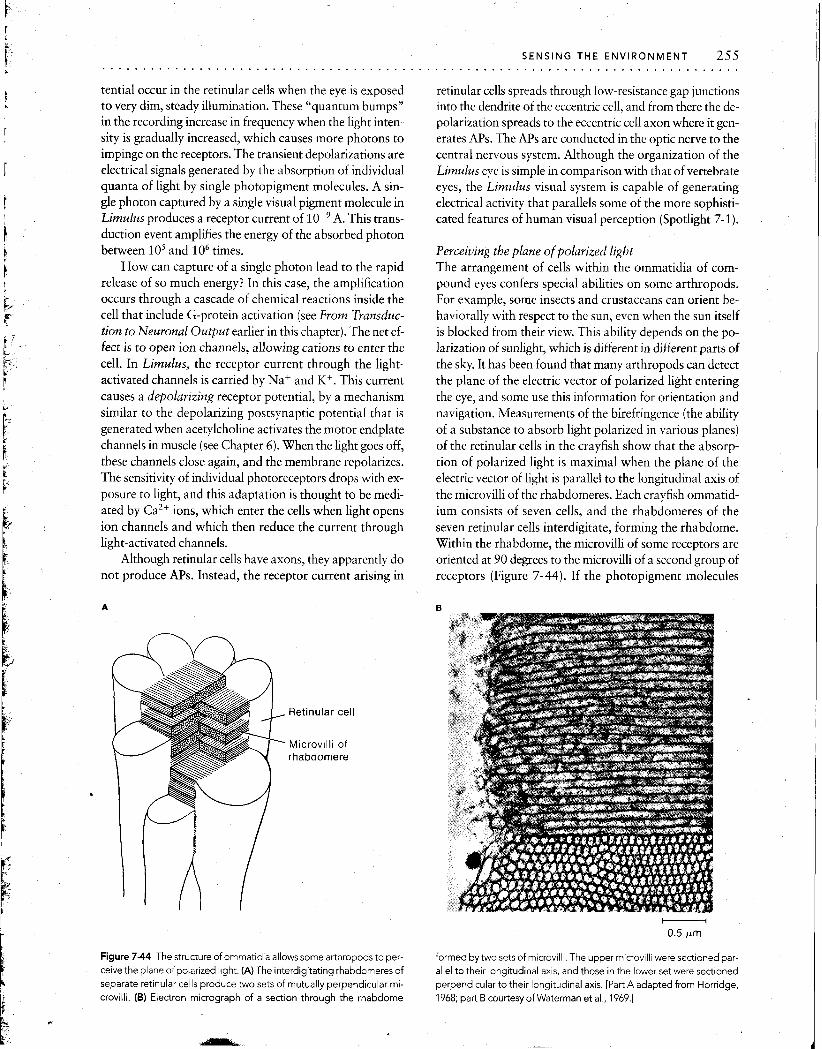
tential occur in the retinular cells when the eye is exposed to very dim, steady illumination. These "quantum bumps" in the recording increase in frequency when the light inten- sity is gradually increased, which causes more photons to impinge on the receptors. The transient depolarizations are electrical signals generated by the absorption of individual quanta of light by single photopigment molecules. A sin- gle photon captured by a single visual pigment molecule in Limulus produces a receptor current of A. This trans- duction event amplifies the energy of the absorbed photon between lo5 and lo6 times.
How can capture of a single photon lead to the rapid release of so much energy? In this case, the amplification occurs through a cascade of chemical reactions inside the cell that include G-protein activation (see From Transduc- tion to Neuronal Output earlier in this chapter). The net ef- fect is to open ion channels, allowing cations to enter the cell. In Limulus, the receptor current through the light- activated channels is carried by Na+ and KC. This current causes a depolarizing receptor potential, by a mechanism similar to the depolarizing postsynaptic potential that is generated when acetylcholine activates the motor endplate channels in muscle (see Chapter 6) . When the light goes off, these channels close again, and the membrane repolarizes. The sensitivity of individual photoreceptors drops with ex- posure to light, and this adaptation is thought to be medi- ated by Ca2+ ions, which enter the cells when light opens ion channels and which then reduce the current through light-activated channels.
Although retinular cells have axons, they apparently do not produce APs. Instead, the receptor current arising in
Retinular cell
Microvilli of rhabdornere
Figure 744 The structure of ommatidia allows some arthropods to per- ceive the plane of polarized light. (A)The interdigitating rhabdomeres of separate retinular cells produce two sets of mutually perpendicular mi- crovilli. (B) Electron micrograph of a section through the rhabdome
SENSING THE ENVIRONMENT 255 . . . . . . . . . . . . . . . . . . . . . . . . . . . . . . . . . . . . . .
retinular cells spreads through low-resistance gap junctions into the dendrite of the eccentric cell, and from there the de- polarization spreads to the eccentric cell axon where it gen- erates APs. The APs are conducted in the optic nerve to the central nervous system. Although the organization of the Limulus eye is simple in comparison with that of vertebrate eyes, the Limulus visual system is capable of generating electrical activity that parallels some of the more sophisti- cated features of human visual perception (Spotlight 7-1).
Perceiving the plane of polarized light The arrangement of cells within the ommatidia of com- pound eyes confers special abilities on some arthropods. For example, some insects and crustaceans can orient be- haviorally with respect to the sun, even when the sun itself is blocked from their view. This ability depends on the po- larization of sunlight, which is different in different parts of the sky. It has been found that many arthropods can detect the plane of the electric vector of polarized light entering the eye, and some use this information for orientation and navigation. Measurements of the birefringence (the ability of a substance to absorb light polarized in various planes) of the retinular cells in the crayfish show that the absorp- tion of polarized light is maximal when the plane of the electric vector of light is parallel to the longitudinal axis of the microvilli of the rhabdomeres. Each crayfish ommatid- ium consists of seven cells, and the rhabdomeres of the seven retinular cells interdigitate, forming the rhabdome. Within the rhabdome, the microvilli of some receptors are oriented at 90 degrees to the microvilli of a second group of receptors (Figure 7-44). If the photopigment molecules
formed by two sets of microvilli. The upper microvilli were sectioned par- allel to their longitudinal axis, and those in the lower set were sectioned perpendicular to their longitudinal axis. [Part A adapted from Horridge, 1968; part B courtesy of Waterman et al., 1969.1
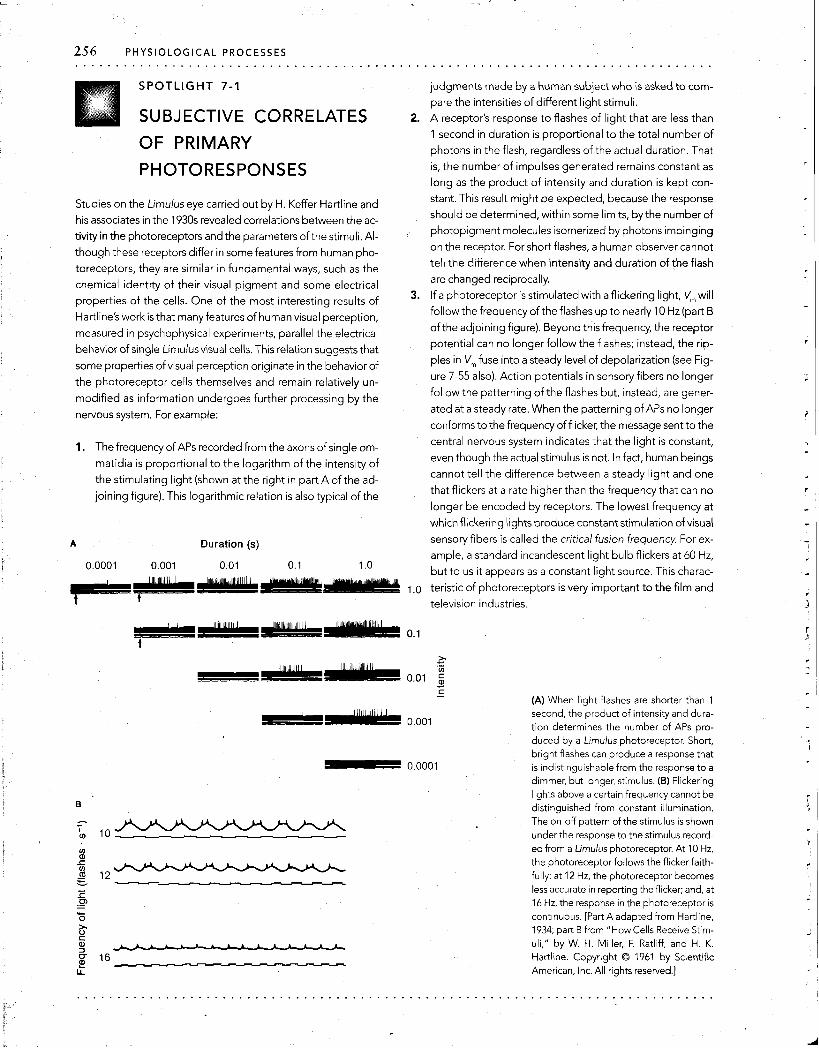
256 PHYSIOLOGICAL PROCESSES . . . . . . . . . . . . . . . . . . . . . . . . . . . . . . . . . . . . . . . . . . . . . . . . . . . . . . . . . . . . . . . . . . . . . . . . . . . . . . .
SPOTLIGHT 7 -1 judgments made by a human subject who IS asked t o com-
pare the lntensltles of different l~gh t stlmuli
SUBJECTIVE CORRELATES 2. A receptor's response t o flashes of 11ght that are less than
OF PRIMARY 1 second In duratlon IS proportional to the total number of
photons In the flash, regardless of the actual duratlon That
PHOTORESPONSES IS, the number of lmpulses generated remalns constant as
long as the product of Intensty and duration IS kept con-
Studles on the L~muluseye carrled out by H Keffer Hartllne and stant Thls result mlght be expected, because the response
h ~ s associates In the 1930s revealed correlations between the ac- should be determined, wlthin some Ilmlts, by the number of
tivlty in the photoreceptors and the parameters ofthe stimuli Al- photoplgment molecules lsomerlzed by photons lmplnglng
though these receptors dlffer In some featuresfrom human pho- on the receptor For short flashes, a human observer cannot
toreceptors, they are slmllar In fundamental ways, such as the tell the dlfference when lntens~ty and duration of the flash
chemlcal Identity of thew vlsual plgment and some electrlcal are changed reciprocally
propertles of the cells One of the most lnterestlng results of 3. If a photoreceptor IS stimulated with a fllckerlng Ilght, V, will
Hartllne's work is that many features of human vlsual perceptlon, follow the frequency of the flashes up to nearly 10 Hz (part B
measured In psychophysical experlments, parallel the electrlcal ofthe adjoining flgure) Beyond this frequency, the receptor
behav~or of slngle Llmulus vlsual cells Thls relat~on suggests that potentlal can no longer follow the flashes, Instead, the rlp-
some propertles of vlsual perceptlon or~glnate In the behavior of ples In V, fuse Into a steady level of depolarizatlon (see Flg-
the photoreceptor cells themselves and remaln relatively un- ure 7-55 also) Actlon potentials In sensory flbers no longer
modlfled as lnformatlon undergoes further processing by the follow the patternlng of the flashes but, Instead, are gener-
nervous system For example. ated at a steady rate When the patternlng of APs no longer
conforms to the frequency of fllcker, the message sent to the
1. The frequency of APs recorded from the axons of slngle om- central nervous system lndlcates that the light IS constant,
matldla is proportional t o the logarithm of the intensity of even though the actual stlmulus IS not In fact, human belngs
the stlmulatlng llght (shown at the rlght in part A of the ad- cannot tell the dlfference between a steady llght and one
jolnlng flgure) Thls logarithmic relatlon 1s also typlcal of the that fllckers at a rate higher than the frequency that can no
longer be encoded by receptors The lowest frequency at
wh~ch fhckerlng l~ghts produce constant stlmulatlon of visual
A Duration (s) sensory flbers IS called the c r~ t~ca l fusion frequency For ex-
ample, a standard Incandescent llght bulb fllckers at 60 Hz, 0 0001 0 001 0 01 0 1 1 0 but to us ~t appears as a constant light source Thls charac-
"dlulk 1 0 teristlc of photoreceptors IS very important t o the film and
televlslon lndustrles
- + c -
(A) When l~ght flashes are shorter than 1
-I"""'lillL 0.001 second, the product of intensity and dura- tion determines the number of APs pro- duced by a Limulus photoreceptor. Short, bright flashes can produce a response that is indistinguishable from the response to a dimmer, but longer, stimulus. (B) Flickering lights above a certain frequency cannot be distinguished from constant illumination. The on-off pattern of the stimulus is shown under the response to the stimulus record- ed from a Limulus photoreceptor. At 10 Hz, the photoreceptor follows the flicker faith- fully; at 12 Hz, the photoreceptor becomes less accurate in reporting the flicker; and, at 16 Hz, the response in the photoreceptor is continuous. [Part A adapted from Hartline, 1934; part B from "How Cells Rece~ve Stim- uli," by W. H. Miller, F. Ratliff, and H. K. Hartline. Copyright O 1961 by Scientific American, Inc. All rights reserved.]
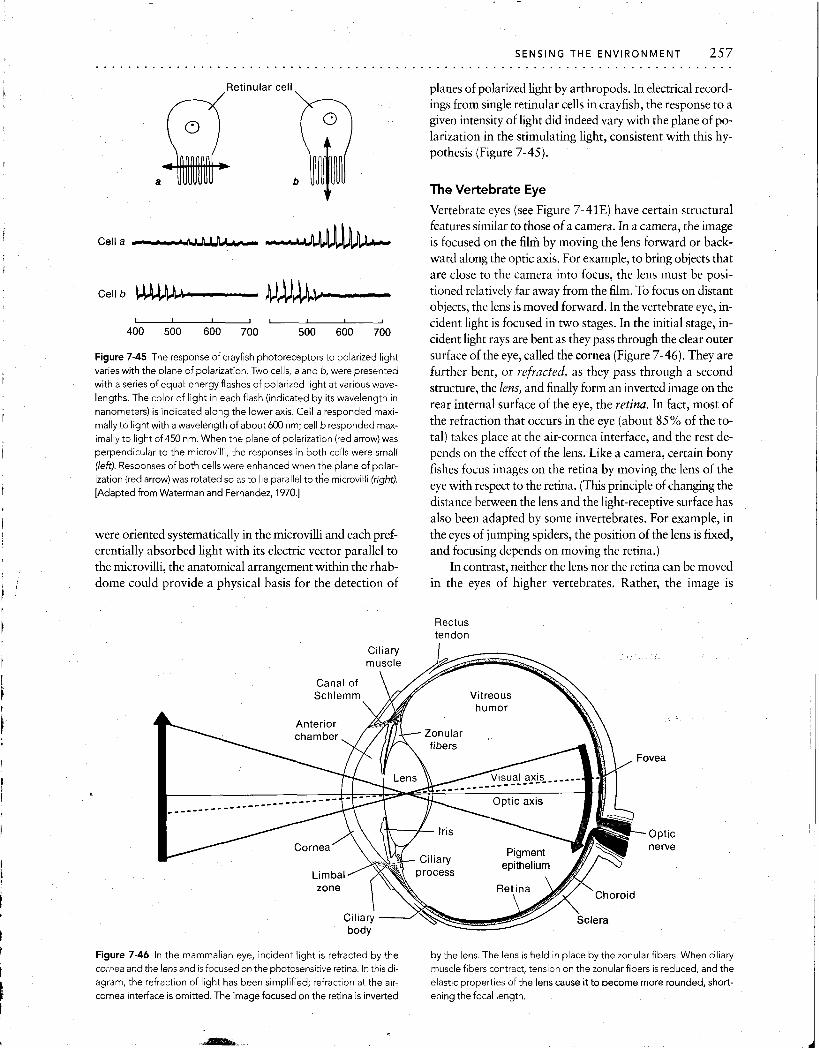
SENSING THE ENVIRONMENT 2 5 7 . . . . . . . . . . . . . . . . . . . . . . . . . . . . . . . . . . . . . . . . . . . . . . . . . . . . . . . . . . . . . . . . . . . . . . . . . . . . . . .
Ret~nu lar cell planes of polarized light by arthropods. In electrical record- ings from single retinular cells in crayfish, the response to a given intensity of light did indeed vary with the plane of po- larization in the stimulating light, consistent with this hy- pothesis (Figure 7-45).
a The Vertebrate Eye
Vertebrate eyes (see Figure 7-41E) have certain structural features similar to those of a camera. In a camera, the image
Cell a is focused on the film by moving the lens forward or back- ward along the optic axis. For example, to bring objects that are close to the camera into focus, the lens must be posi-
cd b w- - tioned relatively far away from the film. To focus on distant objects, the lens is moved forward. In the vertebrate eye, in-
I I I I 1 , I J cident light is focused in two stages. In the initial stage, in- 400 500 600 700
500 600 '0° cident light rays are bent as they pass through the clear outer Figure 7-45 The response of crayflsh photoreceptors to polarized light surface of the eye, called the cornea (Figure 7-46). They are varies with the plane of polarization. Two cells, a and b, were presented further bent. or refmcted, as they Dass through a second , - with a series of equal-energy flashes of polarized light at various wave- structure, the lens, and finally form an inverted image on the lengths. The color of light in each flash (indicated by its wavelength in
nanometers) is indicated along the lower axis. Cell a responded maxi- rear internal surface of the eye, the retina. In fact, most of
rnally to light with a wavelength of about 600 nrn; cell b responded max- the that Occurs in the eye 85% the imally to light of 450 nm. When the plane of ~olarization (red arrow) was tal) takes place at the air-cornea interface, and the rest de- perpendicular to the microvilli, the responses in both cells were small pends on the effect of the lens. Like a camera, certain bony (left). Responses of both cells were enhanced when the plane of polar- fishes focus images on the retina by moving the lens of the ization (red arrow) was rotated so as to lie parallel to t6e microvilli (right). [Adapted from Waterman and Fernandez, 1970.1
eye with respect to the retina. (This principle of changing the distance between the lens and the light-receptive surface has also been adapted by some invertebrates. For example, in
were oriented systematically in the microvilli and each pref- the eyes of jumping spiders, the position of the lens is fixed, erentially absorbed light with its electric vector parallel to and focusing depends on moving the retina.) the microvilli, the anatomical arrangement within the rhab- In contrast, neither the lens nor the retina can be moved dome could provide a physical basis for the detection of in the eyes of higher vertebrates. Rather, the image is
Rectus tendon
Figure 7-46 In the mammalian eye, incident light is refracted by the by the lens. The lens is held in place by the zonularfibers. When ciliary
cornea and the lens and is focused on the photosensitive retina. In this di- muscle fibers contract, tension on the zonular fibers is reduced, and the agram, the refraction of light has been simplified; refraction at the air- elastic properties of the lens cause it to become more rounded, short- cornea interface is omitted. The image focused on the retina is inverted ening the focal length.
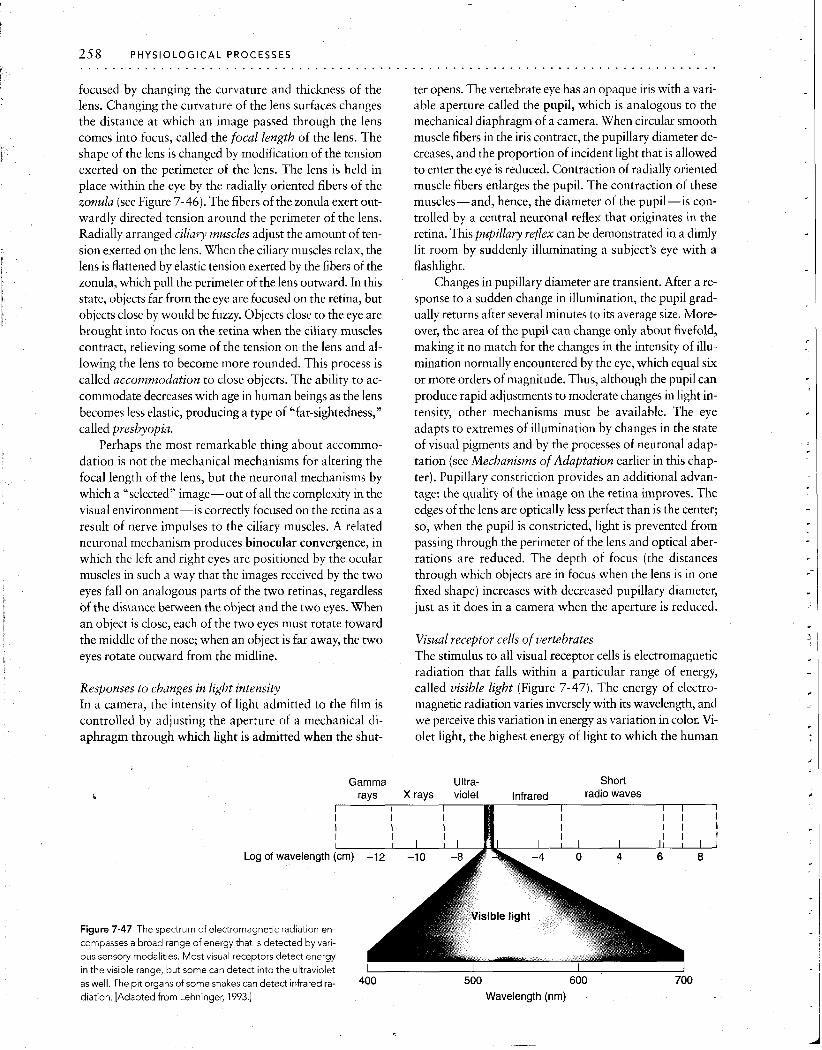
258 PHYSIOLOGICAL PROCESSES . . . . . . . . . . . . . . . . . . . . . . . . . . . . . . . . . . . . . . . . . . . . . . . . . . . . . . . . . . . . . . . . . . . . . . . . . . . . . . .
focused by changing the curvature and thickness of the lens. Changing the curvature of the lens surfaces changes the distance at which an image passed through the lens comes into focus, called the focal length of the lens. The shape of the lens is changed by modification of the tension exerted on the perimeter of the lens. The lens is held in place within the eye by the radially oriented fibers of the zonula (see Figure 7-46). The fibers of the zonula exert out- wardly directed tension around the perimeter of the lens. Radially arranged ciliary muscles adjust the amount of ten- sion exerted on the lens. When the ciliary muscles relax, the lens is flattened by elastic tension exerted by the fibers of the zonula, which pull the perimeter of the lens outward. In this state, objects far from the eye are focused on the retina, but objects close by would be fuzzy. Objects close to the eye are brought into focus on the retina when the ciliary muscles contract, relieving some of the tension on the lens and al- lowing the lens to become more rounded. This process is called accommodation to close objects. The ability to ac- commodate decreases with age in human beings as the lens becomes less elastic, producing a type of "far-sightedness," called presbyopia.
Perhaps the most remarkable thing about accommo- dation is not the mechanical mechanisms for altering the focal length of the lens, but the neuronal mechanisms by which a "selected" image-out of all the complexity in the visual environment-is correctly focused on the retina as a result of nerve impulses to the ciliary muscles. A related neuronal mechanism produces binocular convergence, in which the left and right eyes are positioned by the ocular muscles in such a way that the images received by the two eyes fall on analogous parts of the two retinas, regardless of the distance between the object and the two eyes. When an object is close, each of the two eyes must rotate toward the middle of the nose; when an object is far away, the two eyes rotate outward from the midline.
Responses to changes in light intensity In a camera, the intensity of light admitted to the film is controlled by adjusting the aperture of a mechanical di- aphragm through which light is admitted when the shut-
ter opens. The vertebrate eye has an opaque iris with a vari- able aperture called the pupil, which is analogous to the mechanical diaphragm of a camera. When circular smooth muscle fibers in the iris contract, the pupillary diameter de- creases, and the proportion of incident light that is allowed to enter the eye is reduced. Contraction of radially oriented muscle fibers enlarges the pupil. The contraction of these muscles-and, hence, the diameter of the pupil-is con- trolled by a central neuronal reflex that originates in the retina. This pupillary reflex can be demonstrated in a dimly lit room by suddenly illuminating a subject's eye with a flashlight.
Changes in pupillary diameter are transient. After a re- sponse to a sudden change in illumination, the pupil grad- ually returns after several minutes to its average size. More- over, the area of the pupil can change only about fivefold, making it no match for the changes in the intensity of illu- mination normally encountered by the eye, which equal six or more orders of magnitude. Thus, although the pupil can produce rapid adjustments to moderate changes in light in- tensity, other mechanisms must be available. The eye adapts to extremes of illumination by changes in the state of visual pigments and by the processes of neuronal adap- tation (see Mechanisms of Adaptation earlier in this chap- ter). Pupillary constriction provides an additional advan- tage: the quality of the image on the retina improves. The edges of the lens are optically less perfect than is the center; so, when the pupil is constricted, light is prevented from passing through the perimeter of the lens and optical aber- rations are reduced. The depth of focus (the distances through which objects are in focus when the lens is in one fixed shape) increases with decreased pupillary diameter, just as it does in a camera when the aperture is reduced.
Visual receptor cells of vertebrates The stimulus to all visual receptor cells is electromag~ietic radiation that falls within a particular range of energy, called visible light (Figure 7-47). The energy of electro- magnetic radiation varies inversely with its wavelength, and we perceive this variation in energy as variation in color. Vi- olet light, the highest energy of light to which the human
Gamma Ultra- Short rays X rays violet Infrared radio waves
Log of wavelength
Figure 7-47 The spectrum of electromagnet~c rad~at~on en- compasses a broad range of energy that IS detected by van- ous sensory modal~t~es Most v~sual receptors detect energy In the v~s~ble range, but some can detect Into the ultrav~olet as well The p ~ t organs of some snakes can detect Infrared ra- 400 500 600 700 dlatlon [Adapted from Lehn~nger, 1993 ] Wavelength (nm)

SENSING THE ENVIRONMENT 259 . . . . . . . . . . . . . . . . . . . . . . . . . . . . . . . . . . . . . . . . . . . . . . . . . . . . . . . . . . . . . . . . . . . . . . . . . . . . . . .
eye responds, has a wavelength of approximately 400 nm. Red light, at the low-energy end of the visible spectrum, has wavelengths between 650 and 700 nm. Bright light deliv- ers more energy per unit of time than does dim light. The photoreceptor cells that capture the energy of light and transduce it into neuronal signals are located in the retina of the vertebrate eye.
In mammals, birds, and other vertebrates, the retina contains several types of cells that are interconnected into a network. The visual receptor cells themselves fall into two classes, rods and cones, which were named for the shapes of the cells as observed under a microscope (Figure 7-48). All neurons within the retina, as well as the epithelial cells, contribute to the light response of the vertebrate eye, but rods and cones have different physiological characteristics. For example, cones function best in bright light and pro-
Pigment epithelium
vide high resolution, whereas rods function best in dim light. These different capabilities are used by different ani- mals to provide particular visual capabilities. For example, animals that live in flat, open environments (e.g., cheetahs and rabbits) usually have horizontal visual streaks, regions within the retina that contain unusually high densities of cone receptors. Such a region corresponds to the horizon in the visual world and is thought to confer maximal resolu- tion in this part of the scene. The visual streak also contains a high-density population of ganglion cells-the cells that transmit visual information to the brain. In contrast, arboreal species (and human beings) typically have a radi- ally symmetric density gradient of photoreceptors. An important feature of this kind of retina is the fovea, or area centralis. It is a small (about 1 mm2) central part of many mammalian retinas, and it provides very detailed
cilium
Figure 7-48 Vertebrate photoreceptors are classified as rods or cones from the source of light. The pigmentthat absorbs the light energy is con- on the basis of their morphological and physiological properties. The tained in membrane lamellae, and the ends of the outer segments lie
outer segments of rods and cones, where light is captured, face away against the pigment epithelium.

260 P H Y S I O L O G I C A L PROCESSES . . . . . . . . . . . . . . . . . . . . . . . . . . . . . . . . . . . . . . . . . . . . . . . . . . . . . . . . . . . . . . . . . . . . . . . . . . . . . . .
information about the visual world, a characteristic called high visual acuity. In human beings and in certain other mammals, the fovea contains only cones, whereas the remainder of the retina contains a mixture of rods and cones, with the rods significantly outnumbering the cones. In mammals, cones mediate color vision, and rods, which are more light-sensitive, mediate only achromatic vision. This distinction between rods and cones does not, however, pertain to all vertebrates. In fact, the retina in some species contains only rods, based on morphology, but may nonetheless be capable of color vision.
Rods and cones are structurally and functionally more similar to one another than are the wide variety of pho- toreceptors found in the invertebrates. Each vertebrate receptor cell contains a segment with an internal struc- ture similar to that of a cilium. This rudimentary cilium connects the outer segment, which contains the photore- ceptive membranes, to the inner segment, which contains the nucleus, mitochondria, synaptic contacts, and so forth (see Figure 7-48). The receptor membranes of vertebrate vi- sual cells consist of flattened lamellae derived from the sur- face membrane near the origin of the outer segment. In the
cones of mammals and some other vertebrates, the lumen of each lamella is open to the cell exterior. In rods, the lamellae pinch off completely from the surface membrane of the outer segment so as to form flattened sacs, or disks, that are stacked like pita bread on top of one another within the rod outer segment. The stack of disks is com- pletely contained within the surface membrane of the visual cell. The photopigment molecules are embedded in the. membranes of the disks. Because the photopigment lies in the disk membranes of the rod outer segment but not in the surface membrane, the primary step in photochemical transduction must take place in the dsk membranes, rather than in the surface membrane.
The eyes of many invertebrates lack the ciliary structure that connects the inner and outer segments of vertebrate rods and cones (Figure 7-49). In these invertebrate eyes, the photopigment is located in microvilli formed by the cell membrane, and these pigment-containing microvilli make up the rhabdomeres. Because many invertebrate species have simple eyes in which the photoreceptors are of the rhabdomeric type, it might be tempting to conclude that rhabdomeric photoreceptors are found only in simple eyes.
Arthropods Figure 7-49 Vertebrate photoreceptors con- tain a typical 9 + 2 ciliary structure that con- nects the inner and outer segments, but many invertebrate photoreceptors lack this ciliary
Ciliary line structure and instead contain many rnicrovilli. This diagram illustrates the phylogenetic dis-
Vertebrata tribution of ciliary and rhabdorneric eyes. There are, however, exceptions. Both the scal- lop, Pecten, and the surf clam, Lima, have complicated eyes with two layers of photore- ceptors. One layer contains ciliary photore- ceptors and the other contains rhabdomeric
. receptors. [Adapted from Eakin, 1965.1
Echinodermata
Rhabdomeric line
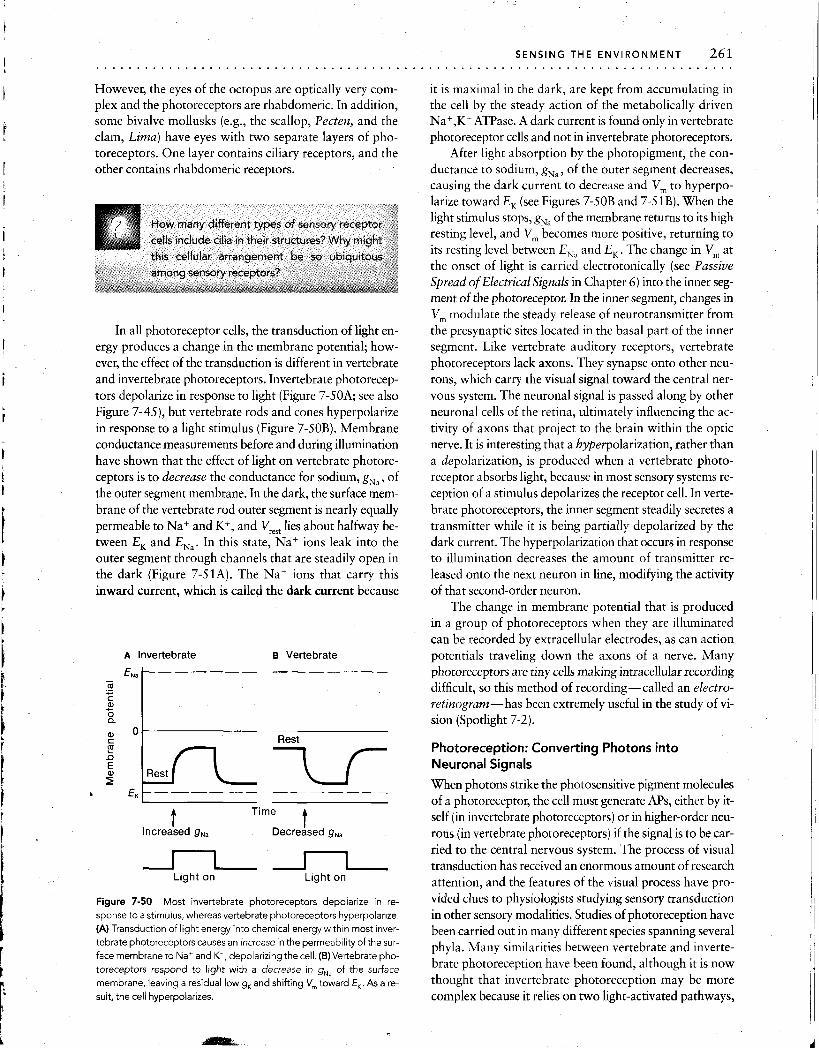
However, the eyes of the octopus are optically very com- it is maximal in the dark, are kept from accumulating in plex and the photoreceptors are rhabdomeric. In addition, the cell by the steady action of the metabolically driven some bivalve mollusks (e.g., the scallop, Pecten, and the Na+,K+ ATPase. A dark current is found only in vertebrate clam, Lima) have eyes with two separate layers of pho- photoreceptor cells and not in invertebrate photoreceptors. toreceptors. One layer contains ciliary receptors, and the After light absorption by the photopigment, the con- other contains rhabdomeric receptors. ductance to sodium, gNa, of the outer segment decreases,
causing the dark current to decrease and V,,, to hyperpo- larize toward EK (see Figures 7-50B and 7-51B). When the light stimulus stops, gNa of the membrane returns to its high resting level, and V,,, becomes more positive, returning to its resting level between ENa and EK. The change in V,,, at the onset of light is carried electrotonically (see Passive Spread of Electrical Signals in Chapter 6) into the inner seg- ment of the photoreceptor. In the inner segment, changes in
In all photoreceptor cells, the transduction of light en- ergy produces a change in the membrane potential; how- ever, the effect of the transduction is different in vertebrate and invertebrate photoreceptors. Invertebrate photorecep- tors depolarize in response to light (Figure 7-50A; see also Figure 7-45), but vertebrate rods and cones hyperpolarize in response to a light stimulus (Figure 7-50B). Membrane conductance measurements before and during illumination have shown that the effect of light on vertebrate photore- ceptors is to decrease the conductance for sodium, gNa, of the outer segment membrane. In the dark, the surface mem- brane of the vertebrate rod outer segment is nearly equally permeable to Na+ and K+, and V,, lies about halfway be- tween EK and EN,. In this state, Na+ ions leak into the outer segment through channels that are steadily open in the dark (Figure 7-51A). The Na+ ions that carry this inward current, which is called the dark current because
A Invertebrate B Vertebrate
t Time
Increased g,, t
Decreased g,,
nn Light on Light on
Figure 7-50 Most invertebrate photoreceptors depolarize in re- sponse to a stimulus, whereas vertebrate photoreceptors hyperpolarize. (A) Transduction of light energy into chemical energy w~ th~n most inver- tebrate photoreceptors causes an increase in the permeability of the sur- face membrane to Na+ and K+, depolarizing the cell. (B)Vertebrate pho- toreceptors respond to light with a decrease in gNa of the surface membrane, leaving a residual low g,and shifting V, toward EK. As a re- sult, the cell hyperpolarizes.
V,,, modulate the steady release of neurotransmitter from the presynaptic sites located in the basal part of the inner segment. Like vertebrate auditory receptors, vertebrate photoreceptors lack axons. They synapse onto other neu- rons, which carry the visual signal toward the central ner- vous system. The neuronal signal is passed along by other neuronal cells of the retina, ultimately influencing the ac- tivity of axons that project to the brain within the optic nerve. It is interesting that a hyperpolarization, rather than a depolarization, is produced when a vertebrate photo- receptor absorbs light, because in most sensory systems re- ception of a stimulus depolarizes the receptor cell. In verte- brate photoreceptors, the inner segment steadily secretes a transmitter while it is being partially depolarized by the dark current. The hyperpolarization that occurs in response to illumination decreases the amount of transmitter re- leased onto the next neuron in line, modifying the activity of that second-order neuron.
The change in membrane potential that is produced in a group of photoreceptors when they are illuminated can be recorded by extracellular electrodes, as can action potentials traveling down the axons of a nerve. Many photoreceptors are tiny cells making intracellular recording difficult, so this method of recording-called an electro- retinogram-has been extremely useful in the study of vi- sion (Spotlight 7-2).
Photoreception: Converting Photons into Neuronal Signals
When photons strike the photosensitive pigment molecules of a photoreceptor, the cell must generate APs, either by it- self (in invertebrate photoreceptors) or in higher-order neu- rons (in vertebrate photoreceptors) if the signal is to be car- ried to the central nervous system. The process of visual transduction has received an enormous amount of research attention, and the features of the visual process have pro- vided clues to physiologists studying sensory transduction in other sensory modalities. Studies of photoreception have been carried out in many different species spanning several phyla. Many similarities between vertebrate and inverte- brate photoreception have been found, although it is now thought that invertebrate photoreception may be more complex because it relies on two light-activated pathways,
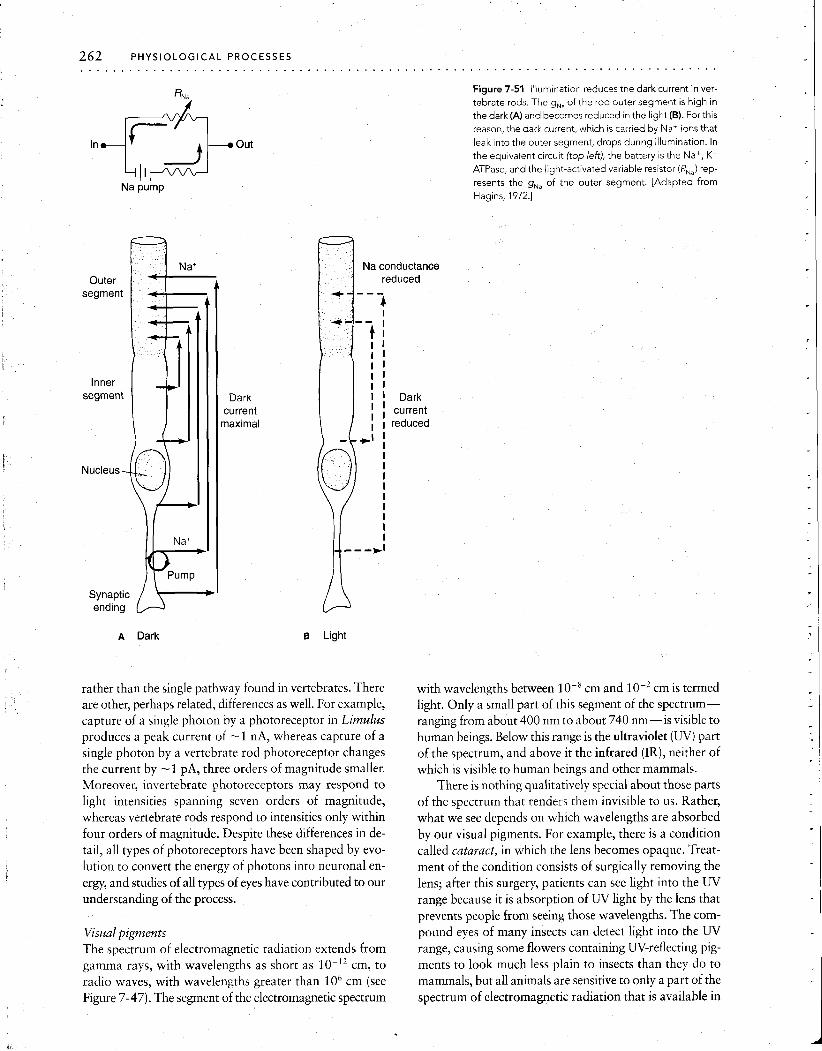
In 4 Out
Outer segment
Inner segment
Nucleus -
Synaptic ending
A Dark
Figure 7-51 Illumination reduces the dark current in ver- tebrate rods. The g,, of the rod outer segment is high in the dark(A) and becomes reduced in the light (B). Forthis reason, the dark current, which is carried by Na+ ions that
leak into the outer segment, drops during illumination. In the equivalent circuit (top left), the battery is the Na+, K+ ATPase, and the light-activated variable resistor (R,,) rep- resents the gNa of the outer segment. [Adapted from Hag~ns, 1972.1
6 Light
Na conductance reduced
+---- 4 I
' - - I I I I 4 I 1 I I I I I I I I Dark
rather than the single pathway found in vertebrates. There are other, perhaps related, differences as well. For example, capture of a single photon by a photoreceptor in Limulus produces a peak current of -1 nA, whereas capture of a single photon by a vertebrate rod photoreceptor changes the current by -1 pA, three orders of magnitude smaller. Moreover, invertebrate photoreceptors may respond to light intensities spanning seven orders of magnitude, whereas vertebrate rods respond to intensities only within four orders of magnitude. Despite these differences in de- tail, all types of photoreceptors have been shaped by evo- lution to convert the energy of photons into neuronal en- ergy, and studies of all types of eyes have contributed to our understanding of the process.
-,
Visual pigments The spectrum of electromagnetic radiation extends from gamma rays, with wavelengths as short as 10-l2 cm, to radio waves, with wavelengths greater than lo6 cm (see Figure 7-47). The segment of the electromagnetic spectrum
I I - - -,I
with wavelengths between cm and lo-' cm is termed light. Only a small part of this segment of the spectrum- ranging from about 400 nm to about 740 nm-is visible to human beings. Below this range is the ultraviolet (W) part of the spectrum, and above it the infrared (IR), neither of which is visible to human beings and other mammals.
There is nothing qualitatively special about those parts of the spectrum that renders them invisible to us. Rather, what we see depends on which wavelengths are absorbed by our visual pigments. For example, there is a condition called cataract, in which the lens becomes opaque. Treat- ment of the condition consists of surgically removing the lens; after this surgery, patients can see light into the W range because it is absorption of UV light by the lens that prevents people from seeing those wavelengths. The com- pound eyes of many insects can detect light into the UV range, causing some flowers containing W-reflecting pig- ments to look much less plain to insects than they do to mammals, but all animals are sensitive to only a part of the spectrum of electromagnetic radiation that is available in
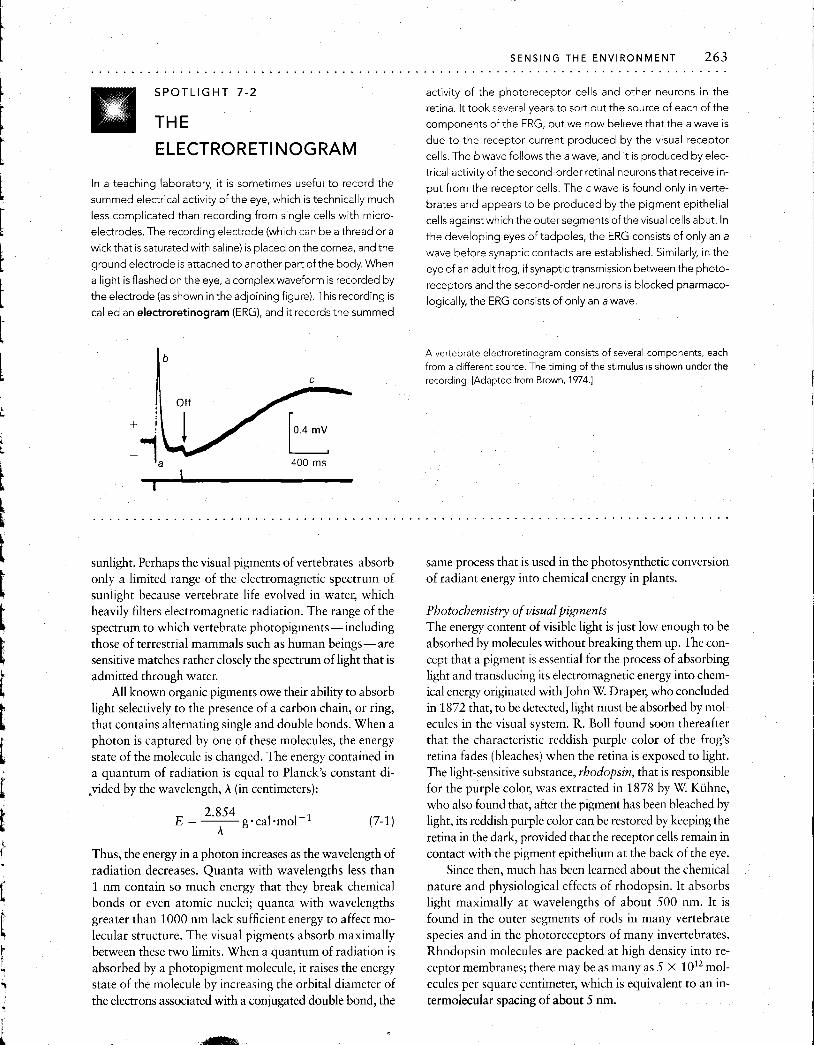
SPOTLIGHT 7-2
THE
ELECTRORETINOGRAM
In a teaching laboratory, it is sometimes useful t o record the
summed electrical activity of the eye, which is technically much
less complicated than recording from single cells with micro-
electrodes. The recording electrode (which can be a thread or a
wick that is saturated with saline) is placed on the cornea, and the
ground electrode is attached to another part of the body. When
a light is flashed on the eye, a complex waveform is recorded by
the electrode (as shown in the adjoining figure). This recording is
called an electroretinogram (ERG), and it records the summed
1 Off
sunlight. Perhaps the visual pigments of vertebrates absorb only a limited range of the electromagnetic spectrum of sunlight because vertebrate life evolved in water, which heavily filters electromagnetic radiation. The range of the spectrum to which vertebrate photopigments-including those of terrestrial mammals such as human beings-are sensitive matches rather closely the spectrum of light that is admitted through water.
All known organic pigments owe their ability to absorb light selectively to the presence of a carbon chain, or ring, that contains alternating single and double bonds. When a photon is captured by one of these molecules, the energy state of the molecule is changed. The energy contained in a quantum of radiation is equal to Planck's constant di- ,vided by the wavelength, A (in centimeters):
Thus, the energy in a photon increases as the wavelength of radiation decreases. Quanta with wavelengths less than 1 nm contain so much energy that they break chemical bonds or even atomic nuclei; quanta with wavelengths greater than 1000 nm lack sufficient energy to affect mo- lecular structure. The visual pigments absorb maximally between these two limits. When a quantum of radiation is absorbed by a photopigment molecule, it raises the energy state of the molecule by increasing the orbital diameter of the electrons associated with a conjugated double bond, the
activity of the photoreceptor cells and other neurons in the
retina. It took several years to sort out the source of each of the
components of the ERG, but we now believe that the a wave is
due to the receptor current produced by the visual receptor
cells. The b wave follows the a wave, and it is produced by elec-
trical activity of the second-order retinal neurons that receive in-
put from the receptor cells. The c wave is found only in verte-
brates and appears to b e produced by the pigment epithelial
cells against which the outer segments of the visual cells abut. In
the developing eyes of tadpoles, the ERG consists of only an a wave before synaptic contacts are established. Similarly, in the
eye of an adult frog, if synaptic transmission between the photo-
receptors and the second-order neurons is blocked pharmaco-
logically, the ERG consists of only an a wave.
A vertebrate electroretlnogram conslsts of several components, each from a different source The tlmlng of the st~mulus IS shown under the recording [Adapted from Brown, 1974 ]
same process that is used in the photosynthetic conversion of radiant energy into chemical energy in plants.
Photochemistry of visual pigments The energy content of visible light is just low enough to be absorbed by molecules without breaking them up. The con- cept that a pigment is essential for the process of absorbing light and transducing its electromagnetic energy into chem- ical energy originated with John W. Draper, who concluded in 1872 that, to be detected, light must be absorbed by mol- ecules in the visual system. R. Boll found soon thereafter that the characteristic reddish purple color of the frog's retina fades (bleaches) when the retina is exposed to light. The light-sensitive substance, rhodopsin, that is responsible for the purple color, was extracted in 1878 by W. Kiihne, who also found that, after the pigment has been bleached by light, its reddish purple color can be restored by keeping the retina in the dark, provided that the receptor cells remain in contact with the pigment epithelium at the back of the eye.
Since then, much has been learned about the chemical nature and physiological effects of rhodopsin. It absorbs light maximally at wavelengths of about 500 nm. It is found in the outer segments of rods in many vertebrate species and in the photoreceptors of many invertebrates. Rhodopsin molecules are packed at high density into re- ceptor membranes; there may be as many as 5 x 10¹² mol- ecules per square centimeter, which is equivalent to an in- termolecular spacing of about 5 nm.

All known visual pigments consist of two major com- ponents: a protein (opsin) and a light-absorbing molecule. In all instances, the light-absorbing molecule is either reti- nal or 3-dehydroretinal (Figure 7-52). Retinal is the alde- hyde of vitamin A,, a carotenoid. Vitamin Al is an alcohol and is also called retinol; 3-dehydroretinal is the aldehyde of vitamin A,, which is also called 3-dehydroretinol. In ad- dition to its major components, rhodopsin includes a six- sugar polysaccharide chain and a variable number (as many as 30 or more) of phospholipid molecules. The lipo- protein opsin, which binds the phospholipids and the poly- saccharide chain, appears to be an integral part of the pho- toreceptor membrane. Carotenoid molecules move back and forth between the photoreceptor membrane and the pigment epithelium at the back of the retina during bleach- ing and regeneration of the visual pigment. (Incidentally, the pigment that confers a dark color on the pigment ep- ithelium is photochemically inactive and is unrelated to the visual pigment. Instead, it keeps light from scattering and reflecting diffusely back toward the retina.)
The retinal molecule assumes two sterically distinct states in the retina. In the absence of light, the opsin and the retinal are linked covalently by a Schiff's base bond, and retinal is in the 11-cis configuration (see Figure 7-3). When the 11-cis retinal captures a photon, it isomerizes into the all-trans configuration (see Figure 7-52). This cis-trans isomerization is light's only direct effect on the visual pig- ment. The conversion from 11-cis to all-trans retinal initi- ates a series of changes in the relation between the retinal and the opsin protein, including changes in the conforma- tion of the opsin itself.
Figure 7-52 The carotenoid pigment retinal changes its steric confor- mation when it absorbs a photon. (A) In the dark, the bonds of carbon 11 are arranged in the cis configuration. (B) When a photon is captured, these bonds are converted into the straight, all-trans configuration. Both
When light hits the photopigment, an intermediate, metarhodopsin I I , is formed. Metarhodopsin I1 activates another protein that is associated with the membrane and that binds GTP in exchange for GDP. This protein, which we now know belongs to the family of G proteins, is called transducin in recognition of its key role in the transduction of light. The activated subunit of transducin diffuses in the plane of the membrane, encountering many phosphodi- esterase molecules, which hydrolyze cGMP to 5'-GMP. In vertebrate photoreceptors, the dark current Na+ channels are open only in the presence of cGMP; so, when cGMP is hydrolyzed, these channels close (Figure 7-53). The mem- brane of the rod outer segment contains a class of channels that are permeable to three cations: Na+, Mg2+ and Ca2+. When the level of cGMP drops, the conductance through these channels drops. Most importantly, the inward I,= drops, and the residual K+ current through other channels causes the cell to hyperpolarize. When the light stimulus ends, cGMP is regenerated by the action of another en- zyme, guanylate cyclase. As the level of cGMP rises, the dark current channels open, and the receptor current re- turns to its full value in the dark. Activated transducin col- lides with, and activates, phosphodiesterase molecules at a rate of about lo6 molecules per second, allowing the cap- ture of a single photon to affect the conductance through an enormous number of ion channels. This numerical rela- tion generates an impressive amplification between the cap- ture of a single photon and the effect that the event pro- duces on V,.
After the cis-trans isomerization of retinal has oc- curred, further changes in the molecule appear to be irrel-
l H l H /c\ /C\ /C\c/$\cH HzC C C
I I H H I H2C\ /C\ c I CH, H,C/'\CH
CH, I HC
\o
space-f~ll~ng and llne d~agrams of the molecular structure are shown [Part B from "Molecular Isomers In Vls~on," by R Hubbard and A Kropf Copy- r~ght 0 1967 by Scient~flc Amer~can, Inc All r~ghts resewed.]
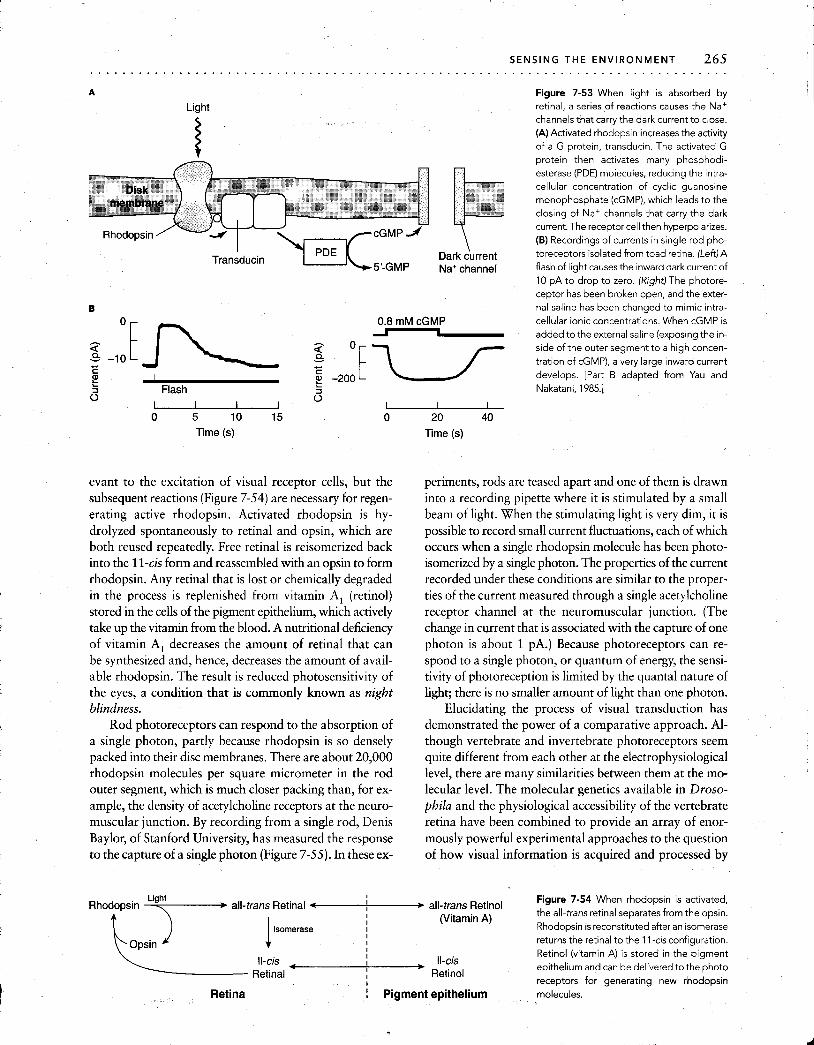
SENSING THE ENVIRONMENT 265 . . . . . . . . . . . . . . . . . . . . . . . . . . . .
Light
Figure 7-53 When light is absorbed by retinal, a series of reactions causes the Na+ channels that carry the dark current to close. (A) Activated rhodopsin increases the activity of a G protein, transducin. The activated G protein then activates many phosphodi- esterase (PDE) moiecules, reducing the intra- cellular concentration of cyclic guanosine monophosphate (cGMP), which leads to the closing of Na+ channels that carry the dark current. The receptor cell then hyperpolarizes. (B) Recordings of currents in single rod pho-
Dark current toreceptors isolated from toad retina. (Left) A
5'-GMP Na+ channel flash of light causes the inward dark current of
10 pA to drop to zero (R~ght) The photore- ceptor has been broken open, and the exter-
B nal sal~ne has been changed to rnlrnlc Intra-
0.8 mM cGMP cellular lonlc concentrat~ons When cGMP IS - added to the external sallne (exposing the In- side of the outer segment to a hlgh concen- & -10 tratlon of cGMP), a very large Inward current
t C E g -200 - L
develops [Part B adapted from Yau and L
5 Flash Nakatan~, 1985.1 - 5 ' 0 5 10 15 0 20 40
Time (s) Time (s)
evant to the excitation of visual receptor cells, but the subsequent reactions (Figure 7-54) are necessary for regen- erating active rhodopsin. Activated rhodopsin is hy- drolyzed spontaneously to retinal and opsin, which are both reused repeatedly. Free retinal is reisomerized back into the 11-cis form and reassembled with an opsin to form rhodopsin. Any retinal that is lost or chemically degraded in the process is replenished from vitamin A, (retinol) stored in the cells of the pigment epithelium, which actively take up the vitamin from the blood. A nutritional deficiency of vitamin A, decreases the amount of retinal that can be synthesized and, hence, decreases the amount of avail- able rhodopsin. The result is reduced photosensitivity of the eyes, a condition that is commonly known as night blindness.
8 Rod photoreceptors can respond to the absorption of a single photon, partly because rhodopsin is so densely packed into their disc membranes. There are about 20,000 rhodopsin molecules per square micrometer in the rod outer segment, which is much closer packing than, for ex- ample, the density of acetylcholine receptors at the neuro- muscular junction. By recording from a single rod, Denis Baylor, of Stanford University, has measured the response to the capture of a single photon (Figure 7-55). In these ex-
periments, rods are teased apart and one of them is drawn into a recording pipette where it is stimulated by a small beam of light. When the stimulating light is very dim, it is possible to record small current fluctuations, each of which occurs when a single rhodopsin molecule has been photo- isomerized by a single photon. The properties of the current recorded under these conditions are similar to the proper- ties of the current measured through a single acetylcholine receptor channel at the neuromuscular junction. (The change in current that is associated with the capture of one photon is about 1 PA.) Because photoreceptors can re- spond to a single photon, or quantum of energy, the sensi- tivity of photoreception is limited by the quanta1 nature of light; there is no smaller amount of light than one photon.
Elucidating the process of visual transduction has demonstrated the power of a comparative approach. Al- though vertebrate and invertebrate photoreceptors seem quite different from each other at the electrophysiological level, there are many similarities between them at the mo- lecular level. The molecular genetics available in Droso- phila and the physiological accessibility of the vertebrate retina have been combined to provide an array of enor- mously powerful experimental approaches to the question of how visual information is acquired and processed by
Rhodopsin all-trans Retinal 4 I t all-trans Retinol I
I I (Vitamin A)
Isomerase I I
Opsin I I
Il-cis , I I Il-cis
Retinal I I Retinol I
Retina ! Pigment epithelium
Figure 7-54 When rhodopsin is activated,
the all-trans retinal separates from the opsin. Rhodopsin is reconstituted after an isomerase
returns the retinal to the I I-cis configuration. Retinol (vitamin A) is stored in the pigment eplthellum and can be deltvered to the photo
receptors for generating new rhodopsln
molecules.
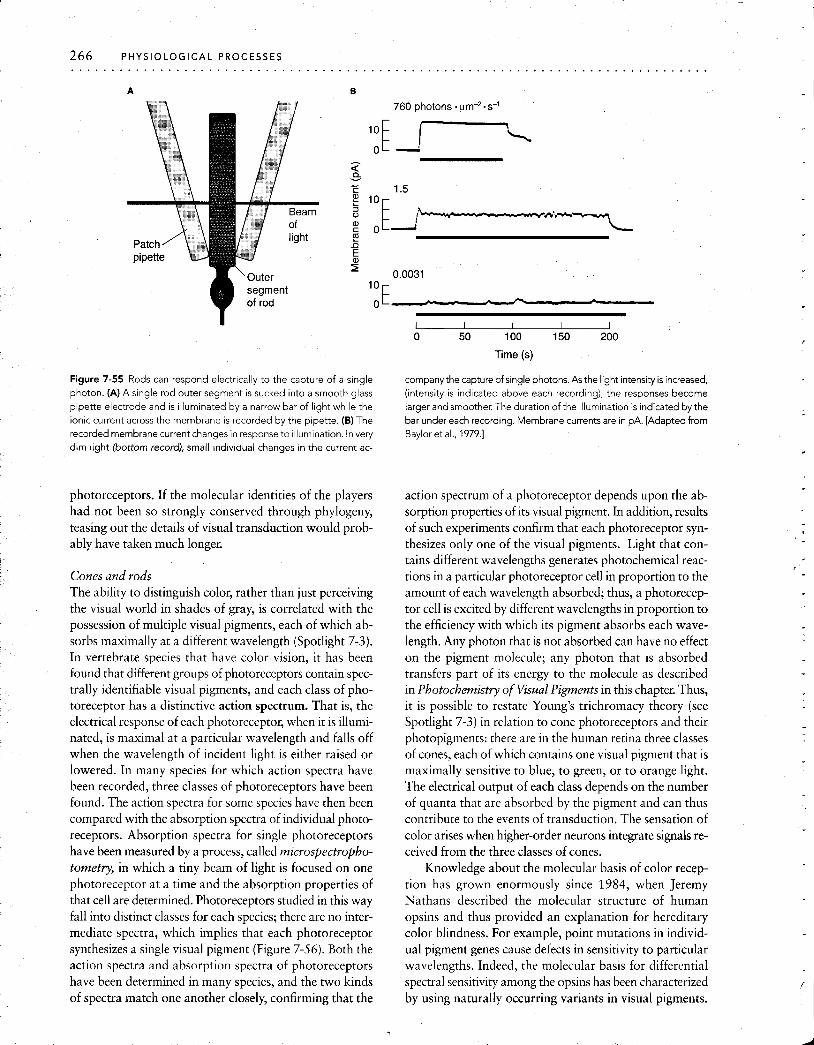
I light
'outer segment of rod
760 photons. pm-Z.s-'
Time (s)
Figure 7-55 Rods can respond electrically to the capture of a single company the capture of single photons. As the light intensity is increased, photon. (A) A single rod outer segment is sucked into a smooth glass (intensity is indicated above each recording), the responses become pipette electrode and is illuminated by a narrow bar of light while the larger and smoother. The duration of the illumination is indicated by the ionic current across the membrane is recorded by the pipette. (B) The bar under each recording. Membrane currents are in PA. [Adapted from recorded membrane current changes in response to illumination. In very Baylor et al., 1979.1 dim light (bottom record), small individual changes in the current ac-
photoreceptors. If the molecular identities of the players had not been so strongly conserved through phylogeny, teasing out the details of visual transduction would prob- ably have taken much longer.
Cones and rods The ability to distinguish color, rather than just perceiving the visual world in shades of gray, is correlated with the possession of multiple visual pigments, each of which ab- sorbs maximally at a different wavelength (Spotlight 7-3). In vertebrate species that have color vision, it has been found that different groups of photoreceptors contain spec- trally identifiable visual pigments, and each class of pho- toreceptor has a distinctive action spectrum. That is, the electrical response of each photoreceptor, when it is illumi- nated, is maximal at a particular wavelength and falls off when the wavelength of incident light is either raised or lowered. In many species for which action spectra have been recorded, three classes of photoreceptors have been found. The action spectra for some species have then been compared with the absorption spectra of individual photo- receptors. Absorption spectra for single photoreceptors have been measured by a process, called microspectropho- tometry, in which a tiny beam of light is focused on one photoreceptor at a time and the absorption properties of that cell are determined. Photoreceptors studied in this way fall into distinct classes for each species; there are no inter- mediate spectra, which implies that each photoreceptor synthesizes a single visual pigment (Figure 7-56). Both the action spectra and absorption spectra of photoreceptors have been determined in many species, and the two kinds of spectra match one another closely, confirming that the
action spectrum of a photoreceptor depends upon the ab- sorption properties of its visual pigment. In addition, results of such experiments confirm that each photoreceptor syn- thesizes only one of the visual pigments. Light that con- tains different wavelengths generates photochemical reac- tions in a particular photoreceptor cell in proportion to the amount of each wavelength absorbed; thus, a photorecep- tor cell is excited by different wavelengths in proportion to the efficiency with which its pigment absorbs each wave- length. Any photon that is not absorbed can have no effect on the pigment molecule; any photon that is absorbed transfers part of its energy to the molecule as described in Photochemistry of Visual Pigments in this chapter. Thus, it is possible to restate Young's trichromacy theory (see Spotlight 7-3) in relation to cone photoreceptors and their photopigments: there are in the human retina three classes of cones, each of which contains one visual pigment that is maximally sensitive to blue, to green, or to orange light. The electrical output of each class depends on the number of quanta that are absorbed by the pigment and can thus contribute to the events of transduction. The sensation of color arises when higher-order neurons integrate signals re- ceived from the three classes of cones.
Knowledge about the molecular basis of color recep- tion has grown enormously since 1984, when Jeremy Nathans described the molecular structure of human opsins and thus provided an explanation for hereditary color blindness. For example, point mutations in individ- ual pigment genes cause defects in sensitivity to particular wavelengths. Indeed, the molecular basis for differential spectral sensitivity among the opsins has been characterized by using naturally occurring variants in visual pigments.

A 455 530 625 , (Blue) (Green) (Red)
Wavelength (nm)
400 500 600 700 Wavelength (nm) I I I I I I I I
It appears that 1 1-cis-retinal (or 11-cis-3-dehydroreti- nal) is the light-absorbing molecule in all visual pigments, and this prosthetic group is combined with different opsin molecules to produce visual pigments with different ab- sorption maxima. Differences in the amino acid composi- tion of opsins-rather than variation in the light-absorb- ing prosthetic group-produce rhodopsins with different absorption maxima. Nathans and his co-workers discov- ered three genes that encode for the opsins in human cones. The gene encoding the protein part of the blue-absorbing pigment is located on an autosomal chromosome, whereas the two genes for the "red"-absorbing and green-absorbing proteins are closely linked on the X chromosome. The "red" and green opsins differ at only 15 of 348 amino acids, and each shares about half its amino acids with rhodopsin in rods (Figure 7-57). On the basis of sequence similarity, we can surmise that the genes for these pigments probably arose from a common ancestral gene that under- went duplication and divergence. A comparison of the amino acid sequences suggests that, of the cone pigments, the blue-sensitive pigment arose first, followed by the red and the green. Color blindness is caused by an absence of,
SENSING THE ENVIRONMENT 267 . . . . . . . . . . . . . . . . . . . . . . . . . . . . . . . . . . . .
$ 400 500 600 700
Wavelength (nm)
Figure 7-56 Each class of cones in the carp retina has a distinctive action spectrum. (A) Absorption spectra of individual cones in the retina of a goldfish indicate that there are three separate visual pigments, each with a distinctive absorbance peak. These measurements were made by mi- crospectrophotometry, which allows the absorption spectrum of a single photoreceptorto be measured. In human beings, the class of cones that is equivalent to the red-absorbing cone in the goldfish absorbs maximally closer to 560 nm, which is in the yellow part of the spectrum. (B) Electri- cal responses of three single cones in the retina of a carp to flashes of d~ f - ferent wavelengths, as shown by the scale at the top. The wavelength that produces a maximal response is different for each of the three cones. (C) When the amplitude of activity in each cell shown in part B was plot- ted as a function of wavelength, three classes of cones were revealed, each with an action spectrum approximating one of the absorption spec- tra in part A. [Part A adapted from Marks, 1965; parts B and C adapted from Tomita et al., 1967.1
or a defect in, one of the cone opsin genes. With the use of these molecular markers in conjunction with visual tests, it is now possible to define the molecular basis of this per- ceptual problem. For example, the high incidence of
Cvtosol
Inside disk
Figure 7-57 The two opsin proteins in the human rhodopsins that ab- sorb maximally in the red and the green parts of the visible spectrum dif- fer by only 15 amino acids, most of which are thought to be in membrane- spannlng helices. In this diagram, these variable amino acids are red. [Adapted from Nathans et al., 19861

SPOTLIGHT 7 - 3
LIGHT, PAINT, AND
COLOR VISION
In 1666, Sir Isaac Newton demonstrated that white light is
separated into a number of colors when it is passed through a
prism. Each spectral color is monochromatic; that is, it cannot be
separated into yet more colors. At that time, however, it was al-
ready known that a painter could match any spectral color (e.g.,
orange) by mixing two pure pigments (e.g., red and yellow), each
of which reflects a wavelength different from that of the color
produced. Thus, there seemed to be a paradox between
Newton's demonstration that there is an infinite number of col-
ors In light and the growing awareness of Renaissance painters
that all colors could be produced by combinations of three pri-
mary pigments-red, yellow, and blue. This paradox appeared
to be resolved by Thomas Young's suggestion, in 1802, that the
receptors in the eye are selective for the three primary colors:
red, yellow, and blue. Young reconciled the infinite variety of
spectral colors that can be duplicated with the small number of
painter's pigments required to produce all colors by proposing
that each class of color receptor is excited to a greater or lesser
degree by any wavelength of light: The "red" and "yellow" re-
ceptors would be stimulated maximally by separate monochro-
matic "red" and "yellow" wavelengths, respectively, and both
would be stimulated to a lesser degree by monochromatic or-
ange light. Young proposed, in other words, that the sensation
for "orange" results from the simultaneous excitation of "red"
receptors and "yellow" receptors. Young had no notion about
the physiology of photoreceptors, making his insight truly
remarkable.
Extensive psychophysical investigations carried out in
the nineteenth century by James Maxwell and Hermann von
Helmholtz supported Young's trichromacy theory, and ad-
ditional support came from later investigations by William
Rushton. However, direct evidence for the existence of three
classes of color-receiving photoreceptors was missing. Then, in
1965, W. B. Marks and E. MacNichol measured the color ab-
sorption of single cone photoreceptors in the goldfish retina (see
Figure 7-56A). They found three classes of cones, each of which
absorbed maximally at a unique wavelength. Subsequent mea-
surements of the absorption spectra of cones in retinas from hu-
man beings, monkeys, and other species of fishes reproduced
these results. It thus appears that the retinas of species that can
percelve and respond to color contaln photoreceptor cells w~th
d~fferent absorption spectra and that, In many of these species,
there are three d~sttnct classes of receptors.
red-green color blindness arises from the recombination of these closely linked red and green opsin genes.
Color vision has been demonstrated in some members of all classes of vertebrates. In general, retinas that include cone photoreceptors are associated with color vision, but examples of different color classes among rods have been found. For example, frogs have two kinds of rods-red (containing rhodopsin, which absorbs in the blue green) and green (containing a pigment that absorbs in the blue) -in addition to cones.
If color vision is mediated primarily by the cones, what do rods contribute? Rods are more sensitive to light than are cones (the records in Figure 7-55 were made from rods), and their connections to the next neurons in line are char- acterized by greater convergence than are the connections of cones (see Visual Processing in the Vertebrate Retina, Chapter 1 I) , producing greater summation of weak stim- uli. Thus, rods are most effective in dim light. Because the cones produce color vision, when only our rods are stimu- lated by dim light, we see in shades of black and gray, rather than in color. In the human retina, most images are prefentially focused onto the fovea, which contains only tightly packed cones. Rods are found only outside the fovea. The differential distribution of rods and cones in the retina causes us to be most sensitive to dim light when an image is focused outside the fovea, onto parts of the retina where the rod population is higher. For example, a dim star will appear brighter if you adjust your gaze to make its im- age fall outside the fovea. If you s M your gaze to make the
image fall on the fovea, the star will fade or even disappear. This increased sensitivity comes at a price: the broader con- nections among rods reduces the acuity of rod-based vision. Our visual sensitivity is greatest when an image is focused onto the rods outside the fovea; our visual acuity is great- est when we focus an image onto the cones of the fovea.
When visual pigments are explored throughout phy- logeny, some interesting patterns emerge. For example, all visual pigments for which retinal is the prosthetic group are called rhodopsins. All human visual pigments-the rod pigment and the three cone pigments-are rhodopsins. Vi- sual pigments in which 3-dehydroretinal is the prosthetic group are called porphyropsins, and the distribution of the rhodopsins and porphyropsins among species shows an interesting correlation with environment. All visual pig- ments of terrestrial vertebrates are rhodopsins. In addition, rhodopsins are found among invertebrates, including Limulus, insects, and crustaceans. In contrast, porphy- ropsins are found in the retinas of freshwater fishes, eury- haline fishes (see Chapter 14), and some amphibians. This distribution suggests that some feature of the porphy- ropsins makes them particularly well adapted to conditions found in freshwater. In fact, anadromous fishes, which mi- grate from freshwater to saltwater-or vice versa-during their life cycle, change their visual pigment between por- phyropsin and rhodopsin during the migration. They syn- thesize porphyropsin during their stay in freshwater and rhodopsin while they are in saltwater. The absorption max- ima of the porphyropsins is shlfted toward the longer-
wavelength, red end of the visual spectrum, whereas rhodopsins absorb maximally at shorter wavelengths. Per- haps the freshwater environment makes sensitivity to the red end of the spectrum important.
Tracing the transduction of information from the ab- sorption of a photon to the production of neuronal signals leaves the question of how all this information about inci- dent radiation is molded into a coherent view of the world unanswered. The collected information is passed on to higher neuronal centers, where it is integrated and can be used to shape behavior-a topic that is explored in Chapter 11.
LIMITATIONS ON SENSORY RECEPTION To be most useful, a sensory receptor should be very sensi- tive to stimulation from the environment and should en- code the information with perfect accuracy. In fact, no re- ceptor meets these requirements, because of the physical properties of stimuli and of receptors; all receptors repre- sent compromises in how they receive and encode sensory information. Some physical principles that apply to recep- tors of many sensory modalities necessarily limit the fidelity with which sensory information is received and transmit- ted by cells. In some cases, the accuracy of sensory recep- tion is limited by the relative magnitudes of the signals and the background noise. This signal-to-noise ratio limits the performance of all systems that receive and transmit infor- mation, whether or not they are living. In other cases, the performance and sensitivity of a sensory system are limited by the form of energy to which the receptors are tuned. For example, light is by its nature quantized into photons. No receptor can receive less than one quantum of light, because light does not exist in fractions of quanta.
A major source of background noise arises from a corollary of the Third Law of Thermodynamics. That is, at all temperatures above O°K, molecules have kinetic energy and are in motion. Thermal energy is given by
where k is Boltzmann's constant (1.3805 X 10-l6 erg K-l) and T is the absolute temperature. This equation gives the energy that is associated with the movement of molecules (i.e., Brownian motion) at an animal's body temperature. It sets a lower limit on the sensitivity of receptors in detecting signals because thermal energy provides a constant noise level against which stimulation occurs. To detect an exter- nal signal, a receptor must be able to distinguish the signal from this baseline thermal noise. How easily can receptor cells accomplish this task?
Photoreceptors provide an example. At a body temperature of 2S°C, the thermal energy is about 0.58 kcal-mol-', or 4 x 10-l4 erg. We must compare this energy to the energy of a typical sensory stimulus. The stim- ulus for a vertebrate photoreceptor is light in the visible
part of the electromagnetic spectrum (see Figure 7-47). The energy of a single photon of light is given by the Einstein relation:
where h is Planck's constant and v, c, and A are the fre- quency, speed, and wavelength of light, respectively. Sub- stituting the values for a photon of blue light (A = 500 nm), the energy is calculated to be about 57 kcal-mol-l- almost 100-fold greater than the thermal energy. In vision, detection is definitely not limited by thermal energy within the detector. Instead, it has been found to be limited by the quanta1 nature of light itself.
In audition, the energy is given by the Einstein relation for single phonons, which are quantum units of sound en- ergy analogous to photons of light. Animals hear sounds across a remarkably broad range of frequencies, from 10 to lo5 Hz. The energy of phonons at these frequencies ranges from 7 x to 7 x erg. In the middle of this range, the energy of a single phonon is 10 orders of mag- nitude (101°) below the limit of detection set by thermal en- ergy. This result indicates that the detection of acoustic stimuli is fundamentally limited by thermal noise, and there must be special mechanisms that permit auditory sensory reception. Indeed, some advantage is gained by tuning the detectors to limit their range, a common feature found in the hair cells of auditory systems. Numerous mechanisms have evolved to combat the limitations of thermal noise, but direct measurements have also shown that sensory cells in auditory systems faithfully reproduce the thermal noise at their inputs.
As discussed earlier in this chapter, most chemical stim- uli (olfaction, taste, chemotaxis) bind to specific receptors, rather than directly change ionic currents through mem- brane channels. In this case, the relation between binding energy and thermal energy determines the limits of detec- tion. The binding energies that have been measured in chemical sensory systems are typically about 1 kcal - mol-I . This energy is sufficiently greater than thermal energy that chemoreceptors could theoretically count single molecules. There is, however, an important constraint dictated by the physics of receptor binding. The greater the binding energy, the longer the molecule remains associated with its recep- tor. For a binding constant of lop6 M, the association time is about 3 X seconds; whereas, for a binding constant of lo-'' M (giving very high specificity), the association would last for more than 5 minutes. Because the perfor- mance of a receptor system depends at least in part on com- parisons across many receptors, long binding times would require that comparisons be made over very long time pe- riods, and evolution seems to have shunned such a mecha- nism. Instead, the binding constants between chemical stimuli and their receptor molecules are moderately high, reducing the binding energy but also the time required to transduce and interpret chemical signals.

270 P H Y S I O L O G I C A L PROCESSES . . . . . . . . . . . . . . . . . . . . . . . . . . . . . . . . . . . . . . . . .
Signal-to-noise properties can be predicted for stimuli that activate electroreceptors and thermoreceptors. Elec- troreception is relatively widespread in aquatic organisms, in which it is used for navigation, communication, and pre- dation. The energy in the electric fields, carried through wa- ter at the frequencies used, is about 10 orders of magnitude below the thermal energy. Thus, the process of electro- reception, like that of auditory reception, must be domi- nated by thermal noise in the detector. Thermoreception depends on the detection of photons in the infrared region of the electromagnetic spectrum (which has lower frequen- cies and longer wavelengths than those in the visible spec- trum), and, by definition, it is limited by the temperature difference between the measured object and the measuring organ. Some animals, particularly beetles, have been found to perform at or near the theoretical limits; others have ap- parent adaptations that keep their detectors cooler than the rest of the body, decreasing the background thermal noise.
As scientists have explored the limits of detection achieved by animal senses, it has become clear that many modalities operate at or near the theoretical limits imposed by physical laws. To accomplish this prodigious task, many types of receptors have evolved similar molecular mecha- nisms, and the mechanisms that are available to be used in each sensory modality depend, at least to some extent, on whether sensory reception is limited by thermal energy or by the quanta1 nature of the stimulus.
SUMMARY Receptor cells are highly sensitive to specific kinds of stim- ulus energy and relatively insensitive to other kinds of stim- ulation, and they transduce the stimulus into an electrical signal, usually (but not always) a depolarization. The lower limit to sensation often depends on how much energy is carried in the signal compared with the energy in the ther- mal noise within the organism. The transduction process is most sensitive to weak stimuli, producing receptor signals that contain several orders of magnitude more energy than the stimulus itself. This sensitivity drops off with increasing stimulus strength. In most receptor cells, the primary sites of reception and transduction are receptor molecules lo- cated in the cell membrane or in intracellular membranes.
Activation of receptor molecules causes the conduc- tance of particular classes of ion channels in the membrane to change; typically, the change in conductance permits the flow of a receptor current, producing a receptor potential. In many sensory modalities, the receptor cells do not them- selves produce APs. Instead, receptor potentials modulate the amount of neurotransmitter that the receptor cells release onto second-order neurons, which in turn initiates or modulates the number of APs in second-order neurons. Stimulus intensity is typically encoded in the frequency of impulses, which in many sensory fibers is roughly pro- portional to the logarithm of the intensity, up to a maxi- mum frequency. The logarithmic relation between stimulus and response magnitudes permits reception over a large
dynamic range while retaining high sensitivity to weak stimuli.
Parallel inputs from receptors that cover different parts of the intensity range increase the range of stimulus inten- sities that can be perceived. The time-dependent loss of sensitivity to a maintained stimulus, termed sensory adap- tation, is a common property of receptor cells; some recep- tors adapt rapidly and others adapt slowly. The mecha- nisms responsible for sensory adaptation vary. Some take place in the receptor cell, others in the network of neurons that carry the sensory information. In at least one case (the Limulus photoreceptor), adaptation results in part from in- tracellular elevation of Ca2+, which blocks the light- dependent activation of Na+- K+-selective ion channels.
Some receptor cells exist individually, but others are or- ganized into sensory tissues and organs, such as the verte- brate nasal epithelium or the retina of the eye. Anatomical organization affects how a sensory organ functions. For ex- ample, the quality of the image formed by the vertebrate vi- sual system depends on the presence of a lens and a huge population of photoreceptor cells in the retina.
Several sensory systems have features in common. In particular, many receptor molecules contain seven trans- memt>rane domains, a feature that is also found in some neurotransmitter and hormone receptors. Many sensory systems also have common elements in the cascade of bio- chemical events that immediately follow signal detection and that amplify the signal.
Mechanoreception is a result of distortion or stretching of the receptor membrane, directly producing changes in ion conductances. The deflection of the stereocilia of hair cells provides directional information by modulating, up- ward or downward, the frequency of spontaneously oc- curring impulses of axons in the eighth cranial nerve. This function is the basis of reception in several sensory or- gans-the lateral-line system of fishes and amphibians, vertebrate audition, and the organs of equilibrium in both vertebrates and invertebrates. The mammalian cochlea an- alyzes sound frequencies according to their effectiveness in displacing different parts of the basilar membrane, which bears hair cells. Mechanical waves travel along the basilar membrane, set up by sound-driven movements of the ear- drum and auditory ossicles; they stimulate the hair cells, which in turn modulate their synaptic activity onto audi- tory nerve fibers. Certain sound frequencies stimulate each location along the basilar membrane more strongly than do other frequencies, which is the basis for frequency discrim- ination in mammals.
Electroreceptors of fishes are modified hair cells that have lost their cilia. Exogenous currents flowing through electroreceptor cells produce changes in the transmem- brane potential that modulate the release of transmitter at the base of the receptor cell, thus determining the rate of APs in sensory fibers.
Visual receptors employ pigment molecules, in special- ized membranes, that undergo a conformational change af- ter absorbing a photon. The change in the conformation of

the photoreceptive molecules initiates a cascade of reac- tions that leads to achange in the conductance of the re- ceptor cell membrane. All visual pigments consist of a protein molecule (an opsin) combined with a carotenoid chromophore, either retinal (in rhodopsins) or 3-dehydro- retinal (in porphyropsins). The amino acid sequence of the opsin determines the absorption spectrum of each visual pigment. A cis-trans isomerization of the carotenoid ini- tiates all visual responses. Absorption of photons is coupled to the opening (in invertebrates) or closing (in vertebrates) of ion channels by intracellular second-messengers. In ver- tebrate rods, photon capture by rhodopsin molecules leads to the activation of associated G-protein molecules located in the receptor membrane. Each G protein then activates many phosphodiesterase molecules, each of which hy- drolyzes many molecules of the internal messenger cGMP. In the dark, cGMP continually activates Na+ channels that carry the dark current. The light-dependent hydrolysis of cGMP reduces the dark current, and a residual K+ current hyperpolarizes the photoreceptor cell, reducing the steady release of neurotransmitter at the inner segment. The re- duced rate of transmitter release causes a change in activity in the next higher-order neuron.
Some vertebrates have three types of cones in the fovea, each containing a visual pigment that is maximally sensi- tive to a different part of the spectrum. The integration of activity from all of these cones produces color vision. Rods, which in human beings all contain only one type of pho- topigment, are present in great densities in the periphery of the retina outside the fovea, are more sensitive than cones, and show much greater synaptic convergence. As a result, they exhlbit low acuity and high sensitivity.
REVIEW QUESTIONS
1. Visual receptor cells can be stimulated by pressure, heat, and electricity, as well as by light, as long as the intensity of these other stimuli is sufficiently great. How can this fact be reconciled with the concept of receptor specificity?
2. Choose one sensory modality and outline the steps from energy absorption by a receptor cell to the ini- tiation of action potentials (APs) that will travel to the central nervous system.
3. Why must receptor potentials be converted into APs to be effective?
4. All sensory information enters the central nervous system in the form of APs having similar properties. How can we differentiate among various stimulus modalities?
5. What is the difference between sensory transduction and sensory amplification? Choose one sensory modality and describe how these two processes are related in that modality.
6. Discuss the relation between the intensity of a stimu- lus and the magnitude of the signal sent to the central nervous system by receptor cells. How is stimulus in-
tensity encoded? How can a sensory system respond to stimuli whose intensity varies over many orders of magnitude?
7. Discuss three mechanisms that contribute to sensory adaptation.
8. Discuss one example in which efferent activity can regulate the sensitivity of receptor cells.
9. How are movements of the basilar membrane con- verted into auditory nerve impulses?
10. Discuss the function of inner and outer hair cells in the cochlea. How does spontaneous firing enhance the sensitivity of certain receptor systems-for example, lateral- line electroreceptors? How is the presence of an object perceived by elec- troreceptors of the weakly electric fishes? What is the major difference between vertebrate and invertebrate photoreceptor cells in their electrical re- sponses to illumination? Compare the mechanisms that allow the auditory system to distinguish the frequency of incident sounds and the visual system to distinguish the fre- quency of incident light. Outline the steps, as currently understood, in the transduction of light energy in vertebrate visual receptors. How does our current understanding of the physiol- ogy of color vision corroborate Young's trichromacy theory? Compare and contrast the morphological and func- tional properties of vertebrate rods and cones. What allows some arthropods to respond to the ori- entation of polarized light? Human beings cannot do it. Why? Compare the ways in which mammalian and teleost lenses focus images.
SUGGESTED READING
Corey, D. P., and S. D. Roper. 1992. Sensory Transduction. 45th Annual Symposium of the Society of General Physiologists. New York: Rockefeller University Press. A series of papers that discuss recent data from studies of transduction in many different sensory modalities.
Dowling, J. 1987. The Retina. Cambridge, Mass.: Belknap Press of Harvard University Press. A very readable compendium of information on the vertebrate retina written by a major contributor to our understanding of this sensory organ.
Finger, T. E., and W. L. Silver. 1987. Neurobiology of Taste and Smell. New York: Wiley. A collection of papers considering the chemical senses in a broad range of animals.
Hudspeth, A. J. 1989. How the ear's works work. Nature 341:397-404. A beautifully written account of audi- tory transduction by hair cells, written by a man who has played a major role in exploring the subject.

272 PHYSIOLOGICAL PROCESSES . . . . . . . . . . . . . . . . . . . . . . . . . . . . . . . . . . . . . . . . .
Kandel, E. R., J. H. Schwartz, and T. M. Jessell. 1991. Prin- ciples of Neural Science. 3d ed. New York: Elsevier. An enormous and authoritative compendium of infor- mation about the function of the nervous system, from the biophysics of membrane channels to the physiolog- ical basis of memory and learning. Several chapters consider sensory mechanisms, with some emphasis on vertebrates.
Land, M., and R. Fernald. 1992. The evolution of eyes. Ann. Rev. Neurosci., 15:l-29. A consideration of the physical and optical properties of visual organs across all of animal phylogeny.
Shepherd, G. M. 1994. Neurobiology. 3d ed. New York: Oxford University Press. A concise text that considers several sensory modalities in both vertebrates and invertebrates.