06 Marico AR 2012 MDA ver11 N - Moneycontrol.com · Dear Shareholders, It is my privilege to write...
180
Transcript of 06 Marico AR 2012 MDA ver11 N - Moneycontrol.com · Dear Shareholders, It is my privilege to write...


index
Dear Shareholders,
It is my privilege to write to you at the end of another eventful year at Marico.
This year, your Company continued to focus on expanding its consumer franchise and grow in volumes. We strengthened our
position in all categories and geographies in a challenging macro-economic environment. The steady growth was enabled by
sustained investments in marketing and brand building, distribution expansion in rural markets in India and driving operational
efficiencies across the value chain.
The year had its set of challenges. Delay in policy implementation, persistent double digit inflation, high interest rate scenario
and unfavorable currency movement were only a few of the roadblocks faced by the Indian economy. In our international
markets too, the current environment presents a host of challenges. Inflation continues to remain high in Bangladesh and
South East Asia. The overall environment in the Middle East and North Africa is relatively better but not without instances of
sporadic protests and disturbances. None of these challenges are new; they have stayed with us in some form through the
last couple of years.
Your Company, despite all challenges, recorded a revenue growth of 28% and Net Profit growth of 11% in FY12. This makes
it a 5-year CAGR of 21% in Revenue and 23% in Net Profits. The domestic consumer business grew 37%, driven by a strong
14% volume growth. International business grew by 30% with robust volume growth and market share gain in all geographies.
The integration of International Consumer Products Corporation, a leading FMCG company in Vietnam acquired in February
2011, has been completed successfully. It is growing at a very healthy rate and is gaining market share in the male grooming
segment.
Kaya has been consciously trying to change its positioning from “cure” to “cure care”, moving from expert solution provider
for skincare problems to a personal guide for total skin care. It also continues to introduce more Derma Rx products in India,
as increased product sales will generate more throughputs from the clinics. The business has sustained the top line growth
trend for the past few quarters on a same store basis, indicating early signs of the business moving in the right direction.
We have identified inorganic growth as a significant building block to create value for you over the long term. In line with our
acquisition philosophy of participating in our focussed categories where we believe we can add value, we have entered into an
agreement to acquire the personal care business of Paras Pharmaceutical Ltd. from Reckitt Benckiser. Brands in the portfolio
rank No.1 in the hair gels and leave-on hair serum categories, and No.3 in the male deodorant category. This acquisition will
give Marico access to a portfolio of youth brands that shall fast-forward our journey towards creating a portfolio for the future.
The portfolio addresses the grooming needs of the youth and is supported by India’s demographic profile. The Company will
also leverage its distribution strength in India to provide a fillip to the growth of the brands. The acquisition of this business is
expected to further reduce our dependence on edible oils and hair oils.
Our sustainability initiatives have gathered momentum over the last few years. The 4th edition of The Innovation for India
Awards was organised by Marico Innovation Foundation in March 2012. India is clearly burgeoning with talent. The Innovation
for India Awards acknowledge and encourage ideas that impact the community at large. Within the organization, our initiatives
have significantly helped in reducing usage of energy, water and paper. Our target is that each of our business strategies and
processes elegantly passes through a Green filter.
Overall the Company is well positioned to participate in the growth that is happening in the FMCG industry in India and other
emerging markets. We hope that you will continue to support us in the same way that you have stood by us over the years.
I would like to take this opportunity to thank each and every one of our stakeholders for their trust and encouragement.
&
With warm regards,
Harsh Mariwala
Chairman and Managing Director
chairman s letter
to shareholders
’
a personal message
01


urban income mix is favorable for the FMCG industry.
Apart from the better value growth in the urban
market, it provides an opportunity to launch
innovative premium products.
Women in urban India are also changing in their
quest to break from their traditional image in society.
They are increasingly assertive and feeling more
secure to venture out to the stores and buy things on
their own. A growing number of high-profile women
desire the best and are creating a niche market for
themselves. A widespread feeling of self-indulgence,
which is leading to self-pampering in the form of
beauty services and vacations, is emerging. These
women are often the biggest potential buyers of
niche high-quality, high-end products.
Modernization has led to changing aspirations
where the need to be good looking, well-groomed
and stylish has taken on a newfound importance.
Indian men are also becoming conscious about their
appearance, creating a market for male grooming
products. Today’s men are less inhibited when it
comes to looking good and do indulge in image
enhancing products and treatments. The categories
witnessing significant growth include men’s face
creams, hair gels and deodorants.
A part of the trend to look fitter and well
groomed is the increasing emphasis on a healthy
lifestyle. With increasing income, Indians are
becoming health conscious leading to a change
in lifestyle. Food is the largest consumption
category, accounting for 31% of what India spends
on today . With growing awareness, product
acceptance among the masses has also increased.
The market for products that reduce stress, prevent
aging, help the heart and fight diabetes are all on
a growth curve. The health food market stood at
INR 9,000 crore in 2010, and is expected to grow
at a CAGR of 20% to INR 22,500 crore by 2015 .
The health food contribution in packaged food,
i.e. 10% in India, is on the lower side when
compared to the global average of 25-30% . With
more companies focusing on products with a
strong health and wellness quotient, the consumer
awareness about healthier options of food
consumption will increase.
Another significant emerging segment of the
market is the rural sector, which currently accounts
for 70% of India’s population. The rural market is
being driven by growth in non-agriculture income,
better MSP (Minimum Support Prices) rates, higher
education, wealth effect coming from increasing
land values, better infrastructure, increasing media
penetration and the Government’s emphasis on
rural development programmes. With a huge
population base, improvement in rural income has
opened several gates for the industry.
In the last 5 years, rural India has outperformed
the overall FMCG growth. About 50% of the rural
population will come under the INR 90k-200k annual
income range by 2015, as against ~35% in 2005 .
This rise in annual income is expected to favorably
improve the lower middle class and middle class
mix in future. This brings new consumers within
the fold, while existing consumers move up the
value chain. Also, penetration levels across
categories are lower in rural areas compared to
urban, which provide strong headroom for growth.
This will help the industry maintain volume growth
for a long period.
Rising consumption and increasing proportion
of younger population where 70% of Indians will
be of working age in 2025, increasing media
penetration and rising aspiration will further drive
FMCG growth. India’s organized retail is estimated
at USD 28 billion with around 7% penetration
but is expected to grow to 21% and become
a USD 260 billion business over the next decade .
Modern retail offers opportunities to experiment
with new categories. It also gives customers a
chance to educate themselves about new products
which is not the case with a general trade store.
Category creation and market development starts
1
3
3
2
1
This discussion covers the financial results and
other developments during the period April 2011 -
March 2012 with respect to Marico Consolidated,
comprising its domestic Consumer Products
Business (CPB) under Marico Limited (Marico) in
India, its International Business Group (IBG)
comprising consumer products exports from Marico
and the operations of its overseas subsidiaries
and the Kaya skin care solutions business in India
and overseas. The Consolidated entity has been
referred to as ‘Marico’ or ‘Group’ or ‘Your Group’ in
this discussion.
Some statements in this discussion describing
projections, estimates, expectations or outlook may
be forward looking. Actual results may however differ
materially from those stated on account of various
factors such as changes in government regulations,
tax regimes, economic developments within India
and the countries within which the Group conducts
its business, exchange rate and interest rate
movements, impact of competing products and their
pricing, product demand and supply constraints.
The year 2011-12 has been a year of
consumption, with both the Central government-
sponsored schemes and the impact of the Sixth Pay
Revision pumping in large amounts of money in
the hands of the consumers. Asset price inflation
(largely land and gold), drove an increased sense
of affluence amongst the masses. Hike in Minimum
Support Price for food grains and continued
support under NREGS, among other factors, have
driven rural incomes and demand. Despite several
domestic headwinds including high inflation and
interest rates, trade deficit and delay in policy
implementation, Fast Moving Consumer Goods
(FMCG) continued to show robust growth.
The Indian FMCG market size is in excess of
USD 33.4 billion and has grown at ~17% in the
last 5 years. It is poised to grow 3.6 times between
2010 and 2020 , faster than most other emerging
markets. Rising household income, urbanization,
increasing literacy, decline in the traditional
joint-family structure and changing demographics
are key contributors to growth. The most notable
force is average household income, which is set
to rise nearly 3 times between 2010 and 2020 . An
indication of this is the per capita income which
grew by 14% in FY12 to cross the sixty thousand
mark. India’s income pyramid has typically had
a wide base and increasingly smaller layers as
income rises. This pyramid is quickly becoming
a diamond, as per capita income grows.
In an increasingly globalized economy, India’s
lion’s share comes from services. This requires
skilled labour, which is driving the educated
population from small towns and villages into the
top towns and cities of the country. This is leading
to rapid urbanization and expansion of the large
cities (primarily because of poor infrastructure in
the small towns), which will potentially lead to an
inflection in a decade or two, at which point the
urban population will become a sizeable portion
of the total.
By 2020, 35% of India’s population will
live in cities . As people move from rural areas to
cities, they tend to both increase their purchases
as well as spend on different items. Urban dwellers
have better access to goods and are exposed to
greater consumerism. Apart from the change in the
population mix, the urban income distribution has
also favorably changed over a period of time. The
upper class in the urban income group has increased
by about 36% as compared to 7% in 1996 . The rise
in urban population coupled with improvement in the
INDUSTRY STRUCTURE, OPPORTUNITIES
AND THREATS
1
1
1
2
management discussion and analysis
14 15

with modern trade but as more consumers start
consuming this category, they penetrate into other
channels. Organized retail has fuelled new growth
categories - liquid hand wash, breakfast cereals,
ready-to-eat foods, pre-and post-wash products
and hair conditioners account for almost 50% of
their sales. However, a significant share of FMCG
business is still generated through the ‘mom and
pop’ store (kirana) format. With better infrastructure
aiding access to the rural economy, it is likely that
‘mom and pop’ stores will remain the chief point of
interface for the FMCG companies.
India Incorporated is looking to grow
inorganically. It is important to go global not only
to create multiple growth engines but also to
create reverse learning for the home market. The
year gone by has seen a number of overseas
acquisitions made by Indian FMCG companies.
Also, the emerging economies in Asia and Africa
have low-to-medium penetrations in some of the
FMCG categories. This signifies considerable
headroom for growth in the mid-term. Favorable
macros, changing attitudes of the consumers
and progressive policies of the governments also
make these markets attractive destinations. Typically,
gestation periods tend to be longer as one needs
to go up the learning curve in a new market. Some
of them also offer inorganic entry possibilities that
can create access to mainstream distribution,
manufacturing and talent. This can speed up
one’s learning curve as long as there is a strategic
fit with the target.
Overall, a study of India’s private spending data
reveals some fundamental shifts. Hence businesses
across different consumer goods need to carry out
a fresh assessment of the near term prospects of
the Indian economy and the changes in consumer
spending behavior. The FMCG sector is likely to
benefit from these changes and will also get an
opportunity to innovate with new products and
categories while looking at extending its learnings
to other emerging markets.
Domestic commodity prices are often linked
to international indices and volatility in these
benchmarks causes fluctuations in the domestic
product prices, making the business environment
uncertain.
The past few years have witnessed wide
fluctuations in the price of input materials. Crude Oil
touched a record high and saw considerable
fluctuation during the last two to three years.
Moreover, many commodities are often used as
separate asset classes resulting in speculation-led
variations in price trends. As a result, the overall
level of uncertainty in the environment has gone up.
Input costs comprise nearly 60% of the
production costs in the FMCG sector. Inflationary
tendencies in the economy directly impact the input
costs and could create a strain on the operating
margins of the FMCG companies. Brands with
greater equity and pricing power may find it easier
to adjust prices in line with fluctuating input costs.
The equity of a brand generally allows the
organization to pass on the impact of any increase
in cost structure to the consumers. However,
considering the uncertainty in the environment, rising
competitive pressures as well as the long term
objective of expanding consumer franchise, part
of the increased cost may be absorbed by the
organizations.
In situations of economic duress, items which
are discretionary in nature are the first to be
curtailed. This is relevant for the lifestyle solutions
offered by companies. In an extended recession,
down trading from branded products to non-branded
ones could also occur and affect the financial
performance of the Company.
RISKS & CONCERNS
Input Costs
Pricing Power
Discretionary spending / Down trading
Competition
Product innovation and new product launches
Currency Risk
Funding costs
Acquisitions
INTERNATIONAL MARKETS
FMCG market in Bangladesh
FMCG markets in the Middle East
and North Africa (MENA)
The FMCG environment in India and overseas
is competition intensive and companies need to
focus on branding, product development,
distribution and innovation to ensure their survival.
Product innovations help to gain market share,
while advertising and sales promotion creates
visibility for the product. Such expenditures carry
the inherent risk of failure. Counter campaigning
by competitors would also reduce the efficacy
of promotions. Similarly, aggressive pricing stances
by competition have the potential of creating
a disruption.
The success rate for new product launches in
the FMCG sector is low. New products may not be
accepted by the consumer or may fail to achieve
the targeted sales volume or value. Cost overruns
and cannibalization of sales in existing products
cannot be ruled out. Marico has adopted the
prototyping approach to new product introductions,
that helps maintain a healthy pipeline and at the
same time limits the downside risks.
The Marico Group has a significant presence
in Bangladesh, South East Asia, MENA (Middle East
& North Africa) and South Africa. The Group is
therefore exposed to a wide variety of currencies
like the US Dollar, South African Rand, Bangladeshi
Taka, UAE Dirham, Egyptian Pound, Malaysian
Ringgit, Singapore Dollar and Vietnamese Dong.
Import payments are made in various currencies
including but not limited to the US Dollar, Australian
Dollar and Malaysian Ringgit.
As the Group eyes expansion into other new
geographical territories, the exposure to foreign
currency fluctuation risk may increase. Significant
fluctuation in these currencies could impact the
company’s financial performance. The Company is,
however, conservative in its approach and is likely
to use simple hedging mechanisms.
Though the sector is not capital intensive,
fund requirements arise on account of inventory
position building or capital expenditure undertaken.
In addition, growth through acquisitions may also
contribute towards leveraging the Company’s
balance sheet. Changes in the interest regime and
in the terms of borrowing will impact the financial
performance of the Group.
This may take the form of purchasing the brands
or purchase of stake in another company and is
used as a means of gaining access to new markets
or categories, or increasing market share.
Acquisitions may divert management attention or
result in increased debt burden on the parent entity.
It may also expose the Company to country specific
risk. Integration of operations and cultural
harmonization may also take time, thereby deferring
benefits of synergies of unification. Marico is keen on
exploring acquisitions in its core segments of beauty
and wellness, where it believes it can add value.
Bangladesh has a demographic profile very
similar to that of India. A population in excess of
160 million and a developing economy provide the
perfect consumer base for the FMCG sector to
flourish. The GDP has grown at 5-7% over the last
few years and it is amongst the Next Eleven (N-11)
countries identified by Goldman Sachs as having
high potential. Political instability may, however, be
a cause of concern for companies operating in
Bangladesh. Even though the demographic profile
is similar to India, the relatively lower spending
capacity can be a concern, more so in an inflationary
environment.
The Middle East offers a curious mix of a local
Sources: 1) BCG Research 2) Pinc Research 3) Technopak16 17

and expatriate population, who are not averse to the
idea of indulgence / extravagance. This provides
FMCG companies opportunities to offer branded
solutions, tailored to the needs of the consumer in
the region.
The Egypt ian economy has embraced
liberalization in the recent past. Thereby opening
the doors for foreign direct investment and paving
the path to economic growth. It features amongst
the Goldman Sachs list of N-11 countries. A steady
growing population and a developing economy
provides a good base for FMCG companies.
Penetration levels in hair grooming and skin care
products are modest.
MENA region witnessed socio-political unrest
in the second half of FY11. This had an adverse
effect on the economy during FY12. Although the
overall environment in the region is better, it is not
without instances of sporadic protests and
disturbances. Our outlook on the long term trends,
with respect to demand for personal care products
in the region, remains positive.
The South African economy is a productive
and industrialized economy that exhibits many
characterist ics associated with developing
countries, including a division of labour between
formal and informal sectors and an uneven
distribution of wealth and income. The economic
measures such as Black Economic Empowerment
(BEE), adopted by the Government to ensure
growth and equitable distribution of wealth, have
been very effective. South African’s ascension into
BRICS recognizes the country’s potential, placing
it alongside the leading economies of tomorrow.
With 6% of Africa’s population, it accounts for
25% of the continent’s GDP. South Africa also
forms a gateway to the rest of sub-Saharan Africa.
Africa is the fastest growing region after China
and India, boasting unexploited mineral wealth,
60% of the world’s uncultivated agricultural land
and the youngest age profile of any continent.
Vietnam is one of the fastest growing
countries in South East Asia, with a GDP growth
of about 6%. The demographics of the country
are very promising, with an extremely young
population providing an opportunity for FMCG
companies to grow rapidly. The country is in the
process of integrating into the world’s economy,
as part of globalization. Vietnam finds a place in
the Goldman Sachs list of N-11 countries as
a frontier market, indicating an opportunity to invest
but with lower market capitalization and liquidity.
The currency Vietnamese Dong (VND), however,
has shown relative weakness to the US dollar in
recent times.
M a r i c o h a s a w e l l - e s t a b l i s h e d a n d
comprehensive internal control structure across the
value chain, to ensure that all assets are safeguarded
and protected against loss from unauthorized
use or disposition, that transactions are authorized,
recorded and reported correctly and that operations
are conducted in an efficient and cost effective
manner. The key constituents of the internal control
system are:
• Establishment and review of business plans
• Identification of key risks and opportunities
• Policies on operational and strategic
risk management
• Clear and well defined organization structure
and limits of financial authority
• Continuous identification of areas requiring
strengthening of internal controls
• Operating procedures to ensure effectiveness
of business processes
• Systems of monitoring compliance with
statutory regulations
• Well-defined principles and procedures for
evaluation of new business proposals/capital
expenditure
FMCG markets in South Africa
FMCG Markets in Vietnam
INTERNAL CONTROL SYSTEMS
AND THEIR ADEQUACY
• A robust management information system
• A robust internal audit and review system
M/s Aneja Associates, Chartered Accountants,
have been carrying out internal audits for Marico for
a long time. During the current year, Ernst & Young
were appointed as the new business partners to
carry out internal audits across Marico. The work of
internal auditors is coordinated by an internal team
at Marico. This combination of Marico’s internal
team and expertise of a professional firm ensures
independence as well as effective value addition.
The Board takes this opportunity to thank Aneja
Associates for the value they have added to Marico.
Internal audits are undertaken on a continuous
basis, covering various areas across the value chain
like manufacturing, operations, sales and distribution,
marketing and finance. Reports of the internal
auditors are regularly reviewed by the management
and corrective action initiated to strengthen the
controls and enhance the effectiveness of the
existing systems. Summaries of the reports are
presented to the Audit Committee of the Board.
Marico is a professionally managed organization
that has a flat hierarchy, which empowers people
and fosters a culture of innovation. The organization
believes that great people deliver great results and
lays emphasis on hiring right and retaining key talent.
The Company maintains a strong business linkage
to all human resource processes and initiatives.
Marico recruits its talent from the country’s
premier technical and business schools. Marico
looks at talent, not just from a short-term perspective,
but also from a long-term perspective, where people
can be groomed for different roles. The organization
believes in providing challenge and early
responsibility at work, which serves to keep team
members enthused and motivated.
Members’ networks are also tapped into for
“hiring right”. A strong referral mechanism operates
under the brand name “Tareef” (Talent referred by
Mariconians). This benefits the organization in two
ways: the talent referred is usually superior to that
sourced independently in the market and it also
translates into substantial cost savings in the
recruitment process.
The organization has created a favourable work
environment that motivates performance. Marico has
a process of performance enhancement through
deployment of MBR (Management By Results), to
create an environment of challenge and stretch. It is
also linked to a variable element of performance-
based compensation.
The organization believes in investing in
people – to help them develop and expand their
capability. Personal development plans focus on
how each individual’s strengths can best be
leveraged to deliver his or her full potential. External
training programmes and cross-functional exposure
often provide the extra edge in turning out well-
rounded individuals. In line with Marico’s philosophy
of evaluating internal talent first, a structured internal
job posting mechanism, MINTOS (Marico Internal
Talent Opportunity Scheme) is in place. This is an
internal forum for members to benefit from
opportunities within the organization.
Marico continues to measure and act on
improving the “engagement levels” of its teams.
The Aon Hewitt Survey provides the organization
with a measure of how it is faring at building
engagement across the organization as well as
within each of its teams.
Marico had articulated a contemporary set of
values six years ago and it is important that all
members in the organization are aware of and
consciously practise these values. To build
consciousness and commitment, “Values Workshops”
are held for the teams to identify their focus areas
and plan action accordingly.
HUMAN RESOURCES
18 19

Specific initiatives are underway to standardize
Marico HR practices across international locations –
the Middle East, Bangladesh, Egypt and South Africa.
The “Popcorn with Harsh” sessions continued
last year as well. It is based on the concept of
“Learning through Sharing”, where members have
an opportunity to directly interact with Chairman and
Managing Director, Harsh Mariwala. The sessions
seek to leverage Marico leaders as mentors and
coaches Mariconians at large.
At Marico, the overall well-being of members
is an important priority. The member well-being
program looks holistically at physical, emotional
and financial aspects of an employee’s well-being.
The various initiatives run during the year included
a Member Assistance Program in association with
1 to 1 help.net, a counseling service run by a team
of qualified and experienced counselors; a physical
well-being program that provided personalized
diet, lifestyle and physical training by a panel of
health experts; and financial well-being through
customized financial planning programs.
Employee relations throughout the year were
supportive of business performance. As on March
31, 2012, the employee strength of Marico Limited
was 1080 and that of the entire group was 3066.
Marico believes in aligning the interest of all
stakeholders in the environment in which it operates
– its shareholders, consumers, members, associates,
government and society. Promoting conscious
capitalism is an important step towards fulfilling
the Company’s purpose. Marico has chosen the
following areas of focus to make its contributions
towards society and to function responsibly in
respect of the impact its operations have on the
environment.
Innovation is a crucial way to leapfrog into the
center stage of global business leadership. Based
on this cornerstone, Marico instituted its CSR
initiative in 2003 by forming the Marico Innovation
Foundation. The Foundation provides a framework
to industry and the social sector to leverage
innovation for quantum growth. The Foundation
plays the role of a catalyst and works towards
creating an innovation eco-system through
cutting-edge research, knowledge creation and
dissemination. Its recognition platform - Innovation
for India Awards - biennially awards breakthrough
innovations from India.
One of its popular researches resulted in
a best seller publication – “11 mission biographies -
Making Breakthrough Innovation Happen: 11 Indians
who pulled off the impossible”. This publication is
a culmination of a six-year joint discovery effort to
identify genuine breakthrough innovations from
within India, and then uncover cutting-edge insights
into what these innovations did differently, to make
the impossible happen.
Through its upcoming Innovation Publication,
the Marico Innovation Foundation looks to spread
innovation knowledge that will enable organizations
emerge with innovative thinking and use this to
address challenges. MIF felt the need to
continuously generate this knowledge and create
a regular channel to disseminate this information.
To recognise and applaud outstanding
leadership with innovative focus in sectors, the
Marico Innovation Foundation in institutionalised
the Innovation for India Awards. These Awards
acknowledge and foster leadership with innovative
focus in various business and social sectors. From
2010, a new category - Public Governance - has
been introduced to recognize innovations where
the Central or State government or any wing of the
government including public-private partnership has
innovated. The intent of the Awards is to reward
projects and businesses that make a real difference
to India and the community at large. Based on the
CORPORATE SOCIAL RESPONSIBILITY
Marico Innovation Foundation (MIF)
2006
criteria of uniqueness, impact and scalability, India’s
Best Innovations are declared biennially.
Since 2006, 41 innovators have been
recognized, including organizations like Kirloskar
Brothers, BOSCH MICO, Su-Kam, Titan, Azim Premji
Foundation, Trichy Police, ITC IBD, Reliance KGD6,
Tutor Vista, Goonj, PRS Legislative, Tata Chemicals
and TERI, Gujarat Government’s Jyotigram Yojana,
Defence Institute of High Altitude Research (DIHAR),
Pilani Soft Labs Pvt. Ltd (Red Bus), IndiGo Airlines,
Akshaya Patra, St. Jude India and EMRI. Bharti Airtel,
Tata Nano and the UIDAI – Aadhar programme
of the Planning Commission, Government of India
were recognized as Global Game Changers for their
spirit of Innovation.
To extend the Marico Innovation Foundation’s
catalytic approach towards innovation, it organizes
Innovation Workshops for social enterprises. The
purpose of these workshops is to enable social
organizations to apply innovation as a key tool to
significantly increase their social impact and scale
programs. Post the workshop, a detailed analysis
of the organization is done. After this, organizations
are selected for a 12-18 month innovation incubation
program. Two prototypes have successfully been
implemented in Mumbai and Bangalore over the year.
One was a social
organization providing employability training to young
people who have either dropped out of formal
education or are at a risk of having no real livelihood
options. The intervention helped the organization to
devise a new model for imparting training that
exposed them to real life learning and earning
scenarios, resulting in a staggering six times growth
in the total number of youth impacted.
Another organization which was incubated was
which is developing scientific and
holistic ways of disposing solid wastes that impacts
people, the planet and profits. Earlier they operated
in a disconnected manner with waste disposal units,
and faced shortage of land space, a major factor
for disposing waste. After applying the new model
developed under the guidance of MIF, the social
organization managed to integrate all stakeholders –
waste pickers, waste generators, waste recyclers
and entrepreneurs, in an inclusive and mutually
value creating manner. This led to the electronic city
contracts to manage 10-15 metric tonnes of solid
waste every day, up from 1.5 metric tonnes. This
prototype has been replicated by the Electronics
City Association in Bangalore, which is now funding
80% of the operational cost of the prototype.
The Foundation along with its partners will also
be mentoring and providing resource support for 5
organizations, from the 2012 World Bank Developing
Marketplace Winners in India. The Foundation aims
at becoming a nodal agency for disseminating
World Bank resources to social organizations in India.
‘Yuva Parivarthan’,
‘Waste Wise Trust’
20 21

Through the knowledge disseminat ion
mechanism, the Foundation is able to propagate
the findings of the researches through large-scale
mass platforms across India.
Sustainability Report is about disclosures on
non-financial aspects of business. The reports are
generally made on the GRI-G3 (Global Reporting
Initiative – 3rd Generation) guidelines, covering the
company’s performance in following fields:
1. Economic
2. Environmental
3. Social
Marico has been working in various areas related
to sustainability over the past few years. There have
been a wide range of initiatives across energy
conservation, water conservation, CSR and waste
disposal, apart from business initiatives involving
communities such as farmers and associates.
Marico organizes an annual reward program
“Keraratna”, for farmers associated with Marico
Copra Collection Centres, to motivate small-scale
farmers to stay active in the market and keep
away from speculation, thus reducing financial
losses. This initiative also aids in creating a long-term
mutually beneficial relationship with the farmers.
A cluster farming and coconut producers’
society was formed in Kerala to drive cluster
activities. It acts as a channel between the
Coconut Development Board (CDB) and farmers,
enabling farmers to access CDB initiatives,
achieve higher yield/productivity and improve
earnings per acre. The society also helps farmers
receive various government benefits like free
fertilizers and intercrops.
Marico also organized training programs with
industry experts, educating farmers on quality
standards, inspection methods, storage of copra and
latest developments in farming/conversion process,
enabling them to get a good price for their produce.
Contract farming for safflower was undertaken
on around 10,000 acres of land which would
have otherwise been barren in the rabi season.
The Company also converted vendors from the
non-edible grade of raw rice bran oil to the edible
grade, thereby increasing their profitability.
Marico encourages farmers to adopt the practice
of briquetting, which helps improve farmer realization
and also provides a greener fuel.
Marico gives utmost importance to the health
and well-being of its members and organizes various
workshops and seminars throughout the year to
help them in their overall development. This year, a
parenting workshop was organized at the corporate
centre, to build greater awareness and sensitivity in
teams that include Marico Mothers, through focused
sessions. The workshop, conducted by a counsellor,
covered the key topic of how to build a better
relationship with your child, given that there are
only a limited number of hours that are spent at home
by working mothers and how to balance domestic
and professional duties. It included sessions by
a nutritionist to share recipes and talk on nutrition
for children (of varied age groups) and child health.
Sustainability reporting initiative in Marico
Associates
Members
Other sessions conducted at certain plants focused
on educating parents about their behaviour towards
their child during examinations and their role in
planning their career.
Yoga classes were launched to help members
live a more balanced and stress-free life. Free
professional and confidential counselling is also
provided to the members. On International Women’s
Day, a session was conducted for women members
of Marico on ‘How women get ahead’. It covered
topics such as dealing with stereotypes and creating
a professional image at work. Apart from these
initiatives, investment and safety workshops are
organized at all plants for members and health and
safety seminars are conducted for contract workers.
Reinforcement training like fire-fighting is compulsory
at least once a year at all plants.
Marico was once again a part of the ‘Joy of
Giving Week’, popularly referred to as India’s own
‘giving festival.’ Members from all locations
participated, and contributions touched an all-time
high. This year, we reached out to more than 2000
people. Mariconians also contributed by lending their
expertise; for instance, the Marketing team worked
with NGOs on a voluntary basis to help them create
a brand image for their enterprises.
Apart from this, assistance was provided to
neighbouring communities through scholarship
awards for meritorious students, and contributions
towards repairing roads and places of worship.
Cleaning of the PIPDIC estate was undertaken by
the Pondicherry plant members. Help was extended
during a fire at Jain Irrigation factory at Jalgaon.
At its Baddi plant, Marico launched an initiative
by which all open land spaces would be converted
into a green belt, using the ETP processed water.
Fuel consumption was reduced in Kanjikode. Several
initiatives were taken to reduce CO2 emissions in
Pondicherry and Jalgaon. 500 coconut trees were
planted in coastal districts across Bangladesh. Most
of the trees on the new plant site in Bangladesh
were re-planted and in some cases roadways and
drains were modified to avoid cutting trees.
Any company taking up Sustainabi l i ty
Management typically has the following approach.
In 2011-12 Marico started its journey towards
a sustainability report, and is currently putting
a Sustainability Management Framework in place.
This will help the company to collate sustainability
information in a structured manner. The Company
has engaged CII as a knowledge partner for
preparing the Sustainability Report and helping to
set up a Sustainability Management Framework.
In this regard, the following steps were taken:
Society
Green Initiatives
Sustainability Management
Sustainability Management at Marico
Sustainability Vision and Policy
Core Sustainability Team
at Corporate Level
Internal & External Stakeholder Dialogue
Identifying & Prioritizing
Sustainability Challenges and Risks
Planning Activities for Sustainability
Performance and Allocating Resources
Monitoring Activities and Performance
Reporting Sustainability Performance
Reviewing through Monitoring and
Stakeholder Feedback
22 23

A cross-functional team was created for
Sustainability Reporting. The team comprised
two representatives from each manufacturing
location, one each from HR, Finance, Company
Secretariat, Quality Assurance, Product
Integrity Management, Supply Chain and
3P Manufacturing.
Key stakeholders
were identified and the modes of engagement
with them were listed. This was done to avoid
re-inventing the wheel.
The core team, along with CII
consultants, visited key manufacturing locations of
Marico. The visits helped to train other members
in manufacturing locations on the basics of
sustainability. At the same time, sustainability
challenges were identified at each site.
During this phase, data for
the past two years was collected from each
manufacturing location on all aspects of
sustainability.
Based on the data
shared, CII shared their comments and
rectifications in data collection methodologies.
Based on the data collected and stakeholder
engagement outcomes, projects shall be
suggested by CII in areas where the
sustainability performance needs improvement.
These projects will be undertaken during FY13.
The data collection on sustainable
indicators and monitoring of the projects will
ensure that a sound sustainability management
framework is put in place. This will be a stepping
stone towards sustainability reporting.
Once the framework
is in place along with strong systems, Marico
plans to publish its Sustainability Report and
share it with all its stakeholders. We expect this
to take place in the near future.
A task force comprising members from various
functions in the Company’s corporate office as well
as manufacturing locations has been formed. This
year, the focus is on Marico’s 7 manufacturing
locations in India viz. Kanjikode, Pondicherry, Goa,
Jalgaon, Baddi, Dehradun and Paonta Sahib.
CII conducted awareness training on GRI
guidelines for the members of the sustainability task
force. This training covered GRI G3 guidelines in
detail along with other sustainability reporting
aspects. Later, CII consultants also visited the
manufacturing locations to help with data collection
for sustainability indicators and to train other
members at the manufacturing locations on aspects
of sustainability.
The Company has begun capturing data for
some of the environmental indicators. These include:
• GHG emissions
• Effluents
• Electricity consumption
• Energy conservation initiatives
• Water consumption
• Waste disposal
Marico also has systems to collect information
regarding labour, as required for compliance by
various authorities.
However, the Company still needs to set up
systems to accurately measure the impact of
various initiatives particularly Society and Human
rights indicators. The company plans to set up these
systems this year.
Marico will initially focus on manufacturing
Creation of a Sustainability Task Force:
Stakeholder Engagement:
Site Visits:
Data Collection:
Comments from CII:
Planning for Sustainability Performance:
Setting up Sustainabil ity Management
Framework:
Sustainability Reporting: plants in India, as these locations are the most
significant from the point of view of sustainability
risks. The Company will look to expand its reporting
boundaries in the years to come.
Marico achieved revenue from operations of
INR 4008 crore during FY12, a growth of 28% over
FY11. The volume growth underlying this revenue
growth was healthy at 17%. Profit after tax (PAT) for
FY12 was INR 317 crore, a growth of 11% over FY11.
Over the past 5 years, the top line and bottom line
have grown at a compounded average growth rate
(CAGR) of 21% and 23% respectively.
Parachute, Marico’s flagship brand, continued
to expand its consumer franchise during the year.
Parachute coconut oil in rigid packs, the focus
part of its portfolio, grew by about 11% in volume
as compared to FY11.
Mar ico has cont inued to dr ive
conversion from loose oil usage to branded
oil. Small packs helped to drive this growth.
It is estimated that the loose market
comprises about 40% of the coconut oil
market in volume terms. This is expected to
continue to be a source of growth in the
medium term.
During FY12 Parachute improved its market
share in the coconut oils segment by 130 bps.
The inflationary environment in the key input prices
of coconut oil has kept the competition from the
local/regional players relatively soft. However, the
downward correction in the input prices could
see the return of competition from some of the
local players.
During the 12 months ended March 2012,
Marico’s volume share represented by brands
Parachute and Nihar, in the approximately INR 2300
crore (USD 460 million) branded coconut oil segment
in India, was ~ 55.2% (FY11: 53.2%). Marico’s share
in coconut oil in the rural markets, however, is lower
at 39%. This provides headroom for growth in rural
areas through market share gains.
The Saffola Oils franchise grew by about 11%
in volume terms during FY12 compared to FY11.
The brand has recorded healthy volume growth
over several quarters, indicating strong brand equity
and a category tailwind.
Saffola has been, over recent years, leveraging
the consumer trend of proactively managing a
healthy lifestyle. Adopting Saffola is one of the
shifts that consumers continue to make. The Saffola
range of blended refined oils (available in four
variants) operates in the premium niche of the
refined edible oils market. Saffola refined oils are
estimated to reach about 2.5 million households of
the 21.4 million SEC A/B households in India. With
rising awareness about heart health in the country,
this provides significant headroom for growth. The
brand maintained its leadership position in the
super-premium refined edible oils segment, with a
market share of about 58.2% during the 12 months
ended March 2012 (FY11 53.1%).
Saffola would, in the longer term, establish
itself as a leading healthy lifestyle brand that offers
THE MARICO GROWTH STORY
CONSUMER PRODUCTS BUSINESS (INDIA)
Parachute and Nihar in India
Saffola
24 25

healthy food options for all meals. The Company
has prioritized the breakfast space in the near term.
Last year it entered the breakfast cereals market
with the introduction of Saffola Oats. This has met
with a favorable response, with trials building
rapidly. Encouraged by this, the Company
commenced a prototype with savory variants of
oats in Tamil Nadu and later extended it to Kerala.
The Company plans to extend this prototype to
other parts of South India in a phased manner.
Marico has about 14% value market share in the
oats category and has emerged as the number two
player in the category. The participation of multiple
players in the oats market is helping to fast-forward
growth in this category.
The Company will continue to innovate in the
packaged food space and prototype new products
in the near future.
During the year, all Marico’s hair oil brands
recorded healthy growth. The Company’s hair oils in
rigid packs volumes grew by about 24% over FY11.
Marico’s hair oils franchise had achieved market
share gains during FY11 and has continued to do so
in FY12. There has been a positive shift of around
132 basis points in FY12 compared to FY11. Its
volume market share during the 12 months ended
March 2012 was about 24.1%, up from 17% about
5 years ago. These market share gains have been
achieved through providing consumers with specific
solutions, product innovation, packaging restaging,
participation in more sub-segments of the value-
added hair oils category, continued media support
for some of the brands and penetrative pricing action
in others, and expansion of Marico’s retail reach in
the rural markets.
Marico offers its consumers a basket of value-
added hair oils for their pre-wash and post-wash hair
conditioning, nourishment and grooming needs, in
the approximately INR 3800 crore (USD 760 million)
branded hair oils market. Hair oiling remains a deeply
ingrained hair conditioning habit in the Indian sub-
continent. The Company has carried out scientific
research and conducted successful clinical trials
to establish the benefits that hair oiling provides
to consumers. With rising incomes in India there
exist increasing opportunities to serve consumers
looking for value-added options to their hair oiling
needs. In recent times, it has been one of the fastest
growing FMCG categories in the country.
The Company’s aim is to participate in all the
sub-segments and have a wider portfolio to drive
growth. This is being achieved through the
introduction of new products such as Parachute
Advansed Ayurvedic Hot Oil, Parachute Advansed
Ayurvedic cooling oil and Parachute Advansed
Ayurvedic Hair Oil. All these have grown the overall
hair oils franchise by bringing specificity and
creating more occasions for use. Nihar Shanti Amla
continues to gain market share on the back of
disruptive pricing and achieved a volume market
share of about 18.6% for the 12 months ended
March 2012 in the Amla hair oils category. The
Company is now focusing on scaling up its presence
in these sub-segments.
Marico, being an FMCG company, has to
create a healthy pipeline of new products so that
they become growth engines for the future. In
order to identify scalable marketing and product
propositions, Marico follows a prototyping approach
to test the products before launching in a low-cost
fail-fast model.
Hair Oils
Prototypes and New Launches
In order to invest in new product initiatives,
Marico follows a Strategic Funding (SF) approach.
Marico defines SF as the negative contribution
a product makes after providing for material costs,
variable manufacturing and distribution costs and
advertising and sales promotion expenditure for
the product. Each year the Company budgets for
a certain percentage of its Profit Before Tax to be
available towards strategic funding for new products
and businesses. All new products would have to
fight for these resources. As the Company’s bottom
line grows, the SF pie grows larger. This provides
sufficient investments towards creating future growth
engines and at the same time puts an overall ceiling
to the SF at the group level.
During the year, the Company continued the
process of prototyping and launching. Encouraged
by the favorable response to Saffola Oats, the
Company is prototyping savory variants of oats in
Tamil Nadu and Kerala. These variants will be
extended to other parts of South India in a phased
manner.
Marico had started a prototype of Parachute
Advansed Body Lotion in West Bengal in September
2010. This is in line with the Company’s strategy to
participate in the Beauty and Wellness space –
specifically in Hair Care and Skin Care. Encouraging
results of the prototype led to a launch on a national
basis during Q2FY12, supported by high impact
marketing. Recently, the Company also introduced
a summer variant. Feedback from consumers and
the trade is very positive. Parachute Advansed Body
Lotion has achieved a market share of ~7% within
a short period of time.
In line with the Company’s aim to participate
in all the sub-segments of Value Added Hair Oils,
new products such as Parachute Advansed
Ayurvedic Hot Oil, Parachute Advansed Ayurvedic
cooling oil and Parachute Advansed Ayurvedic Hair
Oil were launched during the year.
The Company believes that even though the
category is competitive, there is a lot of head
room for growth. The penetration levels are still less
than 20%. The total skin care segment is estimated
to be around INR 5000 crore (USD 1 billion), of which
the body care segment is around INR 1300 crore
(USD 290 million).
Marico’s International FMCG business (its key
geographical constituents being Bangladesh, MENA
(Middle East and North Africa), South Africa and
South East Asia) comprised ~24% of the Marico
Group’s turnover in FY12. IBG continued its growth
journey, clocking a turnover of INR 955 crore
(USD 191 million) during FY12. This denotes a
growth of about 30% over FY11, boosted by the
acquisition of 85% equity in International Consumer
Products in Vietnam in February 2011. The EBITDA
margin for the year stood at approximately 11%.
The business environment in Bangladesh has
been challenging. Overall economic crises and
liquidity crunch impacted the business. High inflation,
including food inflation and a sharp depreciation in
the Bangladeshi Taka versus USD, has resulted
in cost push and resistance to retail price increases.
Consequently, volume growth and margins have
both been under pressure. Despite a challenging
macro-economic environment that has put pressure
on volume growth, on a like to like comparison (after
adjusting MODVAT), our Bangladesh business
posted a business growth of 11% during the year.
Parachute was able to hold its market share of
about 80% in the branded coconut oil market,
INTERNATIONAL FMCG BUSINESS GROUP (IBG)
Bangladesh
26 27

suggesting strong brand fundamentals. It continues
to be among the top 5 most trusted brands for
the third consecutive year (Source: Bangladesh
Brand forum). Parachute continues to play out its
market expansion strategy by converting loose oil
users to packed branded coconut oil.
The Company is building upon its strategy of
leveraging the extensive distribution network created
by Parachute. Hair Code hair dye has achieved
29% value market share, thus establishing itself
as the number one player in the hair dye market.
The Company plans to extend the brand into the
liquid hair dye segment during the coming year.
In the INR 150 crore value-added hair oils space,
the Company strengthened its presence through
increased volumes of Parachute Beliphool, a light
hair oil with a floral fragrance, and Parachute
Advansed Cooling Oil. This has resulted in an
increase in market shares. During Q4FY12, the
Company also introduced three variants of value-
added hair oils under the brand Nihar. The Company
now has about 14% market share in the segment.
The overall business environment in the region
was much better this year, despite sporadic
instances of protest and unrest. Some of the
territories that still face instability, such as Libya,
Yemen and Syria, are yet to return to normalcy in
terms of operations. However, they comprise only
about 5% of Marico’s business in the MENA region.
The Hair Code brand performed well during the
year. The re-stage of the brand along with the new
visual identity and the spout sachet packaging
innovation, continues to yield good returns. This
change was well supported with 360-degree
marketing initiatives. The re-launch also helped
the Company deal with counterfeit issues. Fiancée
was backed by a campaign reinforcing its VFM
positioning.
Marico has continued to leverage local
consumer insights. It has launched a new range of
Hair Oils and Hammam Zait under Parachute
Secrets. This range leverages the tradition and belief
amongst Arab women about the hair nourishment
properties of certain ingredients. The response has
been positive. To strengthen the core equity of its
offerings, the Company has also re-staged
Parachute Gold creams and hair oils across the
Middle East markets. The response to the new range
is encouraging.
The South African business recorded a double
digit Y-o-Y growth over FY11. The turnover for FY12
crossed the INR 100 crore mark. Caivil Just for Kids
consolidated its leadership position in the kids’
hair care market. Given the inflationary situation, the
market has been witnessing some degree of down-
trading. However, Marico’s representation in the VFM
segment through Black Chic was able to capitalize
on this trend. Overall, Marico’s hair care brands have
been growing steadily and improving their market
shares in the ethnic hair care market in South Africa.
The business environment in Vietnam remained
challenging through the year, with high rates of
inflation and cost push in power and fuel. The
Vietnamese Dong has remained weak, leading to
a rise in the cost of imported materials.
MENA (Middle East and North Africa)
South Africa
South East Asia
Amidst this, X-Men, a leading men’s grooming
brand, saw an uptick in its market share in the
men’s shampoo category, to ~47%, aided by the
launch of the new 4-Step X-Men campaign.
Apart from the thematic TVC for shampoo, the
campaign prompts a full male grooming regimen,
with X-Men extensions in shower gel, face wash
and deodorant. The thematic campaign has been
supported by a 360-degree surround PR, including
a digital campaign, outdoor visibi l i ty and
merchandising. The other business segments
of Skin Care and Foods are tracking as per plan.
The integration of operations is on track. The
Company has also started using Vietnam as
a manufacturing hub for its operations in Malaysia.
Marico’s Malaysian business continues to
grow at a very healthy rate. Code 10 has responded
well to the brand re-stage and the Company
has recently launched range extensions in male
hair styling.
Kaya now offers skin care solutions –
technology-led cosmetic dermatological services
and products – through 107 clinics: 82 in India
across 26 cities, 19 in the Middle East and 2 in
Bangladesh, in addition to the 4 Derma Rx clinics
and medispas in Singapore and Malaysia.
During FY12, Kaya achieved a turnover of
INR 279 crore (USD 55.8 million). The Kaya business
in India and in the
Middle East achieved
same store collection
growth of 15% during
FY12 as compared to
FY11. Kaya has thus
sustained the topline
growth trend for the
past 6 quarters on
a same store basis,
indicating early signs
that the initiatives taken thus far are yielding results.
Derma Rx also reported a healthy double digit top
line growth.
This has been achieved through several
initiatives:
• Introduction of regular skin care services
at affordable price points to serve as traffic
generators. During the latter part of FY11 and
FY12, Kaya introduced a range of everyday
skin care services like facials and aqua jet
peels. Unlike ordinary facials, these services
are created especially by dermatologists
who combine the best of science and nature
to give consumers a rehydrated, rebalanced,
smooth, supple and brighter skin. These
services are not in the nature of problem
solution which means that they can be availed
of after short periodic intervals, leading to
regular foot falls in the clinic.
• Unlocking of portfolio synergies by
introducing products from Derma Rx in India.
These have experienced good acceptability
from clients.
• A new bridal skincare program.
• A 360-degree campaign on Juvederm XC
(dermal filler for anti-ageing) rolled out across
key markets in order to penetrate the anti-ageing
market.
• The Milestone program, designed to bring
back customers who have not transacted
with Kaya in the recent past – one of Kaya’s
CRM initiatives.
Kaya has consciously made a shift in its
positioning from “cure” to “cure care”, moving
from expert solution provider for skincare problems
to personal guide for total skin care. The new
tagline ‘Love what you see’ is an expression of
Kaya Skin Care Solutions
&
28 29

how consumers feel after a visit to Kaya. This
re-branding will be rolled out across all Kaya Skin
Clinics in India, product packaging and advertising,
in a phased manner.
The products from Derma Rx introduced in India
continue to gain good traction. Apart from these,
Kaya also introduced a few other products in the
Indian market during the year. About 23% of the
revenues from Indian operations now come from
the sale of products. This ratio was static at about
13% before the Company started focusing on
products. The company will continue to introduce
more products in India in a phased manner.
Derma Rx products are in the process of being
introduced in the Middle East too. A launch is
expected in Q1FY13. We believe that these
launches make Kaya’s product range more
comprehensive. Higher product sales will generate
more through-put from the clinics and help improve
their ROCE.
During FY12, Kaya recorded a revenue growth
of about 34% over FY11 and made a loss of
INR 29.1 crore (USD 6.4 million) at the PBIT level.
Losses at PBIT level for FY11 were about INR 32.5
crore (USD 8 million).
We believe that compared to the CPB or
IBG, Kaya is a much younger business and
encapsulates an emerging business model. Its
distributed locations make it a complex business
to manage, from the point of view of customer
interfacing as well as business control. We have
launched initiatives in both these areas. Our focus
is on building sustainable consumer bases, as
partially explained above.
Our focus has also been on rationalizing
operations and costs. We are conscious of the
fact that most costs in Kaya are front-ended and
therefore we have to constantly ensure that the
carrying cost of all our assets reflects current reality.
There has therefore been a drive in Kaya towards
greater automation and scrutiny across all its clinics,
in India and overseas. The constant re-assessment
of asset values across Kaya has led to varying
accounting changes. We expect this to continue
for some time.
Thus, the current phase of securing consumers
and ensuring cost effectiveness will hold out for
some time. This will keep Kaya in an investment
phase for a few more quarters.
1. The above ratios are before considering
the effect on non comparable items to
enable like to like comparison.
2. The year witnessed steep inflation in prices
of input materials as compared to last year.
Market price of Copra, the input for coconut oil,
which accounts for about 40% of the Group’s
raw material cost, was about 20% higher in
FY12 on a YoY basis. Market prices of
Safflower Oil and Rice Bran were up by 28%
and 34% respectively on a YoY basis. The
Company chose to pass on a part of the input
cost increase to consumers.
3. There has been a marginal increase in ASP as
a result of investments made by the Company
behind existing brands and new initiatives.
4. The company endeavors to keep its absolute
margins per unit within a band. A significant
increase in realizations per unit will result in
COST STRUCTURE FOR MARICO GROUP
Notes:
reflecting a lower margin in percentage terms.
Over the years, Marico has been maintaining a
healthy Return on Capital Employed (ROCE). Given
below is a snapshot of various capital efficiency
ratios for Marico Group:
*
1. There has been a marginal decline in the
Group’s ROCE in FY12 compared to FY11
mainly on account of the investment made by
the Company in new products. The Company
also chose to pass on only a part of the cost
push to the consumer leading to contraction in
operating margins.
2. The Net Debt position of the Marico Group as of
March 31, 2012 is as below:
The Company may roll over some of the
loans when they fall due during the year or
redeem investments for repayment. Marico has
adequate cash flows to maintain healthy debt
service coverage.
3. The Debt denominated in foreign currency is
either hedged or enjoys a natural hedge
against future probable exports the hence the
MTM differences are routed through the
balance sheet rather than the income statement.
4. The Company periodically reviews and hedges
the variable interest liability for long term loans
using Interest Rate Swaps.
Marico has focused on deploying its resources
in avenues which will result in maximization of
shareholder value. Continuing with this policy, the
Board of Directors of Marico has decided to follow
a conservative dividend policy and deploy its internal
accruals to fuel organic and inorganic growth. The
broad direction is to maintain the absolute amount
of dividend as paid out in the previous year. On a
growing profit base, the payout ratio would be lower.
However, if we do not find any suitable avenue to
deploy funds in the near term, we will repay the
debt on the balance sheet and re-look at the dividend
payout ratios.
The Company had declared interim dividends
of 30% and 40% during the year. With this the
dividend declared for FY12 is 70%. The payout
ratio on the annual profit after tax is 15.8%.
The Company has remained conservative on
its dividend payout. As the Company continues
to explore inorganic growth opportunities to
complement its organic growth plans, it continues
to conserve cash.
Marico achieved revenue from operations of
INR 4008 crore during FY12, a growth of 28% over
FY11. The volume growth underlying this revenue
growth was healthy at 17%.
CAPITAL UTILIZATION
SHAREHOLDER VALUE
Dividend Declared
Results of Operations – An Overview
Turnover Ratios calculated on the basis of average balances
% to Sales & Services (net of excise) FY12 FY11
Material Cost (Raw + Packaging) 52.3 51.6
Advertising & Sales Promotion (ASP) 11.5 11.3
Personnel Costs 7.6 7.3
Other Expenses 16.2 16.5
PBDIT Margins 12.5 13.3
Gross Margins (PBDIT before ASP) 23.9 24.6
Ratio FY12 FY11
Return on Capital Employed 25.5% 27.4%
• Marico Group
Return on Net Worth (Group) 28.4% 32.0%
Working Capital Ratios (Group)
• Debtors Turnover (Days) 17 19
• Inventory Turnover (Days) 60 61
• Net Working Capital Turnover (Days) 49 50
Debt: Equity (Group) 0.58 0.55
Finance Costs to Turnover (%) (Group) 1.2% 1.3%
Particulars Amount
(INR/Cr)
Gross Debt 795
Cash/Cash Equivalents and Investments 388
Net Debt 407
Foreign Current Denominated 745
Foreign Current Denominated: Payable in One Year 456
Rupee Debt 50
Rupee Debt: Payable in One Year –
Foreign Currency Debt as a % age of Gross Debt 94%
Total Debt Payable with in One year 57%
Average Cost of Debt (%): Pre tax 5.20%
30 31

EXPENSES
The following table sets the expenses and certain other profit and loss account line items for the years
FY12 and FY11:
INR crore
Particulars
Total Income
Expenditure
Cost of Materials
% of Total Income
Employees Cost
% of Total Income
Advertisement and Sales Promotion
% of Total Income
Depreciation, Amortisation and Impairment
% of Total Income
Other Expenditure
% of Total Income
Finance Charges
% of Total Income
Total Expenses before exceptional items
% of Total Income
PBT before Exceptional Items
% of Total Income
Exceptional Items
Profit Before Tax
% of Total Income
Tax
Profit after tax before Minority Interest
% of Total Income
Minority Interest
Profit after Tax
% of Total Income
FY 2010-11
3,156.21
1,617.59
51.25%
229.98
7.29%
345.95
10.96%
70.8
2.24%
523.36
16.58%
41.01
1.30%
2,828.69
89.62%
327.52
10.38%
48.91
376.43
11.93%
84.98
291.45
9.23%
5.01
286.44
9.08%
FY 2011-12
4,040.85
2,098.70
51.94%
307.29
7.60%
448.99
11.11%
72.52
1.79%
668.9
16.55%
42.39
1.05%
3,638.79
90.05%
402.06
9.95%
(1.75)
400.31
9.91%
78.25
322.06
7.97%
4.95
317.11
7.85%
Profit after tax (PAT) for FY12 was INR 317 crore,
a growth of 11% over FY11. These results include
the following items that are not strictly comparable
with FY11. Each of these items are explained in
detail in the Notes to the Consolidated Annual
Financial Statements:
Over the past 5 years, Marico has shown a
consistent performance with Sales and Profit after Tax
growing at a compounded annual growth rate of
21% and 23% respectively.
1. Net Sales / Income from Operations
comprising
a. Sales from “Consumer Products”
including coconut oil, value added
hair oils, premium refined edible oils,
anti-lice treatments, fabric care, edible
salt, functional and other processed
foods, hair creams & gels, shampoos,
hair relaxers & straightners, deodorants
and other similar consumer products,
by-products, scrap sales and certain
other operating income.
b. Sale and income from other products
including skin care products sold
through Skin Care Clinics under the
brands Kaya and Derma Rx.
c. Income from services offered at the
Skin Care Clinics under the brands
Kaya and Derma Rx
2. Other Income, primarily includes profits on
sale of investments, dividends, interest
and miscellaneous income.
The following table shows the details of income
from sales and services for FY12 and FY11.
There has been around 28% growth in Net Sales/
Income from Operations on account of 26% growth
in Consumer Products Business in India, 30% growth
in Consumer Products Business outside India
and 34% in Kaya. All the franchises of the Group
witnessed a healthy growth during the year.
The underlying volume growth was healthy
at 17% at Group level. It was possible as a result
of 14% growth in Consumer Products Business in
India with International Business Group and Kaya
also recording healthy volume growth.
Other income mainly accounts for profit on sales
of investment, interest and dividend income arising
largely from investment of short term surpluses.
TOTAL INCOME
Our total income consists of the following
INR crore
Particulars FY 11-12 FY 10-11
Total 4,040.9 3,156.2
Net Sales / Income from Operations 4,008.3 3,135.0
Other Income 32.6 21.2
Particulars FY12 FY11
Reported Profit after Tax 317 286
Reported Growth % 11%
Normalised Profits before consideringexceptional and non comparable items 326 262
Adjusted Growth % 25%
Rs/Cr FY11
Particulars PBT PAT
Write back on Excise Provision relatingFY10 on Coconut Oils 29.3 19.6
Sales proceeds from divestment ofBrand “Sweekar” 50.0 36.2
Impairment relating to Finacee business (22.6) (18.1)
Clinic Impairment in Kaya: India (7.7) (7.7)
Accelerated Depreciation – Kaya (India) (5.4) (5.4)
in Egypt
Total 43.6 24.6
Rs/Cr FY12
Particulars PBT PAT
Clinic Impairment in Kaya:India and Middle East (1.7) (1.7)
Prior period adjustment inKaya Middle East (13.0) (13.0)
Write back of income taxprovision of earlier years – 5.6
Total (14.7) (9.1)
32 33

Cost of Materials
Employee Cost
Advertisement and Sales Promotion
Depreciation, amortisation and impairment
Other Expenses
Finance Charges
Exceptional Items
Cost of material includes consumption of raw
material, packing material, purchase of finished
goods for re-sale and increase or decrease in the
stocks of finished goods, by-products and work in
progress. Input prices had seen an unprecedented
increase in H2FY11 and continued to rise during the
current year before a decline was witnessed in the
latter part of FY12. For the year as a whole the average
market prices of copra were higher than FY11 by
about 20%. The market prices of other key inputs such
as Safflower Oil and Rice bran oil were up 28% and
34% respectively during FY12 as compared to FY11.
The Company had passed on part of this cost push to
the consumers, some in the later part of previous
financial year and some in the current financial year,
and therefore the material cost as a percentage to
total income is slightly higher as compared to the
previous year. The Company maintained its thrust on
volume growth and therefore chose not to pass on
the entire input cost push to the consumers.
Employee cost includes salaries, wages, bonus
and gratuity, contribution to provident and other
funds and staff welfare schemes expenses. The
Company has an extensive process of performance
management enhancement through the deployment
of MBR (Management By Results), which is intended
to create an environment where employees are
encouraged to challenge and stretch themselves.
Linked to this is a variable compensation element
based on the Company's target achievement and the
individual’s performances against goals identified.
The increase in employee costs is primarily on
account of normal annual compensation revisions
and increase in headcount. A part of the increase is
also attributed to provision made during the year
towards the Stock Appreciation Rights Plan (STAR
Plan) which was not there in the previous year.
Advertisement and sales promotion (ASP)
expenses in FY12 were slightly higher than that in
FY11 on a percentage to net income basis. During
the current year the consumer products business in
India scaled up the prototype of Saffola Oats and
launched Parachute Advansed Body Lotion
nationally. Moreover, there were new launches in
International markets. In Bangladesh new variants of
value added hair oils were introduced during the
current year and in the MENA region there were
launch and re-launch of products.
Generally, depreciation costs increase based
on the capital expenditure incurred. Depreciation
expense has remained in line with FY11 as no
substantial capital expenditure was incurred this
year. In line with the Indian Accounting Standards,
the Company has continued to amortise Brands
held by some of its overseas subsidiaries.
Other expenses include items such as
Conversion charges, Freight & Forwarding, Selling
and Distribution, Rent, Travel and other expenses.
Other expenses include spends that are variable,
semi-variable and fixed in nature. There has been no
significant change on percentage to sales basis.
However, in absolute terms the spends have gone up
mainly on account of the investment in Vietnam. For
the operations in Vietnam the entire year’s operations
during FY12 were consolidated as compared to only
two months during FY11. Moreover, a robust volume
growth has lead to increase in expenses that are
variable and semi variable in nature.
Financial charges include interest on loans and
other financial charges. Interest costs are in line with
increase in long term and short term borrowings.
There were some items which are exceptional
in nature and hence detailed separately on the face
of Profit and Loss account. These are explained in
Note 38 of the Consolidated Financial Statements.
Tax
Tax comprises Income Tax and Deferred Tax. The
effective tax rate for FY12 is ~20%. The effective tax
rate is lower than the corporate tax rate as the
Company has invested in manufacturing facilities in
tax free zones. There were some exceptional and non-
comparable items in FY11 financial statements due
to which the effective tax rate for FY11 was higher.
Statement of Assets and Liabilities - Consolidated Financials INR crore
BALANCE SHEET
Particulars As at
EQUITY AND LIABILITIES
Shareholders’ Funds
Sub-total Shareholder's fund
Minority Interest
Non-current liabilities
Sub-total Non current liabilities 433.23 426.90
Current Liabilities
Sub-total current liabilities 1,015.88 868.87
TOTAL - EQUITY AND LIABILITIES 2,617.02 2,233.13
ASSETS
Non-current assets
Sub-total Non current assets 1,196.86 1,070.50
Current assets
Sub-total current assets 1,420.16 1,162.63
TOTAL - ASSETS 2,617.02 2,233.13
As at
March 31, 2012 March 31, 2011
1,143.01 915.48
Share Capital
Reserves and surplus
0.63 0.57
41.93 44.60
Short-term borrowings 371.58 340.13
Trade payables 358.37 269.36
Other current liabilities 208.19 182.66
Short-term provisions 77.74 76.72
Fixed assets 501.84 457.77
Goodwill on consolidation 395.49 397.59
Non-current investments 29.39 10.22
Deferred tax assets (net) 22.34 29.90
Long-term loans and advances 124.39 76.38
Other non-current assets 123.41 98.64
Current investments 266.26 78.71
Inventories 720.22 601.14
Trade receivables 181.57 177.91
Cash and cash equivalents 158.81 220.57
Short-term loans and advances 75.11 79.17
Other current assets 18.19 5.13
61.49 61.44
1,081.52 854.04
24.90 21.88
Long-term borrowings 390.67 381.73
Other Long-term liabilities
Long-term provisions
34 35

Shareholders’ Funds
Minority Interest
Non-current Liabilities
Current Liabilities
Fixed Assets
Goodwill on Consolidation
Non-current Investments
Deferred Tax Asset (DTA)
Long-term Loans and Advances
This comprises the paid up share capital and
reserves & surplus. There has been an increase in
the share capital on account of stock options
exercised by the employees under the ESOP
Scheme. Annexure to the Directors’ Report provides
further details of stock options issued, exercised
and to be exercised.
Minority Interest represents the share of
consolidated profits attributable to non-Marico
shareholders in Marico Bangladesh Limited and
International Consumer Products Corporation:
1. The Company’s Bangladesh subsidiary,
Marico Bangladesh Limited, had listed 10% of its
equity share capital on the Dhaka Stock Exchange
in September 2009 by issuing fresh shares to the
public in that country.
2. The Company acquired 85% stake in
International Consumer Products Corporation (ICP)
in Vietnam and started consolidating its business
with effect from February 18, 2011. The balance
15% shareholding continues to be held by the
founding company.
Non-current Liabilities include borrowings
which are payable after one year or more from
the date of the balance sheet and long term
provisions such as gratuity. These include a judicious
blend of borrowings in local and foreign currency.
Long term provision also includes provision for
consideration towards acquisition of the Derma Rx
business, payable over 3 years. (Ref. Note 8(f) of the
Consolidated Financial Statement).
Current liabilities mainly comprise the amounts
payable by the Company for the purchase of various
input materials and services and short term
provisions. Increase in current liabilities is mainly on
account of trade payables which are in line with the
business growth.
Fixed assets represent investments made
by the Company in tangible assets such as
Buildings, Plant & Machinery, Furniture & Fixtures etc.
Apart from normal yearly capital expenditure,
the increase is on account of capitalisation of R&D
office building in Mumbai and fixed assets in
Bangladesh, Middle East and Egypt.
Goodwill on consolidation represents the
consideration paid to acquire companies in excess
of their net assets.
Non-current Investments comprise long term
investments the full value of which will not be realized
before one year from the date of the balance sheet.
These investments have increased in FY12 as the
Company has parked some amount of the additional
funds generated during the year in tax free bonds.
Deferred Tax Asset represents the timing
differences resulting due to variations in the
treatment of items as per Income Tax Act, 1961 and
Indian GAAP.
The amount of deferred tax asset has come
down on account of:
• The Company had adjusted in the Books of
Account the value of Intangible Assets against
the Capital Redemption Reserve and Securities
Premium Account under the Capital Restructuring
Scheme in an earlier year and hence created
a DTA. As the Written Down Value of those
Intangible Assets as per Taxation books is
reducing each year the DTA is getting reversed.
Long-term Loans and advances include the
amounts paid by the Company recoverable in cash
or in kind after 12 months from the balance sheet
date. These include security deposits, advances paid
to suppliers in select cases etc. Increase in long term
loans and advances in FY12 are mainly on account
of the refundable Earnest Money Deposit paid for
acquisition of Personal Care business of Paras and
advance to Welfare of Mariconians Trust. This trust
manages the long term incentive plan, Marico Stock
Appreciation Rights Plan (STAR Plan) for its
employees. Under the plan, stock appreciation rights
are granted to certain eligible employees.
On completion of the Paras acquisition, the
Company will get a refund of the Earnest Money
Deposit along with interest thereon.
Other non-current assets include receivables/
entitlements maturing after more than 12 months
from the balance sheet date. Increase in non-current
assets in FY12 is on account of increase in MAT
credit entitlement.
Current investments comprise short term
investments the full value of which will be realized
before one year from the date of the balance sheet.
It includes investments made in Mutual Funds,
Bank Certificates of Deposits etc. Increase in current
investments is mainly on account of the surplus
generated during the year and continuing the
arbitrage opportunity by not redeeming the
investments while continuing with the loan book.
Inventory includes the stocks of raw material,
packing material, work in process and finished
goods held for sale in the ordinary course of
business. Increase in inventory is on account of
inflation and is in line with the business growth.
The Company has also built up stocks of finished
goods to service the Q1FY13 sales plans.
Trade Receivables include the monies to be
received from its customers against sales made to
them. Increase in trade receivables is on account of
inflation and in line with the business growth.
This includes amounts lying in Cash and with the
Company’s bankers. There is a decrease in the
cash balances primarily due to maturity of Fixed
Deposits in Bangladesh which has been used for
dividend remittance and capital expenditure.
Short term loans and advances include monies
to be received within one year from the date
of the balance sheet. There has been no significant
change in short term loans and advances as
compared to FY11.
Other current assets includes all other monies
to be received within one year from the date of
the balance sheet, such as interest receivable,
export incentive receivable etc. Increase in interest
receivable is on account of increase in investments.
In February 2012, the Company has executed
definitive agreements to purchase the personal care
business of Paras Pharmaceuticals Limited (PPL),
from Reckitt Benckiser (Singapore) Pte Limited for
a consideration of INR 740 crores to be paid in cash.
This acquisition will give the Company access to
youth brands such as Setwet, Zatak and Livon.
Brands in the portfolio rank within the top three
positions in the hair gels, male deodorant and
leave-on hair serum categories. This acquisition gives
Marico an opportunity to participate in the rapidly
growing deodorant and male grooming categories in
India. The portfolio addresses the grooming needs of
the youth and is supported by India’s demographic
profile. Marico will also leverage its distribution
strength in India to provide a fillip to the growth of the
brands. The acquisition of this business is expected
Other Non-current Assets
Current Investments
Inventory
Trade Receivables
Cash and Cash Equivalents
Short-term Loans and Advances
Other Current Assets
OTHER DEVELOPMENTS
Acquisition of the Paras PC Business
36 37

to further reduce Marico’s dependence on edible oils
and hair oils.
To part-finance the Paras personal care
acquisition, and considering your Company’s
medium term funds requirements, it will be issuing
additional equity shares amounting to INR 500 crore
on preferential basis. The shareholders of the
Company had accorded necessary approval for
the preferential issue of equity shares at their
Extra-Ordinary General Meeting held on May 2, 2012.
The allotment will be made on a preferential basis
to Indivest Pte. Ltd. (an affiliate of Government of
Singapore Investment Corporation Pte. Ltd.) and
Baring India Private Equity Fund III Listed Investments
Limited in the ratio of 3:1. The issue is placed
at a price of INR 170 per share. Your Company was
able to get a premium of about 2.5% over the SEBI
floor price.
Marico has positioned itself, strategically, in
emerging markets - India, South Africa (part of
BRICSA), Bangladesh, Vietnam and Egypt (Part of
N-11 Group) and the Middle East. In emerging
markets, a focus on the long term is crucial. Long
term success can be ensured only through stronger
brands that enjoy loyal consumer franchises.
Marico has therefore chosen to prioritize expansion
of consumer franchise over expansion of margins.
In the immediate term, however, there exists
some uncertainty in the business environment. While
the pressure of inflation has eased to some extent in
India, the GDP growth estimates have been revised
downwards. Even though FMCG companies
marketing items of daily consumption are not
affected as much as some other industries might
be, there could be an effect on consumer demand
especially for items of discretionary consumption in
our portfolio. In addition, high inflation and weak
currencies may have some impact on business in
a few of Marico’s international markets.
Here is a broad outline of Marico’s strategies
and the expected outcome for its various businesses:
• In coconut oils, the Company will aim to
grow by leading market expansion through its
recruiter low unit size packs. In rural areas the
Company aims to gain market share. The
Company expects to achieve volume growth of
6% to 8% per annum in the medium term.
• In hair oils, Marico will focus on share gain
through the introduction of differentiated and
innovative products and by providing specificity
to consumers accompanied by effective
communication. The successful execution of this
strategy is expected to result in annual volume
growth of 15% to 17% over the next 2-3 years.
• The Company's efforts in expanding rural
reach is also expected to contribute towards
franchise expansion in coconut oils and hair oils.
• Saffola is expected to continue growing
its basket of premium refined edible oils by
about 15% in volume each year. In addition the
Company plans to build a sizeable business
in the healthy foods space by leveraging
Saffola’s equity. It aims to get about 25%
revenues of Saffola from healthy foods over a
period of 3 years.
• The Company will also focus on integrating
the Paras acquisition into Marico. The Paras
portfolio participating in tail wind categories is
expected to have a rate of growth higher than
Marico’s existing portfolio.
• Marico will focus on growing the categories
where it has significant market share - such as in
coconut oil in Bangladesh and male grooming
in MENA and Vietnam.
• The Company will focus on complementing
growth of Parachute Coconut Oil in Bangladesh
by expanding its portfolio to value-added hair
oils and other personal care products. In the
immediate future, however, there may some
Preferential Allotment of Equity Shares
OUTLOOK
Consumer Products Business in India
International Business Group (IBG)
pressure on growth given the overall economic
scenario in Bangladesh.
• In South Africa, the Company would work on
increasing share in key categories and on
expanding its footprint to other parts of
sub-Saharan Africa, in the medium term.
• The overall environment in MENA is relatively
better than it was last year. The business is
largely back on track and the Company will aim
to carry this momentum into the next year.
• Code 10 in Malaysia is expected to continue
to show healthy growth.
• Marico will also explore other countries in
the emerging markets of Asia and Africa as
targets for expansion in the long term.
• IBG is expected to grow in healthy double
digits.
• The Kaya skin business in India is showing
early signs of recovery having posted growth at
same clinic level for 6 consecutive quarters.
In the short term therefore, the Company plans
to work on improving its revenue streams from
the existing clinics in India and bringing the
business firmly back on the growth track. It will
focus on increasing its share of revenue through
sales of products. Kaya will be cautious in terms
of expansion plans but may continue to add
a few clinics at strategic locations to drive
growth. The Company believes that the building
blocks for long-term value creation by Kaya are
falling into place.
• The Company will be prototyping a new
clinic format for Kaya in the coming year. This
clinic is likely to be much smaller in size as
compared to the existing Kaya clinics and will
focus on sale of maintenance products and
services. The Company expects that such a
prototype, if successful, has a high scalability
potential. Moreover, smaller clinics and a focus
on maintenance services will also mean lower
rental and capital expenses, leading to better
returns on investments.
The long-term potential of the businesses
continues to be strong. This belief stands bolstered
by the recent record of strong volume growths across
categories, despite price hikes. This emboldens the
Company to spell out a preference for growing
volume franchise as compared to focusing on profit
margins alone.
On behalf of the Board of Directors
Harsh Mariwala
Chairman & Managing Director
Place: Mumbai
Date: May 3, 2012
Kaya
38 39

M A R I C O L I M I T E D
41
consolidated auditors' reportAuditors’ Report to the Members of Marico Limited
The Board of Directors of Marico Limited
1. We have audited the attached consolidated balance sheet of Marico Limited (the “Company”) and its subsidiaries; hereinafter
referred to as the “Group” (refer Note [2] to the attached consolidated fi nancial statements) as at March 31, 2012, the
related consolidated Statement of Profi t and Loss and the consolidated Cash Flow Statement for the year ended on that
date annexed thereto, which we have signed under reference to this report. These consolidated fi nancial statements are
the responsibility of the Company’s management. Our responsibility is to express an opinion on these fi nancial statements
based on our audit.
2. We conducted our audit in accordance with the auditing standards generally accepted in India. Those Standards require
that we plan and perform the audit to obtain reasonable assurance about whether the fi nancial statements are free of
material misstatement. An audit includes examining, on a test basis, evidence supporting the amounts and disclosures in
the fi nancial statements. An audit also includes assessing the accounting principles used and signifi cant estimates made
by management, as well as evaluating the overall fi nancial statement presentation. We believe that our audit provides a
reasonable basis for our opinion.
3. We did not audit the fi nancial statements of twelve subsidiaries included in the consolidated fi nancial statements, which
constitute total assets of Rs. 478.76 crores and net assets of Rs. 88.91 crores as at March 31, 2012, total revenue of Rs.
793.57 crores, net profi t of Rs. 114.03 crores and net cash outfl ows amounting to Rs. 109.25 crores for the year then ended.
These fi nancial statements and other fi nancial information have been audited by other auditors whose reports have been
furnished to us, and our opinion on the consolidated fi nancial statements to the extent they have been derived from such
fi nancial statements is based solely on the report of such other auditors.
4. We have relied on the unaudited fi nancial statements of six subsidiaries and a subsidiary fi rm included in the consolidated
fi nancial statements, which constitute total assets of Rs. 172.55 crores and net assets of Rs. 102.70 crores as at March 31,
2012, total revenue of Rs. 273.99 crores, net loss of Rs. 13.44 crores and net cash infl ows amounting to Rs. 30.87 crores
for the year then ended. These unaudited fi nancial statements as approved by the respective Board of Directors of these
companies and fi rm have been furnished to us by the Management and our report is so far as it relates to the amounts
included in respect of these subsidiaries and fi rm is based solely on such approved unaudited fi nancial statements.
5. We report that the consolidated fi nancial statements have been prepared by the Company’s Management in accordance
with the requirements of Accounting Standard (AS) 21 - Consolidated Financial Statements notifi ed under sub-section 3C
of Section 211 of the Companies Act, 1956.
6. Based on our audit and on consideration of reports of other auditors on separate fi nancial statements and on the other
fi nancial information of the components of the Group as referred to in paragraphs 3 and 4 above, and to the best of our
information and according to the explanations given to us, in our opinion, the attached consolidated fi nancial statements
give a true and fair view in conformity with the accounting principles generally accepted in India:
(a) in the case of the consolidated Balance Sheet, of the state of affairs of the Group as at March 31, 2012;
(b) in the case of the consolidated Statement of Profi t and Loss, of the profi t of the Group for the year ended on that date:
and
(c) in the case of the consolidated Cash Flow Statement, of the cash fl ows of the Group for the year ended on that date.
For Price WaterhouseFirm Registration Number: 301112E
Chartered Accountants
Uday ShahPlace: Mumbai PartnerDate: May 3, 2012 Membership Number:F - 46061

M A R I C O L I M I T E D
42
consolidated balance sheet
The notes are an integral part of these fi nancial statements.
As per our attached report of even date.
For Price Waterhouse For and on behalf of the Board of DirectorsChartered Accountants HARSH MARIWALA Chairman and Managing DirectorFirm Registration No. 301112E NIKHIL KHATTAU Director and Chairman of Audit Committee MILIND SARWATE Group Chief Financial Offi cerUDAY SHAH HEMANGI GHAG Company Secretary & Compliance Offi cerPartner Membership No. F-46061Place : Mumbai Place : MumbaiDate : May 3, 2012 Date : May 3, 2012
EQUITY AND LIABILITIES
Shareholders’ FundsShare capital 4 61.49 61.44 Reserves and surplus 5 1,081.52 854.04 1,143.01 915.48
Minority Interest 24.90 21.88
Non-current liabilities Long-term borrowings 6 390.67 381.73 Other Long-term liabilities 7 0.63 0.57 Long-term provisions 8 41.93 44.60 433.23 426.90 Current liabilities Short-term borrowings 9 371.58 340.13 Trade payables 10 358.37 269.36 Other current liabilities 11 208.19 182.66 Short-term provisions 12 77.74 76.72 1,015.88 868.87 TOTAL 2,617.02 2,233.13
ASSETS
Non-current assets Fixed assets Tangible assets 13 (A) 373.34 336.78 Intangible assets 13 (B) 88.33 88.28 Capital work-in-progress 40.17 32.71 501.84 457.77 Goodwill on consolidation 14 395.49 397.59 Non-current investments 15 29.39 10.22 Deferred tax assets (net) 16 22.34 29.90 Long-term loans and advances 17 124.39 76.38 Other non-current assets 18 123.41 98.64 1,196.86 1,070.50 Current assets Current investments 19 266.26 78.71 Inventories 20 720.22 601.14 Trade receivables 21 181.57 177.91 Cash and bank balances 22 158.81 220.57 Short-term loans and advances 23 75.11 79.17 Other current assets 24 18.19 5.13 1,420.16 1,162.63 TOTAL 2,617.02 2,233.13
As at March 31,
Note 2012 2011
Rs. Crore Rs. Crore

M A R I C O L I M I T E D
43
consolidated statement of profit and loss For the year ended March 31,
Note 2012 2011
Rs. Crore Rs. Crore
The notes are an integral part of these fi nancial statements.
As per our attached report of even date.
For Price Waterhouse For and on behalf of the Board of DirectorsChartered Accountants HARSH MARIWALA Chairman and Managing DirectorFirm Registration No. 301112E NIKHIL KHATTAU Director and Chairman of Audit Committee MILIND SARWATE Group Chief Financial Offi cerUDAY SHAH HEMANGI GHAG Company Secretary & Compliance Offi cerPartner Membership No. F-46061Place : Mumbai Place : MumbaiDate : May 3, 2012 Date : May 3, 2012
Revenue from operations (Gross) 25 4,009.64 3,135.97
Less : Excise duty 1.36 0.98
Revenue from operations (Net) 4,008.28 3,134.99
Other income 26 32.57 21.22
Total Revenue 4,040.85 3,156.21
Expenses:
Cost of materials consumed 27 (A) 2,132.04 1,712.66
Purchases of stock-in-trade 27 (B) 17.44 20.36
Changes in inventories of fi nished goods, work-in-progress and
stock-in-trade - (Increase) / decrease 27 (C) (50.78) (115.43)
Employee benefi ts expenses 28 307.29 229.98
Finance costs 29 42.39 41.01
Depreciation, amortisation and impairment 30 72.52 70.80
Other expenses 31 1,117.89 869.31
Total expenses 3,638.79 2,828.69
Profit before exceptional and extraordinary items and tax 402.06 327.52
Exceptional items - (expenses) / income 38 (1.75) 48.91
Profit before tax 400.31 376.43
Tax expense:
Current tax 94.81 96.92
Less: MAT credit (entitlement)/utilisation (22.33) (43.55)
Less: Prior period tax adjustments (1.55) –
Net current tax 70.93 53.37
Deferred tax charge 7.32 31.61
78.25 84.98
Profit after tax and before Minority interest 322.06 291.45
Less: Minority interest (4.95) (5.01)
Profit for the year 317.11 286.44
Earnings per equity share (Nominal value per share Re. 1 (Re. 1)) 40
Basic 5.16 4.68
Diluted 5.15 4.65

M A R I C O L I M I T E D
44
consolidated cash flow statement
A CASH FLOW FROM OPERATING ACTIVITIES
PROFIT BEFORE TAXATION AND AFTER EXCEPTIONAL ITEMS 400.31 376.43
Adjustments for:
Depreciation, amortisation and impairment 72.52 70.80
Provision for impairment relating to skin clinics in India / Middle East (Refer note 38) 1.75 7.74
Provision for impairment on assets written back as no longer required – (3.95)
Provision for impairment of Goodwill and FIANCEE Trademark (Refer Note 38(a)) – 22.70
Profi t on divestment of “Sweekar” Brand – (50.00)
Capital advance written off – 3.92
Reversal of provision for contingencies (Refer Note 44) – (29.35)
Finance costs 42.39 41.01
Interest income (17.55) (16.21)
Loss / (profi t) on sale of assets - (net) (0.15) (0.01)
(Profi t) / loss on sale of current investments (net) (1.20) (0.40)
Dividend income (12.15) (2.45)
Employees stock option charge/ (reversal) (0.04) 0.04
Stock appreciation rights expenses 5.94 0.02
Provision for doubtful debts, advances, deposits and others, no longer required written back (1.03) (0.05)
90.48 43.81
Operating profit before working capital changes 490.79 420.24
Adjustments for:
(Increase)/ decrease in inventories (119.08) (156.32)
(Increase)/ decrease in trade receivables (3.13) (37.31)
(Increase)/ decrease in loans and advances and other current and non-current assets (4.84) 24.59
Increase/ (decrease) in trade payables and other current and non-current liabilities and provisions 153.22 71.01
Changes in working capital 26.17 (98.03)
Cash generated from Operations 516.96 322.21
Taxes paid (net of refunds) (110.01) (78.31)
NET CASH INFLOW FROM OPERATING ACTIVITIES 406.95 243.90
B CASH FLOW FROM INVESTING ACTIVITIES
Purchase of fi xed assets (102.11) (184.12)
Sale of fi xed assets 0.78 3.22
Proceeds from divestment of “Sweekar” Brand – 50.00
Effect of translation differences on fi xed assets (16.71) (1.01)
Purchase of investments (284.70) (75.34)
Sale of investments 79.04 69.49
Goodwill on consolidation (Refer note (c) below) (1.02) (277.60)
Inter-corporate deposits placed (10.00) –
Deposit in escrow account for acquisition (Refer note 36) (25.00) –
Dividend income received 12.15 2.45
Interest received 16.22 17.43
NET CASH OUTFLOW FROM INVESTING ACTIVITIES (331.35) (395.48)
For the year ended March 31,
2012 2011
Rs. Crore Rs. Crore

M A R I C O L I M I T E D
45
consolidated cash flow statement
C CASH FLOW FROM FINANCING ACTIVITIES
Proceeds from issuance of Share capital on exercise of stock option 3.09 28.60
Issue / (redemption) of commercial papers (net) (92.99) 58.90
Increase in Minority interest (1.86) 4.84
Issue of debentures / (redemption) (30.00) 50.00
Other borrowings (repaid) / taken (net) 94.73 219.22
Finance costs paid (44.67) (40.51)
Equity dividend paid (inclusive of dividend distribution tax) (46.99) (47.07)
NET CASH (OUTFLOW) / INFLOW FROM FINANCING ACTIVITIES (118.69) 273.98
D Effect of exchange difference on translation of foreign currency cash and cash equivalents (3.76) (9.03)
E NET INCREASE / (DECREASE) IN CASH & CASH EQUIVALENTS (A+B+C+D) (46.85) 113.37
F Cash and cash equivalents - opening balance (as at April 1) (Refer note 22) 134.30 20.93
G Cash and cash equivalents - closing balance (as at March 31) (Refer note 22) 87.45 134.30
Notes
(a) The above Cash Flow statement has been prepared under the indirect method as set out in Accounting Standard 3 (AS 3)
‘Cash Flow Statements’ as specifi ed in Companies (Accounting Standards) Rules , 2006.
(b) The fi gures for the previous year have been regrouped where necessary to conform to current year’s classifi cation.
(c) Cash fl ow on account of goodwill on consolidation represents excess of purchase price paid over the net assets
value of subsidiary acquired, and is determined after taking into effect of movement in contingent consideration.
(Refer note 8(f) and 14).
For the year ended March 31,
2012 2011
Rs. Crore Rs. Crore
As per our attached report of even date.
For Price Waterhouse For and on behalf of the Board of DirectorsChartered Accountants HARSH MARIWALA Chairman and Managing DirectorFirm Registration No. 301112E NIKHIL KHATTAU Director and Chairman of Audit Committee MILIND SARWATE Group Chief Financial Offi cerUDAY SHAH HEMANGI GHAG Company Secretary & Compliance Offi cerPartner Membership No. F-46061Place : Mumbai Place : MumbaiDate : May 3, 2012 Date : May 3, 2012

M A R I C O L I M I T E D
46
NOTES TO THE FINANCIAL STATEMENTS
1. The Group and nature of its operations:
Marico Limited (herein after referred to as ‘the Company’), headquartered in Mumbai, Maharashtra, India, together with its
subsidiaries is referred as ‘Marico’ or ‘Group’. Marico carries on business in branded consumer products and services. In India,
Marico manufactures and markets products under the brands such as Parachute, Nihar, Saffola, Hair & Care, Revive, Shanti,
Oil of Malabar, Mediker and Manjal. Marico’s international portfolio includes brands such as Fiancée, HairCode, Camelia,
Aromatic, Caivil, Hercules, Black Chic, Ingwe, Code 10, X-men, L’Ovite and Thuan Phat. It is present in Skin Care solutions
business under the brand name Kaya in India and international markets and the brand Derma Rx in Singapore and Malaysia.
2. Subsidiaries considered in Consolidated Financial Statements:
(i) List of subsidiary companies:
Name of the Company Country of
incorporation
Percentage
of ownership
interest
Kaya Limited India 100 (100)
Marico Bangladesh Limited (MBL) Bangladesh 90 (90)
MBL Industries Limited (MBLIL) (Through Marico Middle East FZE) Bangladesh 100 (100)
Marico Middle East FZE (MME) UAE 100 (100)
Kaya Middle East FZE (KME) (Through Marico Middle East FZE) UAE 100 (100)
MEL Consumer Care SAE (MELCC) (Through Marico Middle East FZE) Egypt 100 (100)
Egyptian American Investment & Industrial Development Company (EAIIDC) (Through Marico Middle East FZE)
Egypt 100 (100)
Marico Egypt Industries Company (MEIC) (Through MEL Consumer Care SAE) Egypt 100 (100)
Marico South Africa Consumer Care (Pty) Limited (MSACC) South Africa 100 (100)
Marico South Africa (Pty) Limited (MSA) (Through Marico South Africa Consumer Care (Pty) Limited)
South Africa 100 (100)
CPF International (Pty) Limited (CPF) (Through Marico South Africa (Pty) Limited) (upto January 16, 2012*)
South Africa NIL (100)
Marico Malaysia Sdn. Bhd. (MMSB) (Through Marico Middle East FZE) Malaysia 100 (100)
Derma – Rx International Aesthetics Pte. Ltd. (DIAL) (Through Kaya Limited) (w.e.f May 22, 2010)
Singapore 100 (100)
The DRx Clinic Pte. Ltd. (DCPL) (Through Derma – Rx International Aesthetics Pte. Ltd) (w.e.f May 25, 2010)
Singapore 100 (100)
The DRx Medispa Pte. Ltd. (DMSPL) (Through Derma – Rx International Aesthetics Pte. Ltd) (w.e.f May 25, 2010)
Singapore 100 (100)
DRx Investments Pte. Ltd. (DIPL) (Through Derma – Rx International Aesthetics Pte. Ltd) (w.e.f May 25, 2010)
Singapore 100 (100)
DRx Aesthetics Sdn. Bhd. (DASB) (Through Derma – Rx International Aesthetics Pte. Ltd) (w.e.f May 25, 2010)
Malaysia 100 (100)
International Consumer Products Corporation (ICP) (w.e.f February 18, 2011)
Vietnam 85 (85)
Beaute Cosmetique Societe Par Actions (BCS) (Through International Consumer Products Corporation) (w.e.f February 18, 2011) (99% (99%) equity held by ICP)
Vietnam 84.85 (84.15)
Thuan Phat Foodstuff Joint Stock company (TPF) (Through International Consumer Products Corporation) (w.e.f February 18, 2011) (98.6% (87%) equity held by ICP)
Vietnam 83.81 (73.95)
* CPF was de-registered during the year, which has no impact on the consolidated fi nancial statement of the year as
the said company has no operations.
notes to consolidated financial statements for the year ended march 31, 2012

M A R I C O L I M I T E D
47
ii) List of Subsidiary fi rm:
Name of the Company Country of
incorporation
Percentage
of ownership
interest
Wind Company. (Through MEL Consumer Care SAE) Egypt 99 (99)
iii) The effect of the subsidiaries formed / acquired during the year is as under:
Name of the Subsidiaries Net Profit
Rs. Crore
Net assets
Rs. Crore
Derma - Rx International Aesthetics Pte. Ltd. and its subsidiaries – –
(5.95) (2.10)
International Consumer Products Corporation and its subsidiaries – –
(0.22) (40.38)
Total – –
(6.17) (42.48)
3. Summary of significant accounting policies:
(a) Basis of preparation of fi nancial statements
The fi nancial statements are prepared in accordance with the Generally Accepted Accounting Principles (“GAAP”)
in India under the historical cost convention on an accrual basis, except for certain fi nancial instruments which are
measured at fair values and are in conformity with mandatory accounting standards, as prescribed by the Companies
(Accounting Standards) Rules, 2006, the provisions of the Companies Act, 1956 and guidelines issued by the Securities
and Exchange Board of India (SEBI).
All assets and liabilities have been classifi ed as current or non-current as per the Company’s normal operating cycle
and other criteria set out in the Schedule VI to the Companies Act, 1956.
(b) Basis of preparation of Consolidated Financial Statements
The Consolidated Financial Statements relate to the Company and its subsidiaries and have been prepared on the
following basis:
i) In respect of Subsidiary companies, the fi nancial statements have been consolidated on a line-by-line basis by
adding together the book values of like items of assets, liabilities, income and expenses, after fully eliminating
intra-group balances and unrealised profi ts / losses on intra-group transactions as per Accounting Standard (AS
21) “Consolidated Financial Statements”. The results of subsidiaries are included from the date of acquisition of
a controlling interest.
ii) In case of foreign subsidiaries, being Non-Integral Foreign Operations, revenue items are consolidated at the
average rate prevailing during the year. All asset and liabilities are converted at the rate prevailing at the end
of the year. The resultant translation gains and losses are shown separately as ‘Foreign Currency Translation
Reserve’ under ‘Reserves and Surplus’.
iii) The excess of cost to the Group of its investments in subsidiary companies over its share of equity and reserves
of its subsidiary companies at the dates on which investments are made, is recognised in the fi nancial statements
as Goodwill, which is tested for impairment at every balance sheet date. The excess of Group’s share of equity
and reserves of its subsidiary companies over the cost of acquisition is treated as Capital Reserve.
iv) Minority interests in the net assets of consolidated subsidiaries consist of the amount of equity attributable to the
minority shareholders at the dates on which investments are made by the Company in the subsidiary companies
and further movements in their share in the equity, subsequent to the dates of investments.
notes to consolidated financial statements for the year ended march 31, 2012

M A R I C O L I M I T E D
48
v) The consolidated fi nancial statements have been prepared using uniform accounting policies for like transactions
and other events in similar circumstances and are presented to the extent possible, in the same manner as the
Company’s separate fi nancial statements, except for :
1. In case of all subsidiaries, except Plant and equipment of Marico Egypt Industries Company, depreciation
in respect of factory building and Plant and equipment is provided on straight line basis instead of written
down value basis as followed by Marico Limited (except items specifi ed in note 3(e)(I)(i) below). The total
amount of net block of these items of fi xed assets represents 17.59% (15.99%) of the total consolidated net
block of fi xed assets of the Group as at the year end.
2. In case of Marico Middle East FZE, Marico Malaysia Sdn. Bhd., costs of inventories are ascertained on FIFO
instead of weighted average basis. These inventories represent 0.05% (0.25%) of the total consolidated
inventories of the Group as at the year end.
3. In case of certain subsidiaries referred in note 3(m) below, leave encashment and gratuity is provided
on arithmetical basis instead of actuarial basis. These liabilities represent 40.00% (49.83%) of the total
consolidated gratuity and leave encashment liability of the Group as at the year end.
(c) Use of estimates
The preparation of the fi nancial statements in conformity with GAAP requires the management to make estimates and
assumptions that affect the reported balances of assets and liabilities and disclosures relating to contingent assets
and liabilities as at the date of the fi nancial statements and reported amounts of income and expenses during the
period. Examples of such estimates include provisions for doubtful debts, future obligations under employee retirement
benefi t plans, income taxes, the useful lives and provision for impairment of fi xed assets and intangible assets.
Management believes that the estimates used in the preparation of fi nancial statements are prudent and reasonable.
Future results could differ from these estimates.
(d) Tangible assets, intangible assets and capital work-in-progress
Tangible assets and intangible assets are stated at cost of acquisition, less accumulated depreciation/amortisation
and impairments, if any. Cost includes taxes, duties, freight and other incidental expenses related to acquisition and
installation. Borrowing costs attributable to acquisition, construction of qualifying asset are capitalised until such time
as the assets are substantially ready for their intended use. Other pre-operative expenses for major projects are also
capitalised, where appropriate.
Capital work-in-progress comprises cost of fi xed assets that are not yet ready for their intended use at the year end.
(e) Depreciation and amortisation
I. Tangible assets
(i) Depreciation in respect of assets of Indian entities viz, Marico Limited and Kaya Limited is provided at
higher of the rates based on useful lives of the assets as estimated by the management or those stipulated
in Schedule XIV to the Companies Act, 1956. The depreciation rates considered for the following items are
higher than the rates stipulated in Schedule XIV to the Companies Act, 1956:
Asset Rates (p.a.)
Computer hardware and related peripherals 33.33%
Moulds 16.21%
Offi ce equipment 10 % - 50%
Technologically advanced machinery 14.29% - 33.33%
Furniture and fi xtures (including lease hold improvements) 11.11% - 12.50%
Vehicles 20%
notes to consolidated financial statements for the year ended march 31, 2012
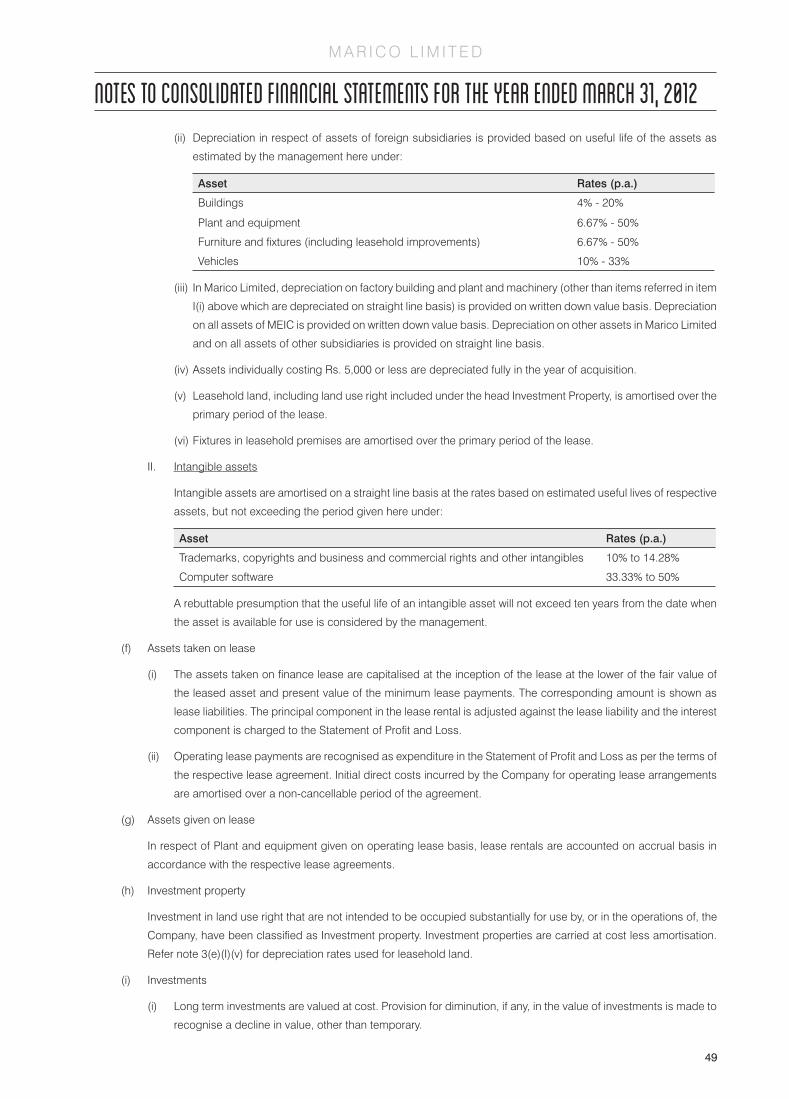
M A R I C O L I M I T E D
49
(ii) Depreciation in respect of assets of foreign subsidiaries is provided based on useful life of the assets as
estimated by the management here under:
Asset Rates (p.a.)
Buildings 4% - 20%
Plant and equipment 6.67% - 50%
Furniture and fi xtures (including leasehold improvements) 6.67% - 50%
Vehicles 10% - 33%
(iii) In Marico Limited, depreciation on factory building and plant and machinery (other than items referred in item
I(i) above which are depreciated on straight line basis) is provided on written down value basis. Depreciation
on all assets of MEIC is provided on written down value basis. Depreciation on other assets in Marico Limited
and on all assets of other subsidiaries is provided on straight line basis.
(iv) Assets individually costing Rs. 5,000 or less are depreciated fully in the year of acquisition.
(v) Leasehold land, including land use right included under the head Investment Property, is amortised over the
primary period of the lease.
(vi) Fixtures in leasehold premises are amortised over the primary period of the lease.
II. Intangible assets
Intangible assets are amortised on a straight line basis at the rates based on estimated useful lives of respective
assets, but not exceeding the period given here under:
Asset Rates (p.a.)
Trademarks, copyrights and business and commercial rights and other intangibles 10% to 14.28%
Computer software 33.33% to 50%
A rebuttable presumption that the useful life of an intangible asset will not exceed ten years from the date when
the asset is available for use is considered by the management.
(f) Assets taken on lease
(i) The assets taken on fi nance lease are capitalised at the inception of the lease at the lower of the fair value of
the leased asset and present value of the minimum lease payments. The corresponding amount is shown as
lease liabilities. The principal component in the lease rental is adjusted against the lease liability and the interest
component is charged to the Statement of Profi t and Loss.
(ii) Operating lease payments are recognised as expenditure in the Statement of Profi t and Loss as per the terms of
the respective lease agreement. Initial direct costs incurred by the Company for operating lease arrangements
are amortised over a non-cancellable period of the agreement.
(g) Assets given on lease
In respect of Plant and equipment given on operating lease basis, lease rentals are accounted on accrual basis in
accordance with the respective lease agreements.
(h) Investment property
Investment in land use right that are not intended to be occupied substantially for use by, or in the operations of, the
Company, have been classifi ed as Investment property. Investment properties are carried at cost less amortisation.
Refer note 3(e)(I)(v) for depreciation rates used for leasehold land.
(i) Investments
(i) Long term investments are valued at cost. Provision for diminution, if any, in the value of investments is made to
recognise a decline in value, other than temporary.
notes to consolidated financial statements for the year ended march 31, 2012

M A R I C O L I M I T E D
50
(ii) Current investments are valued at lower of cost and fair value, computed individually for each investment. In case
of investments in mutual funds which are unquoted, net asset value is taken as fair value.
(j) Inventories
(i) Raw materials, packing materials, stores and spares and consumables are valued at lower of cost and net
realizable value. However, these items are considered to be realizable at cost if the fi nished products in which
they will be used are expected to be sold at or above cost.
(ii) Work-in-process, fi nished goods, and stock-in-trade (traded goods) are valued at lower of cost and net realizable
value.
(iii) By-products and unserviceable / damaged fi nished goods are valued at net realizable value.
(iv) Cost is ascertained on weighted average method and in case of work-in-process includes appropriate production
overheads and in case of fi nished goods includes appropriate production overheads and excise duty, wherever
applicable. In case of Marico Middle East FZE and Marico Malaysia Sdn. Bhd. costs of inventories are ascertained
on FIFO instead of weighted average basis
(k) Research and development
Capital expenditure on research and development is capitalised and depreciated as per the accounting policy mentioned
in note 3(d) and 3(e) above. Revenue expenditure is charged off in the year in which it is incurred.
(l) Revenue recognition
(i) Domestic sales are recognised at the point of dispatch of goods to the customers, which is when substantial
risks and rewards of ownership passed to the customers, and are stated net of trade discounts, rebates, sales
tax, value added tax and excise duty.
(ii) Export sales are recognised based on the date of bill of lading except, sales to Nepal which are recognised
when the goods cross the Indian Territory, which is when substantial risks and rewards of ownership passed to
the customers.
(iii) Revenue from services is recognised on rendering of the services and is recorded net of discount and service
tax.
(iv) Interest and other income are recognised on accrual basis.
(v) Income from export incentives such as premium on sale of import licences, duty drawback etc. are recognised
on accrual basis to the extent the ultimate realisation is reasonably certain.
(vi) Dividend income is recongnised when right to receive dividend is established.
(m) Retirement and other benefi ts to employees
(i) Gratuity
Liabilities with regard to the gratuity benefi ts payable in future are determined by actuarial valuation at each
Balance Sheet date using the Projected Unit Credit method, except for Marico Middle East FZE and Kaya Middle
East FZE, where such liabilities are determined on arithmetical basis instead of actuarial valuation. Actuarial gains
and losses arising from changes in actuarial assumptions are recognised in the Statement of Profi t and Loss
in the period in which they arise. Gratuity liability in respect of Marico Limited is funded and in respect of other
subsidiaries gratuity liability is unfunded.
(ii) Superannuation
The Company makes contribution to the Superannuation Scheme, a defi ned contribution scheme, administered
by ICICI Prudential Life Insurance Company Limited. The Company has no obligation to the scheme beyond its
monthly contributions.
notes to consolidated financial statements for the year ended march 31, 2012

M A R I C O L I M I T E D
51
(iii) Leave encashment / Compensated absences
The Company provides for the encashment of leave with pay subject to certain rules. The employees are entitled
to accumulate leave subject to certain limits, for future encashment / availment. The liability is provided based
on the number of days of unutilized leave at each balance sheet date on the basis of an independent actuarial
valuation, except in case of Marico Middle East FZE, Kaya Middle East FZE and Marico South Africa Consumer
Care (Pty) Limited, where such liabilities are determined on arithmetical basis instead of actuarial valuation.
(iv) Provident fund
Provident fund contributions are made to a trust administered by the Company. The Company’s liability is
actuarially determined (using the Projected Unit Credit method) at the end of the year and any shortfall in the
fund size maintained by the Trust set up by the Company is additionally provided for. Actuarial losses and gains
are recognised in the Statement of Profi t and Loss in the year in which they arise.
(n) Foreign currency transactions
(i) Transactions in foreign currencies are recognised at the prevailing exchange rates on the transaction dates.
Realized gains and losses on settlement of foreign currency transactions are recognised in the Statement of
Profi t and Loss.
(ii) Foreign currency monetary assets and liabilities at the year end are translated at the year end exchange rates and
the resultant exchange differences except those qualifying for hedge accounting are recognised in the Statement
of Profi t and Loss.
(iii) In case of forward contracts with underlying assets or liabilities, the difference between the forward rate and
the exchange rate on the date of inception of a forward contract is recognised as income or expense and is
amortised over the life of the contract. Exchange differences on such contracts are recognised in the Statement
of Profi t and Loss in the year in which they arise. Any profi t or loss arising on cancellation or renewal of forward
exchange contracts are recognised as income or expense for the period.
(iv) The Company uses forward and options contracts to hedge its risks associated with foreign currency transactions
relating to certain fi rm commitments and forecasted transactions. The Company also uses Interest rates swap
contracts to hedge its interest rate risk exposure. The Company designates these as cash fl ow hedges. These
contracts are marked to market as at the year end and resultant exchange differences, to the extent they represent
effective portion of the hedge, are recognised directly in ‘Hedge Reserve’. The ineffective portion of the same is
recognised immediately in the Statement of Profi t and Loss.
(v) Exchange differences taken to Hedge Reserve account are recognised in the Statement of Profi t and Loss upon
crystallization of fi rm commitments or occurrence of forecasted transactions or upon discontinuation of hedge
accounting resulting from expiry / sale / termination of hedge instrument or upon hedge becoming ineffective.
(o) Accounting for taxes on income
i) Current income tax expense comprises taxes on income from operations in India and in foreign jurisdictions.
Income tax payable in India is made, based on the tax payable under the Income Tax Act, 1961. Minimum
Alternative Tax (MAT) credit, which is equal to the excess of MAT (calculated in accordance with provisions of
Section 115JB of the Income tax Act, 1961) over normal income tax is recognised as an asset by crediting the
Statement of Profi t and Loss only when and to the extent there is convincing evidence that the Company will be
able to avail the said credit against normal tax payable during the period of ten succeeding assessment years.
ii) Deferred tax on timing differences between taxable income and accounting income is accounted for, using the
tax rates and the tax laws enacted or substantively enacted as on the balance sheet date. Deferred tax assets on
unabsorbed tax losses and unabsorbed tax depreciation are recognised only when there is a virtual certainty of their
realisation. Other deferred tax assets are recognised only when there is a reasonable certainty of their realization.
notes to consolidated financial statements for the year ended march 31, 2012

M A R I C O L I M I T E D
52
(p) Impairment
The Company reviews the carrying values of tangible and intangible assets for any possible impairment at each
balance sheet date. An impairment loss is recognised when the carrying amount of an asset exceeds its recoverable
amount. The recoverable amount is the greater of net selling price and value in use. In assessing the value in use,
the estimated future cash fl ows are discounted to their present value at appropriate discount rates. If at the balance
sheet date there is an indication that a previously assessed impairment loss no longer exists, the recoverable amount
is reassessed and the asset is refl ected at the recoverable amount.
(q) Employee Stock Option Plan
In respect of stock options granted pursuant to the Company’s Employee Stock Option Scheme, the intrinsic value of
the options (excess of market value of shares over the exercise price of the option at the date of grant) is recognised
as Employee compensation cost over the vesting period.
(r) Employee Stock Appreciation Rights Scheme
In respect of Employee Stock appreciation rights granted pursuant to the Company’s Employee Stock Appreciation
Rights Scheme, the intrinsic value of the rights (excess of market value as at the year-end and the Grant Price) is
recognised as Employee compensation cost over the vesting period.
(s) Provisions and Contingent Liabilities
Contingent Liabilities are disclosed in respect of possible obligations that arise from past events but their existence
will be confi rmed by the occurrence or non-occurrence of one or more uncertain future events not wholly within the
control of the Company or where any present obligation cannot be measured in terms of future outfl ow of resources
or where a reliable estimate of the obligation cannot be made.
A provision is made based on a reliable estimate when it is probable that an outfl ow of resources embodying economic
benefi ts will be required to settle an obligation and in respect of which a reliable estimate can be made. Provision
is not discounted and is determined based on best estimate required to settle the obligation at the year end date.
Contingent Assets are not recognised or disclosed in the fi nancial statements.
(t) Cash and Cash Equivalents
In the cash fl ow statement, cash and cash equivalents includes cash in hand, demand deposits with banks, other
short-term highly liquid investments with original maturities of three months or less.
(u) Earnings Per Share
Basic earnings per share is calculated by dividing the net profi t or loss for the period attributable to equity shareholders
by the weighted average number of equity shares outstanding during the period. Earnings considered in ascertaining the
Company’s earnings per share is the net profi t for the period after deducting preference dividends and any attributable
tax thereto for the period. The weighted average number of equity shares outstanding during the period and for all
periods presented is adjusted for events, such as bonus shares, other than the conversion of potential equity shares,
that have changed the number of equity shares outstanding, without a corresponding change in resources. For the
purpose of calculating diluted earnings per share, the net profi t or loss for the period attributable to equity shareholders
and the weighted average number of shares outstanding during the period is adjusted for the effects of all dilutive
potential equity shares.
notes to consolidated financial statements for the year ended march 31, 2012

M A R I C O L I M I T E D
53
4 Share capital
As at March 31,
2012 2011
Rs. Crore Rs. Crore
650,000,000 (650,000,000) equity shares of Re. 1/- each 65.00 65.00
150,000,000 (150,000,000) preference shares of Rs. 10/- each 150.00 150.00
Total 215.00 215.00
Issued, subscribed and paid-up
614,934,387 (614,399,550) equity shares of Re. 1/- each fully paid-up 61.49 61.44
Total 61.49 61.44
a Reconciliation of number of shares
Equity Shares :
Particulars As at March 31,
2012 2011
Number of
shares
Rs. Crore Number of
shares
Rs. Crore
Balance as at the beginning of the year 614,399,550 61.44 609,325,700 60.93
Shares Issued during the year - ESOP (Refer
note (d) below)
534,837 0.05 5,073,850 0.51
Balance as at the end of the year 614,934,387 61.49 614,399,550 61.44
b Rights, preferences and restrictions attached to shares:
Equity Shares: The Company has one class of equity shares having a par value of Re.1 per share. Each shareholder
is eligible for one vote per share held. The dividend proposed by the Board of Directors is subject to the approval of
the shareholders in the ensuing Annual General Meeting, except in case of interim dividend. In the event of liquidation,
the equity shareholders are eligible to receive the remaining assets of the Company after distribution of all preferential
amounts, in proportion to their shareholding.
c Details of shares held by shareholders holding more than 5% of the aggregate shares in the Company
Name of Shareholder As at March 31,2012 2011
No. of
Shares held
% of Holding No. of Shares
held
% of Holding
Equity Shares of Re. 1/- each fully paid-up
Harsh C Mariwala (As a representative of Valentine Family Trust)
73,376,000 11.93 73,376,000 11.94
Harsh C Mariwala (As a representative of Aquarius Family Trust)
73,376,000 11.93 73,376,000 11.94
Harsh C Mariwala (As a representative of Taurus Family Trust)
73,376,000 11.93 73,376,000 11.94
Harsh C Mariwala (As a representative of Gemini Family Trust)
73,376,000 11.93 73,376,000 11.94
Arisaig Partners (Asia) Pte Ltd 35,353,269 5.75 35,353,269 5.75
Oppenheimer Developing Markets Fund (Royal Bank of Scotland)
30,906,283 5.03 31,780,318 5.17
notes to consolidated financial statements for the year ended march 31, 2012

M A R I C O L I M I T E D
54
d Shares reserved for issue under options :
The Corporate Governance Committee of the Board of Directors of Marico Limited has granted Stock Options to
certain eligible employees pursuant to the Marico ‘Employees Stock Options Scheme 2007’ (“Scheme”). Each option
represents 1 equity share in the Company. The Vesting period and the Exercise Period both range from 1 year to 5
years.
The Scheme is administered by a Corporate Governance Committee comprising of independent Directors. The
weighted average share price of options excerised during the year was Rs. 56.98 (Rs. 55.57).The Scheme lapses on
February 1, 2013. The options outstanding as on the Balance Sheet date correspond to about 0.13% (0.39%) of the
current paid-up equity share capital of the Company.
As at March 31,2012 2011
Rs. Crore Rs. Crore
Number of options granted, exercised, and forfeited
Balance as at beginning of the year 2,388,050 7,816,800
Granted during the year – –
Less : Exercised during the year 534,837 5,073,850
Forfeited / lapsed during the year 1,074,900 354,900
Balance as at end of the year 778,313 2,388,050
The Company has applied the intrinsic value based method of accounting for determining compensation cost for its
stock based compensation plan and has accordingly accounted Rs. (0.04) Crore (Rs. 0.04 Crore) as compensation
cost under the ‘intrinsic value’ method (Refer note 28). Had the Company considered ‘fair value’ method for accounting
of compensation cost, the Company’s net income and Basic and Diluted earnings per share as reported would have
reduced to the pro-forma amounts as indicated:
As at March 31,2012 2011
Rs. Crore Rs. Crore
Net Profi t after tax as reported (Rs. Crore) 317.11 286.44
Less : Stock-based employee compensation expense (Rs. Crore) 0.32 1.76
Adjusted pro-forma (Rs. Crore) 316.79 284.68
Basic earnings per share as reported Rs. 5.16 Rs. 4.68
Pro-forma basic earnings per share Rs. 5.15 Rs. 4.65
Diluted earnings per share as reported Rs. 5.15 Rs. 4.65
Pro-forma diluted earnings per share Rs. 5.15 Rs. 4.63
The following assumptions were used for calculation of fair value of grants:
As at March 31,
2012 2011
Rs. Crore Rs. Crore
Risk-free interest rate - Vest 1 (%) 6.61% 6.61%
Risk-free interest rate - Vest 2 (%) 7.27% 7.27%
Expected life of options (years) 5 years 5 years
Expected volatility - Vest 1 (%) 35.32% 35.32%
Expected volatility - Vest 2 (%) 36.92% 36.92%
Dividend yield 1.20% 1.20%
notes to consolidated financial statements for the year ended march 31, 2012

M A R I C O L I M I T E D
55
5 Reserves and surplus
As at March 31,2012 2011
Rs. Crore Rs. Crore
Securities Premium Reserve
Balance as at the beginning of the year 59.49 31.29
Add : Receipt on exercise of Employees Stock Options 3.03 28.08
Add : Transferred from Employee Stock Options outstanding 0.01 0.12
Balance as at the end of the year 62.53 59.49
Debenture Redemption Reserve
Balance as at the beginning of the year 31.67 15.00
Add : Amount transferred from Surplus in the Statement of Profi t and Loss 20.00 16.67
Less: Amount transferred to General reserve on redemption (30.00) –
Balance as at the end of the year 21.67 31.67
Employee Stock Options Outstanding Account (Refer note 4 (d))
Balance as at the beginning of the year 0.07 0.15
Add : Compensation for options granted during the year – 0.08
Less : Transferred to Securities Premium Reserve on exercise of stock options 0.01 0.12
Less : Forefeited / lapsed 0.04 0.04
Balance as at the end of the year 0.02 0.07
General Reserve
Balance as at the beginning of the year 123.19 91.66
Add : Amount transferred from Surplus in the Statement of Profi t and Loss 33.66 31.53
Add: Amount transferred from Debenture Redemption Reserve on redemption 30.00 –
Balance as at the end of the year 186.85 123.19
Hedge Reserve (Refer note 39 (c))
Balance as at the beginning of the year 4.99 2.81
Adjustments during the year (38.91) 2.18
Balance as at the end of the year (33.92) 4.99
Foreign Currency Translation Reserve
Balance as at the beginning of the year (9.86) (0.83)
Exchange gain/(loss) on translation during the year (3.76) (9.03)
Balance as at the end of the year (13.62) (9.86)
Surplus in the Statement of Profit and Loss
Balance as at the beginning of the year 644.49 452.95
Add : Profi t during the year 317.11 286.44
Less: Appropriations :
Interim dividend 43.04 40.54
Dividend distribution tax on Interim dividend 6.98 6.65
Minority share in accumulated profi ts (0.07) (0.49)
Transfer to Debenture Redemption Reserve 20.00 16.67
Transfer to General Reserve 33.66 31.53
Balance as at the end of the year 857.99 644.49
Total 1,081.52 854.04
Minority share in accumulated profi ts of Rs. 0.07 Crore (Rs. 0.49 Crore) represents adjustments relating to earlier year.
notes to consolidated financial statements for the year ended march 31, 2012

M A R I C O L I M I T E D
56
6 Long-term borrowings
As at March 31,2012 2011
Rs. Crore Rs. Crore
Secured
From banks
External commercial borrowings from Standard Chartered Bank
(Loan carries interest @ LIBOR plus 1.3%. Original loan amount of USD 15 million
was payable in 12 equal quarterly installments of USD 1.25 million along with interest
commencing from February 26, 2010. Loan amount outstanding of USD 3.75 millions
as at March 31 2012 has been shown under other current liabilities as current
maturities of long term debt (Refer note 11). The loan is secured by hypothecation
of plant and machinery).
– 16.72
External Commercial Borrowing from HSBC bank
(Loan carries interest @ LIBOR plus 2.1% and is secured by (i) Pledge of shares
of International Consumer Products Corporation (a Subsidiary company) (ii) First
ranking pari passu charge over all current and future plant and machinery and
(iii) Mortgage on land and building situated at Andheri, Mumbai.)
The loan is repayable over a period of 6 years commencing from 28th February
2011 as under:-
1st installment - USD 3 million - payable at the end of 36 months
2nd installment - USD 3 million - payable at the end of 42 months
3rd installment - USD 6 million - payable at the end of 48 months
4th installment - USD 6 million - payable at the end of 54 months
5th installment - USD 9 million - payable at the end of 60 months
6th installment - USD 12 million - payable at the end of 66 months
7th installment - USD 15 million - payable at the end of 72 months
Total Amount - USD 54 million
274.73 240.76
Term loan from Citibank N.A.
(Loan carries interest @ ‘Swap Offer Rate’ plus 3% on quarterly basis and is secured
by (i) fi xed charge over all the fi xed property and assets of one of the subsidiaries,
namely, Derma – Rx International Aesthetics Pte Ltd. (DIAL) including all machinery
and equipment of its subsidiaries; (ii) shares held by DIAL in each of its subsidiaries;
(iii) shares held by Kaya Limited in DIAL and (iv) Corporate guarantee of Marico
Limited)
65.94 74.25
(Original loan amount of SGD 21 million was outstanding as at March 31, 2011.
The loan amount of SGD 4 million was prematurely repaid during the year and the
balance amount of SGD 17 million outstanding as at March 31, 2012 is payable in
20 equal quarterly installments of SGD 0.85 million each commencing from March
22, 2013 and ending on December 15, 2017. Loan amount outstanding of SGD
0.85 millions as at March 31, 2012 has been shown under other current liabilities as
current maturities of long term debt) (Refer note 11)
340.67 331.73
notes to consolidated financial statements for the year ended march 31, 2012

M A R I C O L I M I T E D
57
As at March 31,2012 2011
Rs. Crore Rs. Crore
Unsecured
Debentures
500, 10.05%, Rated Taxable Unsecured Redeemable Non-convertible debentures
of face value of Rs. 10,00,000/- each50.00 50.00
50.00 50.00
Total 390.67 381.73
The above debentures were issued on March 30, 2011 and are redeemable at par after 30 months from the date of issue
i.e. by September 30, 2013. Interest on these debentures is payable at an interval of 12 months. The debentures are listed
on National Stock Exchange.
7 Other long-term liabilities
As at March 31,2012 2011
Rs. Crore Rs. Crore
Advances from customers 0.63 0.57
Total 0.63 0.57
8 Long term provisions
As at March 31,2012 2011
Rs. Crore Rs. Crore
Provision for employee benefits
Gratuity 4.10 4.52
Employee Stock Appreciation Rights Scheme (Refer note (a) to (c) below) 5.96 0.02
10.06 4.54
Others:
Provision for equalisation of rent expenses (Refer note (d) below) 2.03 1.44
Provision for site restoration cost (Refer note (e) below) 1.26 1.50
Provision for contingent consideration (Refer note (f) below) 28.58 37.12
31.87 40.06
Total 41.93 44.60
a The Corporate Governance Committee has granted Stock Appreciation Rights (“STAR”) to certain eligible employees
pursuant to the Company’s Employee Stock Appreciation Rights Plan, 2011 (“Plan”). The grant price is determined
based on a formulae as defi ned in the Plan. There are two schemes under the Plan with different vesting period. Under
the Plan, the respective employees are entitled to receive excess of the maturity price over the grant price subject to
fulfi lment of certain conditions. The difference between the market price of Company’s shares as at the year end and
the grant price is recognised over the vesting period and accordingly an amount of Rs. 5.94 Crore (Rs. 0.02 Crore) is
charged in the Statement of Profi t and Loss. The Plan is administered by Corporate Governance Committee comprising
of independent directors.
b The Company has formed “Welfare of Mariconians Trust” (The trust) for the implementation and admistration of
Schemes that are notifi ed or may be notifi ed from time to time by the Company under the Plan as at March 31, 2012.
The Company has advanced Rs. 19.92 Crore (Nil) to the Trust for purchase of shares under the Plan, which are included
under “Long term loans and advances” (refer note 17).
notes to consolidated financial statements for the year ended march 31, 2012

M A R I C O L I M I T E D
58
c Details of STAR Grant Schemes :
STAR Scheme I
As at March 31,2012 2011
Grant Date March 28, 2011 March 28, 2011
Grant Price (Rs.) 129.33 129.33
Vesting Date September 30, 2013 September 30, 2013
Grants outstanding at the beginning of the year 3,411,600 –
Add : Granted during the year – 3,411,600
Less : Forfeited during the year 360,000 –
Grants at the end of the year 3,051,600 3,411,600
STAR Scheme II
As at March 31,
2012 2011
Grant Date December 1, 2011 –
Grant Price (Rs.) 148.53 –
Vesting Date November 30,2014 –
Grants outstanding at the beginning of the year – –
Add : Granted during the year 1,107,600 –
Less : Forfeited during the year 12,600 –
Grants at the end of the year 1,095,000 –
d Provision for equalisation of rent expenses represents provision made towards additional liability created to recognise
rent expenses on straight line basis over the lease period.
e Movement in Provision for site restoration cost
As at March 31,2012 2011
Rs. Crore Rs. Crore
Balance as at the beginning of the year 1.52 1.52
Additions during the year 0.03 –
Amounts used during the year (0.05) –
Balance as at the end of the year 1.50 1.52
Classifi ed as Non-current: 1.26 1.50
Classifi ed as current: (Refer note 12) 0.24 0.02
Total 1.50 1.52
Provision for site restoration cost represents estimates made for probable liability towards the restoration of leased
premises, at the end of the lease period.
notes to consolidated financial statements for the year ended march 31, 2012

M A R I C O L I M I T E D
59
f During the year ended March 31, 2011, the Group acquired the skin care business of Derma Rx in Singapore and
Malaysia. As per the agreement, the total contingent consideration of Rs. 56.60 Crore (SGD 16,000,000 converted
at the exchange rate as at March 31, 2011), is payable over the three years period commencing from May 25, 2010
upon achievement of certain milestones such as turnover, profi ts etc.
Based on the assessment of the performance of Derma Rx business since the acquisition, the management has
assessed that it is more than probable that a consideration of Rs. 45.99 Crore (SGD 13,000,000 converted at the
exchange rate as at March 31, 2011) would be payable. Accordingly, the Group had considered the provision of the
said amount during the year ended March 31, 2011.
The balance contingent consideration of Rs. 12.25 Crore (Rs. 10.60 Crore) (SGD 3,000,000 converted as at respective
year end exchange rates) is considered as contingent liability as at the year end.
During the year based on the actual achievement of turnover and profi t milestones as envisaged for year 1 of the
acquisition the company paid a consideration of Rs. 9.54 Crore (SGD 2,500,000) to the vendors. There are no changes
in the acquisition assumptions during the year.
Movement in Provision for contingent consideration
As at March 31,2012 2011
Rs. Crore Rs. Crore
Balance as at the beginning of the year 45.99 –
Add: Provision made during the year – 45.99
Less: Provision utilised / reversed during the year 9.54 –
Add: Net exchange loss on transaction and translation 6.42 –
Balance as at the end of the year 42.87 45.99
Classifi ed as Non-current: 28.58 37.12
Classifi ed as current: (Refer note 12) 14.29 8.87
Total 42.87 45.99
notes to consolidated financial statements for the year ended march 31, 2012
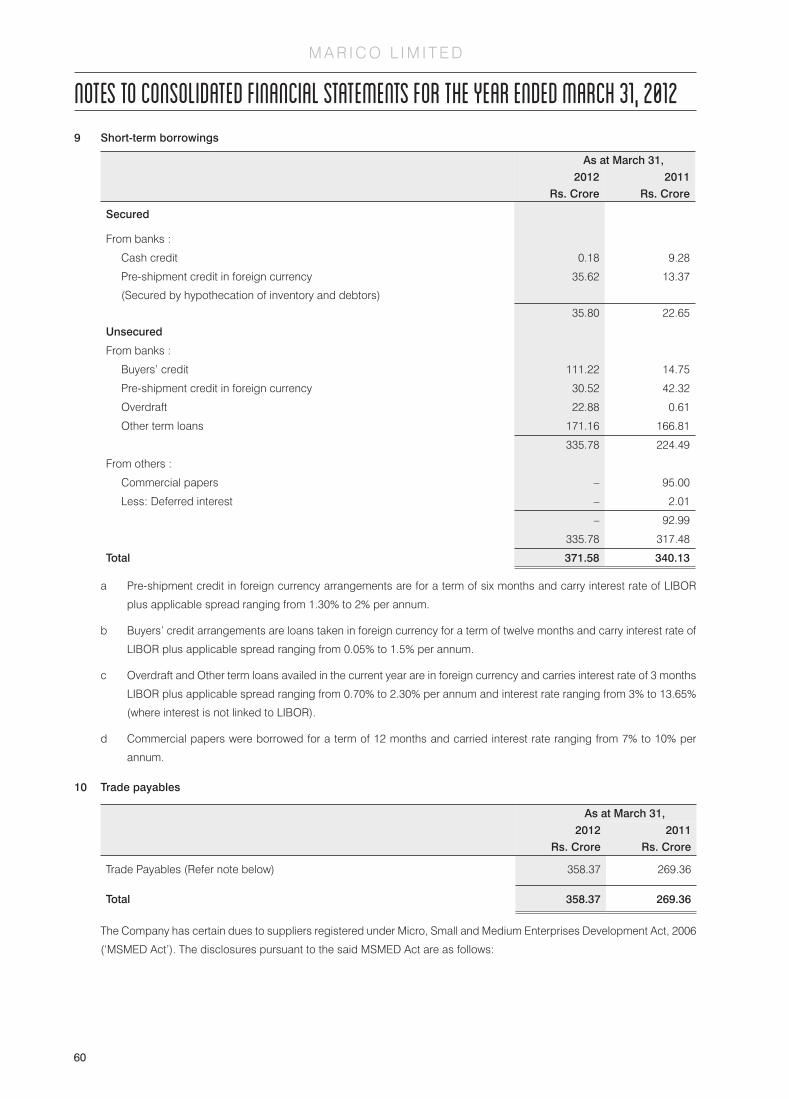
M A R I C O L I M I T E D
60
9 Short-term borrowings
As at March 31,2012 2011
Rs. Crore Rs. Crore
Secured
From banks :
Cash credit 0.18 9.28
Pre-shipment credit in foreign currency
(Secured by hypothecation of inventory and debtors)
35.62 13.37
35.80 22.65
Unsecured
From banks :
Buyers’ credit 111.22 14.75
Pre-shipment credit in foreign currency 30.52 42.32
Overdraft 22.88 0.61
Other term loans 171.16 166.81
335.78 224.49
From others :
Commercial papers – 95.00
Less: Deferred interest – 2.01
– 92.99
335.78 317.48
Total 371.58 340.13
a Pre-shipment credit in foreign currency arrangements are for a term of six months and carry interest rate of LIBOR
plus applicable spread ranging from 1.30% to 2% per annum.
b Buyers’ credit arrangements are loans taken in foreign currency for a term of twelve months and carry interest rate of
LIBOR plus applicable spread ranging from 0.05% to 1.5% per annum.
c Overdraft and Other term loans availed in the current year are in foreign currency and carries interest rate of 3 months
LIBOR plus applicable spread ranging from 0.70% to 2.30% per annum and interest rate ranging from 3% to 13.65%
(where interest is not linked to LIBOR).
d Commercial papers were borrowed for a term of 12 months and carried interest rate ranging from 7% to 10% per
annum.
10 Trade payables
As at March 31,2012 2011
Rs. Crore Rs. Crore
Trade Payables (Refer note below) 358.37 269.36
Total 358.37 269.36
The Company has certain dues to suppliers registered under Micro, Small and Medium Enterprises Development Act, 2006
(‘MSMED Act’). The disclosures pursuant to the said MSMED Act are as follows:
notes to consolidated financial statements for the year ended march 31, 2012

M A R I C O L I M I T E D
61
As at March 31,2012 2011
Rs. Crore Rs. Crore
Principal amount due to suppliers registered under the MSMED Act and remaining
unpaid as at year end.
13.95 1.53
Interest due to suppliers registered under the MSMED Act and remaining unpaid
as at year end.
0.09 0.01
Principal amounts paid to suppliers registered under the MSMED Act, beyond the
appointed day during the year.
– –
Interest paid other than under Section 16 of MSMED Act to suppliers registered
under the MSMED Act, beyond the appointed day during the year.
– –
Interest paid under Section 16 of MSMED Act to suppliers registered under the
MSMED Act beyond the appointed day during the year.
– –
Interest due and payable towards suppliers registered under MSMED Act for
payments already made
– –
Further interest remaining due and payable for earlier years. 0.01 –
11 Other current liabilities
As at March 31,2012 2011
Rs. Crore Rs. Crore
Current maturities of long-term debt:
External commercial borrowings from Standard Chartered Bank
(Refer note 6)
19.08 22.29
Secured Redeemable Non-Convertible Debentures (Refer note (a) below) – 30.00
Term loan from Citibank N.A. (Refer note 6) 3.47 –
22.55 52.29
Interest accrued but not due on borrowings 1.20 3.47
Interest accrued and due on borrowings – 0.01
Unpaid dividends (Refer note (b) below) 0.16 0.23
Unclaimed Redeemed 8% Preference Share Capital – 0.03
Book overdraft 10.55 3.65
Other payables :
Provision for contractual liabilities 29.67 15.92
Advances from customers 87.15 60.43
Statutory dues including provident fund and tax deducted at source 21.41 17.20
Forward/ derivative contracts payables – 2.58
Creditors for capital goods 2.45 1.44
Security deposits from customers and others 0.36 0.25
Employee benefi ts payable 31.91 24.66
Others 0.78 0.50
Total 208.19 182.66
a The Company had issued 300 8.25% Rated Taxable Secured Redeemable Non - Convertible Debentures of Face Value
Rs. 10 lakhs each on May 8, 2009 which were secured against fi rst pari passu charge over Land and Building situated in
Andheri (East) Mumbai, aggregating to Rs. 30 Crore and same were redeemable at par after 3 years. As per the terms of
the issue Put / Call option was available with the Investors / Company at the end of 2 years. Investors exercised the option
and debentures were repaid during the year. These debentures were listed on the National Stock Exchange.
notes to consolidated financial statements for the year ended march 31, 2012

M A R I C O L I M I T E D
62
b The following amounts are payable towards the Investors Education and Protection Fund account :
As at March 31,2012 2011
Rs. Crore Rs. Crore
Third interim dividend of year 2003-04 – 0.01
Preference Shares redemption – 0.02
12 Short-term provisions
As at March 31,2012 2011
Rs. Crore Rs. Crore
Provision for employee benefi ts:
Gratuity 0.41 0.95
Leave encashment 9.97 7.39
Others 2.46 1.41
12.84 9.75
Others :
Income tax - (net ) (refer note (a) below) 9.08 23.18
Interim dividend 24.60 22.11
Dividend distribution tax on Interim dividend 4.28 3.67 Provision for contingent consideration (Refer note 8(f)) 14.29 8.87 Disputed taxes / claims (Refer notes (b) below) 11.78 8.74
Provision for equalisation of rent expenses (Refer note 8(d)) 0.50 0.16
Provision for lease termination cost (Refer note (c) below) 0.13 0.22
Provision for site restoration cost (Refer note 8(e)) 0.24 0.02
Total 77.74 76.72
a Provison for income tax is net off advance tax and other tax payments of Rs.354.64 Crore (Rs. 252.61 Crore)
b Provision for disputed taxes (other than Income tax) / claims represents claims against the Company not acknowledged as debts, where management has assessed that unfavourable outcome of the matter is more than probable.
Movement in provision for disputed tax/ claims
As at March 31,
2012 2011
Rs. Crore Rs. CroreBalance as at the beginning of the year 8.74 7.41
Add: Additions during the year 4.27 1.48
Less: Unused amounts reversed during the year 1.23 0.15
Balance as at the end of the year 11.78 8.74
c Provision for lease termination cost represent estimates made for probable liability arising on account of closure of
Kaya Life operations and close down of seven clinics of Kaya Skin in the earlier years.
Movement in provision for disputed taxes / claims
As at March 31,2012 2011
Rs. Crore Rs. Crore
Balance as at the beginning of the year 0.22 2.44
Less: Amounts used during the year 0.09 2.22
Balance as at the end of the year 0.13 0.22
notes to consolidated financial statements for the year ended march 31, 2012

M A R I C O L I M I T E D
63
notes to consolidated financial statements for the year ended march 31, 201213
(A
) Ta
ngib
le a
sset
sPA
RTIC
ULAR
SG
R O
S S
B
L O
C K
D E
P R
E C
I A
T I
O N
/ A
M O
R T
I S
A T
I O N
/ I M
P A
I R
M E
N T
N
E T
B L
O C
KAs
at
April
1, 2
011
Acqu
isiti
on(R
efer
not
e (i)
belo
w)
Addi
tions
Dedu
ctio
ns /
Adju
stm
ents
As a
tM
arch
31,
201
2
As a
tAp
ril 1
, 201
1Ac
quis
ition
(Ref
er n
ote
(i)be
low)
For t
he
Year
(Ref
er n
otes
(h)
and
(j) b
elow
)
Dedu
ctio
ns /
Adju
stm
ents
As
at
Mar
ch 3
1,
2012
Pro
visio
n fo
r im
pairm
ent
as a
t Ap
ril 1
, 201
1
Char
ge /
(Rev
ersa
l) fo
r the
ye
ar (R
efer
not
e (f)
bel
ow
Dedu
ct-
ions
/ Ad
just
m-e
nts
Pro
visio
n fo
r im
pairm
ent
as a
t Mar
ch
31, 2
012
As a
tM
arch
31,
20
12
As a
tM
arch
31,
20
11
Tang
ible
ass
ets
Free
hold
land
5.3
5 -
8.6
2 (0
.07)
14.
04
- -
- -
- -
- -
- 1
4.04
5
.35
Leas
ehol
d lan
d 2
7.13
-
8.1
9 (1
.64)
36.
96
1.0
5 -
0.4
8 (0
.13)
1.6
6 -
- -
- 3
5.30
2
6.08
Bu
ilding
s (Re
fer n
ote
(a) b
elow)
146
.81
- 8
.77
(2.5
1) 1
58.0
9 2
7.78
-
6.9
2 (0
.91)
35.
61
- -
- -
122
.48
119
.03
Plan
t and
equ
ipm
ent (
Refe
r not
es (b
) and
(c) b
elow)
374
.26
- 5
3.51
8
.49
419
.28
205
.70
- 4
1.10
1
0.55
2
36.2
5 1
3.87
1
.73
(0.0
4) 1
5.64
1
67.3
9 1
54.6
9 Fu
rnitu
re a
nd fi x
ture
s 4
6.91
-
6.0
2 (5
.24)
58.
17
20.
83
- 6
.62
(1.4
5) 2
8.90
2
.11
0.5
6 (0
.06)
2.7
3 2
6.54
2
3.97
Ve
hicles
5.4
7 -
1.4
6 1
.58
5.3
5 2
.73
- 1
.17
0.7
8 3
.12
- -
- -
2.2
3 2
.74
Offi c
e eq
uipm
ent
11.
81
- 2
.60
0.9
0 1
3.51
6
.52
- 2
.14
0.7
2 7
.94
0.3
7 0
.12
- 0
.49
5.0
8 4
.92
Leas
ehol
d im
prov
emen
ts -
- 0
.44
- 0
.44
- -
0.0
4 -
0.0
4 -
0.1
2 -
0.1
2 0
.28
- TO
TAL
(A)
617
.74
- 8
9.61
1
.51
705
.84
264
.61
- 5
8.47
9
.56
313
.52
16.
35
2.5
3 (0
.10)
18.
98
373.
34
336.
78
Prev
ious
Yea
r 4
49.4
5 3
1.49
1
59.1
9 2
2.39
6
17.7
4 2
03.6
0 1
6.88
5
7.07
1
2.94
2
64.6
1 1
2.16
7
.73
3.5
4 1
6.35
33
6.78
13 (
B)
Inta
ngib
le a
sset
sPA
RTIC
ULAR
SG
R O
S S
B
L O
C K
D E
P R
E C
I A
T I
O N
/ A
M O
R T
I S
A T
I O N
/ I M
P A
I R
M E
N T
N
E T
B L
O C
KAs
at
April
1, 2
011
Acqu
isiti
on(R
efer
not
e (i)
belo
w)
Addi
tions
Dedu
ctio
ns /
Adju
stm
ents
As a
tM
arch
31,
201
2
As a
tAp
ril 1
, 201
1Ac
quis
ition
(Ref
er n
ote
(i)be
low)
For t
he
Year
(Ref
er n
otes
(h)
and
(j) b
elow
)
Dedu
ctio
ns /
Adju
stm
ents
As
at
Mar
ch 3
1,
2012
Pro
visio
n fo
r im
pairm
ent
as a
t Ap
ril 1
, 201
1
Char
ge /
(Rev
ersa
l) fo
r the
ye
ar (R
efer
not
e (f)
bel
ow
Dedu
ct-
ions
/ Ad
just
m-e
nts
Pro
visio
n fo
r im
pairm
ent
as a
t Mar
ch
31, 2
012
As a
tM
arch
31,
20
12
As a
tM
arch
31,
20
11
Inta
ngib
le a
sset
sTra
dem
arks
and
cop
yrig
hts (
Refe
r not
e (k
) belo
w) 1
21.5
8 -
0.2
4 (1
2.26
) 1
34.0
8 1
9.87
-
10.
47
(1.7
5) 3
2.09
1
6.20
-
(0.0
1) 1
6.21
8
5.78
8
5.51
O
ther
inta
ngib
les 1
.52
- 0
.01
0.0
5 1
.48
1.0
9 -
0.4
2 0
.03
1.4
8 -
- -
- -
0.4
3 Co
mpu
ter s
oftw
are
20.
67
- 2
.05
(0.6
6) 2
3.38
1
8.33
-
2.1
7 (0
.26)
20.
76
- 0
.07
- 0
.07
2.5
5 2
.34
TOTA
L (B
) 1
43.7
7 -
2.3
0 (1
2.87
) 1
58.9
4 3
9.29
-
13.
06
(1.9
8) 5
4.33
1
6.20
0
.07
(0.0
1) 1
6.28
8
8.33
8
8.28
Pr
evio
us y
ear
79.
73
2.5
2 5
8.08
(3
.44)
143
.77
24.
30
1.4
0 1
3.71
0
.12
39.
29
2.2
5 1
3.91
(0
.04)
16.
20
88.
28
Tota
l (A)
+(B
) 7
61.5
1 -
91.
91
(11.
36)
864
.78
303
.90
- 7
1.53
7
.58
367
.85
32.
55
2.6
0 (0
.11)
35.
26
461.
67
425.
06
Tota
l Pre
vious
yea
r 5
29.1
8 3
4.01
2
17.2
7 1
8.95
7
61.5
1 2
27.9
0 1
8.28
7
0.78
1
3.06
3
03.9
0 1
4.41
2
1.64
3
.50
32.
55
425.
06
(a)
Gro
ss b
lock
of B
uild
ings
incl
udes
Rs.
Nil
(Rs.
0.1
0 C
rore
) whe
re c
onve
yanc
e ha
s be
en e
xecu
ted,
pen
ding
regi
stra
tion.
(b)
The
borr
owin
g co
st c
apita
lised
to P
lant
and
equ
ipm
ent R
s. N
il (R
s.0.
56 C
rore
)(c
) A
dditi
on to
Pla
nt a
nd e
quip
men
t are
net
of C
entra
l Cap
ital I
nves
tmen
t Sub
sidy
of R
s. 0
.30
Cro
re (R
s. N
il) re
ceiv
ed fr
om th
e G
over
nmen
t of H
imac
hal P
rade
sh in
resp
ect o
f Poa
nta
plan
t.(d
) D
urin
g th
e ye
ar e
nded
Mar
ch 3
1, 2
007,
the
Com
pany
car
ried
out fi
nan
cial
res
truct
urin
g sc
hem
e (‘S
chem
e’)
unde
r th
e re
leva
nt p
rovi
sion
s of
the
Com
pani
es A
ct, 1
956
whi
ch w
as a
ppro
ved
by th
e sh
areh
olde
rs o
n Fe
brua
ry 8
, 20
07 a
nd s
ubse
quen
tly b
y th
e H
on’b
le H
igh
Cou
rt vi
de it
s or
der d
ated
Mar
ch 2
3, 2
007.
In te
rms
of th
e S
chem
e, th
e C
ompa
ny a
djus
ted
the
carr
ying
val
ue o
f Rs.
448
.15
Cro
re o
f int
angi
ble
asse
ts s
uch
as tr
adem
arks
, cop
yrig
hts,
bu
sine
ss a
nd c
omm
erci
al ri
ghts
as
on J
anua
ry 3
1, 2
007
and
rela
ted
defe
rred
tax
adju
stm
ent o
f Rs.
139
.06
Cro
re (n
et a
djus
tmen
t of R
s. 3
09.0
9 C
rore
) aga
inst
the
bala
nce
in S
ecur
ities
Pre
miu
m R
eser
ve o
f Rs.
129
.09
Cro
re a
nd
Cap
ital R
edem
ptio
n R
eser
ve o
f Rs.
180
Cro
re.
(e)
Dur
ing
the
year
end
ed M
arch
31,
200
7, K
aya
Lim
ited,
sub
sidi
ary
of th
e C
ompa
ny, h
ad c
arrie
d ou
t fi n
anci
al re
stru
ctur
ing
sche
me
(‘Sch
eme’
) und
er th
e re
leva
nt p
rovi
sion
s of
the
Com
pani
es A
ct, 1
956,
whi
ch w
as a
ppro
ved
by th
e sh
areh
olde
rs o
n Fe
brua
ry 7
, 200
7 an
d su
bseq
uent
ly b
y th
e H
on’b
le H
igh
Cou
rt vi
de it
s or
der d
ated
Apr
il 16
, 200
7. In
term
s of
the
Sch
eme,
Kay
a Li
mite
d ad
just
ed th
e ca
rryi
ng v
alue
of R
s. 7
.08
Cro
re o
f Pla
nt a
nd e
quip
men
t, R
s.
11.5
7 C
rore
of F
urni
ture
and
fi xt
ure,
rela
ted
defe
rred
tax
liabi
lity
of R
s. 0
.18
Cro
re a
nd a
ccum
ulat
ed lo
ss o
f Rs
24.0
0 C
rore
aga
inst
the
bala
nce
in S
ecur
ities
Pre
miu
m R
eser
ve.
(f)
Impa
irmen
t cha
rge
incl
udes
Rs.
1.7
5 C
rore
(Rs.
21.
62 C
rore
) whi
ch is
refl e
cted
as
“Exc
eptio
nal i
tem
s” in
the
Sta
tem
ent o
f Pro
fi t a
nd L
oss.
(g)
Add
ition
al in
form
atio
n on
ass
ets
give
n on
ope
ratin
g le
ase
(R
s. C
rore
)
Cos
tD
epre
ciat
ion
for
the
year
Acc
umul
ated
Dep
reci
atio
nN
et B
ook
Valu
eP
lant
and
equ
ipm
ent
2.0
3 0
.01
1.9
5 0
.08
Pre
viou
s ye
ar 2
.03
0.0
3 1
.94
0.0
9
For
the
year
end
ed M
arch
31,
2012
2011
Rs.
Cro
re
Rs.
Cro
re
Leas
e re
ntal
inco
me
reco
gnis
ed in
the
Sta
tem
ent o
f Pro
fi t a
nd L
oss
0.4
2 0
.39
(h)
Dep
reci
atio
n fo
r the
yea
r inc
lude
s ac
cele
rate
d de
prec
iatio
n ch
arge
d R
s. N
il (R
s. 3
.09
Cro
re) d
ue to
revi
sion
of e
stim
ated
use
ful l
ife o
f cer
tain
ass
ets.
(i)
Acq
uisi
tions
in G
ross
blo
ck a
nd D
epre
ciat
ion
/ am
ortis
atio
n re
pres
ents
orig
inal
cos
ts a
nd a
ccum
ulat
ed d
epre
ciat
ion,
resp
ectiv
ely,
for a
sset
s of
sub
sidi
arie
s ac
quire
d du
ring
the
prev
ious
yea
r.(j)
A
mor
tisat
ion
of in
tang
ible
ass
ets
in th
e pr
evio
us y
ear i
nclu
ded
Rs.
9.5
3 C
rore
aris
ing
on a
ccou
nt o
f cha
nge
in th
e ac
coun
ting
polic
y.(k
) Tr
adem
arks
of R
s. 8
4.72
(Rs.
71.
68 C
rore
) are
pen
ding
regi
stra
tion.
(l)
Ded
uctio
ns /
adju
stm
ent o
f Gro
ss b
lock
, dep
reci
atio
n an
d pr
ovis
ion
for i
mpa
irmen
t inc
lude
s tra
nsla
tion
diffe
renc
e of
Rs.
16.
71 C
rore
(Rs.
1.0
1 C
rore
).

M A R I C O L I M I T E D
64
14 Goodwill on consolidation
As at March 31,2012 2011
Rs. Crore Rs. Crore
Balance as at the beginning of the year 397.59 85.03
Add : Arising on acquisition during the year 0.64 321.38
Less : Adjustments during the year 2.74 –
Less : Impairment charged during the year – 8.82
Balance as at the end of the year 395.49 397.59
15 Non-current investments
As at March 31,2012 2011
Rs. Crore Rs. Crore
Long term Non-trade investments (valued at cost unless stated otherwise)
Investment Property (at cost less amortisation)
Cost of land use right 5.82 –
Less : Amortisation during the year (0.14) –
Net block 5.68 –
Other Investments :
Investments in Government SecuritiesUnquoted
National Savings Certifi cates (Deposited with the Government authorities). 0.01 0.01
Other
Quoted
Indian Infrastructure Finance Company Ltd,
(1,000 (1,000) Unsecured, 6.85% Non-convertible, tax-free Bonds of face value of
Rs. 1,00,000/- each, guaranteed by the Government of India, redeemable on 22nd
January, 2014).
10.08 10.21
Power Finance Corporation Limited
(28,479 (Nil) Secured, Redeemable, Tax free Non-convertible Bonds, 8.20%,
face value of Rs. 1,000/- each, redeemable on 1st February, 2022).
2.85 –
Indian Railway Finance Corporation
(21,751 (Nil) Secured, Redeemable, Tax free Non-convertible Bonds, 8.00%,
face value of Rs. 1,000/- each, redeemable on 23rd February, 2022).
2.18 –
National Highways Authority of India
(24,724 (Nil) Secured, Redeemable, Tax free Non-convertible Bonds, 8.20%,
face value of Rs. 1,000/- each, redeemable on 25th January, 2022).
2.47 –
Rural Electrifi cation Corporation Limited
(61,238 (Nil) Secured, Redeemable, Tax free Non-convertible Bonds, 8.12%,
face value of Rs. 1,000/- each, redeemable on 29th March, 2027).
6.12 –
23.71 10.22
Total 29.39 10.22
Aggregate amount of quoted investments 23.70 10.21
Market Value of quoted investments 23.61 10.00
Aggregate amount of unquoted investments 5.69 0.01
notes to consolidated financial statements for the year ended march 31, 2012

M A R I C O L I M I T E D
65
16 Deferred tax asset (net)
As at March 31,2012 2011
Rs. Crore Rs. CroreDeferred tax assets:
Provision for doubtful debts / advances that are deducted for tax purposes when
written off
2.16 1.17
On intangible assets adjusted against Capital Redemption Reserve and Securities
Premium Reserve under the Capital Restructuring scheme implemented in an earlier
year (Refer note 13(d))
27.49 36.53
Liabilities / provisions that are deducted for tax purposes when paid 7.69 3.55
Others 6.74 2.55
44.08 43.80
Deferred tax liability:
Additional depreciation/amortisation on fi xed assets for tax purposes due to higher
tax depreciation rates
21.74 13.90
21.74 13.90
Deferred tax assets (net) 22.34 29.90
17 Long-term loans and advances
As at March 31,2012 2011
Rs. Crore Rs. CroreUnsecured, Considered good unless stated otherwise
Capital Advances
Considered good 33.13 29.81
Considered doubtful 0.50 0.50
33.63 30.31
Less : Provision for doubtful advances 0.50 0.50
33.13 29.81
Other loans and advances:
Deposits with public bodies and others
Considered good 24.88 25.72
Considered doubtful 0.50 1.00
25.38 26.72
Less : Provision for doubtful deposits 0.50 1.00
24.88 25.72
Loans to employees 2.70 1.72
Prepaid expenses 1.39 3.46
Balance with statutory/government authorities 12.75 13.91
Advances to vendors 1.28 1.28
Loans and advances to Welfare of Mariconions Trust (Refer note 8(b)) 19.92 –
Restricted deposit - HSBC Escrow Account (Refer note 36) 25.00 –
Advance income tax (Refer note below) 3.34 0.48
Total 124.39 76.38
Advance income tax is net of provision for income tax of Rs. 2.41 Crore (Rs. 2.32 Crore)
notes to consolidated financial statements for the year ended march 31, 2012

M A R I C O L I M I T E D
66
18 Other non-current assets
As at March 31,2012 2011
Rs. Crore Rs. Crore
Fringe benefi t tax payments (net of provisions) 0.55 0.55
MAT credit entitlement 117.84 95.50
Long term deposits with banks with maturity period of more than twelve months
(Refer note below)
4.96 2.54
Interest accrued on long-term deposits with banks 0.06 0.05
Total 123.41 98.64
Long term deposits with banks includes Rs. 0.13 Crore (Rs. 0.13 Crore) deposited with sales tax authorities and Rs. 4.83
Crore (Rs. 2.41 Crore) held as lien by banks against guarantees issued on behalf of the Company.
notes to consolidated financial statements for the year ended march 31, 2012
19 Current Investments
As at March 31,2012 2011
Rs. Crore Rs. Crore
Current investments (At lower of cost and fair value)
Quoted
Investments in equity instruments – 0.77
Grameenphone Ltd.
Nil (170,229) equity shares of Bangladesh Taka 10 each fully paid
Unquoted
Investments in Mutual Funds
Birla Sun Life Cash Manager - Institutional Plan - Growth – 10.00
Nil (6,087,057) units of Rs. 10 each fully paid
Templeton India Ultra Short Bond Fund Super Institutional Plan - Growth 1.00 7.50
720,132 (5,921,645) units of Rs. 10 each fully paid
Templeton India Ultra Short Bond Fund Super Institutional Plan - Growth – 2.50
Nil (1,987,297) Units of Rs. 10 each fully paid
IDFC Money Manager Fund - TP - Institutional Plan C - Growth – 10.00
Nil (8,583,470) units of Rs. 10 each fully paid
UTI Treasury Advantage Fund - Growth – 10.00
Nil (75,743) units of Rs. 10 each fully paid
BPBIG ICICI Prudential Blended Plan B - Institutional Growth Option II – 10.16
Nil (9,659,482) units of Rs. 10 each fully paid
DWS Money plus Fund - Institutional Plan Growth – 10.16
Nil (9,865,755) units of Rs. 10 each fully paid
HDFC Floating Rate Income Fund - Short Term Plan - Wholesale option - Growth – 9.50
Nil (5,678,049) units of Rs. 10 each fully paid

M A R I C O L I M I T E D
67
JP Morgan India Short term Income Fund - Growth – 8.12
Nil (7,612,090) Units of Rs. 10 each fully paid
Tata Liquidity Management Fund - Growth 10.05 –
69,662 (Nil) Units of Rs. 1,000 each fully paid
Tata Liquid Super High Investment Fund-Appreciation 7.25 –
36,647 (Nil) Units of Rs. 1,000 each fully paid
ICICI Prudential Money Market Fund-Cash Option 20.27 –
1,367,539 (Nil) Units of Rs. 100 each fully paid
IDFC Ultra Short Term Fund - Growth 15.00 –
10,129,181 (Nil) Units of Rs. 10 each fully paid
Kotak Liquid-Institutional Premium - Growth 1.50 –
689,915 (Nil) Units of Rs. 10 each fully paid
DWS Treasury Fund - Cash - IP - Growth 20.73 –
1,732,972 (Nil) Units of Rs. 100 each fully paid
Reliance Liquid Fund-Treasury Plan-IP - Growth 20.77 –
7,957,279 (Nil) Units of Rs. 10 each fully paid
Birla Sun Life Floating Rate Fund-STP-IP - Growth 5.22 –
366,604 (Nil) Units of Rs. 100 each fully paid
Birla Sunlife Short Term FMP Series 29-Payout 15.00 –
15,000,000 (Nil) Units of Rs. 10 each fully paid
DSPBR FMP -Series 33-3M-Dividend Payout 15.00 –
15,000,000 (Nil) Units of Rs. 10 each fully paid
JM Floater Fund-Short Term Plan - Growth 10.02 –
5,914,217 (Nil) Units of Rs. 10 each fully paid
L & T FMP-V-(December 368D A) - Growth 8.00 –
8,000,000 (Nil) Units of Rs. 10 each fully paid
L & T Ultra Short Term Fund- Institutional-Cum-Org 4.01 –
2,314,830 (Nil) Units of Rs. 10 each fully paid
SBI Magnum Income Fund FR Saving Plus Bond - Growth 15.04 –
9,039,227 (Nil) Units of Rs. 10 each fully paid
Other Investments
Quoted
91 days Certifi cate of deposit of Punjab National Bank of face value of
Rs. 100 Crore expiring on June 26, 2012 with coupon rate of 11.345% 97.40 –
Total 266.26 78.71
Aggregate amount of quoted investments 97.40 0.77
Market Value of quoted investments 97.44 1.82
Aggregate amount of unquoted investments 168.86 77.94
notes to consolidated financial statements for the year ended march 31, 2012
As at March 31,
2012 2011Rs. Crore Rs. Crore

M A R I C O L I M I T E D
68
20 Inventories
(Refer note 3 (j), for basis of valuation)
As at March 31,2012 2011
Rs. Crore Rs. Crore
Raw materials (includes in-transit: Rs. 12.72 Crore (Rs. 9.63 Crore)) 290.55 220.64
Work-in-progress 113.24 93.05
Finished goods (includes in-transit: Rs. 0.75 Crore (Rs. 0.11 Crore)) 220.06 200.50
Stock-in-trade (Traded goods) 12.85 3.64
Stores and spares 8.62 8.24
Others:
Packing materials 71.17 73.16
By-products 3.73 1.91
Total 720.22 601.14
21 Trade receivables
As at March 31,2012 2011
Rs. Crore Rs. Crore
Unsecured
Outstanding for a period exceeding six months from the date they are due for
payment Considered good 1.34 0.84
Considered doubtful 2.97 3.44
4.31 4.28
Less: Provision for doubtful debts (2.97) (3.44)
1.34 0.84
Outstanding for a period less than six months from the date they are due for payment
Considered good 180.23 177.07
Considered doubtful 0.49 0.55
180.72 177.62
Less: Provision for doubtful debts (0.49) (0.55)
180.23 177.07
Total 181.57 177.07
notes to consolidated financial statements for the year ended march 31, 2012

M A R I C O L I M I T E D
69
22 Cash and bank balances
As at March 31,2012 2011
Rs. Crore Rs. CroreCash and cash equivalents:
Cash on hand 3.34 2.41
Remittance in-transit 0.12 5.12
Cheques, drafts on hand 26.71 11.37
Bank balances :
In current accounts 44.93 54.17
Demand deposits (less than 3 months maturity) 12.35 61.23
87.45 134.30
Other bank balances:
Fixed deposits with maturity more than three month but less than twelve months 71.20 86.01
Unclaimed dividend account 0.16 0.23
Preference share redemption account – 0.03
Total 158.81 220.57
23 Short-term loans and advances
As at March 31,2012 2011
Rs. Crore Rs. Crore
Unsecured, considered good (unless otherwise stated)
Loans and advances to related parties (Refer note 42) 0.65 –
0.65 –
Others:
Advances to vendors and others 26.73 38.01
Loans and advances to employees 6.25 7.39
Prepaid expenses 12.47 13.86
Balances with statutory/government authorities 12.73 16.58
Deposits with public bodies and others 6.28 3.33
Inter-corporate deposits 10.00 –
74.46 79.17
Total 75.11 79.17
24. Other current assets
As at March 31,2012 2011
Rs. Crore Rs. Crore
Unsecured, considered good (unless otherwise stated)
Interest accrued and due on loans / deposits 4.19 2.87
Insurance receivables 2.63 0.19
Accrued export incentives 1.54 –
Assets held for disposal 0.01 0.18
Forward/ derivative contracts receivables 7.53 –
Others 2.29 1.89
Total 18.19 5.13
notes to consolidated financial statements for the year ended march 31, 2012

M A R I C O L I M I T E D
70
25 Revenue from operations
For the year ended March 31,2012 2011
Rs. Crore Rs. CroreSale of products:
Finished goods* 3,717.90 2,939.95
By-product sales 63.36 54.83
3,781.26 2,994.78
Less:
Excise duty 1.36 0.98
3,779.90 2,993.80
Sale of servises 216.91 132.15
Other operating revenues:
Export incentives 9.08 6.54
Sale of scraps 2.39 2.50
11.47 9.04
Total 4,008.28 3,134.99
* Including traded goods
26 Other income
For the year ended March 31,2012 2011
Rs. Crore Rs. Crore
Interest income :
On Non current investments 0.85 0.69
On loans, deposits, etc. 16.70 15.52
17.55 16.21
Dividend income :
On current investments 12.15 2.45
12.15 2.45
Net gain on sale of current investments 1.20 0.40
Other non-operating income :
Lease rental income 0.42 0.39
Profi t on sale of assets (net) 0.15 0.01
Miscellaneous income 0.60 1.76
Excess provisions no longer required 0.50 –
1.67 2.16
Total 32.57 21.22
notes to consolidated financial statements for the year ended march 31, 2012

M A R I C O L I M I T E D
71
27 Cost of Materials Consumed, Purchase of stock-in-trade, Changes in inventories of finished goods, work-in
progress and stock-in-trade - (Increase) / decrease
For the year ended March 31,
2012 2011
Rs. Crore Rs. Crore
A Cost of materials consumed
Raw materials consumed
Opening inventories 220.64 188.19
Add : Purchases (net) 1,873.90 1,474.57
Less : Inventories at the end of the year 290.55 220.64
Cost of raw material consumed during the year 1,803.99 1,442.12
Packing materials consumed
Opening inventories 73.16 54.45
Add : Purchases (net) 326.06 289.25
Less : Inventories at the end of the year 71.17 73.16
Cost of packing material consumed during the year 328.05 270.54
2,132.04 1,712.66
B Purchases of stock-in-trade 17.44 20.36
C Changes in inventories of finished goods, work-in-progress andstock-in-trade - (Increase) / decrease
Opening inventories
Work-in-progress 93.05 62.41
Finished goods 200.50 118.40
By-products 1.91 1.15
Stock-in-trade 3.64 1.71
Total A 299.10 183.67
Less: Closing inventories
Work-in-progress 113.24 93.05
Finished goods 220.06 200.50
By-products 3.73 1.91
Stock-in-trade 12.85 3.64
Total B 349.88 299.10
(Increase) / decrease in inventories (A-B) (50.78) (115.43)
28 Employee benefit expenses
For the year ended March 31,2012 2011
Rs. Crore Rs. CroreSalaries, wages and bonus 271.30 202.12 Contribution to provident and other funds 11.15 10.72
Employees stock option charge / (reversal) (Refer note 4(d)) (0.04) 0.04 Stock appreciation rights expenses (Refer note 8(a)) 5.94 0.02 Staff welfare expenses 18.94 14.03 Long term service benefi ts – 3.05
Total 307.29 229.98
notes to consolidated financial statements for the year ended march 31, 2012

M A R I C O L I M I T E D
72
29 Finance costs
For the year ended March 31,2012 2011
Rs. Crore Rs. CroreInterest on:
Long-term borrowings 7.57 4.80
Short-term borrowings 18.54 17.66
Other borrowing costs 0.42 9.40
Bank and other fi nancial charges 9.59 7.89
Applicable net loss on foreign currency transactions and translation 6.27 1.26
Total 42.39 41.01
30 Depreciation, amortisation and impairment
For the year ended March 31,2012 2011
Rs. Crore Rs. CroreDepreciation on tangible assets 58.47 57.07 Amortisation on intangible assets 13.06 13.71 Amortisation on investment property 0.14 – Provision for impairment 0.85 0.02 Total 72.52 70.80
31 Other Expenses
For the year ended March 31,2012 2011
Rs. Crore Rs. CroreConsumption of stores and spare parts 70.99 49.30 Power, fuel and water 13.54 14.19 Contract manufacturing charges 134.43 104.33 Rent and storage charges 66.87 59.92 Repairs to: Building 10.61 9.21 Machinery 11.71 10.84 Others 4.58 3.62 Freight, forwarding and distribution expenses 166.39 132.42 Advertisement and sales promotion 448.99 345.95 Rates and taxes 35.66 13.96 Commission to selling agents 8.46 5.82 Bad debts 0.51 0.11 Communication expenses 11.09 9.34 Printing and stationery 3.22 2.98 Travelling, conveyance and vehicle expenses 38.18 31.34 Royalty 0.24 0.29 Insurance 3.08 2.55 Payments to the auditor as : Statutory audit fees 2.68 1.56 Tax audit fees 0.15 0.12 for other services 0.44 1.09
for reimbursement of expenses 0.01 0.01
Net loss on foreign currency transactions and translation (other than considered
as fi nance cost)
1.17 0.50
Commission to Non-executive directors 0.42 0.40
Miscellaneous expenses (Refer note below) 84.47 69.46
Total 1,117.89 869.31
notes to consolidated financial statements for the year ended march 31, 2012

M A R I C O L I M I T E D
73
Miscellaneous expenses includes :
For the year ended March 31,2012 2011
Rs. Crore Rs. Crore
Labour charges 7.87 5.43
Training and seminar expenses 6.76 6.25
Outside services 3.28 2.90
Legal and professional charges 34.47 24.52
Donation 0.09 0.08
Payments to consultants 13.90 14.31
Capital advance written off – 3.92
Provision for impairment on assets no longer required written back – (3.95)
Provision for doubtful debts/ advances no longer required written back (0.52) (0.55)
Total 65.85 52.91
notes to consolidated financial statements for the year ended march 31, 2012
32 Contingent liabilities:
As at March 31
2012 2011
Rs. Crore Rs. Crore
Disputed tax demands / claims:
Sales tax 13.69 17.61 Income tax 10.33 – Service tax 0.37 0.37 Customs duty 0.40 0.40 Agricultural produce marketing cess 8.84 8.14 Employees state insurance corporation 0.13 0.13 Excise duty on subcontractors 0.35 0.29
Excise duty on CNO dispatches (Refer note 44) 278.92 210.74
Lease termination cost – 0.11
Claims against the Company not acknowledged as debts 1.39 1.38
Possible indemnifi cation obligations under the Deed of Assignment for assignment of “Sweekar” brand
– 4.00
Total 314.42 243.17
33 Capital and other commitments
Capital commitments:
As at March 312012 2011
Rs. Crore Rs. Crore
Estimated amount of contracts remaining to be executed on capital account and
not provided for (net of advances)
72.04 62.87
Consideration for Paras acquisition (Refer note 36) 740.00 –
Contingent consideration for acquisition of skin care business of Derma Rx. (Refer
note 8(f))
12.25 10.60
Total 824.29 73.47

M A R I C O L I M I T E D
74
Other commitments:
As at March 312012 2011
Rs. Crore Rs. Crore
Corporate guarantees given to banks on behalf of subsidiaries for credit and other
facilities granted by banks. (Credit and other facilities availed by the subsidiaries as
at the year end - Rs.69.45 Crore (Rs. 59.04 Crore)).
88.90 137.44
Stand-by Letter of Credit issued by the Company’s banks on behalf of subsidiaries
for credit and other facilities granted by banks. (Credit and other facilities availed by
the subsidiaries as at the year end - Rs.132.23 Crore (Rs. 96.65 Crore)).
169.42 108.47
Guarantees given by banks on behalf of the Company to statutory authorities 17.34 12.52
Lease termination cost - representing lock-in-period rental under rental agreements. 22.57 27.46
Amount outstanding towards Letters of Credit. 14.13 29.20
Total 312.36 315.09
34 The audited consolidated fi nancial statements for the year ended March 31, 2012 comprised the audited fi nancial statements of Marico Limited, Kaya Limited, Marico Bangladesh Limited, MBL Industries Limited, Marico Middle East FZE, Kaya Middle East FZE, Marico South Africa Consumer Care (Pty) Limited, Marico South Africa (Pty) Limited, Marico Malaysia Sdn. Bhd., Derma Rx International Aesthetics Pte. Ltd, The DRx Clinic Pte. Ltd, The DRx Medispa Pte. Ltd, DRx Investments Pte. Ltd and DRx Aesthetics Sdn. Bhd. and unaudited fi nancial statements of MEL Consumer Care SAE, Egyptian American Investment & Industrial Development Company, Marico Egypt Industries Company, Wind Company, International Consumer Products Corporation, Beauté Cosmétique Societé Par Actions and Thuan Phat Foodstuff Joint Stock Company which have been approved by the respective Board of Directors of these companies.
35. Research and Development expenses aggregating Rs. 6.78 Crore (Rs. 7.81 Crore) have been included under the relevant heads in the Statement of Profi t and Loss.
36. During the year, the Company signed defi nitive agreements to acquire the personal care business of Paras Pharmaceuticals Limited (PPL), a 100% subsidiary of Reckitt Benckiser Investments India Private Limited for a consideration of Rs. 740.00 Crore. The acquisition transaction is expected to be concluded in May 2012. The Company intends to fund the requirements with a mix of proceeds from an issuance of equity shares and internal accruals. The shareholders, at their meeting held on May 2, 2012 have approved issue of equity shares on preferential allotment basis aggregating Rs. 500.00 Crore at a price of Rs. 170 per equity share (face value Re. 1 and share premium Rs. 169) to two overseas investors.
In terms of the agreement, the Company had deposited Rs. 25.00 Crore in an Escrow deposit account maintained with a bank which is appointed by the parties for operating the account. The balance in Escrow account would be released to the seller in the event the said transaction could not be completed due to reasons attributable to the Company. The said balance is refl ected as ‘non - current assets’ in the balance sheet having regards to the capital nature of the transaction.
37. Additional information on assets taken on lease:
The Company’s signifi cant leasing arrangements are in respect of residential fl ats, offi ce premises, Skin clinics, warehouses, vehicles etc taken on lease. The arrangements range between 11 months to 9 years and are generally renewable by mutual
consent or mutually agreeable terms. Under these arrangements refundable interest-free deposits have been given.
Particulars March 31, 2012
Rs. Crore
March 31, 2011
Rs. Crore
In respect of assets taken on non-cancellable operating lease:
Lease obligations
Future minimum lease rental payments payable
- not later than one year 42.59 29.17
- later than one year but not later than fi ve years 74.38 79.80
- later than fi ve years 2.05 1.70
Total 119.02 110.67
notes to consolidated financial statements for the year ended march 31, 2012

M A R I C O L I M I T E D
75
38. a) Details of Exceptional Items disclosed in the Statement of Profi t and Loss are as under:
Particulars March 31, 2012
Rs. Crore
March 31, 2011
Rs. Crore
Profi t on divestment of “Sweekar” brand – 50.00
Reversal of provision of excise duty (Refer Note 44 below) – 29.35
Provision for impairment of goodwill of Rs. 8.82 Crore and intangible assets relating to “Fiancée” trademark of Rs. 13.88 Crore.
– (22.70)
Provision for impairment relating to Kaya Skin clinics in India / Middle East
(Refer note (b) below)
(1.75) ( 7.74)
Total – (expenses) / income (1.75) 48.91
(b) The management has, as in the previous year, carried out impairment testing in respect of Skin business at the clinic level,
which the management considers as the relevant cash generating unit. While the overall future potential of the business as
a whole is promising, for some of the clinics likely future performance is not adequate to justify and cover the value in use.
This resulted in an impairment provision of Rs. 1.75 Crore (Rs. 7.74 Crore) which is included in “Exceptional Items” in the
Statement of Profi t and Loss. The management has considered a pre-tax discount rate of 19% for Kaya Skin clinics in India
and 12% for Kaya Skin clinics in Middle East for determining value in use during the year.
39. Derivative transactions
a) The total derivative instruments outstanding as on year end March 31, 2012 are Plain Forwards, Plain Vanilla Put Option,
Cross currency swap and Interest rate swap:
March 31, 2012 March 31, 2011
Notional Amount
in Foreign Currency
Equivalent Amount at the
year end *(Rs. Crore)
Notional Amount
in Foreign currency
Equivalent Amount at the
year end *(Rs. Crore)
Forward contracts outstanding **
Exports:
- in USD 8,238,974 41.92 6,000,000 26.75
Foreign currency loans:
- in USD 34,861,622 177.36 12,308,344 54.88
Creditors:
- in USD 10,586,215 53.86 5,000,000 22.29
- in AUD – – 297,898 1.37
Loan to subsidiary:
- in ZAR 22,000,000 14.59 19,000,000 12.51
Options Contracts outstanding
Exports:
- in USD 8,100,000 41.21 – –
Currency Swap
- in USD 10,000,000 50.88
* Converted into the exchange rate at the year end.
** Out of the forward contracts outstanding as on March 31, 2012, USD 18,825,189 (USD 11,000,000), AUD Nil (AUD
297,898), having fair value of Rs. 97.37 Crore (Rs. 52.01 Crore) and all outstanding option contracts as on March 31,
2012, USD 8,100,000 (Nil) having fair value of Rs. 0.89 Crore (Rs. Nil ) have been designated as Cash Flow hedges.
notes to consolidated financial statements for the year ended march 31, 2012

M A R I C O L I M I T E D
76
- The Company has entered into interest rate swap for hedging its interest rate exposure on borrowings in foreign
currency of USD 30,750,000 (USD 8,750,000), which has a fair value of Rs. 1.55 Crore (Rs. 0.34 Crore).
- The Cash fl ows are expected to occur and impact the Statement of Profi t and Loss within the period of 1 year
except interest rate swap, in respect of which Cash fl ows are expected to occur and impact the Statement of
Profi t and Loss within the period of 1 to 5 years (1 to 2 years).
- All the derivative contracts entered by the Company were for hedging purpose and not for any speculative purpose.
b) Net foreign currency exposures not hedged as at the year end are as under:
March 31, 2012 March 31, 2011
Currency Amount
in Foreign
Currency
Equivalent
amount at
the year end
(Rs. Crore)
Amount
in Foreign
Currency
Equivalent
amount at
the year end
(Rs. Crore)
a. Amount receivable in foreign
currency on account of following:
- Export of goods AED 4,988 0.01 4,988 0.01
USD 196,514 1.00 – –
b. Amount (payable) /receivable in
foreign currency on account of
following :
(i) Import of goods AED – – 65,000 0.08
and Services AUD 12,342 0.06 – –
EUR 30,611 0.21 27,380 0.17
GBP (74,111) (0.6) – –
THB 635,418 0.10 – –
USD (6,797,096) (34.58) 187,448 0.84
SGD (537,419) (2.19) 121 0.01
(ii) Capital imports CHF 680 0.01 680 0.01
GBP 800 0.01 800 0.01
(iii) Loan payables * USD (22,480,947) (114.37) (12,308,344) (54.88)
c. Bank Balances USD (858,245) (4.37) 518,470 2.31
OMR – – 115,147 1.33
SAR – – 109,632 0.13
EUR 593 0.01 – –
GBP 129 0.01 – –
VND 1,183,114 0.01 2,089,000 0.01
d. Other receivables / (payables) USD 2,298,018 11.69 8,288 0.04
AED 553 0.01 (4,447) (0.01)
AUD 2,400 0.01 – –
OMR – – 4,694 0.05
SAR – – 302,470 0.34
EUR 724,556 4.92 600 0.01
* Excludes Loans payable of Rs. 293.81 Crore [USD 57,750,000] (Rs. 279.77 Crore [USD 62,750,000]) assigned
to hedging relationship against highly probable forecast sales. The Cash fl ows are expected to occur and impact
the Statement of Profi t and Loss within the period of 1 to 5 years (1 to 6 years).
notes to consolidated financial statements for the year ended march 31, 2012
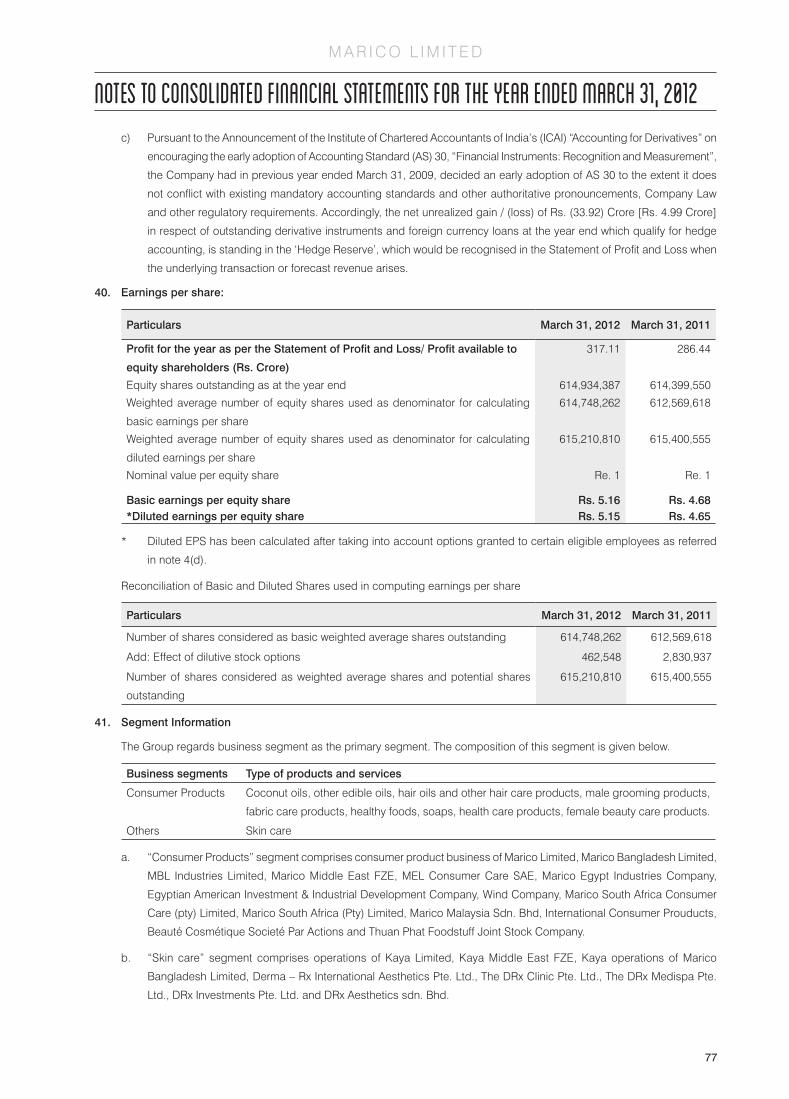
M A R I C O L I M I T E D
77
c) Pursuant to the Announcement of the Institute of Chartered Accountants of India’s (ICAI) “Accounting for Derivatives” on
encouraging the early adoption of Accounting Standard (AS) 30, “Financial Instruments: Recognition and Measurement”,
the Company had in previous year ended March 31, 2009, decided an early adoption of AS 30 to the extent it does
not confl ict with existing mandatory accounting standards and other authoritative pronouncements, Company Law
and other regulatory requirements. Accordingly, the net unrealized gain / (loss) of Rs. (33.92) Crore [Rs. 4.99 Crore]
in respect of outstanding derivative instruments and foreign currency loans at the year end which qualify for hedge
accounting, is standing in the ‘Hedge Reserve’, which would be recognised in the Statement of Profi t and Loss when
the underlying transaction or forecast revenue arises.
40. Earnings per share:
Particulars March 31, 2012 March 31, 2011
Profit for the year as per the Statement of Profit and Loss/ Profit available to
equity shareholders (Rs. Crore)
317.11 286.44
Equity shares outstanding as at the year end 614,934,387 614,399,550
Weighted average number of equity shares used as denominator for calculating
basic earnings per share
614,748,262 612,569,618
Weighted average number of equity shares used as denominator for calculating
diluted earnings per share
615,210,810 615,400,555
Nominal value per equity share Re. 1 Re. 1
Basic earnings per equity share Rs. 5.16 Rs. 4.68*Diluted earnings per equity share Rs. 5.15 Rs. 4.65
* Diluted EPS has been calculated after taking into account options granted to certain eligible employees as referred
in note 4(d).
Reconciliation of Basic and Diluted Shares used in computing earnings per share
Particulars March 31, 2012 March 31, 2011
Number of shares considered as basic weighted average shares outstanding 614,748,262 612,569,618
Add: Effect of dilutive stock options 462,548 2,830,937
Number of shares considered as weighted average shares and potential shares
outstanding
615,210,810 615,400,555
41. Segment Information
The Group regards business segment as the primary segment. The composition of this segment is given below.
Business segments Type of products and services
Consumer Products Coconut oils, other edible oils, hair oils and other hair care products, male grooming products,
fabric care products, healthy foods, soaps, health care products, female beauty care products.
Others Skin care
a. “Consumer Products” segment comprises consumer product business of Marico Limited, Marico Bangladesh Limited,
MBL Industries Limited, Marico Middle East FZE, MEL Consumer Care SAE, Marico Egypt Industries Company,
Egyptian American Investment & Industrial Development Company, Wind Company, Marico South Africa Consumer
Care (pty) Limited, Marico South Africa (Pty) Limited, Marico Malaysia Sdn. Bhd, International Consumer Prouducts,
Beauté Cosmétique Societé Par Actions and Thuan Phat Foodstuff Joint Stock Company.
b. “Skin care” segment comprises operations of Kaya Limited, Kaya Middle East FZE, Kaya operations of Marico
Bangladesh Limited, Derma – Rx International Aesthetics Pte. Ltd., The DRx Clinic Pte. Ltd., The DRx Medispa Pte.
Ltd., DRx Investments Pte. Ltd. and DRx Aesthetics sdn. Bhd.
notes to consolidated financial statements for the year ended march 31, 2012

M A R I C O L I M I T E D
78
i) Primary segment information
(Rs. Crore)
Consumer Products Skin Care Total
Segment revenue 3,730.01(2,927.06)
278.27(207.93)
4,008.28(3,134.99)
Segment resultsProfi t/(loss)
443.82(382.38)
(29.07)(–)(32.49)
414.75(349.89)
Unallocable expenses ––
Unallocable income 12.15(2.43)
Finance costs 42.39(41.01)
Interest income 17.55(16.21)
Profi t before tax, ‘Exceptional items’ and Minority interest
402.06(327.52)
Exceptional items(Income)/expense (net)
–(56.65)
1.75(–)(7.74)
1.75(48.91)
Profi t before tax and Minority interest 400.31(376.43)
Taxation on the above 78.25(84.98)
Profi t after tax and before Minority interest 322.06(291.45)
Minority interest in losses / (profi ts) of subsidiaries 4.95(5.01)
Profit after taxation and Minority interest 317.11(286.44)
Other information
Segment assets 1,751.89(1,518.85)
354.28(348.18)
2,106.17(1,867.03)
Unallocable assets 510.85(366.10)
Total assets 2,617.02(2,233.13)
Segment liabilities 496.06(367.02)
161.25(120.23)
657.31(487.25)
Unallocable liabilities 816.7(830.04)
Total liabilities 1,474.01(1,317.65)
Capital expenditure 48.69(154.46)
43.22(62.81)
91.91*(217.27)
Depreciation, impairment and amortisation 51.13(43.65)
21.39(27.15)
72.52**(70.80)
* excludes assets acquired on acquisition of new subsidiaries
** excludes provision for impairment of Rs. 1.75 Crore (Rs. 21.62 Crore) refl ected in Exceptional items
notes to consolidated financial statements for the year ended march 31, 2012

M A R I C O L I M I T E D
79
ii) Secondary Segment Information
The Group has identifi ed geographical markets as the Secondary segment.
Geographical Segments Composition
Domestic All over India
International (others) Primarily Middle East, SAARC countries, Egypt, Malaysia, South Africa, Singapore
and Vietnam.
(Rs. Crore)
Domestic Others Total
Revenue 2,899.76 1,108.52 4,008.28
(2,294.23) (840.76) (3,134.99)
Carrying amount of assets 1,590.35 1,026.67 2,617.02
(1,261.92) (971.21) (2,233.13)
Capital expenditure 53.49 38.42 91.91
(140.96) (76.31) *(217.27)
* excludes assets acquired on acquisition of new subsidiaries
iii) Notes to Segmental information
a) Segment revenue and expense: Revenues and expenses directly attributable to segments are reported under
each reportable segment. Revenue and expenses which relate to Group as whole and are not allocable to
a segment on reasonable basis, have been disclosed under ‘Unallocable’.
b) Segment Assets and Liabilities: Segment assets include all operating assets used by a segment comprising
intangibles, fi xed assets, inventories, debtors, cash and bank balances and loans and advances. Segment
liabilities include all operating liabilities of the segment comprising creditors and other liabilities. Investments,
taxes and other assets and liabilities which are not allocable to segment on reasonable basis, have been
disclosed under ‘Unallocable’.
42. Related Party disclosures
a) Name of related parties and nature of relationship:
i) Key management personnel (KMP) :
Harsh Mariwala, Chairman and Managing Director
ii) Relatives of Key management personnel:
Rishabh Mariwala, son of Harsh Mariwala
iii) Others - Entities in which KMP has signifi cant infl uence
The Bombay Oil Private Limited
Marico Innovation Foundation Trust
b) Transactions during the year
(Rs. Crore)
Particulars KMP Others
March 31, 2012 March 31, 2011 March 31, 2012 March 31, 2011
Remuneration 4.03 3.70 – –
Loans and advances given – – 0.65 –
Rent paid – – – 0.15
notes to consolidated financial statements for the year ended march 31, 2012

M A R I C O L I M I T E D
80
c) Balances as at year end
(Rs. Crore)
Particulars KMP Others
March 31, 2012 March 31, 2011 March 31, 2012 March 31, 2011
Trade Payable – – – 0.01
Short term loans and advances – – 0.65 –
d) Disclosure in respect of transactions which are more than 10% of the total transactions of the same type with related
parties.
(Rs. Crore)
Particulars KMP Others
March 31, 2012 March 31, 2011 March 31, 2012 March 31, 2011
Rent paid –
The Bombay Oil Private Limited – 0.15 – –
Remuneration 0.15
Harsh Mariwala 4.01 3.58 – –
Loans and advances given
Marico Innovation Foundation Trust 0.65 – 0.65 –
e) Clause 32 disclosures
Loans and advances in the nature of loans to subsidiaries / entity in which KMP has signifi cant infl uence
Particulars March 31, 2012
Rs. Crore
March 31, 2011
Rs. Crore
Loans to Marico Innovation Foundation Trust
Balance as at the year end 0.65 –
Maximum amount outstanding at any time during the year 0.65 –
43. Managerial remuneration:
Nature of transactions: March 31, 2012
Rs. Crore
March 31, 2011
Rs. Crore
Payments and provisions on account of remuneration to Chairman and Managing
Director included in the Statement of Profi t and Loss
- Salary 2.60 2.26
- Contribution to provident and pension funds 0.30 0.26
- Other perquisites 0.07 0.09
Annual performance incentives 1.04 0.97
4.01 3.58
Remuneration to non-whole time directors (including Sitting fees) 0.47 0.46
The above remuneration to Chairman and Managing Director does not include contribution to gratuity fund and provision
for Leave encashment, as these are lump sum amounts for all relevant employees based on actuarial valuation.
44. During the year ended March 31, 2010, the Company had made provisions towards 75% of possible excise duty obligations
in respect of the coconut oil packs up to 200 ml, which is being contested by the Company. Based on facts of the case and
the legal opinion obtained, the Company had made an assessment that the probability of success in the matter is more
likely than not and the liability was in the nature of contingent liability. As the said provisioning of contingent liability was
not in accordance with the requirement of Accounting Standard (AS) 29 “Provisions, Contingent Liability and Contingent
Assets”, the Company reviewed the matter and reversed the provision of Rs. 29.35 Crore made upto March 31, 2010 during
notes to consolidated financial statements for the year ended march 31, 2012

M A R I C O L I M I T E D
81
the year ended March 31, 2011 (Refer Note 38 above) and the same was included under the “Exceptional items” in the
Statement of Profi t and Loss. Further, deferred tax asset of Rs. 9.75 Crore recognised during the year ended March 31,
2010 was reversed and included in Deferred tax charge for the year in the Statement of Profi t and Loss for the said year.
The possible excise duty obligation of Rs. 157.15 Crore (Rs. 88.97 Crore) for clearances made after June 3, 2009 (i.e. the
date of issue of relevant excise circular) till March 31, 2012 and Rs. 121.77 Crore (Rs. 121.77 Crore) for clearances made
prior to June 3, 2009 has been disclosed as contingent liability to the extent of the time horizon covered by show cause
notice issued by the excise department with in the normal period of one year (from the date of clearance) under the excise
laws.
The Company will continue to review this matter during the coming accounting periods based on the developments on the
outcomes in the pending cases and the legal advice that it may receive from time to time.
45. During the year, the management carried out a review of Kaya Middle East FZE, which revealed certain misstatement
of expenses pertaining to earlier years. The management has taken appropriate action on this. Consequently, prior year
expenses aggregating Rs. 12.98 Crore have been accounted during the year ended March 31, 2012, which are included
in the respective expense heads such as cost of material, advertising and sales promotion, employee costs and other
expenses. The management has also initiated necessary steps to strengthen the processes of monitoring and oversight of
operations.
46. Previous Year Figures
a) The consolidated fi nancial statements for the year ended March 31, 2011 had been prepared as per the then applicable,
pre-revised Schedule VI to the Companies Act, 1956. Consequent to the notifi cation of Revised Schedule VI under
the Companies Act, 1956, the consolidated fi nancial statements for the year ended March 31, 2012 are prepared
as per Revised Schedule VI. Accordingly, the previous year fi gures have also been reclassifi ed to conform to this
year’s classifi cation. The adoption of Revised Schedule VI for previous year fi gures does not impact recognition and
measurement principles followed for preparation of consolidated fi nancial statements.
b) The fi gures in brackets represent those of the previous year.
Signatures to Notes
For Price Waterhouse For and on behalf of the Board of DirectorsChartered Accountants HARSH MARIWALA Chairman and Managing DirectorFirm Registration No. 301112E NIKHIL KHATTAU Director and Chairman of Audit Committee MILIND SARWATE Group Chief Financial Offi cerUDAY SHAH HEMANGI GHAG Company Secretary & Compliance Offi cerPartner Membership No. F-46061Place : Mumbai Place : MumbaiDate : May 3, 2012 Date : May 3, 2012
notes to consolidated financial statements for the year ended march 31, 2012

M A R I C O L I M I T E D
82
To the Members
Your Board of Directors (‘Board’) is pleased to present the Twenty Fourth Annual Report of your Company, Marico Limited, for
the year ended March 31, 2012 (‘the year under review’, ‘the year’ or ‘FY12’).
In line with the requirements of the Listing Agreement with the Bombay Stock Exchange and National Stock Exchange, your
Company has been reporting consolidated results – taking into account the results of its subsidiaries. This Discussion therefore
covers the fi nancial results and other developments during April 2011 – March 2012 in respect of Marico Consolidated comprising
Domestic Consumer Products Business under Marico Limited (Marico) in India, International Consumer Products Business
comprising exports from Marico and operations of its overseas subsidiaries and the Skin Solutions Business of Kaya in India
and overseas. The consolidated entity has been referred to as ‘Marico’ or ‘Group’ or ‘Your Group’ in this discussion.
FINANCIAL RESULTS - AN OVERVIEW
Rs. CroreYear ended March 31,
2012 2011
Consolidated Summary Financials for the Group
Revenue from Operations 4008.3 3135.0
Profi t before Tax 400.3 376.4
Profi t after Tax 317.1 286.4
Marico Limited – financials
Revenue from Operations 2970.3 2350.4
Profi t before Tax 399.3 374.6
Less: Provision for Tax for the current year 62.7 59.2
Profi t after Tax for the current year 336.6 315.3
Add : Surplus brought forward 602.5 382.6
Profit available for Appropriation 939.1 697.9
Appropriations:
Distribution to shareholders 43.0 40.5
Tax on dividend 7.0 6.7
50.0 47.2
Transfer to General Reserve 33.7 31.5
Debenture Redemption Reserve 20.0 16.7
Surplus carried forward 835.4 602.5
Total 939.1 697.9
DISTRIBUTION TO EQUITY SHAREHOLDERS
Your Company’s distribution policy has aimed at sharing your Company’s prosperity with its shareholders, through a formal
earmarking / disbursement of profi ts to shareholders.
Marico has identifi ed acquisitions as one of its avenues to pursue growth. In February 2012, your Company entered into an
agreement to acquire the Personal Care business of Paras Pharmaceuticals from Reckitt Benckiser, Singapore. This transaction
is expected to be completed by May 2012. Since April 2005, the Group has consummated 11 acquisitions including two each
in India, Bangladesh, Egypt and South Africa and one each in Malaysia, Singapore and Vietnam. As part of its growth agenda,
Marico would continue to explore new acquisition opportunities in the focus categories of skin care, hair care and functional food
in the emerging markets of Asia and Africa to supplement its organic growth. These would create a need for additional funds.
Your Company therefore intends to remain conservative in the quantum of dividend payout in the near future.
directors' report

M A R I C O L I M I T E D
83
directors' reportYour Company’s distribution to equity shareholders during FY 12 comprised the following:
First interim dividend of 30% on the equity base of Rs 61.49 Crore
Second interim dividend of 40% on the equity base of Rs. 61.49 Crore
The total equity dividend for FY12 at 70.0% is thus slightly higher compared to the dividend paid during FY11. The total dividend
(including dividend tax) was Rs. 50.0 Crore (about 15.8 % of the Group PAT).
MANAGEMENT DISCUSSION AND ANALYSIS
An Annexure to this Report contains a detailed Management Discussion and Analysis, which, inter alia, covers the following:
• Industry structure and development
• Opportunities and Threats
• Risks and Concerns
• Internal control systems and their adequacy
• Discussion on fi nancial and operational performance
• Segment-wise performance
• Outlook
In addition, a Review of Operations of your Company has been given in this report.
REVIEW OF OPERATIONS
Your Group continued to focus on expanding its consumer franchise. During FY12 Marico registered revenue from operations
of INR 4008 Crore, a growth of 28% over the previous year. This was contributed by 17% expansion in volumes (includes 6%
inorganic growth) accompanied by 11% through price increases and sales mix. The top line increase was accompanied by a
bottom-line growth of 11%. Profi t After Tax (PAT) including exceptional / extra-ordinary items during the year was at INR317 Crore
as against INR 286 Crore in FY11. The growth in profi ts does not mirror the growth in top line due to infl ationary pressures faced
by the Company during the year. The Company consciously decided to absorb a part of the increase in input costs in order to
maintain and grow its long term consumer franchise. Further, the fi nancial statements of FY12 and FY11 include certain exceptional
items. The growth in PAT after excluding the impact of such exceptional items is a healthy 25%.
During the year, Marico extended its record of year on year quarterly growth.
The company has demonstrated steady growth on both the top line and the bottom line. Over the last 5 years, they have grown
at a Compounded Annual Growth Rate of 21% and 23% respectively.
Consumer Products Business: India
The Consumer Products Business in India (CPB) achieved a turnover of INR 2766 Crore during FY12, a growth of about 37%
over FY11 (excluding turnover from Sweekar which was divested in March 2011 from the base. If sales of Sweekar were to be
included in the base the growth would be 26%). The turnover growth refl ected healthy demand and continued business momentum
manifest in a volume growth of about 14% over FY11.
Parachute, Marico’s fl agship brand, continued to expand its franchise during the year. Parachute coconut oil in rigid packs, the
focus part of its portfolio, grew by 11% in volume as compared to FY11. Small packs helped in driving this volume growth. Also,
owing to the infl ationary environment in the key input prices of coconut oil the competitive environment (specially the local/regional
players) during the last few quarters has been soft thereby resulting in Marico’s brands gaining market share. Its share during
the 12 months ended March ’12 was 55%.

M A R I C O L I M I T E D
84
Marico offers its consumers a basket of value added hair oils for their pre-wash and post wash hair conditioning, nourishment
and grooming needs (Key brands being Parachute Advansed hair oil, Parachute Advansed Cooling oil, Parachute Jasmine non
sticky hair oil, Parachute Advansed Ayurvedic Hair Oil, Nihar Naturals perfumed hair oil, Hair & Care nourishing non sticky hair
oil, and Nihar Shanti Badam Amla hair oil). During the year, Marico’s hair oil brands recorded healthy growth and the portfolio as
a whole grew by about 24% in volume terms over FY11.
Marico’s premium refi ned edible oils brand Saffola grew by about 11% in volume terms compared to FY11. The brand’s strong
heart health equity is now being leveraged through functional food extensions in breakfast cereal and low glycemic index rice.
Marico has been constantly investing in a healthy pipeline of new products. During the year your Company launched savory oats
under Saffola and Body Lotion under Parachute Advansed.
International FMCG Business
From a single digit share in FY05, about 24% of the group’s turnover is now contributed by Marico’s International FMCG business.
Its key geographical presence is in Bangladesh, MENA (Middle East and North Africa), South Africa and South East Asia.
During FY12, the company’s international business recorded a turnover growth of 30% over FY11. During the year, your Company
also successfully integrated the 85% acquisition of International Consumer Products (ICP) in Vietnam.
Marico has entered new geographies as well as scaled up presence in Nepal/Bhutan, Malaysia and Myanmar. During the year,
your Company has used the connect & develop model of faster innovation to launch an exciting new range of water gels, Ice
gels & Rave Gels, Wax and Clay under Code 10 within six months of opportunity identifi cation. We have also started using ICP
as a sourcing base for the Malaysian market.
Myanmar tripled its base in FY12 with both the Nourishment (Parachute Advansed) and Male grooming (Code 10) business
showing good traction. In the process we have gained signifi cant market share. The Group expects to scale up this business
signifi cantly in the coming year(s).
Kaya
Kaya offers its technology led cosmetic dermatological services through 107 clinics: 82 in India across 26 cities and 19 in the
Middle East, 2 in Dhaka and 4 clinics through Derma Rx in Singapore and Malaysia.
During FY12, Kaya’s skin solutions business achieved a turnover of INR 279 Crore, recording a revenue growth of ~33% over FY11.
On an overall basis Kaya made a loss of INR 29.1 Crore at PBIT level. During the year Kaya initiated a change in its positioning
from ‘cure’ to ‘cure + care’. The new services introduced to take care of regular skin care needs received good traction. The focus
on increasing revenue from products, led by introducing products from the Derma Rx range into the clinics in India has resulted
in the contribution from the sales of products increasing from 13% to about 23%. These initiatives also helped Kaya business in
India and Middle East to achieve the same clinic growth of 15%. Sustaining same store growth would reinforce Marico’s belief in
the Kaya Business model, especially as we perceive a signifi cant long term opportunity in skin care solutions.
OTHER CORPORATE DEVELOPMENTS
Acquisition of Personal Care brands of Paras Pharmaceuticals from Reckitt Benckiser
Marico has entered into an agreement to acquire the erstwhile personal care business of Paras Pharmaceuticals Limited from
Reckitt Benckiser, Singapore. Upon completion of this transaction, Marico shall own well known brands such as Set Wet,
Livon, Zatak. The transaction is expected to be completed in the month of May 2012. This acquisition is in line with the strategy
to strengthen our participation in categories of hair care, skin care and male grooming. The acquired business operates in
categories such as Hair creams/gels, Leave-on conditioner and Deodorants. While your Company already participates in hair
creams and gels and Leave-on conditioners, the acquisition provides an entry into the fast growing deodorant category. The
Company also expects to leverage synergies in buying (input materials and media) and distribution of the acquired portfolio
with Marico’s existing portfolio.
directors' report
M A R I C O L I M I T E D
85
Preferential Allotment of Equity Shares to part fund the acquisition of Personal care business of Paras Pharmaceuticals
Your Company, considering its medium term funds requirements, will be issuing additional equity shares amounting to INR 500
Crore preferential basis. The shareholders of the Company have accorded necessary approval for the preferential issue of equity
shares at their extra-ordinary general meeting held on May 2, 2012. The allotment will be made on a preferential basis to Indivest
Pte. Ltd. (an affi liate of Government of Singapore Investment Corporation Pte Ltd) and Baring India Private Equity Fund III Listed
Investments Limited in the ratio of 3:1. These funds shall be used to fund part of the purchase consideration for the proposed
acquisition of Paras personal care business by the Company. The issue is placed at a price of Rs. 170 per share. Your Company
was able to get a premium of about 2.5% over the SEBI fl oor price. The receipt of funds and allotment of shares is expected to
take place during May. 2012.
Marico Employee Stock Option Scheme 2007
In pursuance of shareholders’ approval obtained on November 24, 2006, your Company formulated and implemented an Employee
Stock Options Scheme (the Scheme) for grant of Employee Stock Options (ESOS) to certain employees of the Company and its
subsidiaries. The Corporate Governance Committee (‘Committee’) of the Board of Directors of your Company is entrusted with
the responsibility of administering the Scheme and in pursuance thereof, the Committee has granted 1,13,76,300 stock options
(as at March 31, 2012) comprising about 1.85% of the current paid up equity capital of the Company as at March 31, 2012. An
aggregate of 7,78,313 options were outstanding as on March 31, 2012. Additional information on ESOS as required by Securities
and Exchange Board of India (Employees Stock Option Scheme and Employees Stock Purchase Scheme) Guidelines, 1999 is
annexed and forms part of this report.
None of the Non-executive Directors (including Independent Directors) have received stock options in pursuance of the above
Scheme. Likewise, no employee has been granted stock options, during the year equal to or exceeding 0.5% of the issued capital
(excluding outstanding warrants and conversions) of the Company at the time of grant.
The Company’s Auditors, M/s. Price Waterhouse, have certifi ed that the Scheme has been implemented in accordance with the
SEBI Guidelines and the resolution passed by the members at the Extra-Ordinary General Meeting held on November 24, 2006.
Marico Employees Stock Appreciation Rights Plan, 2011
Your Company had implemented a long term incentive plan namely, Marico Stock Appreciation Rights Plan, 2011 (‘STAR Plan’) in
the previous fi nancial year for the welfare of its employees and those of its subsidiaries. Pursuant to the STAR Plan the Corporate
Governance Committee of the Board of Directors notifi es various Schemes granting Stock Appreciation Rights (SARs) to certain
eligible employees. Each SAR is represented by one equity share of the Company. The eligible employees are entitled to receive
excess of the maturity price over the grant price in respect of such SARs subject to fulfi llment of certain conditions and subject to
deduction of tax. During the fi nancial year under review the Corporate Governance Committee notifi ed Scheme II on December
1, 2011 under the STAR Plan granting additional SARs to certain eligible employees. The vesting date of the SARs granted under
Scheme II is November 30, 2014. As on March 31, 2012, an aggregate of 41,46,600 SARs were outstanding.
Exemption from attaching the Balance Sheets, etc. of the Subsidiary Companies with the Balance Sheet of the Company
The Ministry of Corporate Affairs (“MCA”) has vide its circular no. 02/2011 dated 8th February, 2011, granted a general exemption
under Section 212(8) of the Companies Act from attaching copies of the Balance Sheet, Profi t and Loss Accounts, Directors’
Report and Auditors’ Report of its subsidiary companies with the Balance Sheet of the Company, subject to fulfi llment of certain
conditions.
In terms of the said circular, copies of the Balance Sheet, Profi t and Loss Account, Report of the Board of Directors and the
Report of the Auditors of the Subsidiary Companies have not been attached to the Balance Sheet of the Company. The Company
has presented Consolidated Financial Statements comprising Marico Limited and its subsidiaries duly audited by the Statutory
Auditors of the Company. The Consolidated Financial Statements prepared by the Company are in compliance with the Accounting
Standard AS-21 as prescribed by the Companies (Accounting Standards) Rules, 2006 and the Listing Agreement with the Stock
Exchanges. The statement required under Section 212 of the Companies Act, 1956 is attached to the annual accounts of the
directors' report

M A R I C O L I M I T E D
86
Company. The Annual Accounts and related documents of all the Subsidiary Companies shall be made available for inspection
to the shareholders of the Company and its subsidiaries at the Registered Offi ce of the Company from Monday to Friday during
the hours between 11.00 a.m. and 1.00 p.m. The Company will also make available physical copies of such documents upon
request by any Member of the Company or its subsidiaries interested in obtaining the same and the same would also be made
available on the website of the Company.
PUBLIC DEPOSITS
There were no outstanding Public deposits at the end of this or the previous year. The Company did not accept any public
deposits during the year.
DIRECTORS’ RESPONSIBILITY STATEMENT
Pursuant to Section 217(2AA) of the Companies Act, 1956 (the Act) amended by the Companies (Amendment) Act, 2000, the
Directors confi rm that:
♦ In preparation of the Annual Accounts of your Company, the Accounting Standards, laid down by the Institute of Chartered
Accountants of India from time to time, have been followed and that no material departures have been made from the same;
♦ Appropriate accounting policies have been selected and applied consistently, and reasonable and prudent judgment and
estimates have been made so as to ensure that the accounts give a true and fair view of the state of affairs of your Company
as at March 31, 2012 and the profi ts of your Company for the year ended March 31, 2012;
♦ Proper and suffi cient care has been taken for maintenance of appropriate accounting records in accordance with the provisions
of the Act for safeguarding the assets of your Company and for preventing and detecting fraud and other irregularities;
♦ The annual accounts have been prepared on a going concern basis;
♦ The observation(s) and qualifi cation(s) of the Auditors in their report to the Members have been adequately dealt with in the
relevant notes to the accounts. Hence no additional explanation is considered necessary.
CORPORATE GOVERNANCE
A report on Corporate Governance has been provided as a separate part of this Report.
DIRECTORS
Directors retiring by rotation
Mr. Anand Kripalu and Mr. B. S. Nagesh, Directors of the Company, are liable to retire pursuant to the provisions of Section 256
and 262 of the Companies Act, 1956 respectively and being eligible offer themselves for re-appointment.
ADDITIONAL STATUTORY INFORMATION
Information under Section 217(1)(e) of the Act read with the Companies (Disclosure of Particulars in the Report of the Board of
Directors) Rules, 1988 is annexed and forms part of this Report. Information pursuant to Section 217(2A) of the Act read with the
Companies (Particulars of Employees) Rules, 1975, as amended by the Companies (Particulars of Employees) Amendment Rules,
1999 forms part of this Report. Although in accordance with the provisions of Section 219(1)(b)(iv) of the Act such information
has been excluded from the Report and Accounts sent to the Members, any member desirous of obtaining this information may
write to the Company Secretary at the Registered Offi ce of the Company.
STATUTORY AUDITORS
M/s. Price Waterhouse, Chartered Accountants and Statutory Auditors of the Company retire at the ensuing Annual General
Meeting and have confi rmed their eligibility for re-appointment.
directors' report

M A R I C O L I M I T E D
87
COST AUDITORS
Your Company appointed M/s. Ashwin Solanki & Associates, Cost Accountants, Mumbai, to conduct the cost audit of the
formulations for the Financial Year ended March 31, 2012. The Company has received necessary approval from Central Government
for appointment of the Cost Auditor. The Cost Audit Report for the year ended March 31, 2012, will be submitted to the Central
Government in due course.
INTERNAL AUDITORS
Aneja Associates, a Chartered Accountant Firm, has been associated with your Company as its internal auditor partnering your
Company in the area of risk management and internal control systems. This role has now been taken over by Ernst & Young, a
Chartered Accountants Firm, who have been appointed as the new internal auditor of the Company for the fi nancial year 2012-13
and onward. Your Company places on record its sincere appreciation for the services rendered by Aneja Associates as internal
auditors of the Company.
ACKNOWLEDGEMENT
The Board takes this opportunity to thank all its employees for their dedicated service and fi rm commitment to the goals of
the Company. The Board also wishes to place on record its sincere appreciation for the wholehearted support received from
shareholders, distributors, bankers and all other business associates, and from the neighbourhood communities of the various
Marico locations. We look forward to continued support of all these partners in progress.
On behalf of the Board of Directors
Place : Mumbai HARSH MARIWALA
Date : May 3, 2012 Chairman and Managing Director
directors' report

M A R I C O L I M I T E D
88
annexure to the directors' reportDisclosure of Particulars with respect to Conservation of Energy, Technology Absorption and Foreign Exchange earnings and
outgo as required under the Companies (Disclosure of Particulars in the Report of Board of Directors) Rules, 1988.
A. Conservation of Energy
Marico continued to emphasize on the conservation and optimal utilization of energy in every manufacturing unit of the
Company. The energy conservation measures implemented during FY12 are listed below:
Plant - Kanjikode
• Installation of online load monitoring system which improved expeller load-ability thereby reducing power & fuel
consumption by 21340 units & 2120 Litres.
• Steam usage optimization in second stage kettles by throttling valve with respect to feed temperature, thereby resulting
in FO saving of 1500 Litres.
• Six sigma project completed on SPC reduction thereby reducing the SPC from 86 to 84 units per MT of copra.
• Filling Compressor usage optimization study conducted thereby arriving at effective combination of compressor for
different matrix of line formation.
• Indicator system provided in second stage Expeller 118 to prevent idling thereby saving around 2500 units.
• Cylindrical capacitors installed on cutter motor thereby improving the motor Power factor from 0.64 to 0.89.
• Oil & foots conveyor interlocking done to prevent idling.
• Automation of RC02, resulting in a savings of 4900 units.
• RM section underground water seepage area corrected & seepage water used for Expeller shaft cooling.
Plant - Pondicherry
Pondicherry Power Task Force Energy Conservation Initiatives have resulted in a reduction of 668,000 Units/Year and
reduction of 145 tons of CO2 emission through initiatives like:
• Changing the I Stage Expeller motor to 185KW from 250KW.
• First stage Recycle conveyor elimination – 2.2 KW.
• Boiler Feed water Pump auto cut-off automation.
• Reducing the number of lights in Amenity Hall, replaced with 40w tube light.
Pondicherry Plant Water Savings: 390 KL of water saved in the year through initiatives like:
• Redesigning the Cooling water line to eliminate Water Overfl ow during Power Failure.
• Recycling of soxlet water in lab.
• Reducing the water consumption in garden by Drip Irrigation.
Pondicherry Plant reduced consumption of plastic bags by 414 Kg during the year by using SS Containers for sampling
instead of plastic bags.
Plant - Jalgaon
• Installed self start and stop timer for higher HP machines.
• Replacement of higher HP pump with lower HP pump basis energy audit data analysis.

M A R I C O L I M I T E D
89
o 10 HP blend transfer pump replaced with 3 HP Kirloskar pump.
o Cooling Tower Pump.
o Filling Day Tank Pump.
• Use of refi ned oil heat to heat boiler feed water to reduce energy consumption at boiler.
• Bleacher barometric pump stoppage.
• Restructuring of air compressors of refi nery and fi lling for proper air utilization.
• Fitting solar lamp in factory premises.
• Reducing pipeline dimension where it is oversize to reduce power required.
• Replacing old high watt CFL by lower watt CFL and high illumination.
Plant – Paonta
• VFD installed in manufacturing vessels leading to batch time reduction and thereby reduction in energy consumption.
• Water harvesting done thereby returning 20% of ground water usage.
• Usage of treated ETP water for gardening purposes.
• Utilization of the compressed air in transfer pump for SNS thereby decreasing energy consumption.
• Translucent sheets used in roofi ng for proper utilization of sunlight for illumination.
• Installation of turbo ventilators for air ventilation instead of conventional air exhausts.
• Reducing the diesel consumption by introducing the heating rod for heating the LPG cylinders in the FT area.
Plant – Dehradun
• Usage of spent steam for heating RCNO in storage tanks during winters (14,580 units saved per annum).
• Introduction of online cap heater for fl ip top caps by removing the conventional off-line cap heater, and saving power.
• Through a lean sigma project optimized the Interplant movement from 265 to 133 average movements per month,
thus saving fuel consumption reducing carbon foot-print.
• Replacement of 250w mercury lamps with 22 W CFL lamps.
• Reduced the batch manufacturing time of Nihar Shanti Badam batch by 20 minutes, thus saving the agitator running
time for 20 mins for each batch. On an average 80 minutes of agitator running saved per manufacturing tank.
• Reduced the batch making time of Parachute Body lotion by 95 minutes for each bath, thus saving the use of
homogenizer and the transfer activity, which in turn saved power.
• Insulation of steam and chiller pipeline in MGS location.
• Re-designed the blowing mechanism of the Hot Air Room and reduced the use of 2 heaters of 1 kw.
Plant - Goa
• Cooker 2 bypass activation resulting in reduction of installed load from 37 kw to 5.5 kw.
• Cake bagging conveyor modifi cation to reduce installed load by 2.2 kw.
• Overfl ow bin deactivation leading to elimination of 1.5 kw motor.
• Using 3 machines to print 4 colors instead of 4 machines, saving 4 kw per line.
annexure to the directors' report
M A R I C O L I M I T E D
90
• Use of heat exchanger to heat oil.
• Condensate recovery system modifi cation to avoid condensate loss due to overfl ow.
Plant – Baddi
• Furnace Oil usage reduction through initiatives like:
o Vacuum pump installation for both bleachers.
o Condensate recovery PPPU pump installation.
o DM plant installation.
o Usage of single booster in Deo for soft oils.
• Power usage reduction through initiatives like:
o Cooling Tower Fan Automation.
o Automation in Fat Trap.
o Using two PHE for Deo out cooling.
Marico continued its journey towards effective utilization of energy. Signifi cant reduction in power consumption has been
achieved and rationalization efforts will continue.
The details of total energy consumption and energy consumption per unit of production are given in Enclosure ‘A’.
B. Technology Absorption
I. Research and Development (R&D)
1. Specifi c areas in which R&D was carried out by your Company:
In the past year, the thrust areas for R&D have been Consumer led Product innovation supported by top end
science. R&D has invested considerable efforts in gaining relevant consumer insights for new categories like
skin care and breakfast cereals. These insights have played a key role in generating differentiating sensories and
creating unique sensorial signatures for the products. This has led to a greater consumer acceptance of these
new products. The functionality of the products has been developed keeping the market benchmarks in sight.
Supported by cutting edge research conducted both in house as well as in collaboration with universities and
institutions across the globe, the products have surpassed the market leaders in terms of overall performance.
Following are some of the new initiatives in R&D:
• Basic research: Programmes to understand hair health and skin moisturization. These programmes were
focused on developing new models and screening various actives for effi cacy.
• New benefi ts: Leveraging advanced instrumentation techniques, strong claims were generated for establishing
new benefi ts of coconut based products in various conditions. These have positioned Marico products higher
than competition benchmarks in terms of effi cacy and value-for-money.
• Effi cacious naturals: Naturals from Ayurveda have been known to be effi cacious, however proving their
effi cacy and overcoming the negative sensories have been a challenge. The naturals programme at Marico
R&D focused on generating effi cacious natural actives for hair and skin care, proving their clinical effi cacy
and generating consumer acceptable sensories through use of perfumes and sensory modifi ers.
• Novel delivery systems: While the quest for effi cacious actives continues, their delivery into the desired site
of action (ex hair follicles, deeper layers of skin) is equally important. Novel delivery systems is a technology
area which focuses on enhancing the stability and delivery of actives in order to increase the effi cacy of the
product.
annexure to the directors' report

M A R I C O L I M I T E D
91
• Open Innovation: Open Innovation has gained popularity recently as a way of fast tracking innovations. This
journey has begun at Marico R&D by initiating networks with the open innovation community. These inputs
are adding to the current pool of innovations developed in house.
2. Benefi ts derived as the result of the above efforts:
• Technology based products leading to differentiation in the market.
• Integration of Consumer Technology Insights into product development, leading to shorter product development
time, creation of right sensories into the product and better success rate.
• Stronger claims on existing and new products.
• Co-creation of best in class products and solutions with experts
3. Future Plan of Action:
Your Company’s R&D will work towards continuous innovation in process, product & packaging technology to
offer consumers value for money with delightful new product concepts, sensorial and product effi cacy.
4. Expenditure on R&D:
(Rs. Crore)
2011-12 2010-11
a) Capital 0.78 17.70
b) Recurring 6.37 7.53
Total 7.15 25.23
c) Total R & D expenditure as % to Sales & Services 0.24 1.08
d) Total R & D expenditure as % to PBT 1.79 6.74
II. Technology absorption, adaptation and innovation
1. Efforts, in brief, made towards technology absorption, adoption and innovation and benefi ts derived as a result
of the same:
The efforts to unravel the benefi ts of Hair oiling on the health of Hair and scalp were progressed with the help of
many International Research agencies. Collaborations with many hair experts including Dermatologist contributed
signifi cantly to the understanding of biology of hair. All these efforts resulted in the creation of effective hair products.
In order to create differentiated technical innovations, a problem solving tool, TRIZ was employed. R&D and
manufacturing team was given hands-on training on the problems from their own area that led to a creation of a
few innovative ideas which are being progressed. The efforts on Open Innovation have enabled spotting of a few
ideas which can support current innovation journey. These ideas are currently been considered for feasibility.
2. Imported technology (imported during the last 5 years reckoned from the beginning of this fi nancial year):
The evaluation of certain technologies in the area of Personal care and Foods is on.
C. Foreign Exchange Earnings and Outgo
The details of total exchange used and earned are provided in Schedule Q of Notes to the Accounts of Marico Limited.
On behalf of the Board of Directors
Place : Mumbai HARSH MARIWALA
Date : May 3, 2012 Chairman and Managing Director
annexure to the directors' report

M A R I C O L I M I T E D
92
annexure to the directors' reportAuditors’ Certificate regarding compliance of conditions of Corporate Governance
To the Members of Marico Limited
We have examined the compliance of conditions of Corporate Governance by Marico Limited (‘the Company’), for the year
ended March 31,2012, as stipulated in Clause 49 of the Listing Agreements of the said Company with stock exchanges in India.
The compliance of conditions of Corporate Governance is the responsibility of the Company’s management. Our examination
was carried out in accordance with the Guidance Note on Certifi cation of Corporate Governance (as stipulated in Clause 49 of the
Listing Agreement), issued by the Institute of Chartered Accountants of India and was limited to procedures and implementation
thereof, adopted by the Company for ensuring the compliance of the conditions of Corporate Governance. It is neither an audit
nor an expression of opinion on the fi nancial statements of the Company.
In our opinion and to the best of our information and according to the explanations given to us,
We certify that the Company has complied with the conditions of Corporate Governance as stipulated in the above mentioned
Listing Agreements.
We state that such compliance is neither an assurance as to the future viability of the Company nor the effi ciency or effectiveness
with which the management has conducted the affairs of the Company.
For Price Waterhouse
Firm Registration Number: 301112E
Chartered Accountants
Uday Shah
Place: Mumbai Partner
Date: May 3, 2012 Membership Number: F-46061

M A R I C O L I M I T E D
93
Disclosure pursuant to the provisions of the Securities and Exchange Board of India (Employee Stock Option Scheme and
Employee Stock Purchase Scheme) Guidelines, 1999
Marico Employees Stock Option Scheme 2007 (ESOS 2007)
annexure to the directors' report
a) Options granted (as at March 31, 2012) 11,376,300 options aggregating to about 1.85% of the paid-up
equity capital of the Company (options, net of lapsed/forfeited/
exercised as at March 31, 2012: 778,313 options aggregating to
about 0.13% of the paid-up capital of the Company)
b) The pricing formula The Exercise Price of the options shall be lower of the following:
Average of the closing price for last 21 (twenty one) trading
session(s) on National Stock Exchange (NSE) prior to the date on
which the Corporate Governance Committee, grants the specifi c
number of options to the employees,
Or
The closing price for the last session on National Stock Exchange
(NSE) prior to the date on which the Corporate Governance
Committee, grants the specific number of options to the
employees.
c) Options vested (as at March 31, 2012) 63,95,835
d) Options exercised (as at March 31, 2012) 5,934,387
e) The total number of shares arising as a result of
exercising of option (as at March 31, 2012)
59,34,387
f) Options lapsed/forfeited (as at March 31, 2012) 4,663,600
g) Variation of terms of options -N.A.-
h) Money realised by exercise of options (as at March 31,
2012)
Rs. 30,881,792
i) Total number of options in force (as at March 31, 2012) 778,313
j) Employee wise details of options granted to : (as at
March 31, 2012)
i) Senior Managerial Personnel A summary¨ of options granted to senior managerial personnel
are as under :
No. of employees covered – 53 (Fifty Three)
No. of options granted to such personnel(options, net of lapsed/
forfeited/exercised ) – 778,313 (Seven Lac Seventy Eight
Thousand Three Hundred and Thirteen only)
¨ Only summary given due to sensitive nature of information
ii) any other employee who receives a grant in any one
year of options amounting to 5% or more of option granted
during the year
-N.A.-
iii) identifi ed employees who were granted option, during
any one year, equal to or exceeding 1% of the issued
capital (excluding outstanding warrants and conversions)
of the company at the time of grant
-N.A.-

M A R I C O L I M I T E D
94
annexure to the directors' report
k) Diluted Earnings per Share (EPS) pursuant to issue of
shares on exercise of option calculated in accordance
with the Accounting Standard (AS) 20’ Earnings per Share
Rs. 5.47
l) i) Method of calculating employee compensation cost The Company has calculated the employee compensation cost
using the intrinsic value method of accounting for the options
granted under the Scheme
ii) Difference between the employee compensation
cost so computed at (I) above and the employee
compensation cost that shall have been recognised if it
had used the fair value of the Options
Rs. 0.32Crores
iii) The impact of this difference on the profi ts and on EPS
of the Company
Had the Company considered ‘fair value’ method then the
additional employee compensation cost would be Rs. 0.32crore
the Profi t Before Tax would be lower by the same amount and
Earning Per Share by Re.0.01
m) Weighted average exercise price and weighted average
fair values of options (to be disclosed separately for
options whose exercise price either equals or exceeds
or is less than the market price of the stock)
Weighted average Exercise Price : Rs. 56.98
Weighted average Fair Value of Option : Rs.24.9
n) Description of method and signifi cant assumptions used
during the year to estimate the fair values of options
Intrinsic Value Method
i) risk – free interest rate
ii) expected life of options
iii) expected volatility
iv) expected dividends
v) closing market price of share on date of option grant

M A R I C O L I M I T E D
95
annexure to the directors' report enclosure 'a'ENCLOSURE ‘A’
Power & Fuel ConsumptionFor the year ended March 31
Note: The numbers given below relate to the own manufacturing facilities of the company. 2012 2011
1. Electricity
a. Purchased units (Kwh) 12,246,583 9,946,291
Amount ( Rs. Crore) 5.77 4.43
Average (Rs./ Unit) 4.71 4.46
b. Own Generation
i. Through Diesel Generator (Kwh) 2,135,953 3,652,696
Amount ( Rs. Crore) 3.00 4.66
Average Rate ( Rs. / Unit) 14.07 12.76
2. Coal – –
3. Furnace oil
Quantity ( KL) 2,702.69 2,755.30
Amount ( Rs. Crore) 11.92 9.17
Average Rate ( Rs. / KL) 44,122.43 33,284.44
4. Other Internal Generation ( excludes HSD used for electricity generation)
L.D.O / H.S.D. – –
Quantity (KL) 542.28 430.65
Amount ( Rs. Crore) 2.02 1.45
Average Rate ( Rs. / KL) 37,163.82 33,714.71
5. Baggase Consumption
Quantity (MT) 6,705.91 12,503.81
Amount ( Rs. Crore) 1.49 2.74
Average Rate ( Rs. / MT) 2,225.60 2,189.66
Consumption per unit of production of edible oils
Unit
Electricity Kwh 138.80 127.86
Coal MT – –
Furnace oil KL 0.03 0.03
L.D.O./H.S.D. KL – –
Baggase KG 0.50 0.38
Consumption per unit of production of processed foods
Unit
Electricity Kwh – –
Coal MT – –
Furnace oil KL – –
L.D.O./H.S.D. KL – –
Consumption per unit of production of hair oils & other formulations
Unit
Electricity Kwh 44.96 50.51
Coal MT – –
Furnace oil KL – –
L.D.O./H.S.D. KL – –

M A R I C O L I M I T E D
96
corporate governance reportThis report on Corporate Governance is divided into the following parts:
• Philosophy on Code of Corporate Governance
• Board of Directors
• Audit Committee
• Remuneration Committee / Corporate Governance Committee
• Shareholders' Committee
• General Body Meetings
• Disclosures
• Means of Communication
• General Shareholder Information
I. PHILOSOPHY ON CODE OF CORPORATE GOVERNANCE
Basic Philosophy
Corporate Governance encompasses laws, procedures, practices and implicit rules that determine a management’s ability
to take sound decisions vis-à-vis all its stakeholders – in particular, its shareholders, creditors, the State and employees.
There is a global consensus on the objective of Good Corporate Governance: Maximising long-term shareholder value.
Since shareholders are residual claimants, this objective follows from a premise that in well-performing capital and fi nancial
markets, whatever maximises shareholder value must necessarily maximise corporate value, and best satisfy the claims of
creditors, employees and the State.
A company which is proactively compliant with the law and which adds value to itself through Corporate Governance
initiatives would also command a higher value in the eyes of present and prospective shareholders.
Marico therefore believes that Corporate Governance is not an end in itself but is a catalyst in the process towards maximisation
of shareholder value. Therefore, shareholder value as an objective is woven into all aspects of Corporate Governance - the
underlying philosophy, development of roles, creation of structures and continuous compliance with standard practices.
Corporate Governance as a concept has gained considerable importance of late, primarily because of the proposal to enshrine
many of the accepted good governance principles into corporate law. For Marico, however, good corporate governance has
been a cornerstone of the entire management process, the emphasis being on professional management, with a decision
making model based on decentralisation, empowerment and meritocracy. Together, the management & Board ensure that
Marico remains a company of uncompromised integrity and excellence.
Risk Assessment and Risk Mitigation Framework
Marico believes that:
• Risks are an integral part of any business environment and it is essential that we create structures that are capable of
identifying and mitigating them in a continuous and vibrant manner.
• Risks are multi-dimensional and therefore have to be looked at in a holistic manner, straddling both, the external
environment and the internal processes.
Marico’s Risk Management processes therefore envisage that all signifi cant activities are analysed across the value chain
keeping in mind the following types of risks:
� Business Risks
� Controls Risks
� Governance Risks

M A R I C O L I M I T E D
97
corporate governance report This analysis is followed by the relevant Function(s) in Marico prioritizing the risks basis their potential impact and then
tracking and reporting status on the mitigation plans for periodic management reviews. This is aimed at ensuring that
adequate checks and balances are in place with reference to each signifi cant risk.
The Board and its Audit Committee are periodically presented with all the information under risks management at group
level and the progress on the risk responses.
The Company has an internal audit system commensurate with the size of the Company and the nature of its business.
The Audit Committee of the Board has the ultimate authority and responsibility to select, evaluate and, where appropriate,
replace the independent auditor in accordance with the law. All possible measures must be taken by the Committee to
ensure the objectivity and independence of the independent auditor. The Committee, independent of the executive director
and promoter directors of the Company, holds periodic one to one discussions with the Internal Auditors to review the scope
and fi ndings of audit and to ensure adequacy of internal audit system in the Company. The Audit Committee reviews the
internal audit plan for every year and approves the same in consultation with top management and internal auditor.
We believe that this framework ensures a unifi ed and comprehensive perspective.
Cornerstones
Marico thus follows Corporate Governance Practices around the following philosophical cornerstones:
Generative Transparency and Openness in Information sharing
Marico believes that sharing and explaining all relevant information on the Company’s policies and actions to all those
to whom it has responsibilities, with transparency and openness, generates an ambience which helps all stakeholders
to take informed decisions about the Company. This refl ects externally in making maximum appropriate disclosures
without jeopardising the Company’s strategic interests as also internally in the Company’s relationship with its employees
and in the conduct of its business.
The Company announces its fi nancial results each quarter, usually within a month of the end of the quarter. Apart from
disclosing these in a timely manner to the stock exchanges, the Company also hosts the results on its website together
with a detailed information update and media release discussing the results. The fi nancial results are published in
leading newspapers. The Company also sends an email update to the shareholders who have registered their email
address with the Company. Marico participates in analyst and investor conference calls, one-on-one meetings and
investor conferences where analysts and fund managers get frequent access to the Company’s senior management.
Presentations made by the Company at investor conferences are also uploaded on its website. Through these meetings,
presentations and information updates the Company shares its broad strategy and business outlook. The Company
also follows a practice of making public information on signifi cant developments through immediate disclosure to the
stock exchanges on which it is listed.
Constructive Separation of Ownership and Management
Marico believes that constructive separation of the Management of the Company from its owners results in maximising
the effectiveness of both, by sharpening their respective accountability. Seven out of eight directors are non-executive
and six of them are independent. The Board does not consist of representatives of creditors or banks. The Committees
of the Board are chaired by Independent Directors.
No related party transactions exist except for those with subsidiaries/group companies and for remuneration to Chairman
and Managing Director (CMD) and relatives of CMD. These can be referred to in Notes to Accounts annexed to the
fi nancial statements for the year ended March 31, 2012.
As and when required, senior management personnel are present at Board / Committee meetings so that the Board/
Committees can seek and get explanations as required from them.
All Directors and employees are required to comply with Marico’s Unifi ed Code Of Conduct (share dealing rules) for
trading in Company’s securities in addition to concerned SEBI regulations.

M A R I C O L I M I T E D
98
corporate governance report The Company’s Internal, External or Cost auditors are not related to the Company.
Accountability
The Board plays a supervisory role rather than an executive role. Members of the Board of Directors of the Company
provide constructive critique on the strategic business plans and operations of the Company. Each business unit is
headed by a Chief Executive Offi cer who is responsible for its management and operation and is answerable to the
Board.
The Audit Committee and the Board of Directors meet at least once every quarter to consider inter alia, the business
performance and other matters of importance.
Discipline
Marico’s senior management understands and advocates the need for good corporate governance practices. The
Company places signifi cant emphasis on good corporate governance practices and endeavours to ensure that the
same is followed at all levels across the Organisation.
The Company continues to focus on its core businesses of beauty and wellness. In its international business too it is
focussed on growing in the Asian and African continents in the near term. This would result in the Company building
depth in its selected segments and geographies rather than spreading itself thin.
The Company has always adopted a conservative policy with respect to debt. All actions having fi nancial implications
are well thought through. Funds are raised for fi nancing activities which add to the business performance and not for
the purpose of arbitrage. The Company has also stayed away from entering into exotic derivative products.
The Company has also followed a prudent dividend policy and has been declaring cash dividend on a regular basis
thereby providing a regular return on investment to shareholders.
Responsibility
The Group has put in place checks and balances to ensure orderly and smooth functioning of operations and also
defi ned measures in case of transgressions by members.
There exists a Unifi ed Code of Conduct which regulates the behaviour and conduct of the members of the Organisation.
Swift action is taken against members found in violation of the code.
Purchase and sale of shares by members is governed by the Unifi ed Code of Conduct to ensure transparency in
trading by all members of the Organisation.
Fairness
All actions taken are arrived after considering the impact on the interests of all stakeholders including minority
shareholders. All shareholders have equal rights and can convene general meetings if they feel the need to do so.
Investor Relations is given due priority. There exists a separate department for handling this function. Full disclosures
are made in the general meeting of all matters. Notice of the meetings are comprehensive, the presentations made
at the meetings are informative. Board remuneration does not rise faster than Company’s profi ts.
Social Awareness
The Company has an explicit policy emphasising ethical behaviour. It follows a strict policy of not employing the under-
aged. The Company believes in equality of genders and does not practise any type of discrimination. All policies are
free of bias and discrimination. Environmental responsibility is given high importance and measures have been taken
at all locations to ensure that members are educated and equipped to discharge their responsibilities in ensuring the
proper maintenance of the environment.

M A R I C O L I M I T E D
99
corporate governance report Value-adding Checks & Balances
Marico relies on a robust structure with value adding checks and balances designed to:
� prevent misuse of authority
� facilitate timely response to change and
� ensure effective management of risks, especially those relating to statutory compliance
At the same time, the structure provides scope for adequate executive freedom, so that bureaucracies
do not take value away from the Governance Objective.
Board / Committee Proceedings
The process of the conduct of the Board and Committee proceedings is explained in detail later on in this Report.
Other Significant Practices
Other signifi cant Corporate Governance Practices followed by Marico are listed below:
Checks & Balances
� All directors are provided with complete information relating to operations and Company fi nances to enable
them to participate effectively in Board discussions.
� Proceedings of Board are logically segregated and matters are delegated to committees as under:
• Administrative Committee covers routine transactional issues.
• Investment and Borrowing Committee covers management of funds.
• Audit Committee covers internal control and audit systems, risk management systems, fi nancial reporting
and compliance issues.
• Corporate Governance Committee (erstwhile Remuneration Committee) covers remuneration of Directors and
their relatives, Corporate Governance policy and procedures and has been designated as the Compensation
Committee for the purpose of administration and superintendence of the Marico Employees Stock Option
Scheme 2007.
• Share Transfer Committee covers transfer formalities and other share-related procedures.
• Shareholders’ Committee covers redressal of investor grievances.
• Securities Issue Committee covers the matters relating to the issue and allotment of securities and allied
matters.
• Above constituted committees meet periodically to review operations.
� Each non-executive director brings value through a specialisation.
� Directorships held are within the ceiling limits specifi ed.
� Committee memberships and chairmanship of directors are within overall limits.
� Statutory compliance report along with a Compliance Certifi cate is placed before the Audit Committee/Board at
every meeting.
� Audit Committee is chaired by an Independent Director to check control systems and review them.
� All Directors endeavour to attend all the Board/Committee meetings as also the Annual General Meeting. The
Chairman of the Audit Committee attends the Annual General Meeting to answer queries, if any, on accounts.
� The Chairman of the Board/Committee, in consultation with the Chief Financial Offi cer and the Company Secretary,
formalises the agenda for each of the Board Meetings.

M A R I C O L I M I T E D
100
� The Board/Committees, at their discretion, invite Senior Managers of the Company and / or outside Advisors to
any meeting(s) of the Board/Committee.
Compliance with Clause 49 of the Listing Agreement
The Company has complied with the provisions of Clause 49 of the Listing agreement (LA), as revised from time to
time.
The Company already has a Unifi ed Code of Conduct for the Board of Directors and Senior Members, and a Whistle
Blower Policy in place.
The Unifi ed Code of Conduct prescribes certain dos and don’ts to the Directors, Senior Management comprising key
personnel of the Company and other employees of the Company to promote ethical conduct in accordance with the
stated values of Marico and also to meet statutory requirements.
The CEO declaration has been included in the CEO Certifi cate given elsewhere in the Annual Report.
II. BOARD OF DIRECTORS
(I) Composition and categories of Directors :-
Name Category
Mr. Harsh Mariwala Chairman & Managing Director (Promoter)
Mr. Rajeev Bakshi Non-Executive and Independent
Mr. Atul Choksey Non-Executive and Independent
Mr. Nikhil Khattau Non-Executive and Independent
Mr. Anand Kripalu Non-Executive and Independent
Mr. Rajendra Mariwala Non-Executive (Promoter)
Ms. Hema Ravichandar Non-Executive and Independent
Mr. B. S. Nagesh Non-Executive and Independent
No director is related to any other director on the Board in terms of the defi nition of ‘Relative’ given under the Companies
Act, 1956. Mr. Harsh Mariwala and Mr. Rajendra Mariwala are related to each other as fi rst cousins.
(II) Attendance of each Director at the Board meetings and the last Annual General Meeting:
Four meetings of the Board of Directors were held during the period April 01, 2011 to March 31, 2012 viz: May 2, 2011,
July 27, 2011, November 4, 2011 and February 2, 2012. The attendance record of all directors is as under: -
Names of Directors No. of Board Meetings Attendance at Last AGM
Held Attended
Mr. Harsh Mariwala 4 4 Yes
Mr. Rajeev Bakshi 4 4 No
Mr. Atul Choksey 4 3 No
Mr. Nikhil Khattau 4 4 Yes
Mr. Anand Kripalu 4 4 No
Mr. Rajendra Mariwala 4 4 No
Ms. Hema Ravichandar 4 4 Yes
Mr. B. S. Nagesh 4 4 Yes
corporate governance report

M A R I C O L I M I T E D
101
corporate governance report (III) Number of Board or Board Committees of which a Director is a member or chairperson (#) (Only the Membership(s)/
Chairmanship(s) of Audit Committee and Shareholders’ Committee is considered as per Clause 49 of the Listing
Agreement)
Director Number of Outside
Directorships ($) held
Number of Committee
Memberships in other
Companies (*)
Number of Committees
(*) in which
Chairperson
Mr. Harsh Mariwala 4 1 1
Mr. Rajeev Bakshi 2 1 Nil
Mr. Atul Choksey 8 Nil Nil
Mr. Nikhil Khattau Nil Nil Nil
Mr. Anand Kripalu 2 Nil Nil
Mr. Rajendra Mariwala 3 1 Nil
Ms. Hema Ravichandar 1 Nil Nil
Mr. B. S. Nagesh 2 1 Nil
(#) As on May 3, 2012
($) Excludes directorship in private limited companies, foreign companies and companies under Section 25 of the
Companies Act, 1956
(*) Only two committees, namely, Audit Committee and Shareholders’/Investors’ Grievance Committee have been
considered as per Clause 49 of the Listing Agreement.
III. AUDIT COMMITTEE
Constitution:
The Audit Committee was constituted by the Board of Directors at its meeting held on January 23, 2001, in accordance with
Section 292A of the Companies Act, 1956. The Audit Committee was last re-constituted by the Board of Directors on July
16, 2010.
The Audit Committee now comprises of the following Members:
Mr. Nikhil Khattau - Chairman
Mr. Rajendra Mariwala - Member
Ms. Hema Ravichandar - Member
Mr. B. S. Nagesh - Member
Ms. Hemangi Ghag - Secretary to the Committee
Mr. Harsh Mariwala - Permanent Invitee
The terms of reference of the Audit Committee are as stated in Clause 49 of the Standard Listing Agreement and Section
292A of the Companies Act, 1956 and include:
1. Oversight of the Company’s fi nancial reporting process and the disclosure of its fi nancial information to ensure that
the fi nancial statement is correct, suffi cient and credible.
2. Recommending to the Board, the appointment, re-appointment and, if required, the replacement or removal of the
statutory auditor and the fi xation of audit fees.
3. Approval of payment to statutory auditors for any other services rendered by the statutory auditors.

M A R I C O L I M I T E D
102
4. Reviewing, with the management, the annual fi nancial statements before submission to the Board for approval, with
particular reference to:
a. Matters required to be included in the Director’s Responsibility Statement to be included in the Board’s report in
terms of clause (2AA) of Section 217 of the Companies Act, 1956
b. Changes, if any, in accounting policies and practices and reasons for the same
c. Major accounting entries involving estimates based on the exercise of judgement by management
d. Signifi cant adjustments made in the fi nancial statements arising out of audit fi ndings
e. Compliance with listing and other legal requirements relating to fi nancial statements
f. Disclosure of any related party transactions
g. Qualifi cations in the draft audit report.
5. Reviewing, with the management, the quarterly fi nancial statements before submission to the Board for approval.
6. Reviewing, with the management, the statement of uses / application of funds raised through an issue (public issue,
rights issue, preferential issue, etc.), the statement of funds utilized for purposes other than those stated in the offer
document/prospectus/notice and the report submitted by the monitoring agency monitoring the utilisation of proceeds
of a public or rights issue, and making appropriate recommendations to the Board to take up steps in this matter.
7. Reviewing, with the management, performance of statutory and internal auditors, and adequacy of the internal control
systems.
8. Reviewing the adequacy of internal audit function, if any, including the structure of the internal audit department, staffi ng
and seniority of the offi cial heading the department, reporting structure coverage and frequency of internal audit.
9. Discussion with internal auditors any signifi cant fi ndings and follow up there on.
10. Reviewing the fi ndings of any internal investigations by the internal auditors into matters where there is suspected
fraud or irregularity or a failure of internal control systems of a material nature and reporting the matter to the Board.
11. Discussion with statutory auditors before the audit commences, about the nature and scope of audit as well as post-
audit discussion to ascertain any area of concern.
12. To look into the reasons for substantial defaults in the payment to the depositors, debenture holders, shareholders
(in case of non payment of declared dividends) and creditors.
13. To review the functioning of the Whistle Blower mechanism.
14. Approval of appointment of CFO (i.e., the whole-time Finance Director or any other person heading the fi nance function
or discharging that function) after assessing the qualifi cations, experience & background, etc. of the candidate.
15. Reviewing mandatorily the following information:
a. Management discussion and analysis of fi nancial condition and results of operations;
b. Statement of signifi cant related party transactions, submitted by management;
c. Management letters / letters of internal control weaknesses issued by the statutory auditors;
d. Internal audit reports relating to internal control weaknesses; and
e. The appointment, removal and terms of remuneration of the Chief internal auditor.
corporate governance report

M A R I C O L I M I T E D
103
corporate governance report The Committee had 5 meetings during the period April 01, 2011 to March 31, 2012 viz: May 2, 2011, July 27, 2011,
November 4, 2011, January 31, 2012 and March 29, 2012.
Names of Directors No. of Audit Committee Meetings
Held Attended
Mr. Nikhil Khattau 5 5
Mr. Rajendra Mariwala 5 5
Ms. Hema Ravichandar 5 4
Mr. B. S. Nagesh 5 5
Mr. Harsh Mariwala 5 5
IV. CORPORATE GOVERNANCE COMMITTEE
Constitution:
The Board of Directors had at its meeting held on October 25, 2005, renamed the Remuneration Committee as the Corporate
Governance Committee with terms of reference relating to overseeing and continuously improving the Corporate Governance
policies and practices in the Company. The primary purpose of the Corporate Governance Committee is ‘to enable’ the
Board function effectively in strategic and core issues of management.
The Corporate Governance Committee reviews and oversees the Remuneration strategy and Performance Management
Philosophy of Marico, especially for Directors and senior employees. The Committee has also been designated as the
Compensation Committee for administration and superintendence of the Company’s Employees Stock Option Scheme.
The Committee will also act as the Nomination Committee, with the details of this role being defi ned at an appropriate
and relevant time in the future. The Corporate Governance Committee was last reconstituted by the Board of Directors on
January 28, 2010.
The Corporate Governance Committee comprises of the following Directors:
Ms. Hema Ravichandar - Chairperson
Mr. Rajeev Bakshi - Member
Mr. Anand Kripalu - Member
Mr. Milind Sarwate - Secretary to the Committee
Mr. Harsh Mariwala - Permanent Invitee
The Corporate Governance Committee met three times during the period April 01, 2011 to March 31, 2012 viz: May 2, 2011,
July 27, 2011 and November 4, 2011.
Details of Remuneration of Non-Executive Directors for the Financial Year Ended March 31, 2012
The Remuneration paid/payable to Non-Executive Directors for the Financial Year 2011-2012 is as under:
Name Remuneration
(payable annually)
(Rs.)
Sitting Fees
(Rs.)
Mr. Rajeev Bakshi 6,00,000 70,000
Mr. Atul Choksey 6,00,000 30,000
Mr. Nikhil Khattau 6,00,000 1,00,000
Mr. Anand Kripalu 6,00,000 70,000
Mr. Rajendra Mariwala 6,00,000 1,00,000
Ms. Hema Ravichandar 6,00,000 1,10,000
Mr. B. S. Nagesh 6,00,000 90,000

M A R I C O L I M I T E D
104
corporate governance report The remuneration paid to Mr. Harsh Mariwala, Chairman & Managing Director, for the fi nancial year 2011-12 is as under:
Name
Salary and
Perquisites
(Rs.)
Annual Performance
Incentive
(Rs.)
Contribution to Provident
and Pension Funds
(Rs.)
Mr. Harsh Mariwala 2,67,50,462 1,03,95,001 29,88,352
For any termination of service contract, the Company and/or the Executive Director is required to give a notice of three
months.
Shareholding of Non Executive Directors
Name of Non Executive Director No. of Shares held
(As on March 31, 2012)
Mr. Rajeev Bakshi 0
Mr. Atul Choksey 12,000
Mr. Nikhil Khattau 0
Mr. Anand Kripalu 0
Mr. Rajendra Mariwala 34,93,200
Ms. Hema Ravichandar 0
Total 35,05,200
REMUNERATION POLICY OF THE COMPANY
Remuneration Policy for Executive Director
The Marico Board presently consists of only one executive director namely Mr. Harsh Mariwala, Chairman & Managing
Director (CMD). Therefore, the remuneration policy for executive directors presently covers only the CMD.
The remuneration of the CMD is governed by the agreement dated August 12, 2011 executed between the Company and
Mr. Harsh Mariwala. The said agreement is valid for a period of 3 years w.e.f April 1, 2011. The terms of this agreement have
already been shared with the members. The remuneration to the CMD comprises of two broad terms – Fixed Remuneration
and Variable remuneration in the form of performance incentive.
The performance incentive is based on internally developed detailed performance related matrix which is verifi ed by the HR
department.
Annual increase in fi xed remuneration within the band already approved by the shareholders is fi rst reviewed and then
approved by the Corporate Governance Committee. The Board notes such annual increases.
Remuneration Policy for Non-Executive Directors
Non-Executive Directors of a Company’s Board of Directors can add substantial value to the Company through their
contribution to the Management of the Company. In addition, they can safeguard the interests of the investors at large by
playing an appropriate control role. For best utilizing the Non Executive Directors, Marico has constituted certain Committees
of the Board, viz. Corporate Governance Committee, Audit Committee and Shareholders’ Committee.
Non-Executive Directors bring in their long experience and expertise to bear on the deliberations of the Marico Board and its
Committees. Although the Non-Executive Directors would contribute to Marico in several ways, including off-line deliberations
with the Managing Director, the bulk of their measurable inputs come in the form of their contribution to Board/Committee
meetings. Marico therefore has a structure for remuneration to non-executive Directors, based on engagement levels of the
Board members linked to their attendance at Board/Committee Meetings.

M A R I C O L I M I T E D
105
corporate governance report The shareholders of the Company had on July 28, 2010 approved payment to Non-Executive Directors for a period of fi ve
years up to a limit of 3% of the net profi ts of the Company calculated in accordance with the provisions of the Companies
Act, 1956 with a liberty to the Board of Directors to decide the mode, the quantum, the recipients and the frequency of
payment of such remuneration within the said limit.
The Board of Directors, at its meeting held on May 3, 2012 approved an increase in the remuneration of the Non-Executive
Directors as under:
Type of Remuneration Existing Remuneration Revised Remuneration
Sitting Fees Rs. 10,000 per meeting Rs. 20,000 per meeting
Annual Remuneration Rs. 6,00,000 Rs. 12,00,000
Additional Annual Remuneration to Chairpersons of Audit Committee and Corporate Governance Committee
Nil Rs. 50,000
The above increase was proposed by the management after a benchmarking study with similar listed organizations in the
industry. The revised remuneration continues to remain within 1% of the net profi ts of the Company calculated in accordance
with the provisions of the Companies Act, 1956.
V. SHAREHOLDERS’ COMMITTEE
Constitution:
The Shareholders’ Committee was constituted by the Board of Directors at its meeting held on October 23, 2001 and was
last re-constituted on July 24, 2008.
The terms of reference of the Shareholders’ Committee are to specifi cally look into the redressal of shareholders’ and
investors’ complaints relating to transfer of shares, non-receipt of balance sheet, non-receipt of dividends etc.
The Shareholders’ Committee now comprises the following Directors (All Non-Executive):
Mr. Nikhil Khattau - Chairman
Mr. Rajendra Mariwala - Member
Ms. Hemangi Ghag - Secretary to the Committee
VI. ADMINISTRATIVE COMMITTEE
Constitution:
The Administrative Committee was constituted by the Board of Directors at its meeting held on April 27, 1998 and was last
re-constituted on November 4, 2011.
The terms of reference of the Administrative Committee are to consider and dispose of any day-to-day matters, with a view
to ensuring smooth operation and timely action/compliances. The Committee meets at frequent intervals and dispose
matters which are of routine but urgent in nature without having to wait for the next board meeting or resorting of passing
of circular resolutions.
The Administrative Committee now comprises the following members:
Mr. Harsh Mariwala - Chairman
Mr. Rajendra Mariwala - Member
Mr. Milind Sarwate - Member
Mr. Vivek Karve - Member
Mr. Ravin Mody - Member
Ms. Hemangi Ghag - Secretary to the Committee
The Administrative Committee met 16 (Sixteen) times during the period April 01, 2011 to March 31, 2012.

M A R I C O L I M I T E D
106
VII. INVESTMENT AND BORROWING COMMITTEE
Constitution:
The Investment and Borrowing Committee was constituted by the Board of Directors at its meeting held on June 30, 1998
and was last re-constituted on October 26, 2010.
The terms of reference of the Investment and Borrowing Committee to invest, borrow or lend monies with a view to ensure
smooth operation and timely action. The Committee meets at frequent intervals and dispose matters which are of routine
but urgent in nature without having to wait for the next board meeting or resorting of passing of circular resolutions.
The Investment and Borrowing Committee now comprises the following members:
Mr. Harsh Mariwala - Chairman
Mr. Milind Sarwate - Member
Mr. Chaitanya Deshpande - Member
Mr. Vivek Karve - Member
Ms. Hemangi Ghag - Secretary to the Committee
The Investment and Borrowing Committee met 13 (Thirteen) times during the period April 01, 2011 to March 31, 2012.
VIII. SECURITIES ISSUE COMMITTEE
Constitution:
The Securities Issue Committee was constituted by the Board of Directors on April 20, 2006 and was re-constituted on
May 3, 2012.
The terms of reference of the Securities Issue Committee relates to overseeing all matters pertaining to issue of Securities,
other matters incidental to the issue and all such acts/ powers as may be entrusted to it by the Board from time to time.
The Securities Issue Committee now comprises the following members:
Mr. Harsh Mariwala - Chairman
Mr. Milind Sarwate - Member
Mr. Chaitanya Deshpande - Member
Mr. Vivek Karve - Member
Mr. Rajeev Doshi - Member
Mr. Ravin Mody - Member
Ms. Hemangi Ghag - Secretary to the Committee
There was no meeting of the Securities Issue Committee held during the period April 01, 2011 to March 31, 2012.
IX. SHARE TRANSFER COMMITTEE
Constitution:
The Share Transfer Committee was constituted by the Board of Directors at its meeting held on April 20, 2006 and was re-
constituted on May 3, 2012.
The terms of reference of the Share Transfer Committee to approve, transfer and transmission of shares and to approve
sub-division, consolidation and issue of new/duplicate share certifi cates, whenever requested for by the shareholders of
the Company.
corporate governance report

M A R I C O L I M I T E D
107
The Share Transfer Committee now comprises the following members:
Mr. Harsh Mariwala - Chairman
Mr. Milind Sarwate - Member
Mr. Chaitanya Deshpande - Member
Mr. Vivek Karve - Member
Mr. Rajeev Doshi - Member
Mr. Ravin Mody - Member
Ms. Hemangi Ghag - Secretary to the Committee
The Share Transfer Committee met 3 (Three) times during the period April 01, 2011 to March 31, 2012.
Name and Designation of Compliance Officer:
Ms. Hemangi Ghag, the Company Secretary & Compliance Offi cer
Status Report of Investor Complaints for the year ended March 31, 2012
No. of Complaints Received - 34
No. of Complaints Resolved - 34
No. of Complaints Pending - NIL
All valid requests for share transfer received during the year have been acted upon and no such transfer is pending.
X. GENERAL BODY MEETINGS
Annual General Meetings
YEAR VENUE DATE TIME
2009 Mayfair Rooms, ‘Mayfair South’, 254- C, Dr. Annie
Besant Road, Worli, Mumbai – 400 030
July 23, 2009 3.00 p.m.
2010 The National Stock Exchange of India Limited,
‘NSE Auditorium’, Ground Floor, Exchange
Plaza, Bandra-Kurla Complex, Bandra (East),
Mumbai – 400051
July 28, 2010 3.30 p.m.
2011 IES Management College & Research Centre,
Gate No. 4, Seminar Hall, 6th Floor, Plot No. 791,
S. K. Marg, VMDL Complex, Bandra Reclamation,
Bandra (West), Mumbai – 400050
July 27, 2011 3.30 p.m.
XI. DISCLOSURES
There has not been any non-compliance, penalties or strictures imposed on the Company by the Stock Exchanges,
SEBI or any other statutory authority, on any matter relating to the capital markets during the last three years.
During the year 2011-2012, there were no materially signifi cant related party transactions i.e. transactions of the Company
of material nature, with its Promoters, the Directors or the Management, their subsidiaries or relatives etc. that may have
potential confl ict with the interest of Company at large.
corporate governance report

M A R I C O L I M I T E D
108
The Company has a well-defi ned Whistle Blower Policy and it is fully implemented by the Management.
No personnel have been denied access to the Audit Committee.
Compliance with mandatory and non-mandatory requirements of Clause 49 of the Listing Agreement
The Company has complied with mandatory requirements of Clause 49 of the Listing Agreement requiring it to obtain a
certifi cate from either the Auditors or Practising Company Secretaries regarding compliance of conditions of Corporate
Governance as stipulated in this clause and annex the certifi cate with the Directors’ Report, which is sent annually to all the
shareholders of the Company. We have obtained a certifi cate to this effect from the auditors and the same is given as an
annexure to the Directors’ Report.
The clause further states that the non-mandatory requirements may be implemented as per our discretion. However, the
disclosures of the compliance with mandatory requirements and adoption (and compliance) / non-adoption of the non-
mandatory requirements shall be made in the section on Corporate Governance of the Annual Report. We comply with the
following non-mandatory requirements:
Remuneration Committee
The scope of the Remuneration Committee was expanded and designated as the Corporate Governance Committee by
the Board of Directors at its meeting held on October 25, 2005. A detailed note on the Committee is provided elsewhere in
this report.
Whistle Blower Policy
We have established a mechanism for employees to report concerns about unethical behaviour, actual or suspected fraud or
violation of our code of conduct or ethics policy. This mechanism also provides for adequate safeguards against victimization
of employees who avail of the mechanism and also provide for direct access to the Chairman of the Audit Committee in
exceptional cases. The guidelines are meant for all members of the Organization from the day they join and are designed
to ensure that they may raise any specifi c concern on integrity, value adherence without fear of being punished for raising
that concern. The guidelines also cover our associates who partner us in our organizational objectives and customers for
whom we exist.
The Board and its Corporate Governance Committee are informed periodically on the matters reported with the Whistle
Blower Ombudsman and the status of resolution of such cases.
XII. MEANS OF COMMUNICATION
Quarterly and annual results for Marico Limited as also consolidated fi nancial results for the Marico group are published
in an English fi nancial daily (Free Press Journal) and a vernacular newspaper (Navashakti). The Company also sends an
email update of the same to the shareholders who have registered their email address with the Company.
All offi cial news releases and fi nancial results are communicated by the Company through its corporate website -
www.marico.com. Presentations made to Institutional Investors/ analysts at Investor Meets organized by the Company are
also put up on the website for wider dissemination.
The Management Discussion and Analysis Report forms part of the Annual Report.
corporate governance report

M A R I C O L I M I T E D
109
XIII. GENERAL SHAREHOLDER INFORMATION
Details of Directors seeking appointment/reappointment at the forthcoming Annual General Meeting
Mr. Anand Kripalu
Profile :
Mr. Anand Kripalu is a Bachelor of Electronics from the Indian Institute of Technology, Madras and an MBA from the
Indian Institute of Management, Calcutta. He is currently the President, South Asia & Indochina, Kraft Foods Inc and
additionally, Managing Director for Cadbury India.
Mr. Kripalu, in his long experience of 28 years in the FMCG Industry, has held several positions in Sales, Marketing and
Operations in Unilever. His last assignment was Managing Director for Unilever’s East Africa operations. Key assignments
handled by him include setting up of the Dental Innovation Centre at Mumbai, Head of Market Research, and Head
of Marketing for the Laundry category for India and the Central Asia Middle East Region. He has also been General
Manager - Sales & Customer Development for HLL’s Detergents business, with the overall responsibility of Customer
Management for the company.
He has been on the Board of Directors of the Company since April 26, 2007. He does not have any shareholding in the
Company.
Directorship and Committee membership of Mr. Kripalu in other Companies :
Directorships in other companies(*): Membership / Chairmanship of Board Committees in
other Companies (*):
Cadbury India Limited
Induri Farm Ltd
None
(*) As on May 3, 2012
Mr. B. S. Nagesh
Profile :
Mr. B. S. Nagesh has been with Shopper’s Stop Ltd since its inception in 1991. Recognized as the pioneer of the retail
boom in India, Mr. Nagesh was voted by Business India as one of the top 50 managers in India who will infl uence the
Indian business scenario in the 21st century. Mr. Nagesh was also instrumental in acquisition of the Crossword chain of
bookstores in the year 2000. Ernst & Young nominated him for the Entrepreneur of the Year Award 2005 as one of the
top 30 fi nalists.
Mr. Nagesh is the fi rst Asian to be inducted into the “World Retail Hall of Fame” 2008 along with Mr. Millard Drexler
of J Crew, Sir Philip Green of BHS and Arcadia and Mr. Amancio Ortega of Inditex at the World Retail Congress 2008
conducted in Barcelona. The four iconic retailers have been selected by retail industry leaders and experts from across
the Globe in recognition of their supreme industry achievements.
Shoppers Stop Ltd also won the ‘Emerging Market Retailer of the Year’ Award at the World Retail Congress 2008.
Mr. B.S. Nagesh has been involved in setting up and opening the country’s largest hypermarket HyperCity, which was
launched in May 2006 and there has been no looking back ever since, with the seventh HyperCity being opened on 29th
of March 2010 in whitefi eld Bangalore. HyperCity has been declared as one of the top 100 retail destinations in the world
by Retail Week, UK and the best hypermarket at the United States International Design Awards in New York. In August
this year Mr. Nagesh was elevated as the Vice Chairman of Shoppers’ Stop in a non executive position.
corporate governance report

M A R I C O L I M I T E D
110
Before joining the K.Raheja Corp group in 1991, Nagesh was involved with Carona Ltd. (1988-1991) as its zonal manager
retail for South & East controlling the operations of 128 stores in these two regions.
Starting his career as a Sales Offi cer in the Delhi branch of Blow Plast Ltd in 1982, Nagesh left Blow Plast in 1986 when
he was the Area Manager for Vijaywada branch to Join Orson Electronics as the Branch Manager for Delhi, Haryana.
(1986-1988).
As part of his personal philosophy of Learn, Earn & Return, Nagesh stepped down from all operational role in the K.Raheja
Corp group in August 2009 at the age of 50. He has set up a charitable trust called TRRAIN (TRUST FOR RETAILERS
AND RETAIL ASSOCIATES OF INDIA). He has also established Section 25 company called TRRAIN FOUNDATION with
a not for profi t objective. Both these organisations are working towards empowering people in retail by helping them
through fi nancial literacy, skilling, education and getting them pride and respect through awards and celebrations.
Mr. Nagesh has been on the Board of Directors of the Company since July 16, 2010. He does not have any shareholding
in the Company.
Directorship and Committee membership of Mr. Nagesh in other Companies.
Directorships in other companies(*): Membership / Chairmanship of Board Committees in
other Companies (*):
Shoppers Stop Limited
Hypercity Retail (India) Limited
Retailers Association of India
Trrain Foundation
Nagesh (BSN) Consults Private Limited
Hypercity Retail (India) Limited:
Remuneration Committee – Chairman
Finance Committee – Member
Shoppers Stop Limited:
Finance Committee – Member
Investor Grievance and Share Transfer Committee - Member
(*) As on May 3, 2012
corporate governance report

M A R I C O L I M I T E D
111
Annual General Meeting – Date, time and Venue : Friday, August 3, 2012 at 4.00 p.m.
‘NSE Auditorium’, Ground Floor, Exchange Plaza, Bandra-Kurla
Complex, Bandra (East), Mumbai – 400051.
Financial Year : April 01 - March 31
Book Closure Date : Wednesday, August 1, 2012 to Friday, August 3, 2012,
both days inclusive.
Dividend Payment Date : November 25, 2011 (1st Interim Equity Dividend 11-12)
May 18, 2012 (2nd Interim Equity Dividend 11-12)
Listing on Stock Exchanges : Bombay Stock Exchange Limited (BSE),
Phiroze Jeejeebhoy Towers, Dalal Street, Mumbai 400 001.
The National Stock Exchange of India Limited (NSE),
Exchange Plaza, Bandra Kurla Complex, Mumbai 400 051.
Stock /Scrip Code : BSE – 531642
NSE – MARICO
ISIN number : INE 196A01026
Company Identifi cation Number (CIN) : L15140MH1988PLC049208
Unique Identifi cation Number : 100067223
Market Price Data
Month Bombay Stock Exchange Limited(BSE)
(in Rs.)
The National Stock Exchange of India Limited(NSE)
(in Rs.)
*High *Low *High *Low
April 2011 150 134.6 150 134.5
May 2011 151.8 127 152.4 127.2
June 2011 159.4 137.05 159.5 137.5
July 2011 172.7 150.2 172.95 150.1
August 2011 169.95 144.5 173.65 144.05
September 2011 166.5 139.75 166.8 138.2
October 2011 163.8 140.65 173.1 140.65
November 2011 170 142.1 177.2 142.05
December 2011 150 134.1 154.9 137
January 2012 156.5 143.45 156.4 141.35
February 2012 174 149 178.5 149.1
March 2012 176.5 155.15 178 155.25

M A R I C O L I M I T E D
112
PERFORMANCE IN COMPARISON: BSE SENSEX, S & P CNX NIFTY AND BSE FMCG
Marico v/s BSE IndexPr
ice
Inde
xed
to 1
00
150
130
110
90
70
Ap
r-11
Ma
y-11
Ju
n-11
Ju
l-11
Au
g-11
Se
p-11
Oct-11
No
v-11
De
c-11
Ja
n-1
2
Fe
b-1
2
Ma
r-1
2
Marico BSE Index
Marico v/s BSE FMCG
Pric
e In
dexe
d to
100
150
130
110
90
70
50
Apr-11
May-11
Ju
n-11
Ju
l-11
Au
g-11
Se
p-11
Oct-11
No
v-11
De
c-11
Ja
n-1
2
Fe
b-1
2
Ma
r-1
2
Marico FMCG Index
Marico v/s NSE Index
Pric
e In
dexe
d to
100
150
130
110
90
70
50
Apr-11
May-11
Ju
n-11
Ju
l-11
Au
g-11
Se
p-11
Oct-11
No
v-11
De
c-11
Ja
n-1
2
Fe
b-1
2
Ma
r-1
2
Marico NSE Index
corporate governance report
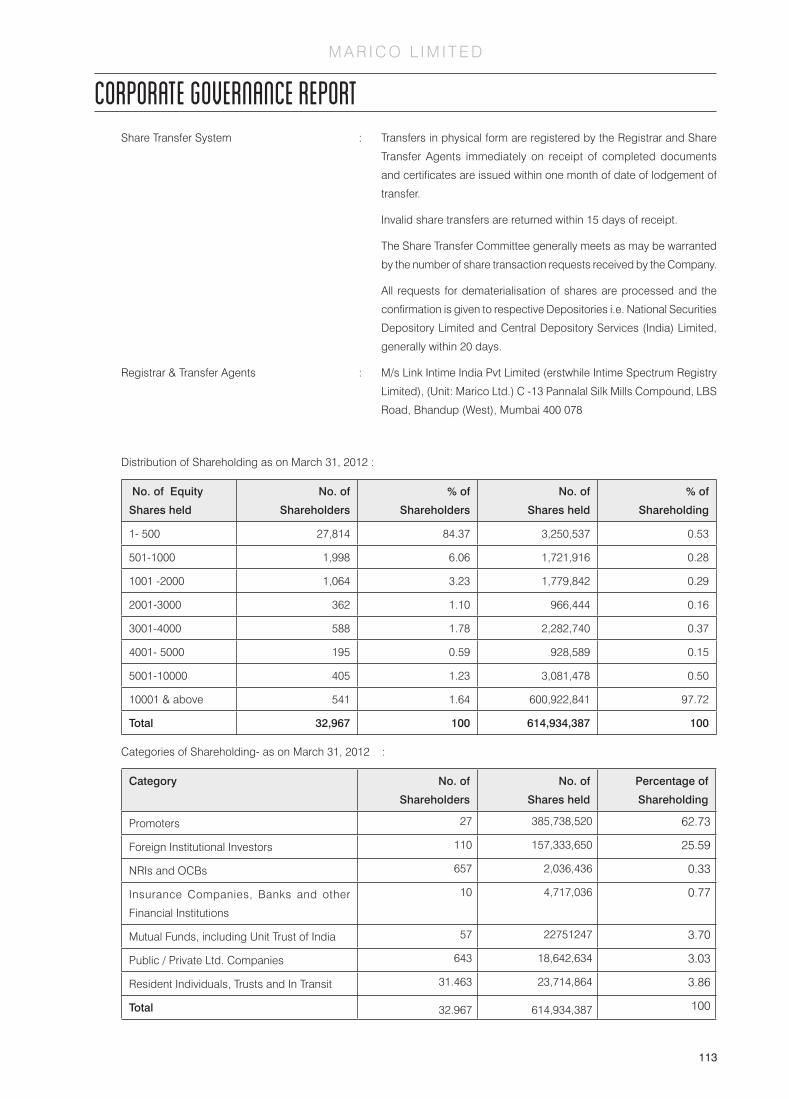
M A R I C O L I M I T E D
113
Share Transfer System : Transfers in physical form are registered by the Registrar and Share
Transfer Agents immediately on receipt of completed documents
and certifi cates are issued within one month of date of lodgement of
transfer.
Invalid share transfers are returned within 15 days of receipt.
The Share Transfer Committee generally meets as may be warranted
by the number of share transaction requests received by the Company.
All requests for dematerialisation of shares are processed and the
confi rmation is given to respective Depositories i.e. National Securities
Depository Limited and Central Depository Services (India) Limited,
generally within 20 days.
Registrar & Transfer Agents : M/s Link Intime India Pvt Limited (erstwhile Intime Spectrum Registry
Limited), (Unit: Marico Ltd.) C -13 Pannalal Silk Mills Compound, LBS
Road, Bhandup (West), Mumbai 400 078
Distribution of Shareholding as on March 31, 2012 :
No. of Equity
Shares held
No. of
Shareholders
% of
Shareholders
No. of
Shares held
% of
Shareholding
1- 500 27,814 84.37 3,250,537 0.53
501-1000 1,998 6.06 1,721,916 0.28
1001 -2000 1,064 3.23 1,779,842 0.29
2001-3000 362 1.10 966,444 0.16
3001-4000 588 1.78 2,282,740 0.37
4001- 5000 195 0.59 928,589 0.15
5001-10000 405 1.23 3,081,478 0.50
10001 & above 541 1.64 600,922,841 97.72
Total 32,967 100 614,934,387 100
Categories of Shareholding- as on March 31, 2012 :
Category No. of
Shareholders
No. of
Shares held
Percentage of
Shareholding
Promoters 27 385,738,520 62.73
Foreign Institutional Investors 110 157,333,650 25.59
NRIs and OCBs 657 2,036,436 0.33
Insurance Companies, Banks and other
Financial Institutions
10 4,717,036 0.77
Mutual Funds, including Unit Trust of India 57 22751247 3.70
Public / Private Ltd. Companies 643 18,642,634 3.03
Resident Individuals, Trusts and In Transit 31.463 23,714,864 3.86
Total 32.967 614,934,387 100
corporate governance report

M A R I C O L I M I T E D
114
Dematerialization of Shares and Liquidity : As on March 31, 2012, 99.85% of shareholding was held in
Dematerialised form with National Securities Depository Limited and
Central Depository Services (India) Limited.
: In terms of the notifi cation issued by SEBI, trading in the equity shares
of the Company is permitted only in dematerialised form with effect
from May 31, 1999.
Outstanding GDR / ADR / Warrants or any : The Company has not issued any GDR / ADR / Warrants or any
convertible instruments, conversion date convertible instruments.
and impact on equity
Plant Locations : Kanjikode, Jalgaon, Goa, Pondicherry, Daman, Dehradun, Paonta
Sahib and Baddi
Address for correspondence : Shareholding related queries
Company’s Registrar & Transfer Agent:
M/s Link Intime India Pvt Limite
(erstwhile Intime Spectrum Registry Limited)
Unit: Marico Limited
C -13 Pannalal Silk Mills Compound,
LBS Road, Bhandup (West), Mumbai 400 078.
Tel.: 022 - 25946970, Fax: 022 - 25946969
E-mail: [email protected]
General Correspondence
Marico Limited, Rang Sharda, Krishnachandra Marg,
Bandra Reclamation, Bandra (West), Mumbai – 400 050.
Tel.: 022 - 66480480, Fax:022 - 66490112
E-mail: [email protected]
corporate governance report

M A R I C O L I M I T E D
115
corporate governance report
CHIEF EXECUTIVE OFFICER (CEO) AND CHIEF FINANCIAL OFFICER (CFO) CERTIFICATION
We, to the best of our knowledge and belief, hereby certify that:
(a) We have reviewed the fi nancial statements and cash fl ow statement for the year ended March 31, 2012 and to the best of
our knowledge and belief:
(i) these statements do not contain any materially untrue statement or omit any material fact or contain statements that
might be misleading;
(ii) these statements together present a true and fair view of the Company’s affairs and are in compliance with existing
accounting standards, applicable laws and regulations.
(b) There are, to the best of our knowledge and belief, no transactions entered into by the Company during the year, which are
fraudulent or illegal or violative of the Company’s Code of Conduct.
(c) We accept responsibility for establishing and maintaining internal controls and that we have evaluated the effectiveness of
the internal control systems of the Company and we have disclosed to the auditors and the Audit Committee, defi ciencies
in the design or operation of internal controls, if any, of which we are aware and the steps we have taken or propose to take
to rectify these defi ciencies.
(d) We have indicated to the auditors and the Audit Committee:
(i) signifi cant changes in internal control during the year;
(ii) signifi cant changes in accounting policies during the year and that the same have been disclosed in the Notes to the
Accounts to the fi nancial statements; and
(iii) instances of signifi cant fraud of which we have become aware and the involvement therein, if any, of the Management
or an employee having a signifi cant role in the Company’s internal control system over fi nancial reporting.
Yours truly,
For Marico Limited For Marico Limited
Harsh Mariwala Milind Sarwate
Chairman and Managing Director Group Chief Financial Offi cer
Place: Mumbai Place: Mumbai
Date : May 3, 2012 Date : May 3, 2012
CHIEF EXECUTIVE OFFICER (CEO) DECLARATION
This is to confi rm that the Company has adopted a Code of Conduct for its Board Members and senior management. This Code
of Conduct is available on the Company’s website.
I confi rm that the Company has in respect of the fi nancial year ended March 31, 2012, received from the senior management team
of the Company and the Members of the Board a declaration of compliance with the Code of Conduct as applicable to them.
For the purpose of this declaration, senior management team means personnel as specifi ed in the Annexure to the Code of
Conduct of the Company.
HARSH MARIWALA
Chairman and Managing Director
Place: Mumbai
Date: May 3, 2012

M A R I C O L I M I T E D
116
auditors' reportAuditors’ Report to the Members of Marico Limited
1. We have audited the attached Balance Sheet of Marico Limited (the “Company”)as at March 31, 2012 and the related
Statement of Profi t and Loss and Cash Flow Statement for the year ended on that date (all together referred to as ‘fi nancial
statements’) annexed thereto, which we have signed under reference to this report. These fi nancial statements are the
responsibility of the Company’s Management. Our responsibility is to express an opinion on these fi nancial statements
based on our audit.
2. We conducted our audit in accordance with the auditing standards generally accepted in India. Those Standards require
that we plan and perform the audit to obtain reasonable assurance about whether the fi nancial statements are free of
material misstatement. An audit includes examining, on a test basis, evidence supporting the amounts and disclosures in
the fi nancial statements. An audit also includes assessing the accounting principles used and signifi cant estimates made
by Management, as well as evaluating the overall fi nancial statement presentation. We believe that our audit provides a
reasonable basis for our opinion.
3. As required by the Companies (Auditor’s Report) Order, 2003, as amended by the Companies (Auditor’s Report) (Amendment)
Order, 2004 (together the “Order”), issued by the Central Government of India in terms of sub-section (4A) of Section 227 of
‘The Companies Act, 1956’ of India (the ‘Act’) and on the basis of such checks of the books and records of the Company
as we considered appropriate and according to the information and explanations given to us, we give in the Annexure a
statement on the matters specifi ed in paragraphs 4 and 5 of the Order.
4. Further to our comments in the Annexure referred to in paragraph 3 above, we report that:
(a) We have obtained all the information and explanations which, to the best of our knowledge and belief, were necessary
for the purposes of our audit;
(b) In our opinion, proper books of account as required by law have been kept by the Company so far as appears from
our examination of those books;
(c) The Balance Sheet, Statement of Profi t and Loss and Cash Flow Statement dealt with by this report are in agreement
with the books of account;
(d) In our opinion, the Balance Sheet, Statement of Profi t and Loss and Cash Flow Statement dealt with by this report
comply with the accounting standards referred to in sub-section (3C) of Section 211 of the Act;
(e) On the basis of written representations received from the directors, as on March 31,2012 and taken on record by the
Board of Directors, none of the directors is disqualifi ed as on March 31, 2012 from being appointed as a director in
terms of clause (g) of sub-section (1) of Section 274 of the Act;
(f) In our opinion and to the best of our information and according to the explanations given to us, the said fi nancial
statements together with the notes thereon and attached thereto give, in the prescribed manner, the information required
by the Act, and give a true and fair view in conformity with the accounting principles generally accepted in India:
(i) in the case of the Balance Sheet, of the state of affairs of the Company as at March 31, 2012;
(ii) in the case of the Statement of Profi t and Loss, of the profi t for the year ended on that date; and
(iii) in the case of the Cash Flow Statement, of the cash fl ows for the year ended on that date.
For Price Waterhouse Firm Registration Number: 301112E Chartered Accountants
Uday Shah
Place : Mumbai Partner
Date : May 3, 2012 Membership Number : F-46061
M A R I C O L I M I T E D
117
annexure to auditors' reportReferred to in Paragraph 3 of the Auditors’ Report of even date to the members of Marico Limited on the financial statements
for the year ended March 31, 2012.
1. (a) The Company is maintaining proper records showing full particulars, including quantitative details and situation, of
fi xed assets.
(b) The fi xed assets are physically verifi ed by the Management according to a phased programme designed to cover all
the items over a period of two years which, in our opinion, is reasonable having regard to the size of the Company
and the nature of its assets. Pursuant to the programme, a portion of the fi xed assets has been physically verifi ed by
the Management during the year and no material discrepancies between the book records and the physical inventory
have been noticed.
(c) In our opinion, and according to the information and explanations given to us, a substantial part of fi xed assets has
not been disposed of by the Company during the year.
2. (a) The inventory has been physically verifi ed by the Management during the year. In respect of inventory lying with third
parties, these have substantially been confi rmed by them. In our opinion, the frequency of verifi cation is reasonable.
(b) In our opinion, the procedures of physical verifi cation of inventory followed by the Management are reasonable and
adequate in relation to the size of the Company and the nature of its business.
(c) On the basis of our examination of the inventory records, in our opinion, the Company is maintaining proper records
of inventory. The discrepancies noticed on physical verifi cation of inventory as compared to book records were not
material.
3. The Company has neither granted nor taken any loans, secured or unsecured, to / from companies, fi rms or other parties
covered in the register maintained under Section 301 of the Act.
4. In our opinion, and according to the information and explanations given to us, there is an adequate internal control system
commensurate with the size of the Company and the nature of its business for the purchase of inventory and fi xed assets
and for the sale of goods and services. Further, on the basis of our examination of the books and records of the Company,
and according to the information and explanations given to us, we have neither come across, nor have been informed of,
any continuing failure to correct major weaknesses in the aforesaid internal control system.
5. According to the information and explanations given to us, there have been no contracts or arrangements referred to in
Section 301 of the Act during the year to be entered in the register required to be maintained under that Section. Accordingly,
the question of commenting on transactions made in pursuance of such contracts or arrangements does not arise.
6. The Company has not accepted any deposits from the public within the meaning of Sections 58A and 58AA of the Act and
the rules framed there under.
7. In our opinion, the Company has an internal audit system commensurate with its size and the nature of its business.
8. We have broadly reviewed the books of account maintained by the Company in respect of products where, pursuant to the
rules made by the Central Government of India, the maintenance of cost records has been prescribed under clause (d) of
sub-section (1) of Section 209 of the Act, and are of the opinion that, prima facie, the prescribed accounts and records have
been made and maintained. We have not, however, made a detailed examination of the records with a view to determine
whether they are accurate or complete.
9. (a) According to the information and explanations given to us and the records of the Company examined by us, in our
opinion, the Company is regular in depositing the undisputed statutory dues, including provident fund, investor education
and protection fund, employees’ state insurance, income tax, sales tax, wealth tax, service tax, customs duty, excise
duty and other material statutory dues, as applicable, with the appropriate authorities.

M A R I C O L I M I T E D
118
(b) According to the information and explanations given to us and the records of the Company examined by us, the
particulars of dues of income tax, sales tax and customs duty as at March 31, 2012 which have not been deposited
on account of a dispute are as follows:
Name of the Statue Nature of dues
Amount (Rs. in Crore )
Period to which the amount relates
Forum where the dispute is pending
The Central Sales Tax Act and Local Sales Tax Acts
Sales tax including interest and penalty as applicable
2.09 2006 -07 to 2010-2011 Additional Commissioner – Sales tax Appeals
0.86 Various years Deputy Commissioner – sales tax Appeals.
0.53 2005-06 to 2008-09 Joint Commissioner – Sales Tax Appeals
2.59 Various years Sales tax Tribunal
0.04 1995-96 High Court - U.P.
0.57 2004-05 Assistant Commissioner – Sales Tax Appeals
The Indian Customs Act,1962
Export cess 0.09 2004 Deputy Commissioner of Customs - Kolkatta
The Indian Customs Act,1962
Redemption fi ne and penalty
0.30 2002 to 2004 Customs Excise and Service Tax Appellate Tribunal - Mumbai
The Indian Customs Act,1962
Custom duty 0.01 2008 Assistant Commissioner of Customs – Mumbai
Income Tax Act,1961 Income tax 0.47 Block period from 1991-92 to 1996-97.
Income Tax Appellate Tribunal
Income Tax Act,1961 Income Tax 0.66 Assessment Year 2005-06
Commissioner of Income Tax Appeals
10. The Company has no accumulated losses as at March 31,2012 and it has not incurred any cash losses in the fi nancial
year ended on that date or in the immediately preceding fi nancial year.
11. According to the records of the Company examined by us and the information and explanations given to us, the Company has not defaulted in repayment of dues to any fi nancial institution or bank or debenture holders as at the balance sheet date.
12. The Company has not granted any loans and advances on the basis of security by way of pledge of shares, debentures and other securities.
13. The provisions of any special statute applicable to chit fund/ nidhi/ mutual benefi t fund/ societies are not applicable to the Company.
14. In our opinion, the Company is not a dealer or trader in shares, securities, debentures and other investments.
15. In our opinion, and according to the information and explanations given to us, the terms and conditions of the guarantees given by the Company for loans taken by subsidiaries from banks or fi nancial institutions during the year are not prejudicial to the interest of the Company.
16. In our opinion, and according to the information and explanations given to us, the term loans have been applied, on an overall basis, for the purposes for which they were obtained.
annexure to auditors' report

M A R I C O L I M I T E D
119
annexure to auditors' report17. On the basis of an overall examination of the balance sheet of the Company, in our opinion, and according to the
information and explanations given to us, there are no funds raised on a short-term basis which have been used for long-term investment.
18. The Company has not made any preferential allotment of shares to parties and companies covered in the register maintained under Section 301 of the Act during the year.
19. The Company issued 500, 10.05% Rated Taxable Unsecured Redeemable Non – convertible debentures of face value of Rs. 10 lakhs each, aggregating Rs. 50 Crore which are outstanding at the year-end, in respect of which it is not required to create security or charge.
20. The Company has not raised any money by public issues during the year.
21. During the course of our examination of the books and records of the Company, carried out in accordance with the generally accepted auditing practices in India, and according to the information and explanations given to us, we have neither come across any instance of fraud on or by the Company, noticed or reported during the year, nor have we been informed of any such case by the Management.
For Price Waterhouse Firm Registration Number: 301112E Chartered Accountants
Uday Shah
Place : Mumbai Partner
Date : May 3, 2012 Membership Number : F-46061

M A R I C O L I M I T E D
120
balance sheet
The notes are an integral part of these fi nancial statements.
As per our attached report of even date.
For Price Waterhouse For and on behalf of the Board of DirectorsChartered Accountants HARSH MARIWALA Chairman and Managing DirectorFirm Registration No. 301112E NIKHIL KHATTAU Director and Chairman of Audit Committee MILIND SARWATE Group Chief Financial Offi cerUDAY SHAH HEMANGI GHAG Company Secretary & Compliance Offi cerPartner Membership No. F-46061Place : Mumbai Place : MumbaiDate : May 3, 2012 Date : May 3, 2012
EQUITY AND LIABILITIES
Shareholders’ Funds
Share capital 3 61.49 61.44
Reserves and surplus 4 1,062.63 811.68
1,124.12 873.12
Non-current liabilities
Long-term borrowings 5 324.73 307.48
Long-term provisions 6 5.32 0.02
330.05 307.50
Current liabilities
Short-term borrowings 7 228.42 192.71
Trade payables 8 244.47 162.73
Other current liabilities 9 85.72 108.97
Short-term provisions 10 47.88 40.70
606.49 505.11
TOTAL 2,060.66 1,685.73
ASSETS
Non-current assets
Fixed assets
Tangible assets 11 (A) 238.08 221.16
Intangible assets 11 (B) 2.01 1.30
Capital work-in-progress 36.22 24.71
276.31 247.17
Non-current investments 12 405.91 392.42
Deferred tax assets (net) 13 19.08 26.54
Long-term loans and advances 14 235.81 205.60
Other non-current assets 15 123.14 98.21
1,060.25 969.94
Current assets
Current investments 16 266.26 77.94
Inventories 17 530.04 454.22
Trade receivables 18 101.04 118.98
Cash and bank balances 19 32.26 15.94
Short-term loans and advances 20 54.46 44.94
Other current assets 21 16.35 3.77
1,000.41 715.79
TOTAL 2,060.66 1,685.73
As at March 31,
Note 2012 2011
Rs. Crore Rs. Crore

M A R I C O L I M I T E D
121
statement of profit and loss For the year ended March 31,
Note 2012 2011
Rs. Crore Rs. Crore
The notes are an integral part of these fi nancial statements.
As per our attached report of even date.
For Price Waterhouse For and on behalf of the Board of DirectorsChartered Accountants HARSH MARIWALA Chairman and Managing DirectorFirm Registration No. 301112E NIKHIL KHATTAU Director and Chairman of Audit Committee MILIND SARWATE Group Chief Financial Offi cerUDAY SHAH HEMANGI GHAG Company Secretary & Compliance Offi cerPartner Membership No. F-46061Place : Mumbai Place : MumbaiDate : May 3, 2012 Date : May 3, 2012
Revenue from operations (Gross) 22 2,971.66 2,351.39
Less : Excise duty 1.36 0.98
Revenue from operations (Net) 2,970.30 2,350.41
Other income 23 51.65 21.63
Total Revenue 3,021.95 2,372.04
Expenses:
Cost of materials consumed 24 (A) 1,671.92 1,309.01
Purchases of stock-in-trade 24 (B) 106.33 106.85
Changes in inventories of fi nished goods, work-in-progress and
stock-in-trade - (Increase) / decrease 24 (C) (40.02) (74.10)
Employee benefi ts expenses 25 126.21 107.82
Finance costs 26 28.34 31.60
Depreciation, amortisation and impairment 27 31.49 27.63
Other expenses 28 698.40 554.16
Total Expenses 2,622.67 2,062.97
Profit before exceptional and extraordinary items and tax 399.28 309.07
Exceptional items 38 – (65.47)
Profit before tax 399.28 374.54
Tax expense:
Current tax 77.55 70.81
Less: MAT credit (entitlement) / utilisation (22.33) (43.55)
Net current tax 55.22 27.26
Deferred tax charge 7.47 31.96
62.69 59.22
Profit for the year 336.59 315.32
Earnings per equity share (Nominal value per share Re. 1 (Re. 1)) 40
Basic 5.48 5.15
Diluted 5.47 5.12

M A R I C O L I M I T E D
122
cash flow statement
A CASH FLOW FROM OPERATING ACTIVITIES
PROFIT BEFORE TAXATION AND AFTER EXCEPTIONAL ITEMS 399.28 374.54
Adjustments for:
Depreciation, amortisation and impairment 31.49 27.63
Provision for impairment on assets written back as no longer required – (1.03)
Capital advances written off – 1.00
Provision for impairment of Fiancee Trademark – 13.88
Reversal of provision for contingencies (Refer Note 46) – (29.35)
Profi t on divestment of “Sweekar” Brand – (50.00)
Finance costs 28.34 31.60
Interest income (8.11) (5.18)
Loss / (Profi t) on sale of assets - (net) 0.67 (0.08)
(Profi t) / Loss on sale of current investments (net) (0.14) (0.40)
Dividend income (31.81) (6.82)
Employees stock option charge/ (reversal) (0.04) 0.04
Stock appreciation rights expenses 5.30 0.02
Provision for doubtful debts, advances, deposits and others no longer required written back (0.58) (0.55)
25.12 (19.24)
Operating profit before working capital changes 424.40 355.30
Adjustments for:
(Increase)/ decrease in inventories (75.82) (84.32)
(Increase)/ decrease in trade receivables 18.02 (23.93)
(Increase)/ decrease in loans and advances and other current and non-current assets (43.98) 17.06
Increase/ (decrease) in trade payables and other current and non-current liabilities 97.37 (0.38)
and provisions
Changes in Working capital (4.41) (91.57)
Cash generated from Operations 419.99 263.73
Taxes paid (net of refunds) (76.84) (67.50)
NET CASH INFLOW FROM OPERATING ACTIVITIES 343.15 196.23
For the year ended March 31,
2012 2011
Rs. Crore Rs. Crore

M A R I C O L I M I T E D
123
cash flow statement
B CASH FLOW FROM INVESTING ACTIVITIES
Purchase of fi xed assets (61.44) (69.88)
Sale of fi xed assets 0.14 0.68
Proceeds from divestment of “Sweekar” Brand – 50.00
Purchase of investments (278.88) (75.34)
Sale of investments 77.20 69.49
Investment in Subsidiary – (254.98)
Inter-corporate deposits placed (10.00) –
Deposit in escrow account for acquisition (Refer note 36) (25.00) –
Loans and advances repaid by related parties 66.44 149.19
Loans and advances given to related parties (65.40) (197.84)
Dividend income received 31.81 6.82
Interest received 7.89 4.26
NET CASH OUTFLOW FROM INVESTING ACTIVITIES (257.24) (317.60)
C CASH FLOW FROM FINANCING ACTIVITIES
Proceeds from issuance of Share Capital on exercise of stock option 3.09 28.59
Issue / (redemption) of commercial papers (net) (92.99) 58.90
Issue of debentures / (redemption) (30.00) 50.00
Other borrowings (repaid) / taken (net) 103.84 68.83
Finance costs paid (30.30) (31.22)
Equity dividend paid (inclusive of dividend distribution tax) (47.28) (47.07)
NET CASH INFLOW/ (OUTFLOW) FROM FINANCING ACTIVITIES (93.64) 128.03
D NET INCREASE / (DECREASE) IN CASH & CASH EQUIVALENTS (A+B+C) (7.73) 6.66
E Cash and cash equivalents - opening balance (as at April 1) (Refer note 19) 13.69 7.03
F Cash and cash equivalents - closing balance (as at March 31) (Refer note 19) 5.96 13.69
Notes
1 The above Cash Flow statement has been prepared under the indirect method as set out in Accounting Standard 3 (AS 3)
‘Cash Flow Statements’ as specifi ed in Companies (Accounting Standards) Rules , 2006.
2 The fi gures for the previous year have been regrouped where necessary to conform to current year’s classifi cation.
For the year ended March 31,
2012 2011
Rs. Crore Rs. Crore
As per our attached report of even date.
For Price Waterhouse For and on behalf of the Board of DirectorsChartered Accountants HARSH MARIWALA Chairman and Managing DirectorFirm Registration No. 301112E NIKHIL KHATTAU Director and Chairman of Audit Committee MILIND SARWATE Group Chief Financial Offi cerUDAY SHAH HEMANGI GHAG Company Secretary & Compliance Offi cerPartner Membership No. F-46061Place : Mumbai Place : MumbaiDate : May 3, 2012 Date : May 3, 2012

M A R I C O L I M I T E D
124
notes to financial statements for the year ended march 31, 2012NOTES TO THE FINANCIAL STATEMENTS
1. The Company and nature of its operations:
Marico Limited (‘Marico’ or ‘the Company’), headquartered in Mumbai, Maharashtra, India, carries on business in branded
consumer products. Marico manufactures and markets products under brands such as Parachute, Nihar, Saffola, Hair &
Care, Revive, Shanti, Oil of Malabar, Mediker and Manjal. Marico’s products reach its consumers through retail outlets
serviced by Marico’s distribution network comprising regional offi ces, carrying & forwarding agents, redistribution centers
and distributors spread all over India.
2. Summary of significant accounting policies:
(a) Basis of preparation of fi nancial statements
The fi nancial statements are prepared in accordance with the Generally Accepted Accounting Principles (“GAAP”)
in India under the historical cost convention on an accrual basis, except for certain fi nancial instruments which are
measured at fair values and are in conformity with mandatory accounting standards, as prescribed by the Companies
(Accounting Standards) Rules, 2006, the provisions of the Companies Act, 1956 and guidelines issued by the Securities
and Exchange Board of India (SEBI).
All assets and liabilities have been classifi ed as current or non-current as per the Company’s normal operating cycle
and other criteria set out in the Schedule VI to the Companies Act, 1956.
(b) Use of estimates
The preparation of the fi nancial statements in conformity with GAAP requires the management to make estimates and
assumptions that affect the reported balances of assets and liabilities and disclosures relating to contingent assets
and liabilities as at the date of the fi nancial statements and reported amounts of income and expenses during the
period. Examples of such estimates include provisions for doubtful debts, future obligations under employee retirement
benefi t plans, income taxes, the useful lives and provision for impairment of fi xed assets and intangible assets.
Management believes that the estimates used in the preparation of fi nancial statements are prudent and reasonable.
Future results could differ from these estimates.
(c) Tangible assets, intangible assets and capital work-in-progress
Tangible assets and intangible assets are stated at cost of acquisition, less accumulated depreciation/amortisation
and impairments, if any. Cost includes taxes, duties, freight and other incidental expenses related to acquisition and
installation. Borrowing costs attributable to acquisition, construction of qualifying asset are capitalised until such time
as the assets are substantially ready for their intended use. Other pre-operative expenses for major projects are also
capitalised, where appropriate.
Capital work-in-progress comprises cost of fi xed assets that are not yet ready for their intended use at the year end.
(d) Depreciation and amortisation
I. Tangible assets
(i) Depreciation is provided at higher of the rates based on useful lives of the assets as estimated by the
management or those stipulated in Schedule XIV to the Companies Act, 1956. The depreciation rates considered
for the following items are higher than the rates stipulated in Schedule XIV to the Companies Act, 1956:
Asset Rates (p.a.)
Computer hardware and related peripherals 33.33%
Moulds 16.21%
Offi ce equipment 10% to 50%
Furniture and fi xtures 12.50%
Vehicles 20%

M A R I C O L I M I T E D
125
notes to financial statements for the year ended march 31, 2012 (ii) Depreciation on factory building and plant and equipment (other than items specifi ed in (i) above) is provided
on written down value basis. Depreciation on all other assets is provided on straight line basis.
(iii) Extra shift depreciation is provided on “Plant” basis.
(iv) Assets individually costing Rs. 5,000 or less are depreciated fully in the year of acquisition.
(v) Leasehold land is amortised over the primary period of the lease.
(vi) Fixtures in leasehold premises are amortised over the primary period of the lease.
(vii) Depreciation on additions / deletions during the year is provided from the month in which the asset is
capitalised / up to the month in which the asset is disposed off.
II. Intangible assets
Intangible assets are amortised on a straight line basis at the rates based on estimated useful lives of respective
assets, but not exceeding the rates given here under:
Asset Rates (p.a.)
Trademarks, copyrights and business and commercial rights 10%
Computer software 33.33%
A rebuttable presumption that the useful life of an intangible asset will not exceed ten years from the date when
the asset is available for use is considered by the management.
(e) Assets taken on lease
(i) The assets taken on fi nance lease are capitalised at the inception of the lease at the lower of the fair value of
the leased asset and present value of the minimum lease payments.The corresponding amount is shown as
lease liabilities. The principal component in the lease rental is adjusted against the lease liability and the interest
component is charged to the Statement of Profi t and Loss.
(ii) Operating lease payments are recognised as expenditure in the Statement of Profi t and Loss as per the terms
of the respective lease agreement.
(f) Asset given on lease
In respect of Plant and equipment given on operating lease basis, lease rentals are accounted on accrual basis in
accordance with the respective lease agreements.
(g) Investments
(i) Long term investments are valued at cost. Provision for diminution, if any, in the value of investments is made to
recognise a decline in value, other than temporary.
(ii) Current investments are valued at lower of cost and fair value, computed individually for each investment. In case
of investments in mutual funds which are unquoted, net asset value is taken as fair value.
(h) Inventories
(i) Raw materials, packing materials, stores and spares are valued at lower of cost and net realizable value. However,
these items are considered to be realizable at cost if the fi nished products in which they will be used are expected
to be sold at or above cost.
(ii) Work-in-process, fi nished goods and stock-in-trade (traded goods)are valued at lower of cost and net realizable
value.
(iii) By-products and unserviceable / damaged fi nished goods are valued at estimated net realizable value.

M A R I C O L I M I T E D
126
(iv) Cost is ascertained on weighted average method and in case of work-in-process includes appropriate production
overheads and in case of fi nished goods includes appropriate production overheads and excise duty, wherever
applicable.
(i) Research and Development
Capital expenditure on research and development is capitalised and depreciated as per the accounting policy mentioned
in para 2(c) and 2(d) above. Revenue expenditure is charged off in the year in which it is incurred.
(j) Revenue recognition
(i) Domestic sales are recognised at the point of dispatch of goods to the customers, which is when substantial
risks and rewards of ownership passed to the customers, and are stated net of trade discounts, rebates, sales
tax, value added tax and excise duty.
(ii) Export sales are recognised based on the date of bill of lading except, sales to Nepal which are recognised
when the goods cross the Indian territory, which is when substantial risks and rewards of ownership passed to
the customers.
(iii) Revenue from services is recognised on rendering of services.
(iv) Interest and other income are recognised on accrual basis.
(v) Income from export incentives such as premium on sale of import licences, duty drawback etc. are recognised
on accrual basis to the extent the ultimate realisation is reasonably certain.
(vi) Dividend income is recongnised when right to receive dividend is established.
(vii) Revenue from royalty income is recognised on accrual basis.
(k) Retirement and other benefi ts to employees
(i) Gratuity
Liabilities with regard to the gratuity benefi ts payable in future are determined by actuarial valuation at each Balance
Sheet date using the Projected Unit Credit method and contributed to Employees Gratuity Fund managed by
HDFC Standard Life Insurance Limited. Actuarial gains and losses arising from changes in actuarial assumptions
are recognised in the Statement of Profi t and Loss in the period in which they arise.
(ii) Superannuation
The Company makes contribution to the Superannuation Scheme, a defi ned contribution scheme, administered
by ICICI Prudential Life Insurance Company Limited. The Company has no obligation to the scheme beyond its
monthly contributions.
(iii) Leave encashment / Compensated absences
The Company provides for the encashment of leave with pay subject to certain rules. The employees are entitled
to accumulate leave subject to certain limits, for future encashment / availment. The liability is provided based
on the number of days of unutilized leave at each balance sheet date on the basis of an independent actuarial
valuation.
(iv) Provident fund
Provident fund contributions are made to a trust administered by the Company. The Company’s liability is
actuarially determined (using the Projected Unit Credit method) at the end of the year and any shortfall in the
fund size maintained by the Trust set up by the Company is additionally provided for. Actuarial losses and gains
are recognised in the Statement of Profi t and Loss in the year in which they arise.
notes to financial statements for the year ended march 31, 2012

M A R I C O L I M I T E D
127
notes to financial statements for the year ended march 31, 2012 (l) Foreign currency transactions
(i) Transactions in foreign currencies are recognised at the prevailing exchange rates on the transaction dates.
Realized gains and losses on settlement of foreign currency transactions are recognised in the Statement of
Profi t and Loss.
(ii) Foreign currency monetary assets and liabilities at the year end are translated at the year end exchange rates and
the resultant exchange differences except those qualifying for hedge accounting are recognised in the Statement
of Profi t and Loss.
(iii) In case of forward contracts with underlying assets or liabilities, the difference between the forward rate and
the exchange rate on the date of inception of a forward contract is recognised as income or expense and is
amortised over the life of the contract. Exchange differences on such contracts are recognised in the Statement
of Profi t and Loss in the year in which they arise. Any profi t or loss arising on cancellation or renewal of forward
exchange contracts are recognised as income or expense for the period.
(iv) The Company uses forward and options contracts to hedge its risks associated with foreign currency transactions
relating to certain fi rm commitments and forecasted transactions. The Company also uses Interest rates swap
contracts to hedge its interest rate risk exposure. The Company designates these as cash fl ow hedges. These
contracts are marked to market as at the year end and resultant exchange differences, to the extent they represent
effective portion of the hedge, are recognised directly in ‘Hedge Reserve’. The ineffective portion of the same is
recognised immediately in the Statement of Profi t and Loss.
(v) Exchange differences taken to Hedge Reserve account are recognised in the Statement of Profi t and Loss upon
crystallization of fi rm commitments or occurrence of forecasted transactions or upon discontinuation of hedge
accounting resulting from expiry / sale / termination of hedge instrument or upon hedge becoming ineffective.
(vi) Non-monetary foreign currency items are carried at cost / fair value and accordingly the investments in shares
of foreign subsidiaries are expressed in Indian currency at the rate of exchange prevailing at the time when the
original investments are made or fair values determined.
(vii) Exchange differences arising on monetary items that in substance form part of Company’s net investment in a
non-integral foreign operation are accumulated in a ‘Foreign Currency Translation Reserve’ until the disposal of the
net investment. The same is recognised in the Statement of Profi t and Loss upon disposal of the net investment.
(m) Accounting for taxes on income
(i) Provision for current tax is made, based on the tax payable under the Income Tax Act, 1961. Minimum Alternative
Tax (MAT) credit, which is equal to the excess of MAT (calculated in accordance with provisions of Section 115JB
of the Income tax Act, 1961) over normal income-tax is recognised as an asset by crediting the Statement of
Profi t and Loss only when and to the extent there is convincing evidence that the Company will be able to avail
the said credit against normal tax payable during the period of ten succeeding assessment years.
(ii) Deferred tax on timing differences between taxable income and accounting income is accounted for, using the
tax rates and the tax laws enacted or substantively enacted as on the balance sheet date. Deferred tax assets
on unabsorbed tax losses and unabsorbed tax depreciation are recognised only when there is a virtual certainty
of their realisation. Other deferred tax assets are recognised only when there is a reasonable certainty of their
realisation.

M A R I C O L I M I T E D
128
(n) Impairment
The Company reviews the carrying values of tangible and intangible assets for any possible impairment at each
balance sheet date. An impairment loss is recognised when the carrying amount of an asset exceeds its recoverable
amount. The recoverable amount is the greater of net selling price and value in use. In assessing the value in use,
the estimated future cash fl ows are discounted to their present value at appropriate discount rates. If at the balance
sheet date there is an indication that a previously assessed impairment loss no longer exists, the recoverable amount
is reassessed and the asset is refl ected at the recoverable amount.
(o) Employee Stock Option Plan
In respect of stock options granted pursuant to the Company’s Employee Stock Option Scheme, the intrinsic value of
the options (excess of market value of shares over the exercise price of the option at the date of grant) is recognised
as Employee compensation cost over the vesting period.
(p) Employee Stock Appreciation Rights Scheme
In respect of Employee Stock Appreciation Rights granted pursuant to the Company’s Employee Stock Appreciation
Rights Plan, 2011, the intrinsic value of the rights (excess of market value as at the year end and the Grant Price) is
recognised as Employee compensation cost over the vesting period.
(q) Provisions and Contingent Liabilities
Contingent Liabilities are disclosed in respect of possible obligations that arise from past events but their existence
will be confi rmed by the occurrence or non occurrence of one or more uncertain future events not wholly within the
control of the Company or where any present obligation cannot be measured in terms of future outfl ow of resources
or where a reliable estimate of the obligation cannot be made.
A provision is made based on a reliable estimate when it is probable that an outfl ow of resources embodying economic
benefi ts will be required to settle an obligation and in respect of which a reliable estimate can be made. Provision
is not discounted and is determined based on best estimate required to settle the obligation at the year end date.
Contingent Assets are not recognised or disclosed in the fi nancial statements.
(r) Share issue Expenses
Expenses incurred on issues of shares are adjusted against Securities Premium Reserve.
(s) Cash and Cash Equivalents
In the cash fl ow statement, cash and cash equivalents includes cash in hand, demand deposits with banks, other
short-term highly liquid investments with original maturities of three months or less.
(t) Earnings Per Share
Basic earnings per share is calculated by dividing the net profi t or loss for the period attributable to equity shareholders
by the weighted average number of equity shares outstanding during the period. Earnings considered in ascertaining the
Company’s earnings per share is the net profi t for the period after deducting preference dividends and any attributable
tax thereto for the period. The weighted average number of equity shares outstanding during the period and for all
periods presented is adjusted for events, such as bonus shares, other than the conversion of potential equity shares,
that have changed the number of equity shares outstanding, without a corresponding change in resources. For the
purpose of calculating diluted earnings per share, the net profi t or loss for the period attributable to equity shareholders
and the weighted average number of shares outstanding during the period is adjusted for the effects of all dilutive
potential equity shares.
notes to financial statements for the year ended march 31, 2012
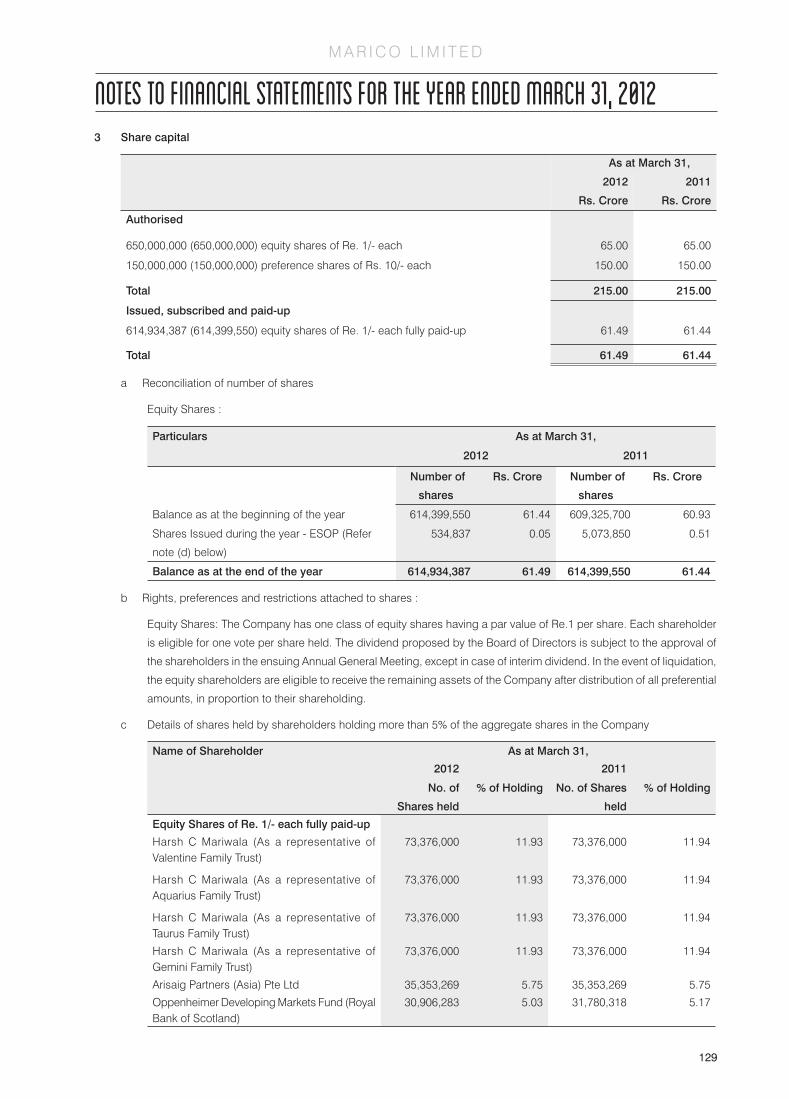
M A R I C O L I M I T E D
129
notes to financial statements for the year ended march 31, 20123 Share capital
As at March 31,
2012 2011
Rs. Crore Rs. Crore
Authorised
650,000,000 (650,000,000) equity shares of Re. 1/- each 65.00 65.00
150,000,000 (150,000,000) preference shares of Rs. 10/- each 150.00 150.00
Total 215.00 215.00
Issued, subscribed and paid-up
614,934,387 (614,399,550) equity shares of Re. 1/- each fully paid-up 61.49 61.44
Total 61.49 61.44
a Reconciliation of number of shares
Equity Shares :
Particulars As at March 31,
2012 2011
Number of
shares
Rs. Crore Number of
shares
Rs. Crore
Balance as at the beginning of the year 614,399,550 61.44 609,325,700 60.93
Shares Issued during the year - ESOP (Refer
note (d) below)
534,837 0.05 5,073,850 0.51
Balance as at the end of the year 614,934,387 61.49 614,399,550 61.44
b Rights, preferences and restrictions attached to shares :
Equity Shares: The Company has one class of equity shares having a par value of Re.1 per share. Each shareholder
is eligible for one vote per share held. The dividend proposed by the Board of Directors is subject to the approval of
the shareholders in the ensuing Annual General Meeting, except in case of interim dividend. In the event of liquidation,
the equity shareholders are eligible to receive the remaining assets of the Company after distribution of all preferential
amounts, in proportion to their shareholding.
c Details of shares held by shareholders holding more than 5% of the aggregate shares in the Company
Name of Shareholder As at March 31,
2012 2011
No. of
Shares held
% of Holding No. of Shares
held
% of Holding
Equity Shares of Re. 1/- each fully paid-up
Harsh C Mariwala (As a representative of Valentine Family Trust)
73,376,000 11.93 73,376,000 11.94
Harsh C Mariwala (As a representative of Aquarius Family Trust)
73,376,000 11.93 73,376,000 11.94
Harsh C Mariwala (As a representative of Taurus Family Trust)
73,376,000 11.93 73,376,000 11.94
Harsh C Mariwala (As a representative of Gemini Family Trust)
73,376,000 11.93 73,376,000 11.94
Arisaig Partners (Asia) Pte Ltd 35,353,269 5.75 35,353,269 5.75
Oppenheimer Developing Markets Fund (Royal Bank of Scotland)
30,906,283 5.03 31,780,318 5.17

M A R I C O L I M I T E D
130
d Shares reserved for issue under options :
The Corporate Governance Committee of the Board of Directors of Marico Limited has granted Stock Options to
certain eligible employees pursuant to the Marico ‘Employees Stock Options Scheme 2007’ (“Scheme”). Each option
represents 1 equity share in the Company. The Vesting period and the Exercise Period both range from 1 year to 5
years.
The Scheme is administered by a Corporate Governance Committee comprising of independent Directors. The
weighted average share price of options excerised during the year was Rs. 56.98 (Rs. 55.57).The Scheme lapses on
February 1, 2013. The options outstanding as on the Balance Sheet date correspond to about 0.13% (0.39%) of the
current paid-up equity share capital of the Company.
As at March 31,
2012 2011
Number of options granted, exercised, and forfeited
Balance as at beginning of the year 2,388,050 7,816,800
Granted during the year – –
Less : Exercised during the year 534,837 5,073,850
Forfeited / lapsed during the year 1,074,900 354,900
Balance as at end of the year 778,313 2,388,050
The Company has applied the intrinsic value based method of accounting for determining compensation cost for its
stock based compensation plan and has accordingly accounted Rs. (0.04) Crore (Rs. 0.04 Crore) as compensation
cost under the ‘intrinsic value’ method (Refer note 25). Had the Company considered ‘fair value’ method for accounting
of compensation cost, the Company’s net income and Basic and Diluted earnings per share as reported would have
reduced to the pro-forma amounts as indicated:
Particulars As at March 31,
2012 2011
Net Profi t after tax as reported (Rs. Crore) 336.59 315.32
Less : Stock-based employee compensation expense (Rs. Crore) 0.32 1.76
Adjusted pro-forma (Rs. Crore) 336.27 313.56
Basic earnings per share as reported Rs. 5.48 Rs. 5.15
Pro-forma basic earnings per share Rs. 5.47 Rs. 5.12
Diluted earnings per share as reported Rs. 5.47 Rs. 5.12
Pro-forma diluted earnings per share Rs. 5.47 Rs. 5.10
The following assumptions were used for calculation of fair value of grants:
As at March 31,
2012 2011
Risk-free interest rate - Vest 1 (%) 6.61% 6.61%
Risk-free interest rate - Vest 2 (%) 7.27% 7.27%
Expected life of options (years) 5 years 5 years
Expected volatility - Vest 1 (%) 35.32% 35.32%
Expected volatility - Vest 2 (%) 36.92% 36.92%
Dividend yield 1.20% 1.20%
notes to financial statements for the year ended march 31, 2012

M A R I C O L I M I T E D
131
notes to financial statements for the year ended march 31, 20124 Reserves and surplus
As at March 31,
2012 2011
Rs. Crore Rs. Crore
Securities Premium Reserve
Balance as at the beginning of the year 43.50 15.30
Add : Receipt on exercise of Employees stock options 3.03 28.08
Add : Transferred from Employee Stock Options outstanding 0.01 0.12
Balance as at the end of the year 46.54 43.50
Debenture Redemption Reserve
Balance as at the beginning of the year 31.67 15.00
Add : Amount transferred from Surplus in the Statement of Profi t and Loss 20.00 16.67
Less: Amount transferred to General Reserve on redemption (30.00) –
Balance as at the end of the year 21.67 31.67
Employee Stock Options Outstanding Account (Refer note 3 (d))
Balance as at the beginning of the year 0.07 0.15
Add : Compensation for options granted during the year – 0.08
Less : Transferred to Securities Premium Reserve on exercise of stock options 0.01 0.12
Less : Forefeited / lapsed 0.04 0.04
Balance as at the end of the year 0.02 0.07
General Reserve
Balance as at the beginning of the year 123.19 91.66
Add : Amount transferred from Surplus in the Statement of Profi t and Loss 33.66 31.53
Add : Amount transferred from Debenture Redemption Reserve on redemption 30.00 –
Balance as at the end of the year 186.85 123.19
Hedge Reserve (Refer note 39 (c))
Balance as at the beginning of the year 4.99 2.81
Adjustments during the year (38.91) 2.18
Balance as at the end of the year (33.92) 4.99
Foreign Currency Translation Reserve (Refer note below)
Balance as at the beginning of the year 5.74 3.23
Exchange gain/(loss) on translation during the year 0.30 2.51
Balance as at the end of the year 6.04 5.74
Surplus in the Statement of Profit and Loss
Balance as at the beginning of the year 602.52 382.58
Add : Profi t during the year 336.59 315.32
Less: Appropriations :
Interim dividend 43.04 40.54
Dividend distribution tax on Interim dividend 6.98 6.64
Transfer to Debenture Redemption Reserve 20.00 16.67
Transfer to General Reserve 33.66 31.53
Balance as at the end of the year 835.43 602.52
Total 1,062.63 811.68
The Company has advanced long term loans to its wholly owned subsidiary, Marico South Africa Consumer Care (pty)
Limited, which is outstanding as at the year end. The operations of the said subsidiary are classifi ed as ‘Non – integral foreign
operations’. Accordingly, as per the requirements of Accounting Standard 11 ‘The effect of changes in Foreign Exchange
Rates’, exchange gain of Rs. 6.04 Crore (Rs. 5.74 Crore) arising on revaluation of the said loan is accumulated in ‘Foreign
Currency Translation Reserve’, to be recognised as income or expenses in the Statement of Profi t and Loss upon disposal
of the net investment in said subsidiary.

M A R I C O L I M I T E D
132
5 Long-term borrowings
As at March 31,
2012 2011
Rs. Crore Rs. Crore
Secured
Term loans
From banks
External commercial borrowings from Standard Chartered Bank
(Loan carries interest @ LIBOR plus 1.3%. Original loan amount of USD 15
million was payable in 12 equal quarterly installments of USD 1.25 million along
with interest commencing from February 26, 2010. Loan amount outstanding
of USD 3.75 millions as at March 31 2012 has been shown under Other current
liabilities as Current maturities of long term debt (Refer note 9). The loan is
secured by hypothecation of plant and machinery).
– 16.72
External commercial borrowing from HSBC bank
(Loan carries interest @ LIBOR plus 2.1% and is secured by (i) Pledge of shares
of International Consumer Products Corporation (a Subsidiary company)
(ii) First ranking pari passu charge over all current and future plant and
machinery and (iii) Mortgage on land and building situated at Andheri,
Mumbai).
The loan is repayable over a period of 6 years commencing from 28th February
2011 as under:-
1st installment - USD 3 million - payable at the end of 36 months
2nd installment - USD 3 million - payable at the end of 42 months
3rd installment - USD 6 million - payable at the end of 48 months
4th installment - USD 6 million - payable at the end of 54 months
5th installment - USD 9 million - payable at the end of 60 months
6th installment - USD 12 million - payable at the end of 66 months
7th installment - USD 15 million - payable at the end of 72 months
274.73 240.76
Total Amount - USD 54 million
274.73 257.48
Unsecured
Debentures (Refer note below )
500, 10.05%, Rated Taxable Unsecured Redeemable Non-convertible
debentures of face value of Rs. 10,00,000/- each
50.00 50.00
50.00 50.00
Total 324.73 307.48
The above debentures were issued on March 30, 2011 and are reedeemable at par after 30 months from the date of issue
i.e. by September 30, 2013. Interest on these debentures is payable at an interval of 12 months. The debentures are listed
on National Stock Exchange.
notes to financial statements for the year ended march 31, 2012

M A R I C O L I M I T E D
133
notes to financial statements for the year ended march 31, 20126 Long-term provisions
As at March 31,
2012 2011
Rs. Crore Rs. Crore
Provision for employee benefits :
Employee Stock Appreciation Rights Scheme 5.32 0.02
Total 5.32 0.02
a The Corporate Governance Committee has granted Stock Appreciation Rights (“STAR”) to certain eligible employees
pursuant to the Company’s Employee Stock Appreciation Rights Plan, 2011 (“Plan”). The grant price is determined
based on a formula as defi ned in the Plan. There are two schemes under the Plan with different vesting period. Under
the Plan, the respective employees are entitled to receive excess of the maturity price over the grant price subject to
fulfi lment of certain conditions. The difference between the market price of Company’s shares as at the year end and
the grant price is recognised over the vesting period and accordingly an amount of Rs. 5.30 Crore (Rs. 0.02 Crore) is
charged in the Statement of Profi t and Loss. The Plan is administered by Corporate Governance Committee comprising
of independent directors.
b The Company has formed “Welfare of Mariconians Trust” (The trust) for the implementation and admistration of
Schemes that are notifi ed or may be notifi ed from time to time by the Company under the Plan as at March 31, 2012.
The Company has advanced Rs. 19.92 Crore (Nil) to the Trust for purchase of shares under the Plan, which are included
under “Long term loans and advances” (refer note 14).
c Details of STAR Grant Schemes :
STAR Scheme I
As at March 31,
2012 2011
Grant Date March 28, 2011 March 28, 2011
Grant Price (Rs.) 129.33 129.33
Vesting Date September 30, 2013 September 30, 2013
Grants outstanding at the beginning of the year 2,838,600 –
Add : Granted during the year – 2,838,600
Less : Forfeited during the year 177,500 –
Grants at the end of the year 2,661,100 2,838,600
STAR Scheme II
As at March 31,
2012 2011
Grant Date December 1, 2011 –
Grant Price (Rs.) 148.53 –
Vesting Date November 30, 2014 –
Grants outstanding at the beginning of the year – –
Add : Granted during the year 956,000 –
Less : Forfeited during the year 6,100 –
Grants at the end of the year 949,900 –

M A R I C O L I M I T E D
134
7 Short-term borrowings
As at March 31,
2012 2011
Rs. Crore Rs. Crore
Secured
From banks :
Cash credit 0.18 9.28
Pre-shipment credit in foreign currency
(Secured by hypothecation of inventory and debtors)
35.62 13.37
35.80 22.65
Unsecured
From banks :
Buyers’ credit 111.22 14.75
Pre-shipment credit in foreign currency 30.52 42.32
Other term loans 50.88 20.00
192.62 77.07
From others :
Commercial papers – 95.00
Less: Deferred interest – 2.01
– 92.99
192.62 170.06
Total 228.42 192.71
a Buyers credit arrangements are loans taken in foreign currency for a term of twelve months and carry interest rate of
LIBOR plus applicable spread ranging from 0.05% to 1.5% per annum.
b Pre-shipment credit in foreign currency arrangements are for a term of six months and carry interest rate of LIBOR
plus applicable spread ranging from 1.30% to 2% per annum.
c Other term loans availed in the current year are in foreign currency for a term of 12 months and carries interest rate
of 3 months LIBOR + spread of 2.3% per annum. (previous year amount borrowed in Indian Rupees carried interest
rate of 8% per annum).
d Commercial papers were borrowed for a term of 12 months and carried interest rate ranging from 7% to 10% per
annum.
8 Trade payables
As at March 31,
2012 2011
Rs. Crore Rs. Crore
Trade payables 244.47 162.73
Total 244.47 162.73
The Company has certain dues to suppliers registered under Micro, Small and Medium Enterprises Development Act, 2006
(‘MSMED Act’). The disclosures pursuant to the said MSMED Act are as follows:
notes to financial statements for the year ended march 31, 2012

M A R I C O L I M I T E D
135
As at March 31,
2012 2011
Rs. Crore Rs. Crore
Principal amount due to suppliers registered under the MSMED Act and
remaining unpaid as at year end.
13.95 1.53
Interest due to suppliers registered under the MSMED Act and remaining
unpaid as at year end.
0.09 0.01
Principal amounts paid to suppliers registered under the MSMED Act, beyond
the appointed day during the year.
– –
Interest paid other than under Section 16 of MSMED Act to suppliers registered – –
Interest paid under Section 16 of MSMED Act to suppliers registered under
the MSMED Act beyond the appointed day during the year.
– –
Interest due and payable towards suppliers registered under MSMED Act for
payments already made
– –
Further interest remaining due and payable for earlier years. 0.01 –
9 Other current liabilities
As at March 31,
2012 2011
Rs. Crore Rs. Crore
Current maturities of long-term debt :
External commercial borrowings from Standard Chartered Bank
(Refer note 5)
19.08 22.29
Secured Redeemable Non-Convertible Debentures (Refer note (a) below) – 30.00
19.08 52.29
Interest accrued but not due on borrowings 1.20 3.15
Interest accrued and due on borrowings – 0.01
Unpaid dividends (Refer note (b) below) 0.16 0.23
Unclaimed Redeemed 8% Preference Share Capital – 0.03
Other payables :
Provision for contractual liabilities 15.49 12.55
Advances from customers 13.94 5.81
Statutory dues including provident fund and tax deducted at source 10.19 9.68
Forward / derivative contracts payables – 2.58
Creditors for capital goods 2.43 1.38
Security deposits from customers and others 0.31 0.25
Employee benefi ts payable 22.69 20.76
Others 0.23 0.25
Total 85.72 108.97
a The Company had issued 300 8.25% Rated Taxable Secured Redeemable Non - Convertible Debentures of Face
Value Rs. 10 lakhs each on May 8, 2009 which were secured against fi rst pari passu charge over Land and Building
situated in Andheri (East) Mumbai, aggregating to Rs. 30 Crore and same were redeemable at par after 3 years. As
per the terms of the issue Put / Call option was available with the Investors / Company at the end of 2 years. Investors
exercised the option and debentures were repaid during the year. These debentures were listed on the National Stock
Exchange.
notes to financial statements for the year ended march 31, 2012

M A R I C O L I M I T E D
136
b The following amounts are payable towards the Investors Education and Protection Fund account :
As at March 31,
2012 2011
Rs. Crore Rs. Crore
Third interim dividend of year 2003-04 – 0.01
Preference Shares redemption – 0.02
10 Short-term provisions
As at March 31,
2012 2011
Rs. Crore Rs. Crore
Provision for employee benefi ts :
Gratuity (Refer note 44 (A)) 0.17 0.18
Leave encashment (Refer note 44(B)) 6.20 5.57
6.37 5.75
Others :
Income tax - (net ) (refer note (a) below) 1.14 0.43
Interim dividend 24.60 22.11
Dividend distribution tax on Interim dividend 3.99 3.67
Disputed taxes / claims (Refer notes (b) and (c) below) 11.78 8.74
Total 47.88 40.70
a Provison for income tax is net off advance tax and other tax payments for various years of Rs. 310.01 Crore
(Rs. 233.17 Crore)
b Provision for disputed taxes (other than Income tax) / claims represents claims against the Company not acknowledged
as debts, where management has assessed that unfavourable outcome of the matter is more than probable.
c Movement in provision for disputed taxes / claims
As at March 31,
2012 2011
Rs. Crore Rs. Crore
Balance as at the beginning of the year 8.74 7.41
Add: Additions during the year 4.27 1.48
Less: Unused amounts reversed during the year 1.23 0.15
Balance as at the end of the year 11.78 8.74
notes to financial statements for the year ended march 31, 2012

M A R I C O L I M I T E D
137
notes to financial statements for the year ended march 31, 201211
(A
) Ta
ngib
le a
sset
s
PAR
TIC
ULA
RS
G R
O S
S B
L O
C K
D E
P R
E C
I A
T I
O N
/ A
M O
R T
I S
A T
I O
N /
I M P
A I
R M
E N
TN
E T
B L
O C
KAs
at
April
1,
201
1
Addi
tions
Dedu
ctio
ns /
Adju
stm
ents
As a
t M
arch
31
, 201
2
As a
t Ap
ril 1
,20
11
For t
he
Year
Dedu
ctio
ns /
Adju
stm
ents
As a
t M
arch
31
, 201
2
Prov
isio
n fo
r im
pairm
ent
as a
t Ap
ril 1
, 201
1
Char
ge /
(Rev
ersa
l) fo
r the
yea
r
Prov
isio
n fo
r im
pairm
ent
as a
t M
arch
31,
20
12
As a
t M
arch
31
, 201
2
As a
t M
arch
31
, 201
1
Tang
ible
ass
ets
Free
hold
land
2.49
––
2.49
––
––
––
–2.
492.
49Le
aseh
old
land
22.3
26.
57–
28.8
90.
910.
41–
1.32
––
27.5
721
.41
Bui
ldin
gs (N
ote
a)10
5.73
6.66
0.01
112.
3818
.61
4.61
0.01
23.2
1–
––
89.1
787
.12
Plan
t and
equ
ipm
ents
(Not
es b
and
c)
237.
2832
.55
4.04
265.
7912
8.16
22.3
53.
2414
7.27
4.60
1.06
5.66
112.
8610
4.52
Furn
iture
and
fi xt
ures
7.52
0.44
0.06
7.90
3.81
0.85
0.05
4.61
––
–3.
293.
71Ve
hicl
es1.
200.
040.
011.
230.
440.
230.
010.
66–
––
0.57
0.76
Offi
ce e
quip
men
ts3.
381.
860.
125.
122.
220.
880.
122.
980.
01–
0.01
2.13
1.15
Tota
l (A
)37
9.92
48.1
24.
2442
3.80
154.
1529
.33
3.43
180.
054.
611.
065.
6723
8.08
221.
16P
revi
ous
Year
254.
0913
3.82
7.99
379.
9213
6.75
24.1
76.
7715
4.15
5.02
(0.4
1)4.
6122
1.16
–
11 (
B)
Inta
ngib
le a
sset
s PA
RTI
CU
LAR
SG
R O
S S
B L
O C
KD
E P
R E
C I
A T
I O
N /
A M
O R
T I
S A
T I
O N
/ I M
P A
I R
M E
N T
N E
T B
L O
C K
As a
t Ap
ril
1, 2
011
Addi
tions
Dedu
ctio
ns /
Adju
stm
ents
As a
t M
arch
31
, 201
2
As a
t Ap
ril
1, 2
011
For t
he
Year
Dedu
ctio
ns /
Adju
stm
ents
As a
t M
arch
31
, 201
2
Prov
isio
n fo
r im
pairm
ent
as a
t Ap
ril 1
, 201
1
Char
ge /
(Rev
ersa
l) fo
r the
yea
r
Prov
isio
n fo
r im
pairm
ent
as a
t M
arch
31,
20
12
As a
t M
arch
31
, 201
2
As a
t M
arch
31
, 201
1
Inta
ngib
le a
sset
s
Trad
emar
ks a
nd c
opyr
ight
s (N
ote
d)25
.20
––
25.2
010
.32
––
10.3
214
.88
–14
.88
––
Com
pute
r sof
twar
e16
.08
1.81
0.08
17.8
114
.78
1.10
0.08
15.8
0–
––
2.01
1.30
Tota
l (B
)41
.28
1.81
0.08
43.0
125
.10
1.10
0.08
26.1
214
.88
–14
.88
2.01
1.30
Pre
viou
s Ye
ar40
.36
0.95
0.03
41.2
821
.69
3.44
0.03
25.1
01.
0013
.88
14.8
81.
30–
Tota
l (A
)+(B
)42
1.20
49.9
34.
3246
6.81
179.
2530
.43
3.51
206.
1719
.49
1.06
20.5
524
0.09
222.
46To
tal P
revi
ous
Year
(Not
e e)
294.
4513
4.77
8.02
421.
2015
8.44
27.6
16.
8017
9.25
6.02
13.4
719
.49
222.
46–
a.
Gro
ss b
lock
of B
uild
ings
incl
ude
Rs.
Nil
(Rs.
0.1
0 C
rore
) whe
re c
onve
yanc
e ha
s be
en e
xecu
ted,
pen
ding
regi
stra
tion.
b.
The
borr
owin
g co
sts
capi
talis
ed to
Pla
nt a
nd e
quip
men
t Rs.
Nil
(Rs.
0.4
2 C
rore
).c.
A
dditi
on to
Pla
nt a
nd e
quip
men
t are
net
of C
entra
l Cap
ital I
nves
tmen
t Sub
sidy
of R
s. 0
.30
Cro
re (R
s. N
il) re
ceiv
ed fr
om th
e G
over
nmen
t of H
imac
hal P
rade
sh in
resp
ect o
f Poa
nta
plan
t.d.
D
urin
g th
e ye
ar e
nded
Mar
ch 3
1, 2
007,
the
Com
pany
car
ried
out fi
nan
cial
res
truct
urin
g sc
hem
e (‘S
chem
e’)
unde
r th
e re
leva
nt p
rovi
sion
s of
the
Com
pani
es A
ct, 1
956
whi
ch w
as a
ppro
ved
by
the
shar
ehol
ders
on
Febr
uary
8, 2
007
and
subs
eque
ntly
by
the
Hon
’ble
Hig
h C
ourt
vide
its
orde
r da
ted
Mar
ch 2
3, 2
007.
In te
rms
of th
e S
chem
e, th
e C
ompa
ny a
djus
ted
the
carr
ying
val
ue o
f R
s. 4
48.1
5 C
rore
of
inta
ngib
le a
sset
s su
ch a
s tra
dem
arks
, co
pyrig
hts,
bus
ines
s an
d co
mm
erci
al r
ight
s as
on
Janu
ary
31,
2007
and
rel
ated
def
erre
d ta
x ad
just
men
t of
Rs.
139
.06
Cro
re (
net
adju
stm
ent o
f Rs.
309
.09
Cro
re) a
gain
st th
e ba
lanc
e in
Sec
uriti
es P
rem
ium
Res
erve
of R
s. 1
29.0
9 C
rore
and
Cap
ital R
edem
ptio
n R
eser
ve o
f Rs.
180
Cro
re.
e.
Impa
irmen
t cha
rge
for t
he p
revi
ous
year
incl
uded
Rs.
13.
88 C
rore
whi
ch w
as re
fl ect
ed a
s "E
xcep
tiona
l ite
ms"
in th
e S
tate
men
t of P
rofi t
and
Los
s.
A
dd
ition
al in
form
atio
n on
ass
ets
giv
en o
n op
erat
ing
leas
e
R
s. C
rore
Cos
tD
epre
ciat
ion
for
the
year
Acc
umul
ated
Dep
reci
atio
nN
et B
ook
Valu
eP
lant
and
equ
ipm
ents
2.03
0.01
1.95
0.08
Pre
viou
s Ye
ar2.
030.
031.
940.
09
For
the
year
end
ed M
arch
31,
2012
Rs.
Cro
re
2011
Rs.
Cro
reLe
ase
rent
al in
com
e re
cogn
ised
in th
e S
tate
men
t of P
rofi t
and
Los
s0.
420.
39

M A R I C O L I M I T E D
138
12 Non-current investments
As at March 31,
2012 2011
Rs. Crore Rs. CroreLong term Non-trade investments (valued at cost unless stated
otherwise)Investments in equity instruments :Investment in SubsidiariesQuotedMarico Bangladesh Limited 0.86 0.86 28,350,000 (28,350,000) equity shares of Bangladesh taka 10 each fully paid
(Quoted on Dhaka Stock exchange).UnquotedKaya Limited (wholly owned) 73.00 73.00 14,500,000 (14,500,000) equity shares of Rs.10 each fully paid (Refer note 47)
Marico Middle East FZE (wholly owned) 27.99 27.99 22 (22) equity share of UAE dirham 1,000,000 (1,000,000) fully paid
Marico South Africa Consumer Care (Pty) Limited (wholly owned) 25.37 25.37 800 (800) equity shares of SA Rand 1.00 fully paid
International Consumer Products Corporation 254.98 254.98 9,535,495 (9,535,495) equity shares of VND 10,000 fully paid
382.20 382.20 Other Investments :Investments in Government SecuritiesUnquotedNational Savings Certifi cates (Deposited with the Government authorities) 0.01 0.01
OthersQuoted
Indian Infrastructure Finance Company Ltd, 10.08 10.21 (1,000 (1,000) Unsecured, 6.85% Non-convertible, tax-free Bonds of face value
of Rs. 1,00,000/- each, guaranteed by the Government of India, redeemable
on 22nd January, 2014).
Power Finance Corporation Limited 2.85 – (28,479 (Nil) Secured, Redeemable, Tax free Non-convertible Bonds, 8.20%,
face value of Rs. 1,000/- each, redeemable on 1st February, 2022).
Indian Railway Finance Corporation 2.18 – (21,751 (Nil) Secured, Redeemable, Tax free Non-convertible Bonds, 8.00%,
face value of Rs. 1,000/- each, redeemable on 23rd February, 2022).
National Highways Authority of India 2.47 –
(24,724 (Nil) Secured, Redeemable, Tax free Non-convertible Bonds, 8.20%,
face value of Rs. 1,000/- each, redeemable on 25th January, 2022).
Rural Electrifi cation Corporation Limited 6.12 –
(61,238 (Nil) Secured, Redeemable, Tax free Non-convertible Bonds, 8.12%,
face value of Rs. 1,000/- each, redeemable on 29th March, 2027). 23.71 10.22
Total 405.91 392.42
Aggregate amount of quoted investments 24.56 11.07
Market Value of quoted investments 700.15 1,154.80
Aggregate amount of unquoted investments 381.35 381.35
notes to financial statements for the year ended march 31, 2012

M A R I C O L I M I T E D
139
13 Deferred tax assets (net)
As at March 31,
2012 2011Rs. Crore Rs. Crore
Deferred Tax assets:
Provision for doubtful debts / advances that are deducted for tax purposes
when written off
0.95 1.15
On intangible assets adjusted against Capital Redemption Reserve and
Securities Premium Reserve under the Capital Restructuring scheme
implemented in an earlier year (Refer note 11 (d))
27.49 36.53
Liabilities / provisions that are deducted for tax purposes when paid 3.80 2.50
32.24 40.18
Deferred tax liability:
Additional depreciation/amortisation on fi xed assets for tax purposes due to
higher tax depreciation rates.
13.16 13.64
13.16 13.64
Deferred tax assets (net) 19.08 26.54
14 Long-term loans and advances
As at March 31,
2012 2011
Rs. Crore Rs. Crore
Unsecured, considered good unless stated otherwise
Capital Advances
Considered good 10.31 20.81
Considered doubtful 0.50 0.50
10.81 21.31
Less : Provision for doubtful advances 0.50 0.50
10.31 20.81
Loans and advances to related parties - Subsidiaries (Refer notes 42 and 47) 156.59 160.05
Other loans and advances :
Deposits with public bodies and others
Considered good 7.24 7.81
Considered doubtful 0.50 1.00
7.74 8.81
Less : Provision for doubtful deposits 0.50 1.00
7.24 7.81
Loans to employees 2.70 1.72
Prepaid expenses 0.02 0.02
Balance with statutory/government authorities 12.75 13.91
Advances to vendors 1.28 1.28
Loans and advances to Welfare of Mariconians Trust (Refer note 6 (b)) 19.92 –
Restricted deposit - HSBC Escrow Account (Refer note 36) 25.00 –
Total 235.81 205.60
notes to financial statements for the year ended march 31, 2012

M A R I C O L I M I T E D
140
15 Other non current assets
As at March 31,
2012 2011Rs. Crore Rs. Crore
Fringe benefi t tax payments (net of provisions) 0.48 0.48
MAT credit entitlement 117.84 95.50
Long term deposits with banks with maturity period of more than twelve
months (Refer note below)
4.82 2.23
Total 123.14 98.21
Long term deposits with bank includes Rs. 0.13 Crore (Rs. 0.13 Crore) deposited with sales tax authorities and
Rs. 4.69 Crore (Rs. 2.10 Crore) held as lien by banks against guarantees issued on behalf of the Company.
16 Current investments
As at March 31,
2012 2011Rs. Crore Rs. Crore
Unquoted
Investments in Mutual Funds
Birla Sun Life Cash Manager - Institutional Plan - Growth
Nil (6,087,057) units of Rs. 10 each fully paid
– 10.00
Templeton India Ultra Short Bond Fund Super Institutional Plan - Growth
720,132 (5,921,645) units of Rs. 10 each fully paid
1.00 7.50
Templeton India Ultra Short Bond Fund Super Institutional Plan - Growth
Nil (1,987,297) Units of Rs. 10 each fully paid
– 2.50
IDFC Money Manager Fund - TP - Institutional Plan C - Growth
Nil (8,583,470) units of Rs. 10 each fully paid
– 10.00
UTI Treasury Advantage Fund - Growth
Nil (75,743) units of Rs. 10 each fully paid
– 10.00
BPBIG ICICI Prudential Blended Plan B - Institutional Growth Option II
Nil (9,659,482) units of Rs. 10 each fully paid
– 10.16
DWS Money plus Fund - Institutional Plan Growth
Nil (9,865,755) units of Rs. 10 each fully paid
– 10.16
HDFC Floating Rate Income Fund - Short Term Plan - Wholesale option - Growth
Nil (5,678,049) units of Rs. 10 each fully paid
– 9.50
JPMorgan India Short term Income Fund - Growth
Nil (7,612,090) Units of Rs.10 each fully paid
– 8.12
Tata Liquidity Management Fund - Growth
69,662 (Nil) Units of Rs. 1,000 each fully paid
10.05 –
Tata Liquid Super High Investment Fund - Appreciation
36,647 (Nil) Units of Rs. 1,000 each fully paid
7.25 –
notes to financial statements for the year ended march 31, 2012

M A R I C O L I M I T E D
141
As at March 31,
2012 2011Rs. Crore Rs. Crore
ICICI Prudential Money Market Fund - Cash Option
1,367,539 (Nil) Units of Rs. 100 each fully paid
20.27 –
IDFC Ultra Short Term Fund - Growth
10,129,181 (Nil) Units of Rs. 10 each fully paid
15.00 –
Kotak Liquid-Institutional Premium - Growth
689,915 (Nil) Units of Rs.10 each fully paid
1.50 –
DWS Treasury Fund - Cash - Institutional Plan - Growth
1,732,972 (Nil) Units of Rs. 100 each fully paid
20.73 –
Reliance Liquid Fund-Treasury Plan - Institutional Plan - Growth
7,957,279 (Nil) Units of Rs. 10 each fully paid
20.77 –
Birla Sun Life Floating Rate Fund-STP-Institutional Plan - Growth
366,604 (Nil) Units of Rs. 100 each fully paid
5.22 –
Birla Sunlife Short Term FMP Series 29 - Payout
15,000,000 (Nil) Units of Rs. 10 each fully paid
15.00 –
DSPBR FMP - Series 33-3M-Dividend Payout
15,000,000 (Nil) Units of Rs. 10 each fully paid
15.00 –
JM Floater Fund-Short Term Plan - Growth
5,914,217 (Nil) Units of Rs. 10 each fully paid
10.02 –
L & T FMP-V-(December 368D A) - Growth
8,000,000 (Nil) Units of Rs. 10 each fully paid
8.00 –
L & T Ultra Short Term Fund- Institutional-Cum-Org
2,314,830 (Nil) Units of Rs. 10 each fully paid
4.01 –
SBI Magnum Income Fund FR Saving Plus Bond - Growth
9,039,227 (Nil) Units of Rs. 10 each fully paid
15.04 –
Other investments
Quoted
91 days Certifi cate of deposit of Punjab National Bank of face value of
Rs. 100 Crore expiring on June 26, 2012 with coupon rate of 11.345%
97.40 –
Total 266.26 77.94
Aggregate amount of quoted investments 97.40 –
Market Value of quoted investments 97.44 –
Aggregate amount of unquoted investments 168.86 77.94
notes to financial statements for the year ended march 31, 2012

M A R I C O L I M I T E D
142
17 Inventories
(Refer note 2 (h), for basis of valuation)
As at March 31,
2012 2011Rs. Crore Rs. Crore
Raw materials 203.91 160.88
Work-in-progress 87.77 77.73
Finished goods (includes in–transit Rs. 0.75 Crore (Previous year Rs. 3.79 Crore)) 168.43 149.65
Stock-in-trade (Traded goods) 12.20 2.74
Stores and spares 5.29 5.65
Others :
Packing materials 48.80 55.67
By-products 3.64 1.90
Total 530.04 454.22
18 Trade receivables
As at March 31,
2012 2011Rs. Crore Rs. Crore
Unsecured
Outstanding for a period exceeding six months from the date they are due for payment
Considered good 0.60 0.68
Considered doubtful 2.91 2.99
3.51 3.67
Less: Provision for doubtful debts (2.91) (2.99)
0.60 0.68
Outstanding for a period less than six months from the date they are due
for payment
Considered good 100.44 118.30
Considered doubtful – –
100.44 118.30
Total 101.04 118.98
notes to financial statements for the year ended march 31, 2012

M A R I C O L I M I T E D
143
19 Cash and bank balances
As at March 31,2012 2011
Rs. Crore Rs. Crore
Cash and cash equivalents :
Cash on hand 0.17 0.46
Remittance in–transit 0.12 4.55
Bank balances in current account 5.67 8.68
5.96 13.69
Other bank balances :
Fixed deposits with maturity more than three month but less than twelve months 26.14 1.99
Unclaimed dividend account 0.16 0.23
Preference share redemption account – 0.03
Total 32.26 15.94
20 Short-term loans and advances
As at March 31,2012 2011
Rs. Crore Rs. Crore
Unsecured, considered good (unless otherwise stated)
Loans and advances to related parties :
Subsidiaries 18.76 16.69
Others 0.65 –
19.41 16.69 Others :
Advances to vendors and others 15.33 16.32
Loans and advances to employees 2.13 1.67
Prepaid expenses 3.42 3.28
Balances with statutory / government authorities 4.17 6.98
Inter-corporate deposits 10.00 –
35.05 28.25
Total 54.46 44.94
21. Other current assets
As at March 31,2012 2011
Rs. Crore Rs. Crore
Unsecured, considered good (unless otherwise stated)
Interest accrued and due on loans / deposits 2.40 2.18
Insurance receivables 2.50 –
Accrued export incentives 1.54 –
Assets held for disposal 0.01 0.18
Forward/ derivative contracts receivables 7.53 –
Others 2.37 1.41
Total 16.35 3.77
notes to financial statements for the year ended march 31, 2012

M A R I C O L I M I T E D
144
22 Revenue from operations
For the year ended March 31,2012 2011
Rs. Crore Rs. CroreSale of products:
Finished goods 2,767.61 2,169.82
Traded goods 136.66 120.85
By product sales 60.24 54.83
2,964.51 2,345.50
Less:
Excise duty 1.36 0.98
2,963.15 2,344.52
Other operating revenues:
Export incentives 4.91 3.54
Sale of scraps 2.24 2.35
7.15 5.89
Total 2,970.30 2,350.41
a) Details of Sales (Finished goods)
For the year ended March 31,
2012 2011Rs. Crore Rs. Crore
Edible oils 1,830.60 1,519.86
Hair oils 591.48 476.41
Others 345.53 173.55
Total 2,767.61 2,169.82
b) Details of Sales (Traded goods)
For the year ended March 31,
2012 2011
Rs. Crore Rs. Crore
Oil seeds (Copra) 111.41 92.31
Others 25.25 28.54
Total 136.66 120.85
23 Other income
For the year ended March 31,
2012 2011
Rs. Crore Rs. Crore
Interest Income
On Non current investments 0.85 0.69
On loans, deposits, etc. 7.26 4.49
8.11 5.18
Dividend Income
On current investments 11.92 2.34
On Non current investments (from subsidiaries) 19.89 4.48
31.81 6.82
notes to financial statements for the year ended march 31, 2012

M A R I C O L I M I T E D
145
For the year ended March 31,
2012 2011
Rs. Crore Rs. Crore
Net gain on sale of current investments 0.14 0.40
Other non-operating income :
Lease rental income 0.42 0.39
Royalty income 7.62 6.84
Net gain on foreign currency transactions and translations 2.06 –
Profi t on sale of assets (net) – 0.08
Miscellaneous income 0.99 1.92
Excess provisions no longer required 0.50 –
Total 51.65 21.63
24 Cost of materials consumed, Purchase of stock in trade, Changes in inventories of finished goods, work-in
progress and stock-in-trade - (increase) / decrease
For the year ended March 31,
2012 2011
Rs. Crore Rs. Crore
A Cost of materials consumed (Refer note (a) below)
Raw materials consumed
Opening Inventories 160.88 161.46
Add : Purchases (net) 1,454.38 1,095.75
Less : Inventory at the end of the year 203.91 160.88
Cost of raw material consumed during the year 1,411.35 1,096.33
Packing materials consumed
Opening Inventories 55.67 46.04
Add : Purchases (net) 253.70 222.31
Less : Inventory at the end of the year 48.80 55.67
Cost of packing material consumed during the year 260.57 212.68
Total 1,671.92 1,309.01
B Purchases of Stock-in-trade (Refer note (b) below) 106.33 106.85
C Changes in inventories of finished goods, work-in-progress andstock-in-trade - (Increase) / decrease
Opening inventories
Work-in-progress 77.73 58.01
Finished goods 149.65 97.42
By-products 1.90 1.02
Stock-in-trade 2.74 1.47
Total A 232.02 157.92
Less: Closing inventories
Work-in-progress 87.77 77.73
Finished goods 168.43 149.65
By-products 3.64 1.90
Stock-in-trade 12.20 2.74
Total B 272.04 232.02
(Increase) / decrease in inventories (A-B) (40.02) (74.10)
notes to financial statements for the year ended march 31, 2012

M A R I C O L I M I T E D
146
a Details of Raw materials consumed
For the year ended March 31,2012 2011
Rs. Crore Rs. Crore
Oil seeds (Copra and Kardi seeds) 677.95 490.91
Raw oils (other than Copra and Kardi seeds) 450.46 412.77
Others 282.94 192.65
Total 1,411.35 1,096.33
b Details of Purchases of Stock-in-trade
For the year ended March 31,2012 2011
Rs. Crore Rs. Crore
Oil seeds (Copra) 93.09 89.07
Others 13.24 17.78
Total 106.33 106.85
c Value of Imported and indigenous raw materials consumed
For the year ended March 31,
2012 % 2011 %
Rs. Crore Rs. Crore
Imported 126.92 8.99 57.74 5.27
Indigeneous 1,284.43 91.01 1,038.59 94.73
Total 1,411.35 100.00 1,096.33 100.00
25 Employee benefit expenses
For the year ended March 31,2012 2011
Rs. Crore Rs. Crore
Salaries, wages and bonus 105.67 91.02
Contribution to provident and other funds (Refer note 44 (C) and 45) 6.74 6.43
Employees stock option charge/ (reversal) (Refer note 3 (d)) (0.04) 0.04
Stock appreciation rights expenses (Refer note 6 (a)) 5.30 0.02
Staff welfare expenses 8.54 7.26
Long term service benefi ts – 3.05
Total 126.21 107.82
26 Finance costs
For the year ended March 31,2012 2011
Rs. Crore Rs. CroreInterest on: Long term borrowings 5.28 2.50
Short term borrowings 13.95 16.06 Other borrowing costs 0.33 9.30 Bank and other fi nancial charges 2.51 2.48 Applicable net loss on foreign currency transactions and translation 6.27 1.26Total 28.34 31.60
notes to financial statements for the year ended march 31, 2012

M A R I C O L I M I T E D
147
27 Depreciation, amortisation and impairment
For the year ended March 31,2012 2011
Rs. Crore Rs. CroreDepreciation on tangible assets 29.33 24.17 Amortisation on intangible assets 1.10 3.44Provision for impairment 1.06 0.02 Total 31.49 27.63
28 Other expenses
For the year ended March 31,2012 2011
Rs. Crore Rs. Crore
Consumption of stores and spare parts (refer note (a) below) 26.16 22.54
Power, fuel and water 7.78 9.49
Contract manufacturing charges 101.82 84.91
Rent and storage charges 21.64 24.05
Repairs to:
Building 3.15 2.59
Machinery 7.27 6.30
Others 1.81 1.77
Freight, forwarding and distribution expenses 124.26 108.58
Advertisement and sales promotion 300.88 213.65
Rates and taxes 29.80 11.30
Commission to selling agents 5.31 3.23
Communication expenses 4.40 4.00
Printing and stationery 1.36 1.26
Travelling, conveyance and vehicle expenses 18.52 16.96
Royalty 0.24 0.29
Insurance 2.08 1.76
Payments to the auditor as :
Statutory audit fees 0.66 0.46
Tax audit fees 0.10 0.09
for other services 0.23 0.03
for reimbursement of expenses 0.01 0.01
Net loss on foreign currency transactions and translation (other than considered
as fi nance cost)
– 0.14
Commission to Non-executive directors 0.42 0.40
Miscellaneous expenses (Refer note (b) below ) 40.50 40.35
Total 698.40 554.16
(a) There are no stores and spares imported during the current year and the previous year.
notes to financial statements for the year ended march 31, 2012

M A R I C O L I M I T E D
148
(b) Miscellaneous expenses include :
For the year ended March 31,
2012 2011
Rs. Crore Rs. Crore
Labour charges 6.74 4.53
Training & seminar expenses 4.70 4.62
Outside services 2.32 2.22
Legal & professional charges 18.59 18.34
Donation 0.09 0.04
Loss on sale of assets (net) 0.67 –
Capital advance written off – 1.00
Provision for impairment on assets no longer required written back – (1.03)
Provision for doubtful debts/ advances no longer required written back (0.08) (0.55)
Total 33.03 29.17
29 Contingent liabilities:
As at March 31,
2012 2011
Rs. Crore Rs. Crore
Disputed tax demands / claims :
Sales tax 13.32 17.24
Income tax 4.14 –
Customs duty 0.40 0.40
Agricultural produce marketing cess 8.84 8.14
Employees state insurance corporation 0.13 0.13
Excise duty on subcontractors 0.35 0.29
Excise duty on CNO dispatches (Refer note 46) 278.92 210.74
Claims against the Company not acknowledged as debts. 0.28 0.27
Possible indemnifi cation obligations under the Deed of Assignment for
assignment of “Sweekar” brand.
– 4.00
Total 306.38 241.21
30 Capital commitments
As at March 31,
2012 2011Rs. Crore Rs. Crore
Estimated amount of contracts remaining to be executed on capital account and
not provided for (net of advances) 71.24 54.48
Consideration for Paras acquisition (Refer note 36) 740.00 –
Total 811.24 54.48
notes to financial statements for the year ended march 31, 2012

M A R I C O L I M I T E D
149
31 Other commitments
As at March 31,
2012 2011Rs. Crore Rs. Crore
Corporate guarantees given to banks on behalf of subsidiaries for credit and other
facilities granted by banks. (Credit and other facilities availed by the subsidiaries as
at the year end - Rs.69.45 Crore (Rs. 59.04 Crore)).
88.90 137.44
Stand by Letter of Credit issued by the Company’s banks on behalf of subsidiaries
for credit and other facilities granted by banks. (Credit and other facilities availed by
the subsidiaries as at the year end - Rs.132.23 Crore (Rs. 96.65 Crore)).
169.42 108.47
Guarantees given by banks on behalf of the Company to statutory authorities 16.61 12.26
Total 274.93 258.17
32 CIF value of imports
As at March 31,
2012 2011Rs. Crore Rs. Crore
Raw materials 131.89 32.80
Packing materials 2.20 2.70
Capital goods 1.17 0.16
Stock - in - trade (Traded goods) 1.09 1.88
Total 136.35 37.54
33 Expenditure in foreign currency
As at March 31,
2012 2011Rs. Crore Rs. Crore
Travelling and other expenses 0.65 0.39
Advertisement and sales promotion 4.78 2.67
Interest on other loans 8.01 3.78
Miscellaneous expenses 1.13 8.64
Total 14.57 15.48
34 Earnings in foreign currency
As at March 31,
2012 2011
Rs. Crore Rs. Crore
FOB value of exports 192.35 139.16
Royalty 7.62 6.84
Dividend 19.89 4.48
Interest 4.09 4.03
Corporate guarantee income 0.77 –
Total 224.72 154.51
notes to financial statements for the year ended march 31, 2012

M A R I C O L I M I T E D
150
35. Research and Development expenses aggregating Rs. 6.37 Crore (Rs. 7.53 Crore) have been included under the relevant
heads in the Statement of Profi t and Loss.
36. During the year, the Company signed defi nitive agreements to acquire the personal care business of Paras Pharmaceuticals
Limited (PPL), a 100% subsidiary of Reckitt Benckiser Investments India Private Limited for a consideration of Rs. 740 Crore.
The acquisition transaction is expected to be concluded in May 2012. The Company intends to fund the requirements with
a mix of proceeds from an issuance of equity shares and internal accruals. The shareholders, at their meeting held on
May 2, 2012 have approved issue of equity shares on preferential allotment basis aggregating Rs. 500.00 Crore at a price
of Rs. 170 per equity share (face value Re. 1 and share premium Rs. 169) to two overseas investors.
In terms of the agreement, the Company had deposited Rs. 25.00 Crore in an Escrow deposit account maintained with a
bank which is appointed by the parties for operating the account. The balance in Escrow account would be released to
the seller in the event the said transaction could not be completed due to reasons attributable to the Company. The said
balance is refl ected as ‘non - current assets’ in the balance sheet having regards to the capital nature of the transaction.
37. Additional information on assets taken on lease:
The Company’s signifi cant leasing arrangements are in respect of residential fl ats, offi ce premises, warehouses, vehicles
etc taken on lease. The arrangements range between 11 months to 3 years and are generally renewable by mutual consent
or mutually agreeable terms. Under these arrangements refundable interest-free deposits have been given.
Particulars March 31, 2012
Rs. Crore
March 31, 2011
Rs. Crore
Lease rental payments recognised in the Statement of Profi t and Loss. 17.99 19.57
In respect of assets taken on non-cancellable operating lease:
Lease obligations
Future minimum lease rental payments
- not later than one year 2.16 1.18
- later than one year but not later than fi ve years 1.28 0.96
Total 3.44 2.14
38. Details of Exceptional Items disclosed in the Statement of Profit and Loss are as under:
Particulars March 31, 2012
Rs. Crore
March 31, 2011
Rs. Crore
a. Profi t on divestment of “Sweekar” brand – 50.00
b. Reversal of provision for excise duty. (Refer Note 46 below) – 29.35
c. Provision for Impairment of “Fiancee” trademark – (13.88)
Net income shown as Exceptional items – 65.47
notes to financial statements for the year ended march 31, 2012

M A R I C O L I M I T E D
151
39. Derivative transactions :
a) The total derivative instruments outstanding as on year end March 31, 2012 are Plain Forwards, Plain Vanilla Put Option,
Cross currency swap and Interest rate swap:
March 31, 2012 March 31, 2011
Notional
Amount
in Foreign
Currency
Equivalent
Amount
at the year
end *
(Rs. Crore)
Notional
Amount
in Foreign
currency
Equivalent
Amount
at the year
end *
(Rs. Crore)
Forward contracts outstanding **
Exports:
- in USD 8,238,974 41.92 6,000,000 26.75
Foreign currency loans:
- in USD 34,861,622 177.36 12,308,344 54.88
Creditors:
- in USD 10,586,215 53.86 5,000,000 22.29
- in AUD – – 297,898 1.37
Loan to subsidiary:
- in ZAR 22,000,000 14.59 19,000,000 12.51
Options Contracts outstanding
Exports:
- in USD 8,100,000 41.21 – –
Currency Swap
- in USD 10,000,000 50.88 – –
*Converted into the exchange rate at the year end.
**Out of the forward contracts outstanding as on March 31, 2012, USD 18,825,189 (USD 11,000,000), AUD Nil
(AUD 297,898), having fair value of Rs. 97.37 Crore (Rs. 52.01 Crore) and all outstanding option contracts as on
March 31, 2012, USD 8,100,000 (Rs. Nil) having fair value of Rs. 0.89 Crore (Rs. Nil) have been designated as Cash
fl ow hedges.
- The Company has entered into interest rate swap for hedging its interest rate exposure on borrowings in foreign
currency of USD 30,750,000 (USD 8,750,000), which has a fair value of Rs. 1.55 Crore (Rs. 0.34 Crore).
- The Cash fl ows are expected to occur and impact the Statement of Profi t and Loss within the period of 1 year
except interest rate swap, in respect of which Cash fl ows are expected to occur and impact the Statement of
Profi t and Loss within the period of 1 to 5 years (1 to 2 years).
- All the derivative contracts entered by the Company were for hedging purpose and not for any speculative
purpose.
notes to financial statements for the year ended march 31, 2012

M A R I C O L I M I T E D
152
b) The Net foreign currency exposures not hedged as at the year end are as under:
March 31, 2012 March 31, 2011
Currency Amount in Foreign Currency
Equivalent amount
at the year end
(Rs. Crore)
Amount in Foreign Currency
Equivalent amount
at the year end
(Rs. Crore)
a. Amount (payable) /receivable
in foreign currency on account
of following :
(i) Import of goods and services AED – – 65,000 0.08
AUD 12,342 0.06 – –
EUR 68,430 0.46 (5,038) (0.03)
GBP (74,111) (0.60) – –
SGD (26,554) (0.11) 121 0.01
(ii) Capital imports CHF 680 0.01 680 0.01
GBP 800 0.01 800 0.01
(iii) Export of goods AED 4,988 0.01 4,988 0.01
b. Bank balances USD 38,308 0.19 215,186 0.96
VND 1,183,114 0.01 2,089,001 0.01
c. Other receivable / (payable) USD 22,778 0.12 8,288 0.04
AED 553 0.01 (4,447) (0.01)
EUR – – 600 0.01
d. Loans and Advances to AED 2,784,511 3.86 2,290,417 2.78
Subsidiaries including interest TAKA/ BDT 174,689,865 10.85 120,335,640 7.40
accrued USD 371,844 1.89 313,727 1.40
ZAR 61,718,443 40.94 62,312,333 41.01
EGP 617,600 0.52 371,830 0.28
SGD 190,247 0.77 64,175 0.23
Excludes Loans payable of Rs. 293.81 Crore [USD 57,750,000] (Rs. 279.77 Crore [USD 62,750,000]) assigned to
hedging relationship against highly probable forecast sales. The Cash fl ows are expected to occur and impact the
Statement of Profi t and Loss within the period of 1 to 5 years (1 to 6 years).
c) Pursuant to the Announcement of the Institute of Chartered Accountants of India’s (ICAI) “Accounting for Derivatives”
on encouraging the early adoption of Accounting Standard (AS) 30, “Financial Instruments: Recognition and
Measurement”, the Company had, during the year ended March 31, 2009, decided an early adoption of AS 30 to the
extent it does not confl ict with existing mandatory accounting standards and other authoritative pronouncements,
Company Law and other regulatory requirements. Accordingly, the net unrealised gain/(loss) of Rs. (33.92) Crore
[Rs. 4.99 Crore] in respect of outstanding derivative instruments and foreign currency loans at the year end which
qualify for hedge accounting, is standing in the ‘Hedge Reserve’, which would be recognised in the Statement of Profi t
and Loss when the underlying transaction or forecast revenue arises.
notes to financial statements for the year ended march 31, 2012

M A R I C O L I M I T E D
153
40. Earnings per share :
March 31, 2012 March 31, 2011
Profit for the year as per the Statement of Profit and Loss/ Profit
available to equity shareholders (Rs. Crore)
336.59 315.32
Equity shares outstanding as at the year end 614,934,387 614,399,550
Weighted average number of equity shares used as denominator for
calculating basic earnings per share
614,748,262 612,569,618
Weighted average number of equity shares used as denominator for
calculating diluted earnings per share
615,210,810 615,400,555
Nominal value per equity share Re. 1 Re. 1
Basic earnings per equity share Rs. 5.48 Rs. 5.15
*Diluted earnings per equity share Rs. 5.47 Rs. 5.12
* Diluted EPS has been calculated after taking into account options granted to certain eligible employees as referred in
note 3(d).
Reconciliation of Basic and Diluted Shares used in computing earnings per share
March 31, 2012 March 31, 2011
Number of shares considered as basic weighted average shares outstanding 614,748,262 612,569,618
Add: Effect of dilutive stock options 462,548 2,830,937
Number of shares considered as weighted average shares and potential
shares outstanding
615,210,810 615,400,555
41. Segment Information
The Company has only one reportable segment in terms of Accounting Standard 17 (AS 17) ‘Segment Reporting’ mandated
by Rule 3 of the Companies (Accounting Standard) Rules 2006, which is manufacturing and sale of consumer products
and geographical segments are insignifi cant.
42. Related Party disclosures :
a) Name of related parties and nature of relationship:
i) Subsidiary companies (wholly owned, unless stated otherwise)
Name of the Company
Kaya Limited
Marico Bangladesh Limited (MBL)
MBL Industries Limited (MBLIL) (Through Marico Middle East FZE)
Marico Middle East FZE (MME)
Kaya Middle East FZE (KME) (Through Marico Middle East FZE)
MEL Consumer Care SAE (MELCC) (Through Marico Middle East FZE)
Egyptian American Investment & Industrial Development Company (EAIIDC) (Through Marico Middle East FZE )
Marico Egypt Industries Company (MEIC) (through MEL Consumer Care SAE)
Marico South Africa Consumer Care (Pty) Limited (MSACC)
Marico South Africa (Pty) Limited (MSA) (Through Marico South Africa Consumer Care (Pty) Ltd)
CPF International (Pty) Limited (CPF) (Through Marico South Africa (Pty) Limited) (upto January 16, 2012)
Marico Malaysia Sdn. Bhd. (MMSD) (Through Marico Middle East FZE)
Derma – Rx International Aesthetics Pte. Ltd. (DIAL) (w.e.f May 22, 2010)
The DRx Clinic Pte. Ltd. (DCPL) (Through Derma – Rx International Aesthetics Pte. Ltd ) (w.e.f May 25, 2010)
notes to financial statements for the year ended march 31, 2012

M A R I C O L I M I T E D
154
Name of the Company
The DRx Medispa Pte. Ltd. (DMSPL) (Through Derma – Rx International Aesthetics Pte. Ltd) (w.e.f May 25, 2010)
DRx Investments Pte. Ltd. (DIPL) (Through Derma – Rx International Aesthetics Pte. Ltd ) (w.e.f May 25, 2010)
DRX Meditech Pte Limited – (With effect from May 25, 2010 and upto February 28, 2011 – merged with Derma-
Rx International Aesthetics Pte Limited with effect from March 1, 2011)
DRx Aesthetics Sdn. Bhd. (DASB) (Through Derma – Rx International Aesthetics Pte. Ltd ) (w.e.f May 25, 2010)
International Consumer Products Corporation (ICP) (w.e.f February 18, 2011)
Beaute Cosmetique Societe Par Actions (BCS) (Through International Consumer Products Corporation)
(w.e.f February 18, 2011) (99% (99%) equity held by ICP)
Thuan Phat Foodstuff Joint Stock company (TPF) (Through International Consumer Products Corporation)
(w.e.f February 18, 2011) (98.6% (87%) equity held by ICP)
ii) Subsidiary fi rm :
Wind Company. (Through MEL Consumer Care SAE)
iii) Key management personnel (KMP) :
Harsh Mariwala, Chairman and Managing Director
iv) Relatives of Key management personnel:
Rishabh Mariwala, son of Harsh Mariwala
v) Others - Entities in which KMP has signifi cant infl uence
The Bombay Oil Private Limited
Marico Innovation Foundation Trust
b) Transactions during the year
(Rs. Crore)
Particulars Subsidiaries KMP Others
March
31, 2012
March
31, 2011
March
31, 2012
March
31, 2011
March
31, 2012
March
31, 2011
Sale of goods 158.43 127.83 – – – –
Purchase of goods 0.13 1.74 – – – –
Royalty income 7.62 6.84 – – – –
Dividend income 19.89 4.48 – – – –
Interest income 4.09 4.03 – – – –
Corporate guarantee commission 0.77 0.23 – – – –
Expenses paid on behalf of subsidiaries 10.55 10.00 – – – –
Remuneration – – 4.03 3.70 – –
Loans and advances given 62.79 173.39 – – 0.65 –
Loan repaid 66.46 137.82 – – – –
Investments – 254.98 – – – –
Rent paid – – – – – 0.15
Stand by Letter of Credit issued to banks 51.98 42.91 – – – –
Corporate guarantee discharged 58.73 – – – – –
Corporate guarantee given to banks – 82.93 – – – –
notes to financial statements for the year ended march 31, 2012

M A R I C O L I M I T E D
155
c. Balances as at the year end
(Rs. Crore)
Particulars Subsidiaries KMP Others
March
31, 2012
March
31,2011
March
31, 2012
March
31, 2011
March
31, 2012
March
31, 2011
Investment 382.21 382.21 – – – –
Trade payable 0.15 0.41 – – – 0.01
Trade receivable 21.17 16.47 – – – –
Short term loans and advances 18.76 16.69 – – 0.65 –
Long term loans and advances 156.59 160.05 – – – –
Interest accrued on loans and advances 1.10 1.48 – – – –
Corporate guarantees given to banks 88.90 137.44 – – – –
Stand-by Letter of Credit given to banks 169.42 108.48 – – – –
d) Disclosure in respect of transactions which are more than 10% of the total transactions of the same type with related
parties.
(Rs. Crore)
PARTICULAR For the year ended Balances
March31, 2012
March31, 2011
March31, 2012
March31, 2011
Sale of goods
Marico Bangladesh Limited 116.71 98.65 8.21 5.71
Marico Middle East FZE 40.38 27.29 12.72 10.76
Purchase of goods
Marico Egypt for Industries Company 0.13 1.18 0.13 0.31
Egyptian American Investment & Industrial Development Company – 0.56 0.02 0.10
Royalty income
Marico Bangladesh limited 3.43 3.68 10.49 7.02
Marico Middle East FZE 3.70 2.84 3.86 2.78
Dividend income
Marico Bangladesh limited 19.89 4.48 – –
Interest income
Marico South Africa Consumer Care (pty) Ltd 4.09 3.77 1.10 1.48
Corporate guarantee commission
Derma Rx International Aesthetics Pte. Ltd. 0.77 0.23 0.77 0.23
Expenses paid on behalf of subsidiaries
Marico Middle East FZE 2.01 0.81 0.61 0.22
Kaya Limited 6.54 9.21 – –
Rent paid
The Bombay Oil Private Limited – 0.15 – –
Investments made during the year
International Consumer Products Corporation – 254.98 254.98 254.98
notes to financial statements for the year ended march 31, 2012

M A R I C O L I M I T E D
156
PARTICULAR For the year ended Balances
March31, 2012
March31, 2011
March31, 2012
March31, 2011
Remuneration
Harsh Mariwala 4.01 3.58 – –
Loans and advances given
Kaya Limited 60.83 130.98 103.00 112.92
Loan and advances repaid
Kaya Limited 77.29 103.13 – –
Stand by Letter of Credit given to banks
Marico Middle East FZE 26.79 40.68 141.44 106.02
Kaya Middle East FZE 26.39 – 22.39 –
Corporate guarantee discharged
Derma Rx International Aesthetics Pte. Ltd. 14.15 – 80.90 84.86
Marico South Africa (Pty) Limited 44.59 – – 44.59
Corporate guarantees given to banks
Derma Rx International Aesthetics Pte. Ltd. – 82.93 80.90 84.86
e) Clause 32 disclosures
Loans and advances in the nature of loans to subsidiaries /entity in which KMP has signifi cant infl uence
Particulars March 31, 2012
Rs. Crore
March 31, 2011
Rs. Crore
Loans to subsidiary: Kaya LimitedBalance as at the year end 103.00 112.92Maximum amount outstanding at any time during the year 115.00 186.70
Loans to subsidiary: Marico South Africa Consumer Care (pty) LimitedBalance as at the year end 54.44 52.04
Maximum amount outstanding at any time during the year 63.65 53.99
Loans to Marico Innovation Foundation TrustBalance as at the year end 0.65 –Maximum amount outstanding at any time during the year 0.65 –
43. Managerial Remuneration
Nature of transactions March 31, 2012
Rs. Crore
March 31, 2011
Rs. Crore
Payments and provisions on account of remuneration to Chairman and
Managing Director included in the Statement of Profit and Loss
Salary 2.60 2.26
Contribution to provident and other funds 0.30 0.26
Other perquisites 0.07 0.09
Annual performance incentives 1.04 0.97
4.01 3.58
Remuneration to non-whole time directors (including Sitting fees) 0.47 0.46
The above remuneration to Chairman and Managing Director does not include contribution to gratuity fund and provision
for Leave encashment, as these are lump sum amounts for all relevant employees based on actuarial valuation.
notes to financial statements for the year ended march 31, 2012

M A R I C O L I M I T E D
157
44. The Following table sets forth the funded status of the plan and the amounts relating to gratuity and leave encashment
recognised in the Company’s fi nancials:
A. Defi ned Benefi t plan (Gratuity):
March 31, 2012 March 31, 2011
I. Actuarial assumptions for Gratuity benefits and
Compensated absence for employees:
Discount rate 8.50% 8.00%
Rate of return on Plan assets* 8.60% 8.00%
Future salary rise** 10.00% 10.00%
Attrition rate 17.00% 17.00%
Mortality Published notes under the IC (1994-96)
Mortality tables
*The expected rate of return on plan assets is based on expectation of the average long term rate of return expected
on investment of the fund during the estimated term of the obligations.
**The estimates of future salary increases, considered in actuarial valuation, take account of infl ation, seniority,
promotion, and other relevant factors such as supply and demand factors in the employment market. The expected
rate of return on plan assets is based on the current portfolio of assets, investment strategy and market scenario.
March 31, 2012 March 31, 2011
Rs. Crore Rs. Crore
II. Changes in benefit obligations:
Liability at the beginning of the year 11.64 10.57
Interest cost 0.93 0.80
Current service cost 1.33 1.42
Past service cost (non vested benefi t) – –
Past service cost (vested benefi t) – –
Benefi ts paid (1.05) (0.68)
Actuarial (gain)/loss on obligations (1.04) (0.47)
Liability at the end of the year 11.81 11.64
March 31, 2012 March 31, 2011
Rs. Crore Rs. Crore
III. Fair value of plan assets :
Fair value of plan assets at the beginning of the year 11.46 11.39
Expected return on plan assets 0.98 0.91
Contributions 0.63 –
Benefi ts paid (1.05) (0.68)
Actuarial gain/(loss) on plan assets (0.38) (0.16)
Fair value of plan assets at the end of the year 11.64 11.46
Total Actuarial (gain)/loss to be recognised (0.66) (0.31)
notes to financial statements for the year ended march 31, 2012

M A R I C O L I M I T E D
158
March 31, 2012 March 31, 2011
Rs. Crore Rs. Crore
IV. Actual return on plan assets :
Expected return on plan assets 0.98 0.91
Actuarial gain/(loss) on plan assets (0.38) (0.16)
Actual return on plan assets 0.60 0.75
March 31,
2012
Rs. Crore
2011
Rs. Crore
2010
Rs. Crore
2009
Rs. Crore
2008
Rs. Crore
V. Amount recognised in the
Balance Sheet :
Liability at the end of the year 11.81 11.64 10.57 9.56 9.17
Fair value of plan assets at the end 11.64 11.46 11.39 9.02 9.05
of the year
Difference 0.17 0.18 (0.82) 0.54 0.12
Unrecognised past service cost – – – – –
(Assets) / Liability recognised
in the Balance Sheet
0.17 0.18 (0.82) 0.54 0.12
March 31, 2012 March 31, 2011
Rs. Crore Rs. Crore
VI. Percentage of each category of plan assets to total fair value
of plan assets.
Administered by HDFC Standard Life Insurance 94.13% 93.32%
Special deposit scheme, Fixed deposit scheme and others 5.87% 6.68%
Total 100% 100%
March 31, 2012 March 31, 2011
Rs. Crore Rs. Crore
VII. Expenses recognised in the Statement Profit and Loss :
Current service cost 1.33 1.42
Interest cost 0.93 0.80
Expected return on plan assets (0.98) (0.91)
Net actuarial (gain)/loss to be recognised (0.66) (0.31)
Past service cost (non vested benefi t) recognised – –
Past service cost (vested benefi t) recognised – –
(Income) / Expense recognised in the Statement of Profi t and Loss 0.62 1.00
notes to financial statements for the year ended march 31, 2012

M A R I C O L I M I T E D
159
March 31, 2012 March 31, 2011
Rs. Crore Rs. Crore
VIII. Balance Sheet reconciliation
Opening net liability 0.18 (0.82)
(Income) / Expense as above 0.62 1.00
Employers contribution (0.63) –
Closing net liability 0.17 0.18
March 31, 2012 March 31, 2011 March 31, 2010
Rs. Crore Rs. Crore Rs. Crore
IX. Experience Adjustments
On Plan liability (gain) / loss (0.80) 0.17 (0.34)
On plan asset (loss) / gain (0.38) (0.16) 1.53
As per actuarial valuation report, expected employer’s contribution in next year is Rs. 1.55 Crore (Rs. 0.40 Crore).
B. Privileged leave (Compensated absence for employees):
Amount recognised in the Balance Sheet and movements in net liability:
Particulars March 31, 2012 March 31, 2011
Rs. Crore Rs. Crore
Opening balance of compensated absences (a) 5.57 5.35
Present value of compensated absences(As per actuary valuation) as
at the year end (b)
6.20 5.57
(Excess)/ Unfunded liability of Compensated Absences recognised in
the Statement of Profi t and Loss for the year (b-a)
0.63 0.22
The privileged leave liability is not funded.
C. Defi ned contribution plan :
The Company has recognised Rs. 5.20 Crore (Rs. 5.11 Crore) towards contribution to provident fund, Rs 0.45 Crore
(Rs. 0.56 Crore) towards contribution to superannuation fund and Rs. 0.35 Crore (Rs. 0.23 Crore) towards employee
state insurance plan in the Statement of Profi t and Loss.
45. The Guidance Note on implementing AS 15, Employee benefi ts (revised 2005) issued by Accounting Standards Board (ASB)
states that benefi ts involving employer-established provident funds, which require interest shortfalls to be recompensed, are
to be considered as defi ned benefi t plans. The Actuarial Society of India has issued the fi nal guidance for measurement of
provident fund liabilities during the year. The actuary has accordingly provided a valuation and based on the below provided
assumptions there is no shortfall as at March 31, 2012.
The details of fund and plan asset position are given below:
Particulars March 31, 2012
Rs. Crore
Plan asset at the year end, at fair value 59.25
Present value of benefi t obligation at the year end 59.25
Asset recognised in the Balance Sheet –
notes to financial statements for the year ended march 31, 2012

M A R I C O L I M I T E D
160
Assumption used in determining the present value obligation of the interest rate guarantee under the deterministic approach:
Particulars March 31, 2012
Actuarial assumptions for Provident fund benefits
Discount rate 8.50%
Rate of return on assets 8.69%
Guaranteed interest rate 8.25%
Attrition rate 17.00%
Average Holding period of assets 6.43 Years
Mortality Published notes under the
IC (1994-96) Mortality tables
Percentage of each category of plan assets to total fair value of plan assets. March 31, 2012
Central government securities 23.56 %
State loan / State government guaranteed securities 18.65 %
Public sector units 47.55 %
Private sector units 6.68 %
Special deposit Scheme 3.56 %
Total 100 %
Expected employers contribution in next year Rs. 5.08 Crore.
There are no previous year fi gures as the actuarial valuation has been done for the fi rst time in the current year.
46. During the year ended March 31, 2010, the Company had made provisions towards 75% of possible excise duty obligations
in respect of the coconut oil packs up to 200 ml, which is being contested by the Company. Based on facts of the case and
the legal opinion obtained, the Company had made an assessment that the probability of success in the matter is more
likely than not and the liability was in the nature of contingent liability. As the said provisioning of contingent liability was
not in accordance with the requirement of Accounting Standard (AS) 29 “Provisions, Contingent Liability and Contingent
Assets”, the Company reviewed the matter and reversed the provision of Rs. 29.35 Crores made upto March 31, 2010
during the year ended March 31, 2011 (Refer Note 38 above) and the same was included under the “Exceptional items”
in the Statement of Profi t and Loss. Further, deferred tax asset of Rs. 9.75 Crores recognised during the year ended
March 31, 2010 was reversed and included in deferred tax charge for the year in the Statement of Profi t and Loss for the
said year.
The possible excise duty obligation of Rs. 157.15 Crores (Rs. 88.97 Crores) for clearences made after June 3, 2009
(i.e. the date of issue of relevant excise circular) till March 31, 2012 and Rs. 121.77 Crores (Rs. 121.77 Crores) for clearences
made prior to June 3, 2009 has been disclosed as contingent liability to the extent of the time horizon covered by show
cause notice issued by the excise department with in the normal period of one year (from the date of clearance) under the
excise laws.
The Company will continue to review this matter during the coming accounting periods based on the developments on the
outcomes in the pending cases and the legal advice that it may receive from time to time.
47. As at March 31, 2012, Marico Limited (“Marico”) holds 100 % of the Equity Capital of Kaya Limited (“Kaya”) at a cost
of Rs.73.00 Crore (Rs.73.00 Crore). The Company has also advanced long term loans to Kaya of Rs. 103.00 Crore
(Rs. 112.92 Crore). As per the latest audited fi nancial statements, Kaya has negative net-worth as at March 31, 2012.
The management believes that these losses are not refl ective of future trends and operations of the Company and the Kaya
business model continues to be robust and offers signifi cant long term growth opportunities. Further, the operations of Kaya
notes to financial statements for the year ended march 31, 2012

M A R I C O L I M I T E D
161
are expected to improve signifi cantly due to positive changes in the economic environment, maturity of new clinics, renewed
focus on reducing the time to scale up revenues in new clinics, improve capacity utilization of clinics, expansion of Kaya’s range
of services and product offerings, rationalization of costs and other restructuring measures under consideration, including
leveraging the synergies from the acquisition of Derma Rx business in Singapore (by its wholly owned subsidiary) and by
increasing the share of product sales in the total business. Having regard to the above factors, based on the fundamentals
of Kaya and its future business plans and improved performance in the current year, the management is of the opinion that
it is strategically desirable for Marico to continue to support Kaya through funding (equity / debt infusion), through either
fresh funds or conversion of existing loans into equity. Accordingly, the management perceives that the erosion in the value
of investments in Kaya is not other than temporary. Hence, no provision for diminution in value is considered necessary in
respect of the Company’s investments in Kaya or of the loans and advances given to Kaya.
48. Previous year figures :
a) The fi nancial statements for the year ended March 31, 2011 had been prepared as per the then applicable, pre-revised
Schedule VI to the Companies Act, 1956. Consequent to the notifi cation of Revised Schedule VI under the Companies
Act, 1956, the fi nancial statements for the year ended March 31, 2012 are prepared as per Revised Schedule VI.
Accordingly, the previous year fi gures have also been reclassifi ed to conform to this year’s classifi cation. The adoption
of Revised Schedule VI for previous year fi gures does not impact recognition and measurement principles followed
for preparation of fi nancial statements.
b) The fi gures in brackets represent those of the previous year.
notes to financial statements for the year ended march 31, 2012
As per our attached report of even date.
For Price Waterhouse For and on behalf of the Board of DirectorsChartered Accountants HARSH MARIWALA Chairman and Managing DirectorFirm Registration No. 301112E NIKHIL KHATTAU Director and Chairman of Audit Committee MILIND SARWATE Group Chief Financial Offi cerUDAY SHAH HEMANGI GHAG Company Secretary & Compliance Offi cerPartner Membership No. F-46061
Place : Mumbai Place : MumbaiDate : May 3, 2012 Date : May 3, 2012

M A R I C O L I M I T E D
162
statem
ent p
ursu
ant t
o sec
tion 2
12(1)
(e) of
the c
ompa
nies a
ct, 19
56.
Nam
e of
the
subs
idia
ry c
ompa
nyM
aric
o B
angl
ades
h Li
mite
dM
BL
Indu
strie
s Li
mite
d #
Kay
a Li
mite
dM
aric
o M
iddl
e E
ast
FZE
Kay
a M
iddl
e E
ast
FZE
#M
EL
Con
sum
er
Car
e S
AE
#E
gypt
ian
Am
eric
an
Inve
stm
ent
and
Indu
stria
l D
evel
opm
ent
Com
pany
#
Mar
ico
Sou
th
Afr
ica
Con
sum
er
Car
e (P
ty)
Lim
ited
Mar
ico
Sou
th A
fric
a (P
ty)
Lim
ited
#
Nam
e of
the
hold
ing
com
pany
Mar
ico
Lim
ited
M
aric
o M
iddl
e E
ast
FZE
Mar
ico
Lim
ited
Mar
ico
Lim
ited
Mar
ico
Mid
dle
Eas
t FZ
EM
aric
o M
iddl
e E
ast
FZE
Mar
ico
Mid
dle
Eas
t FZ
EM
aric
o Li
mite
dM
aric
o S
outh
Afr
ica
Con
sum
er C
are
(Pty
) Li
mite
d
Rep
ortin
g C
urre
ncy
BD
TR
s.B
DT
Rs.
Rs.
Rs.
AE
DR
s.A
ED
Rs.
EG
PR
s.E
GP
Rs.
ZAR
Rs.
ZAR
Rs.
Exc
hang
e R
ate
0.6
21
0.6
21
1.0
00
13.
851
13.
851
8.4
23
8.4
23
6.6
34
6.6
34
Hol
ding
Com
pany
’s in
tere
st
28,3
50,0
00 o
rdin
ary
shar
es o
f Tak
a 10
ea
ch, f
ully
pai
d up
100,
000
ordi
nary
sh
ares
of T
aka
10
each
, ful
ly p
aid
up
14,5
00,0
00 o
rdin
ary
shar
es o
f Rs.
10
each
, ful
ly p
aid
up
22 o
rdin
ary
shar
e of
AE
D 1
,000
,000
ea
ch, f
ully
pai
d up
1 E
quity
sha
re o
f A
ED
1,5
0,00
0 fu
lly
paid
up
250
Equ
ity s
hare
of
EG
P 1
,000
fully
pa
id u
p
68,9
20 o
rdin
ary
shar
es o
f EG
P 1
00
each
, ful
ly p
aid
up
800
ordi
nary
sha
res
of Z
AR
1 e
ach,
fully
pa
id u
p
500,
000
ordi
nary
sh
ares
of Z
AR
0.0
1 ea
ch, f
ully
pai
d up
Ext
ent o
f Hol
ding
as
on 3
1st M
arch
201
290
%10
0%10
0%10
0%10
0%10
0%10
0%10
0%10
0%
The
“fi n
anci
al y
ear”
of t
he s
ubsi
diar
y co
mpa
ny e
nded
on
Mar
ch 3
1,20
12S
epte
mbe
r 30,
201
1M
arch
31,
201
2M
arch
31,
201
2M
arch
31,
201
2M
arch
31,
201
2D
ecem
ber 3
1, 2
011
Mar
ch 3
1, 2
012
Mar
ch 3
1, 2
012
Am
ount
in C
rore
Am
ount
in C
rore
Am
ount
in C
rore
Am
ount
in C
rore
Am
ount
in C
rore
Am
ount
in C
rore
Am
ount
in C
rore
Am
ount
in C
rore
Am
ount
in C
rore
BD
TR
s.B
DT
Rs.
Rs.
Rs.
AE
DR
s.A
ED
Rs.
EG
PR
s.E
GP
Rs.
ZAR
Rs.
ZAR
Rs.
Net
agg
rega
te a
mou
nt o
f the
sub
sidi
ary
com
pany
’s p
rofi t
s/ (l
osse
s) d
ealt
with
in
the
hold
ing
com
pany
’s a
ccou
nts
For t
he s
ubsi
diar
y’s
afor
esai
d fi n
anci
al
year
34.
02
21.
13
Nil
Nil
Nil
Nil
Nil
Nil
Nil
Nil
Nil
Nil
Nil
Nil
Nil
Nil
Nil
Nil
For t
he p
revi
ous
fi nan
cial
yea
rs s
ince
it
beca
me
subs
idia
ry 2
4.13
1
5.07
Nil
Nil
Nil
Nil
Nil
Nil
Nil
Nil
Nil
Nil
Nil
Nil
Nil
Nil
Nil
Nil
Net
agg
rega
te a
mou
nt o
f the
sub
sidi
ary
com
pany
’s p
rofi t
s/ (l
osse
s) n
ot d
ealt
with
in th
e ho
ldin
g co
mpa
ny’s
acc
ount
s
For t
he s
ubsi
diar
y’s
afor
esai
d fi n
anci
al
year
19.5
4 12
.14
0.1
6 0
.10
(2.9
4) (2
.94)
(0.0
7) (0
.98)
(3.1
8) (4
4.01
) (0
.01)
(0.1
2) (0
.44)
(3.7
2) (0
.04)
(0.2
8) 0
.12
0.8
1
For t
he p
revi
ous
fi nan
cial
yea
rs s
ince
it
beca
me
subs
idia
ry 2
08.8
0 1
31.3
9 (2
.91)
(1.9
5) (6
6.28
) (6
6.28
) 0
.40
5.7
1 (1
.31)
(16.
11)
(1.2
7) (1
0.74
) (1
.90)
(17.
38)
(0.3
3) (1
.36)
(0.5
1) (3
.32)
Cha
nges
, if a
ny, i
n th
e ho
ldin
g co
mpa
ny’s
inte
rest
in th
e su
bsid
iary
be
twee
n th
e en
d of
the
fi nan
cial
yea
r of
the
subs
idia
ry a
nd th
at o
f the
hol
ding
co
mpa
ny
NA
NA
NA
NA
NA
NA
NA
NA
NA
Mat
eria
l cha
nges
, if a
ny, b
etw
een
the
end
of th
e fi n
anci
al y
ear o
f the
su
bsid
iary
and
that
of t
he h
oldi
ng
com
pany
NA
NA
NA
NA
NA
NA
NA
NA
NA
Am
ount
in C
rore

M A R I C O L I M I T E D
163
statem
ent p
ursu
ant t
o sec
tion 2
12(1)
(e) of
the c
ompa
nies a
ct, 19
56.
Am
ount
in C
rore
Nam
e of
the
subs
idia
ry
com
pany
Mar
ico
Egy
pt
Indu
strie
s C
ompa
ny#
Mar
ico
Mal
aysi
a S
dn. B
hd#
Der
ma
Rx
Inte
rnat
iona
l A
esth
etic
s P
te.
Ltd
#
The
DR
x C
linic
P
te. L
td
#Th
e D
Rx
Med
ispa
P
te. L
td #
DR
x In
vest
men
ts
Pte
. Ltd
#
DR
x A
esth
etic
s S
dn B
hd
#In
tern
atio
nal
Con
sum
er
Pro
duct
s C
orpo
ratio
n #
Bea
uté
Cos
mét
ique
S
ocie
té P
ar
Act
ions
#
Thua
n P
hat
Food
stuf
f Joi
nt
stoc
k C
ompa
ny
#
Nam
e of
the
hold
ing
co
mpa
nyM
EL
Con
sum
er
Car
e S
AE
Mar
ico
Mid
dle
Eas
t FZE
Kay
a Li
min
ted
Der
ma
Rx
Inte
rnat
iona
l A
esth
etic
s P
te. L
td
Der
ma
Rx
Inte
rnat
iona
l A
esth
etic
s P
te. L
td
Der
ma
Rx
Inte
rnat
iona
l A
esth
etic
s P
te. L
td
DR
x In
vest
men
ts
Pte
. Ltd
Mar
ico
Lim
ited
Inte
rnat
iona
l C
onsu
mer
P
rodu
cts
Cor
pora
tion
Inte
rnat
iona
l C
onsu
mer
P
rodu
cts
Cor
pora
tion
Rep
ortin
g C
urre
ncy
EG
PR
s.M
YRR
s.S
GD
Rs.
SG
DR
s.S
GD
Rs.
SG
DR
s.M
YRR
s.VN
DR
s.VN
DR
s.VN
DR
s.
Exc
hang
e R
ate
8.4
23
16.
617
40.8
2940
.829
40.8
2940
.829
16.
617
0.00
244
0.00
244
0.00
244
Hol
ding
Com
pany
’s in
tere
st
1,22
8,76
9 E
quity
sh
ares
of E
GP
10
each
, ful
ly p
aid
17,6
60,2
40 E
quity
sh
ares
of M
YR 1
ea
ch, f
ully
pai
d
7,00
0,00
0 E
quity
sh
ares
of S
GD
1
each
fully
pai
d up
100,
000
Equ
ity
shar
es o
f SG
D 1
ea
ch fu
lly p
aid
up
100,
000
Equ
ity
shar
es o
f SG
D 1
ea
ch fu
lly p
aid
up
748,
343
Equ
ity
shar
es o
f SG
D 1
ea
ch fu
lly p
aid
up
990,
000
Equ
ity
shar
es o
f MYR
1
each
fully
pai
d up
11,2
17,7
60 E
quity
sh
ares
of V
ND
10
,000
eac
h fu
lly
paid
up
1,69
7,00
0 E
quity
sh
ares
of V
ND
10
,000
eac
h fu
lly
paid
up
2,63
1,63
4 E
quity
sh
ares
of V
ND
10
,000
eac
h fu
lly
paid
up
Ext
ent o
f Hol
ding
as
on 3
1st
Mar
ch 2
012
100%
100%
100%
100%
100%
100%
100%
85%
84.8
5%83
.81%
The
“fi n
anci
al y
ear”
of t
he
subs
idia
ry c
ompa
ny e
nded
on
Dec
embe
r 31,
201
1M
arch
31,
201
2M
arch
31,
201
2M
arch
31,
201
2M
arch
31,
201
2M
arch
31,
201
2M
arch
31,
201
2D
ecem
ber 3
1, 2
011
Dec
embe
r 31,
201
1D
ecem
ber 3
1, 2
011
Am
ount
in C
rore
Am
ount
in C
rore
Am
ount
in C
rore
Am
ount
in C
rore
Am
ount
in C
rore
Am
ount
in C
rore
Am
ount
in C
rore
Am
ount
in C
rore
Am
ount
in C
rore
Am
ount
in C
rore
EG
PR
s.M
YRR
s.S
GD
Rs.
SG
DR
s.S
GD
Rs.
SG
DR
s.M
YRR
s.VN
DR
s.VN
DR
s.VN
DR
s.
Net
agg
rega
te a
mou
nt o
f the
su
bsid
iary
com
pany
’s p
rofi t
s/
(loss
es) d
ealt
with
in th
e ho
ldin
g co
mpa
ny’s
acc
ount
s
For t
he s
ubsi
diar
y’s
afor
esai
d fi n
anci
al y
ear
Nil
Nil
Nil
Nil
Nil
Nil
Nil
Nil
Nil
Nil
Nil
Nil
Nil
Nil
Nil
Nil
Nil
Nil
Nil
Nil
For t
he p
revi
ous
fi nan
cial
ye
ars
sinc
e it
beca
me
subs
idia
ry
Nil
Nil
Nil
Nil
Nil
Nil
Nil
Nil
Nil
Nil
Nil
Nil
Nil
Nil
Nil
Nil
Nil
Nil
Nil
Nil
Net
agg
rega
te a
mou
nt o
f the
su
bsid
iary
com
pany
’s p
rofi t
s/
(loss
es) n
ot d
ealt
with
in th
e ho
ldin
g co
mpa
ny’s
acc
ount
s
For t
he s
ubsi
diar
y’s
afor
esai
d fi n
anci
al y
ear
0.9
5 8
.02
(0.1
2) (2
.03)
0.3
4 1
3.98
0
.30
12.
39
0.1
7 6
.81
(0.0
1) (0
.41)
0.0
1 0
.46
4,7
65.3
6 11
.63
651
.06
1.5
9 (6
57.6
2) (1
.60)
For t
he p
revi
ous
fi nan
cial
ye
ars
sinc
e it
beca
me
subs
idia
ry
4.58
3
7.43
(0.2
0)
(2.9
2)
0.01
0.
14
0.2
8 9.
79
0.0
93.
02 (0
.01)
(0
.02)
0
.03
0.5
0 1
,233
.68
2.63
4
48.1
90.
96
(217
.17)
(0
.46)
Cha
nges
, if a
ny, i
n th
e ho
ldin
g co
mpa
ny’s
inte
rest
in
the
subs
idia
ry b
etw
een
the
end
of th
e fi n
anci
al y
ear o
f th
e su
bsid
iary
and
that
of t
he
hold
ing
com
pany
NA
NA
NA
NA
NA
NA
NA
NA
Hol
ding
com
pany
in
crea
sed
its
hold
ing
from
84
.15%
as
on
Dec
embe
r 31,
201
1 to
84.
85%
as
on
Mar
ch 3
1, 2
012
Hol
ding
com
pany
in
crea
sed
its
hold
ing
from
81
.77%
as
on
Dec
embe
r 31,
201
1 to
83.
81%
as
on
Mar
ch 3
1, 2
012
Mat
eria
l cha
nges
, if
any,
bet
wee
n th
e en
d of
th
e fi n
anci
al y
ear o
f the
su
bsid
iary
and
that
of t
he
hold
ing
com
pany
NA
NA
NA
NA
NA
NA
NA
NA
NA
NA

M A R I C O L I M I T E D
164
statem
ent p
ursu
ant t
o sec
tion 2
12(1)
(e) of
the c
ompa
nies a
ct, 19
56.
The
Indi
an ru
pee
equi
vale
nts
of th
e fi g
ures
giv
en in
fore
ign
curr
enci
es in
the
acco
unts
of t
he s
ubsi
diar
y co
mpa
nies
, hav
e be
en g
iven
bas
ed o
n th
e ex
chan
ge ra
tes
as o
n M
arch
31,
201
2 .
# B
y vi
rtue
of S
ectio
n 4
(1) (
c) o
f the
Com
pani
es A
ct, 1
956,
a)
MB
L In
dust
ries
Lim
ited
(MB
LIL)
is a
sub
sidi
ary
of th
e C
ompa
ny a
s M
aric
o M
iddl
e E
ast F
ZE, a
sub
sidi
ary
of th
e C
ompa
ny, h
olds
100
% s
take
in M
BLI
L,
b)
Kay
a M
iddl
e E
ast F
ZE (
KM
E),
ME
L C
onsu
mer
Car
e S
AE
(M
ELC
C)
and
Egy
ptia
n A
mer
ican
Indu
stria
l and
Inve
stm
ent D
evel
opm
ent C
ompa
ny (
EA
IIDC
) ar
e su
bsid
iarie
s of
the
com
pany
as
Mar
ico
Mid
dle
Eas
t FZE
, a s
ubsi
diar
y of
the
Com
pany
, hol
ds 1
00%
sta
ke in
KM
E, M
ELC
C a
nd E
AIID
C,
c)
Mar
ico
Sou
th A
frica
(Pty
) Lim
ited
(MS
A) i
s a
subs
idia
ry o
f the
com
pany
as
Mar
ico
Sou
th A
frica
Con
sum
er C
are
(Pty
) Lim
ited
(MS
AC
C),
a su
bsid
iary
of t
he C
ompa
ny, h
olds
100
% s
take
in M
SA
,
d)
Mar
ico
Egy
pt In
dust
ries
Com
pany
is a
sub
sidi
ary
of th
e th
e C
ompa
ny, a
s M
ELC
C w
hich
hol
ds 1
00%
sta
ke in
ME
IC is
a 1
00%
sub
sidi
ary
of M
ME
, whi
ch is
a 1
00%
sub
sidi
ary
of th
e C
ompa
ny.
e)
Der
ma
Rx
Inte
rnat
iona
l Aes
thet
ics
Pte
. Ltd
(DIA
L) is
a s
ubsi
diar
y of
the
the
Com
pany
, as
Kay
a Li
mite
d (K
AL)
, a
subs
idia
ry o
f the
Com
pany
, hol
ds 1
00%
sta
ke in
DIA
L.
f) Th
e D
Rx
Clin
ic P
te. L
td (D
CP
L), T
he D
Rx
Med
ispa
Pte
. Ltd
(DM
SP
L), D
Rx
Inve
stm
ents
Pte
. Ltd
(DIP
L) a
re s
ubsi
diar
ies
of th
e co
mpa
ny, a
s D
IAL
whi
ch h
olds
100
% s
take
DC
PL,
DM
SP
L,D
IPL
, is
a 10
0% s
ubsi
diar
y of
KA
L , w
hich
is a
100
%
subs
idia
ry o
f the
Com
pany
,
g)
DR
x A
esth
etic
s S
dn B
hd (D
AS
B) i
s a
subs
idia
ry o
f the
Com
pany
, as
DIP
L w
hich
hol
ds 1
00%
sta
ke in
DA
SB
is a
100
% s
ubsi
diar
y of
DIA
L, w
hich
is a
100
% s
ubsi
diar
y of
the
Com
pany
,
h)
Bea
uté
Cos
mét
ique
Soc
ieté
Par
Act
ions
(BC
S) a
nd T
huan
Pha
t Foo
dstu
ff Jo
int s
tock
Com
pany
(TP
) are
sub
sidi
arie
s of
the
Com
pany
, as
Inte
rnat
iona
l Con
sum
er P
rodu
cts
Cor
pora
tion(
ICP
) whi
ch h
olds
99.
8% s
take
in B
CS
and
98.
6%
stak
e in
TP,
is a
sub
sidi
ary
in w
hich
the
Com
pany
hol
d 85
% s
take
.”
For
and
On
beh
alf o
f Boa
rd o
f Dire
ctor
s
HA
RS
H M
AR
IWA
LA
Cha
irman
and
Man
agin
g D
irect
or
NIK
HIL
KH
AT
TAU
D
irect
or a
nd C
hairm
an o
f Aud
it C
omm
ittee
MIL
IND
SA
RW
ATE
G
roup
Chi
ef F
inan
cial
Offi
cer a
nd C
hief
Hum
an R
esou
rce
Offi
cer
HE
MA
NG
I GH
AG
C
ompa
ny S
ecre
tary
& C
ompl
ianc
e O
ffi ce
r
Pla
ce :
Mum
bai
Dat
e :
May
3, 2
012

M A R I C O L I M I T E D
165
statem
ent p
ursu
ant t
o sec
tion 2
12(8
) of t
he co
mpan
ies ac
t, 19
56.
As
per
AS
21
issu
ed b
y th
e In
stitu
te o
f Cha
rtere
d A
ccou
ntan
ts o
f Ind
ia, t
he fi
nanc
ial s
tate
men
ts o
f the
Com
pany
refl e
ctin
g th
e co
nsol
idat
ion
of th
e ac
coun
ts o
f its
sub
sidi
ary
com
pani
es to
the
exte
nt o
f equ
ity h
oldi
ng o
f the
com
pani
es a
re
incl
uded
in th
e re
port.
In te
rms
of a
ppro
val g
rant
ed b
y th
e C
entra
l Gov
ernm
ent,
Dep
t. of
Com
pany
Affa
irs v
ide
App
rova
l let
ter n
o. 4
7/31
3/20
10-C
L-III
dat
ed M
ay 1
0, 2
010
u/s
212
(8) o
f the
Com
pani
es A
ct, 1
956,
cop
y of
the
Bal
ance
She
et, P
rofi t
and
Los
s ac
coun
t, re
port
of th
e B
oard
of D
irect
ors
and
the
repo
rt of
the
Aud
itors
of t
he s
ubsi
diar
y co
mpa
nies
hav
e no
t bee
n at
tach
ed to
this
ann
ual r
epor
t. Th
e ac
coun
ts o
f the
se c
ompa
nies
hav
e be
en s
epar
atel
y au
dite
d as
per
Gen
eral
ly A
ccep
ted
Acc
ount
ing
Prin
cipl
es /
Pra
ctic
es a
s ap
plic
able
in th
eir r
espe
ctiv
e ju
risdi
ctio
n of
the
coun
try o
f inc
orpo
ratio
n. A
sta
tem
ent p
ursu
ant t
o th
e ab
ove
orde
r giv
ing
deta
ils o
f the
sub
sidi
arie
s is
atta
ched
her
ewith
:(A
mou
nt in
Cro
re)
Sr.
No.
Nam
e of
the
sub
sid
iary
com
pan
yR
epor
ting
C
urre
ncy
Exc
hang
e R
ate
Cap
ital
Res
erve
s To
tal
Ass
ets
Tota
l Li
abili
ties
Det
ails
of I
nves
tmen
t(E
xclu
din
g In
vest
men
t in
Sub
sid
iarie
s)Tu
rnov
erP
rofit
/(
Loss
) B
efor
e Ta
x
Pro
visi
on
for
Tax
Pro
fit /
(Los
s)
Afte
r Ta
x
Pro
pos
ed D
ivid
end
in
clud
ing
Div
iden
d
dec
lare
d d
urin
g th
e ye
ar
1M
aric
o B
angl
ades
h Li
mite
dB
DT
Rs.
0.6
21
31.
50
19.
56
228
.82
142
.10
420
.26
260
.99
159
.94
99.
33
0.0
1 0
.01
603
.63
374
.85
70.
21
43.
60
16.6
5 1
0.34
53
.56
33.
26 3
7.80
2
3.47
2M
BL
Indu
strie
s Li
mite
dB
DT
Rs.
0.6
21 0
.10
0.0
6 2
.73
1.7
0 3.
42 2
.12
0.5
9 0
.37
–
– –
–
0.
260.
160.
10
0.0
6 0,
160.
10 –
–
3K
aya
Lim
ited
Rs.
Rs.
1.0
00
14.
50
14.
50
(59.
09)
(59.
09)
113
.52
113
.52
158
.10
158
.10
– – 1
29.6
3 1
29.6
3 (2
.97)
(2.9
7) (0
.02)
(0.0
2) (2
.94)
(2.9
4) – –
4M
aric
o M
iddl
e E
ast
FZE
AE
DR
s. 1
3.85
1 2
.20
30.
47
(0.1
7) (2
.40)
13.
88
192
.22
11.
85
164
.15
– –
15.
10 2
09.1
7 (0
.07)
(0.9
8) – –
(0.0
7) (0
.98)
– –
5K
aya
Mid
dle
Eas
t FZE
AE
DR
s. 1
3.85
1 0
.02
0.2
1 (4
.50)
(62.
27)
4.26
5
8.98
8.7
4 1
21.0
4 –
–
6.
51
90.2
3 (3
.18)
(44.
01)
– – (3
.18)
(44.
01)
–
–
6M
EL
Con
sum
er C
are
SA
EE
GP
Rs.
8.4
23 0
.03
0.2
1 (0
.91)
(7.6
8)3.
64 3
0.66
4.5
3 3
8.12
– –
–
– (0
.01)
(0.1
2) –
–
(0.0
1) (0
.12)
–
–
7E
gypt
ian
Am
eric
an In
vest
men
t and
In
dust
rial D
evel
opm
ent C
ompa
ny
EG
PR
s.8.
423
0.6
9 5
.81
(1.8
2) (1
5.33
)1.
33 1
1.16
2.4
6 2
0.68
–
–
1.
8415
.50
(0.4
4) (2
.77)
–
–
(0.4
4) (2
.77)
– –
8M
aric
o S
outh
Afri
ca C
onsu
mer
Car
e (P
ty) L
imite
dZA
RR
s.6.
634
0.0
1 0
.01
4.0
1 2
6.62
12
.40
82.1
8 8
.37
55.
55
– –– –
(0.0
4) (0
.28)
– – (0
.04)
(0.2
8) –
–
9M
aric
o S
outh
Afri
ca (P
ty) L
imite
dZA
RR
s. 6
.634
0
.01
0.0
1 0
.44
2.9
5 10
.45
69.
239.
99
66.
28
– –
15.7
3 1
04.3
3 0
.18
1.21
0.0
6 0
.41
0.1
20.
81 – –
10M
aric
o E
gypt
Indu
strie
s C
ompa
nyE
GP
Rs.
8.4
23 1
.23
10.
35
5.2
8 4
4.47
9.
03
76.0
5 2
.52
21.
24– –
7.18
60.4
5 0.
95
8.0
2 – –
0.
95
8.02
– –
11M
aric
o M
alay
sia
Sdn
. Bhd
.M
YR Rs.
16.6
17
1.7
7 2
9.35
(0
.32)
(5.3
2)2.
39 3
9.65
0.9
4 1
5.63
– –
1.32
21.9
6 (0
.12)
(2.0
3) – –
(0.1
2) (2
.03)
– –
12D
erm
a R
x In
tern
atio
nal A
esth
etic
s P
te.
Ltd.
S
GD
Rs.
40.8
29 0
.70
28.5
8 0
.11
4.52
4.23
172.
78 3
.42
139.
68– –
0.3
815
.37
0.4
4 18
.13
0.10
4.15
0
.34
13.9
8 –
–
13Th
e D
Rx
Clin
ic P
te. L
td.
S
GD
Rs.
40.
829
0.0
1 0
.41
0.2
3 9.
54
0.3
4 1
3.68
0.0
9 3
.74
– –0.
98
39.
96 0
.28
11.
38 (0
.02)
(1
.01)
0
.30
12.3
9 – –
14Th
e D
Rx
Med
ispa
Pte
. Ltd
. S
GD
Rs.
40.
829
0.0
1 0.
41 (0
.03)
(1.2
5)0.
33
13.6
2 0
.35
14.4
6– –
0.6
6 26
.79
0.1
97.
80 0
.02
0.99
0.1
7 6.
81 – –
15D
Rx
Inve
stm
ents
Pte
. Ltd
.
SG
DR
s. 4
0.82
9 0
.07
3.06
(0.0
8) (3
.10)
0.0
1 0.
48 0
.01
0.52
– – –
–
(0
.01)
(0.4
1) – –
(0
.01)
(0.4
1) – –
16D
Rx
Aes
thet
ics
Sdn
. Bhd
.
MYR Rs.
16.
617
0.1
0 1.
65 (0
.25)
(4.1
7) 0
.04
0.60
0.1
9 3.
12– –
0.0
71.
24 0
.01
0.18
(0.0
1 )
(0.1
7) 0
.01
0.19
– –
17In
tern
atio
nal C
onsu
mer
Pro
duct
s C
orpo
ratio
n
VND
Rs.
0.0
0244
011
,217
.76
27.
37 1
7,22
3.71
4
2.03
34
,049
.38
83.
08 5
,607
.91
13.
68
1,00
0.00
2.
44
59,3
41.3
3 1
44.7
9 5,
358.
2013
.07
592.
84 1
.45
4,76
5.36
3.
01
–
18B
eaut
é C
osm
étiq
ue S
ocie
té P
ar A
ctio
ns
VND
Rs.
0.0
0244
0 2
,000
.00
4.8
890
4.30
2.
214,
311.
07 1
0.52
1,4
06.7
6 3
.43
–
– 9
,753
.74
23.
80
916.
35
2.24
2
65.2
9 0
.65
651.
06
1.58
– –
19Th
uan
Phat
Foo
dstu
ff Jo
int s
tock
Com
pany
VN
DR
s. 0
.002
440
3,1
40.0
0 7
.66
(283
.33)
(0
.69)
5,
882.
25
14.
35 3
,025
.58
7.3
8 –
–
9,1
59.0
522
.35
(657
.62)
(1.6
0) –
–
(6
57.6
2) (1
.60)
– –
The
amou
nts
give
n in
the
tabl
e ab
ove
are
from
the
annu
al a
ccou
nts
mad
e fo
r the
resp
ectiv
e fi n
anci
al y
ear e
nd fo
r eac
h of
the
com
pani
es.
The
Indi
an ru
pee
equi
vale
nts
of th
e fi g
ures
giv
en in
fore
ign
curre
ncie
s in
the
acco
unts
of t
he s
ubsi
diar
y co
mpa
nies
, hav
e be
en g
iven
bas
ed o
n th
e ex
chan
ge ra
tes
as o
n M
arch
31,
201
2.
Und
erta
king
:
We
unde
rtake
that
the
annu
al a
ccou
nts
of th
e su
bsid
iary
com
pani
es a
nd th
e re
late
d de
taile
d in
form
atio
n w
ill be
mad
e av
aila
ble
to th
e sh
areh
olde
rs, w
ho s
eek
such
info
rmat
ion,
at a
ny p
oint
of t
ime.
The
ann
ual a
ccou
nts
of th
e su
bsid
iary
com
pani
es
will
also
be
kept
for i
nspe
ctio
n by
the
inve
stor
in th
e R
egis
tere
d / H
ead
offi c
e of
Mar
ico
and
that
of s
ubsi
diar
y co
mpa
nies
con
cern
ed.
For
and
On
beh
alf o
f Boa
rd o
f Dire
ctor
s H
AR
SH
MA
RIW
ALA
C
hairm
an a
nd M
anag
ing
Dire
ctor
N
IKH
IL K
HA
TTA
U
Dire
ctor
and
Cha
irman
of A
udit
Com
mitt
ee
MIL
IND
SA
RW
ATE
G
roup
Chi
ef F
inan
cial
Offi
cer
HE
MA
NG
I GH
AG
C
ompa
ny S
ecre
tary
& C
ompl
ianc
e O
ffi ce
r P
lace
: M
umba
iD
ate
: May
03,
201
2

M A R I C O L I M I T E D
166
The highlights pertains to the fi nancial performance of Marico Consolidated Amount in Rs. Crore
Year ended March 31, 2003 2004 2005 2006 2007 2008 2009 2010 2011 2012
Income from Operations 775.5 888.5 1,007.0 1,143.9 1,556.9 1,905.0 2,388.4 2,660.8 3,135.0 4,008.3
EBITDA 75.7 74.5 88.3 144.3 198.7 246.4 304.0 375.1 418.1 484.4
Profi t before Interest & Tax (PBIT) 64.9 64.5 75.0 103.1 156.7 225.1 280.4 333.3 368.5 444.5
Profi t before Tax 63.8 63.3 73.0 98.0 136.0 194.5 244.7 307.7 327.5 402.1
Extraordinary / Exceptional items – – – – (14.0) (10.6) 15.0 9.8 (48.9) 1.8
Profit before Tax (PBT) 64.0 65.1 74.3 98.0 150.1 205.0 229.6 296.0 371.4 395.4
Profi t after Tax (PAT) 56.2 59.0 70.1 86.9 112.9 169.1 188.7 231.7 286.4 317.1
Cash Profits (Profit after Current Tax +Depreciation + Amortisation)
78.2 72.1 82.8 137.2 187.1 220.1 258.4 330.8 400.3 391.7
Economic Value Added 31.3 38.2 46.0 50.7 79.3 131.5 144.4 196.0 174.7 198.6
Goodwill on consolidation – – 1.7 1.7 45.0 84.2 85.0 85.0 397.6 395.5
Net Fixed Assets 105.7 112.5 145.9 381.3 165.4 257.3 311.1 399.7 457.8 501.8
Investments 13.9 0.5 12.4 18.5 0.0 0.0 13.0 82.7 185.2 277.2
Net Current Assets 93.9 90.2 128.3 107.7 117.7 233.0 355.3 483.3 293.8 404.3
Miscellaneous Expenditure 0.7 0.5 0.4 0.3 0.1 – – – – –
Deferred Tax Asset – – – – 115.2 98.2 64.1 61.6 29.9 22.3
Total Capital Employed 214.1 203.6 288.7 509.4 443.3 672.7 828.5 1,112.4 1,364.3 1,601.1
Equity Share Capital 29.0 29.0 58.0 58.0 60.9 60.9 60.9 60.9 61.4 61.5
Advance against Equity – 0.2 – – – – – – – –
Preference Share Capital 29.0 – – – – – – – – –
Reserves 135.0 155.2 158.9 203.5 131.5 253.7 392.6 593.0 854.0 1,081.5
Net Worth 193.0 184.4 216.9 261.5 192.4 314.6 453.5 654.0 915.5 1,143.0
Minority interest 3.1 1.9 – – 0.0 0.1 – 12.5 21.9 24.9
Borrowed Funds 12.0 11.1 65.7 239.7 251.0 358.0 375.0 445.9 382.3 389.0
Deferred Tax Liability 6.1 6.2 6.1 8.3 – – – – – –
Total Funds Employed 214.1 203.6 288.7 509.4 443.3 672.7 828.5 1,112.4 1,319.7 1,556.9
EBITDA Margin (%) 9.8 8.4 8.8 12.6 12.8 12.9 12.7 14.1 13.3 12.1
Profi t before Tax to Turnover (%) 8.2 7.3 7.4 8.6 9.6 10.8 9.6 11.1 11.8 9.9
Profi t after Tax to Turnover (%) 7.2 6.6 7.0 7.6 7.3 8.9 7.9 8.7 9.1 7.9
Return on Net Worth (%)
(PAT / Average Net Worth $) 28.8 31.2 35.0 36.3 49.7 66.7 49.1 41.8 36.5 30.8
Return on Capital Employed
(PBIT* / Average Total Capital Employed @) 30.8 31.7 31.0 25.8 35.8 40.3 37.4 34.2 25.8 29.6
Net Cash Flow from Operations per share(Rs.) (Refer Cash Flow Statement)##, ### 2.2 2.7 0.7 2.8 3.1 2.3 3.0 3.4 4.0 6.6
Earning per Share ( EPS ) (Rs.)
(PAT / No. of Equity Shares)##, ### 1.9 2.0 1.2 1.5 1.9 2.8 3.1 3.8 4.7 5.2
Economic Value Added per share (Rs.)(Refer Management Discussion)##, ### 1.1 1.3 0.8 0.9 1.3 2.2 2.4 3.2 2.8 3.2
Dividend per share (Rs.) ##, ### 0.5 0.4 0.5 0.6 0.7 0.7 0.7 0.7 0.7 0.7
Debt / Equity 0.1 0.1 0.3 0.9 1.3 1.1 0.8 0.7 0.4 0.3
Book Value per share (Rs.)
(Net Worth / No. of Equity Shares) ##, ### 6.7 6.4 3.7 4.5 3.2 5.2 7.4 10.7 14.9 18.6
Sales to Average Capital Employed @ 3.7 4.3 4.1 2.9 3.3 3.4 3.2 2.7 2.2 2.8
Sales to Average Net Working Capital # 9.6 9.7 9.2 9.7 13.8 10.9 8.1 6.3 5.3 11.5
* PBIT includes extraordinary items@ Average Capital Employed = (Opening Capital Employed + Closing Capital Employed)/2$ Average Net Worth = (Opening Net Worth + Closing Net Worth)/2# Average Net Working Capital = (Opening Net Current Assets + Closing Net Current Assets)/2## Per share information for 2004-05 is re-calculated on enhanced equity share capital of Rs. 58 Crores (5.8 Crore shares)### Previous year fi gures have been recomputed based on the post split face value of Re 1Note 1: 1 crore equals 10 millionNote 2: FY11 & FY12 fi gures are as per revised Schedule VI
10 years highlights

M A R I C O L I M I T E D
167
2011-12 (Amount in Rupees Crore)
Particulars Three Month Ended Annual
Jun. 30, 11 Sept. 30, 11 Dec. 31,11 Mar. 31, 12 FY12
Total Revenue 1,057.6 986.5 1,067.4 929.4 4,040.9
Total Expenditure 923.4 857.8 933.7 809.0 3,523.9
Finance Charges 9.8 10.5 10.9 11.2 42.4
Gross profi t after Finance Charges but before Depreciation and Taxation
124.4 118.2 122.8 109.2 474.6
Depreciation and Amortisation 16.90 17.7 18.8 19.1 72.5
Profit before Taxation and Exceptional Item 107.5 100.5 103.9 90.1 402.1
Exceptional Item - - - (1.8) (1.8)
Profit before Tax 107.5 100.5 103.9 88.4 400.3
Minority Interest and Goodwill on consolidation 1.5 1.7 2.0 (0.2) 5.0
Profi t before Tax after minority interest & goodwill 106.0 98.8 101.9 88.6 395.4
Provision for Tax (Current) 25.1 25.9 24.5 19.1 94.7
MAT Credit (6.1) (6.1) (9.8) (0.4) (22.3)
Profit after Tax (Current) 87.0 79.0 87.2 69.9 323.0
Provision for Tax ( Deferred Taxation) 2.0 0.7 3.1 0.1 5.9
Profit after Tax 85.0 78.3 84.1 69.7 317.1
Equity Share Capital 61.5 61.5 61.5 61.5 61.5
Earning per Share - (Rs.) 1.4 1.3 1.4 1.1 5.2
2010-11 (Amount in Rupees Crore)
Particulars Three Month Ended Annual
Jun. 30, 10 Sept. 30, 10 Dec. 31,10 Mar. 31, 11 FY11
Total Revenue 791.7 783.1 824.6 756.7 3,156.2
Total Expenditure 673.0 668.5 708.5 666.9 2,716.9
Finance Charges 7.0 6.5 7.6 20.0 41.0
Gross profi t after Finance Charges but before Depreciation and Taxation
111.7 108.1 108.5 69.8 398.3
Depreciation and Amortisation 12.0 14.0 14.6 30.2 70.8
Profit before Taxation and Exceptional Item 99.7 94.2 93.9 39.8 327.5
Exceptional Item (8.8) (8.2) (9.6) 75.5 48.9
Profit before Tax 90.9 86.0 84.3 115.3 376.4
Minority Interest and Goodwill on consolidation 1.0 1.8 1.5 0.8 5.0
Profi t before Tax after minority interest & goodwill 89.9 84.2 82.9 114.4 371.4
Provision for Tax (Current) 22.9 24.0 20.3 29.7 96.9
MAT Credit (6.7) (11.6) (15.1) (10.2) (43.6)
Profit after Tax (Current) 73.7 71.7 77.6 94.9 318.1
Provision for Tax (Deferred Taxation) 0.0 0.2 8.1 23.3 31.6
Profit after Tax 73.7 71.6 69.5 71.6 286.4
Equity Share Capital 60.9 61.4 61.4 61.4 61.4
Earning per Share - (Rs.) 1.2 1.2 1.1 1.2 4.7
Note: Figures are as per revised Schedule VI
consolidated quarterly financials

M A R I C O L I M I T E D
168
NOTICENOTICE is hereby given that the Twenty Fourth Annual General Meeting of Marico Limited will be held on Friday, August 3, 2012
at 4.00 p.m. at The National Stock Exchange of India Limited, ‘NSE Auditorium’, Ground Floor, Exchange Plaza, Bandra-Kurla
Complex, Bandra (East), Mumbai - 400051 to transact the following business:
ORDINARY BUSINESS
1. To receive, consider and adopt the audited Balance Sheet as at March 31, 2012 and the Profi t and Loss Account of the
Company for the year ended on that date together with the Reports of the Directors and the Auditors.
2. To confi rm interim dividends of Re. 0.30 and Re. 0.40 per equity share of Re. 1 each, declared for the fi nancial year ended
March 31, 2012.
3. To appoint a Director in place of Mr. Anand Kripalu, who retires by rotation, and being eligible, offers himself for re-appointment.
4. To appoint a Director in place of Mr. B. S. Nagesh, who is liable to retire, and being eligible, offers himself for re-appointment.
5. To appoint M/s. Price Waterhouse, Chartered Accountants, as Statutory Auditors of the Company to hold offi ce from
the conclusion of this Annual General Meeting until the conclusion of the next Annual General Meeting and to fi x their
remuneration for the said period.
NOTES:
1. A member entitled to attend and vote at the meeting is entitled to appoint a proxy to attend and vote instead of himself
and the proxy need not be a member of the Company. The instrument appointing the proxy, in order to be effective,
must be deposited at the registered office of the Company, duly completed and signed, not less than 48 hours before
the commencement of the meeting. A Proxy Form is annexed to this report. Proxies submitted on behalf of the limited
companies, societies, etc., must be supported by an appropriate resolution/authority, as applicable.
2. Members/proxies should bring duly fi lled attendance slips sent herewith to attend the meeting.
3. The Register of Members and Share Transfer Books of the Company will remain closed from Wednesday, August 1, 2012 to
Friday, August 3, 2012, both days inclusive, for the purpose of the Annual General Meeting.
4. All dividends declared for and upto the 3rd interim dividend 2004-05 on equity shares and the preference shares of the
Company & preference shares redemption amount, which remained unclaimed for a period of seven years as per Section
205A of the Companies Act, 1956 (the Act), have been transferred to the Investor Education and Protection Fund (IEPF)
established by the Central Government under Section 205C of the Act.
Members, who have not yet encashed their dividend warrant(s), for any dividends declared after the aforesaid dividends, are
requested to forward their claims to the Registrar and Share Transfer Agents, M/s. Link Intime India Pvt. Ltd. or the Company
at its registered address.
It may be noted that once the unclaimed dividend is transferred to the IEPF, as above, no claim shall lie against the Company
or the aforesaid Fund in respect of such amount.
5. Members whose shareholding is in the electronic mode are requested to direct change of address notifi cations and
updations of bank mandates (details of bank name and account no.) to their respective Depository Participants. Members
other than those holding shares in electronic mode are requested to direct change of address notifi cation and updation of
bank mandates, if any, to the Registrar and Share Transfer Agents, M/s Link Intime India (Pvt.) Limited (Unit: Marico Ltd.),
C -13 Pannalal Silk Mills Compound, LBS Road, Bhandup (West), Mumbai 400 078. Tel.: 022-25946970, Fax: 022-25946969,
E-mail id: [email protected]
6. Additional information on Directors seeking re-election at the Annual General Meeting is available in the Corporate Governance
Report forming part of the Annual Report for the year 2011-12.
7. In compliance with the Secretarial Standards and as a good governance practice, your Company does not give gifts to its
members and also does not offer its products at discounted rates. However, your Company is committed to shareholders’
wealth maximization through superior performance refl ected in corporate benefi ts like dividend and increased market
capitalization.

M A R I C O L I M I T E D
169
8. Your Company solicits your support to the “Go-Green Initiative” introduced by the Ministry of Corporate Affairs (“MCA”).
The Company has already approached the members for their consent to allow paperless compliances by serving documents
through electronic mode. The Company proposes to send documents like the notice calling the general meetings, audited
fi nancial statements, directors’ report, auditors’ report, etc. in electronic form, at the email address provided by you and/or
made available to us by the Depositories and as confi rmed with you. Members holding shares in demat mode who have not
registered their e-mail address are requested to register the same with their respective Depository Participants. Members
holding shares in physical form are requested to provide with their email address to the Company or M/s. Link Intime India
Pvt. Ltd, the Registrar & Share Transfer Agents.
You may also note that M/s. Link Intime India Pvt Ltd has provided a facility on its website http://www.linkintime.co.in/newsite/
goGreen.jsp to enable shareholders to register their e-mail address(s) in order to participate in the “Go-Green Initiative”.
You may please use this facility to register your email address(s).
For the members who desire to receive the above mentioned documents in physical form only, they may send a request in
writing to the Company for the same.
Further, you may note that the members who have registered their email addresses with the Company in support of the Green
Initiative may anytime request for any of the documents mentioned above in physical form by sending a request in writing to
the Company. The Company shall upon such request furnish free of cost copies of such documents requested for.
Place: Mumbai By Order of the Board
Date : May 3, 2012 For MARICO LIMITED
Registered Office:
“Rang Sharda” Hemangi GhagKrishnachandra Marg, Bandra Reclamation, Company Secretary andBandra (West), Mumbai - 400 050 Compliance Officer
NOTICE

M A R I C O L I M I T E D
170

MARICO LIMITEDRegistered Offi ce : “Rang Sharda”, Krishnachandra Marg, Bandra Reclamation, Bandra (West), Mumbai - 400 050.
PROXY FORM
TWENTY FOURTH ANNUAL GENERAL MEETING ON FRIDAY, AUGUST 3, 2012 AT 4:00 P.M.
Regd. Folio No. / DP Client ID
No. of shares held
I/We__________________________________________ of _____________________ being a member of the above-named Company
hereby appoint __________________________________ of _______________ or failing him ________________________________
______ of _________________________ as my/our proxy to vote for me/us on my/our behalf at the TWENTY FOURTH ANNUAL
GENERAL MEETING of the Company to be held at The National Stock Exchange of India Limited, ‘NSE Auditorium’, Ground
Floor, Exchange Plaza, Bandra-Kurla Complex, Bandra (East), Mumbai – 400051 at 4.00 p.m. on Friday, August 3, 2012 and at
any adjournment(s) thereof.
Signed this_________day of _____________ 2012 Signature
Notes: 1. A Member entitled to attend and vote is entitled to appoint a proxy to attend and vote instead of himself. 2. A Proxy need not be a Member.3. This form in order to be effective must be duly stamped, completed and signed and must be deposited at the Registered Offi ce
of the Company, not later than 48 hours before the commencement of the meeting.
Affi x One
RupeeRevenueStamp
MARICO LIMITEDRegistered Offi ce: “Rang Sharda”, Krishnachandra Marg, Bandra Reclamation, Bandra (West), Mumbai - 400 050.
ATTENDANCE SLIP
TWENTY FOURTH ANNUAL GENERAL MEETING ON FRIDAY, AUGUST 3, 2012 AT 4:00 P.M.
Regd. Folio No. / DP Client ID
No. of shares held
I certify that I am a registered shareholder /proxy for the registered shareholder of the Company.
I hereby record my presence at the TWENTY FOURTH ANNUAL GENERAL MEETING of the Company to be held at
The National Stock Exchange of India Limited, ‘NSE Auditorium’, Ground Floor, Exchange Plaza, Bandra-Kurla Complex,
Bandra (East), Mumbai – 400051 at 4.00 p.m. on Friday, August 3, 2012.
Member’s / Proxy’s name in BLOCK letters Member’s / Proxy’s signature
Note : Please fi ll in the attendance slip and hand it over at the entrance of the Meeting Hall.


Dear Shareholder(s),
Sub: Dividend Disbursement through National Electronic Clearing Service (NECS)
Currently, as per directive from Securities and Exchange Board of India, all companies use Electronic Clearing Service (ECS)
facility introduced by Reserve Bank of India (RBI) for disbursing dividends. In this system, the shareholder’s bank account is
directly credited under advice to the shareholder.
As advised by the Reserve Bank of India (RBI), the remittance of money through ECS is proposed to be replaced by National
Electronic Clearing Service (NECS). The advantages of NECS over ECS include faster credit of remittances to benefi ciary’s
account, coverage of more branches as also ease of operation.
NECS essentially operates on the new and unique bank account number, allotted by banks post implementation of Core Banking
Solutions (CBS) for centralized processing of inward instructions and effi ciency in handling bulk transactions.
Please follow the below mentioned procedure for updating your new CBS bank account number:
A. For shareholders holding shares in Demat form
In case you hold your shares in demat form, please furnish your new bank account number allotted to you by your bank
after implementation of CBS, along with a photocopy of a cheque pertaining to the concerned account, to your Depository
Participant (DP).
Please do not send the same to the company or to the R&T Agent.
B. For shareholders holding shares in physical form
In case you hold your shares in physical form, please furnish the new Bank Account Number allotted to you by your bank
after implementation of CBS, in the form printed overleaf.
Please do not e-mail or fax the same.
In your own interest please comply with the above requirement at the earliest possible, so that the bank details are
updated before the payment of future dividends.
If you do not provide your new bank account number, allotted after implementation of CBS by your Bank, then please
note that ECS to your old account may either be rejected or returned, which will delay the payment of dividend to you.
In case you have already provided your new bank account number, this communication may be ignored. Assuring you
of our best services at all times.
Yours faithfully,
For Marico Limited
Hemangi Ghag
Company Secretary and
Compliance Officer

To be filled, signed and returned in original by a shareholder holding shares in physical form. Shareholders holding shares
in demat form are requested to give the bank details to their DP and not to the Company.
M/s Link Intime India Pvt. LimitedUnit: Marico LimitedC -13 Pannalal Silk Mills Compound,LBS Road, Bhandup (West),Mumbai 400 078.
Tel.: 022 - 25946970
Dear Sirs,
Sub: Updation of new bank account number for dividend payment through NECS
This has reference to your communication regarding National Electronic Clearing Service (NECS), printed overleaf. Since banks
have changed the customer account number post migration to Core Banking Solution (CBS), I request you to update the bank
details against my folio as per details given below:
Folio No.
No. of Shares
First Holder’s Name
Contact Telephone Number (with STD code)
Personal E-mail ID
New Account no. after implementation of CBS
Bank Name
Bank Branch & Address
9 Digit Bank Code No. (as printed on the cheque leaf)
RTGS / NEFT IFSC Code (as printed on the cheque leaf)
(A cancelled cheque leaf from the cheque book issued by bank for the operation of the above account is enclosed )
If the payment transaction is delayed or not effected at all for any reason(s) beyond the control of the Company, I would not hold
the company responsible.
Yours truly,
(Signature of fi rst named shareholder)

175


Notes

Notes

If indeliv
ere
d, ple
ase r
etu
rn to:
Bo
ok-P
ost
To
,