052012 About the 2012 Researchhriq.allied.com/pdfs/AlliedWorkforceMobilitySurvey.pdf2012 Allied...
16
IQ 2012 Allied Workforce Mobility Survey : Onboarding and Retention www.alliedHRIQ.com 05/2012 ©2012 Allied Van Lines, Inc. U.S. DOT No. 076235, ALLIED and ALLIED ROADWAY DESIGN are registered trademarks and service marks of Allied Van Lines, Inc. About the 2012 Research The 2012 Allied Workforce Mobility Survey, conducted in March 2012, captures the voice of HR professionals on critical topics relating to “workforce mobility,” which is defined as the willingness and ability of employees to relocate for a job with either a current or new employer. The survey approaches workforce mobility from two angles. One set of questions assesses the “mobility environment,” the context in which relocation occurs, including economic, cultural, demographic and organizational variables. The second set of questions examines HR topic areas related to or affected by workforce mobility: recruitment, relocation, onboarding and retention. These topics encompass a broad range of activities and responsibilities for HR professionals, not limited to moving or relocating. The survey was intended to identify tools and practices, as well as measures for success in these areas. Study results are scheduled to be released in stages: Recruiting and Relocation: April 30 Retention and Onboarding: May 21 Further Survey Details and Analysis: June 11 1 Survey Methodology The 2012 Allied Workforce Mobility Survey was conducted online with 500* human resources professionals from 49 states and the District of Columbia. The vast majority of respondents are employed by companies (95 percent vs. 5 percent external contractors), across a broad spectrum of HR titles, companies and industries. Respondent Responsibilities Within HR: HR managers/supervisors ........................................................................................ 28% HR generalists............................................................................................................ 24% Recruiters ................................................................................................................... 14% HR assistants ............................................................................................................. 13% C-level/Directors/VPs ............................................................................................... 11% *A sample of 500 yields a confidence interval of 95 percent ± 4 percent. Sponsored by Allied Van Lines, the survey is intended as a service to human resources professionals and is part of a larger ongoing initiative, Allied HR IQ, which will conduct additional research projects, host events and facilitate discussions in the HR community via the Allied HR IQ website. The topic areas and questions for the survey were determined through collaborative discussions involving Allied Van Lines, Allied’s independent research partners, and distinguished HR professionals.
Transcript of 052012 About the 2012 Researchhriq.allied.com/pdfs/AlliedWorkforceMobilitySurvey.pdf2012 Allied...

IQ2012 Allied Workforce Mobility Survey: Onboarding and Retentionwww.alliedHRIQ.com 05/2012
©2012 Allied Van Lines, Inc. U.S. DOT No. 076235, ALLIED and ALLIED ROADWAY DESIGN are registered trademarks and service marks of Allied Van Lines, Inc.
About the 2012 Research The 2012 Allied Workforce Mobility Survey, conducted in March 2012, captures the
voice of HR professionals on critical topics relating to “workforce mobility,” which is
defined as the willingness and ability of employees to relocate for a job with either a
current or new employer.
The survey approaches workforce mobility from two angles. One set of questions
assesses the “mobility environment,” the context in which relocation occurs,
including economic, cultural, demographic and organizational variables.
The second set of questions examines HR topic areas related to or affected by
workforce mobility: recruitment, relocation, onboarding and retention. These topics
encompass a broad range of activities and responsibilities for HR professionals,
not limited to moving or relocating. The survey was intended to identify tools and
practices, as well as measures for success in these areas.
Study results are scheduled to be released in stages: � Recruiting and Relocation: April 30
� Retention and Onboarding: May 21
� Further Survey Details and Analysis: June 11
1
Survey MethodologyThe 2012 Allied Workforce Mobility Survey was conducted online with 500* human
resources professionals from 49 states and the District of Columbia. The vast
majority of respondents are employed by companies (95 percent vs. 5 percent
external contractors), across a broad spectrum of HR titles, companies and
industries.
Respondent Responsibilities Within HR:HR managers/supervisors ........................................................................................28%
HR generalists............................................................................................................24%
Recruiters ...................................................................................................................14%
HR assistants .............................................................................................................13%
C-level/Directors/VPs ...............................................................................................11%
*A sample of 500 yields a confidence interval of 95 percent ± 4 percent.
Sponsored by Allied Van Lines, the survey is intended as a service to human
resources professionals and is part of a larger ongoing initiative, Allied HR IQ, which
will conduct additional research projects, host events and facilitate discussions in
the HR community via the Allied HR IQ website.
The topic areas and questions for the survey were determined through collaborative
discussions involving Allied Van Lines, Allied’s independent research partners, and
distinguished HR professionals.

IQ2012 Allied Workforce Mobility Survey: Onboarding and Retentionwww.alliedHRIQ.com 05/2012
©2012 Allied Van Lines, Inc. U.S. DOT No. 076235, ALLIED and ALLIED ROADWAY DESIGN are registered trademarks and service marks of Allied Van Lines, Inc.
2
Source: 2012 Allied Workforce Mobility Survey AlliedHRIQ.com
Source: 2012 Allied Workforce Mobility Survey AlliedHRIQ.com
Source: 2012 Allied Workforce Mobility Survey AlliedHRIQ.com
IQ2012 Allied Workforce Mobility Survey: Onboarding and Retentionwww.alliedHRIQ.com 05/2012
©2012 Allied Van Lines, Inc. U.S. DOT No. 076235, ALLIED and ALLIED ROADWAY DESIGN are registered trademarks and service marks of Allied Van Lines, Inc.
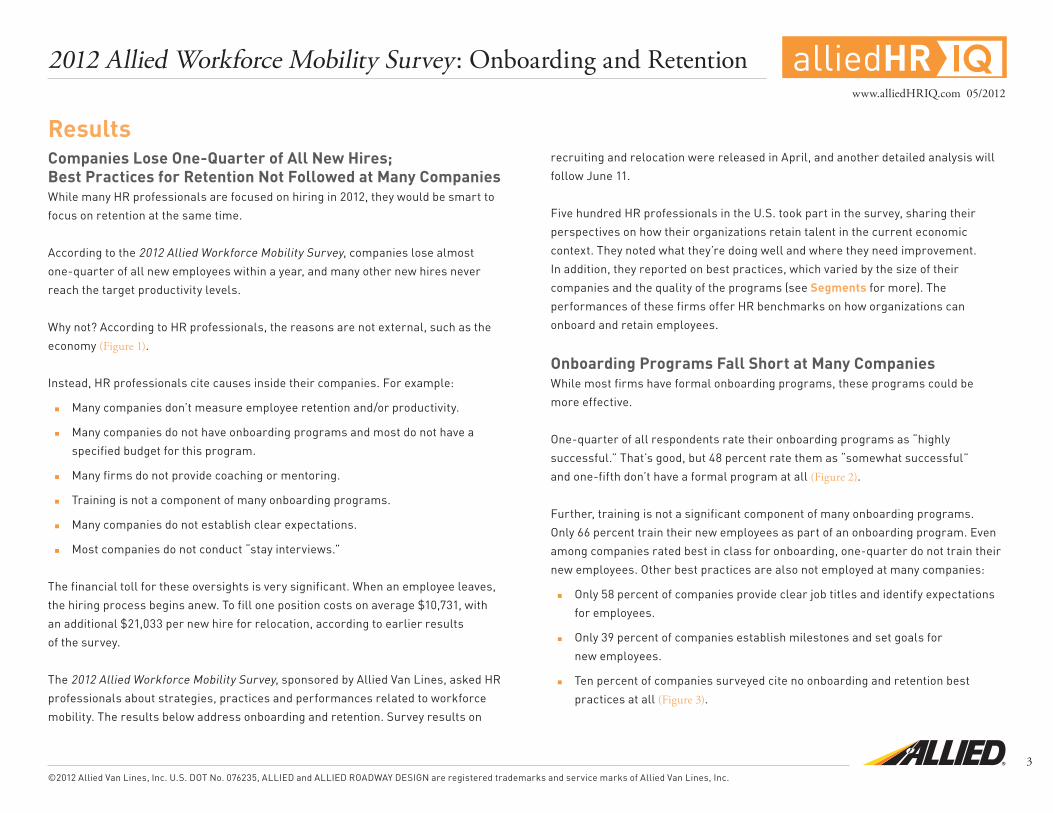
Results Companies Lose One-Quarter of All New Hires;Best Practices for Retention Not Followed at Many CompaniesWhile many HR professionals are focused on hiring in 2012, they would be smart to
focus on retention at the same time.
According to the 2012 Allied Workforce Mobility Survey, companies lose almost
one-quarter of all new employees within a year, and many other new hires never
reach the target productivity levels.
Why not? According to HR professionals, the reasons are not external, such as the
economy (Figure 1).
Instead, HR professionals cite causes inside their companies. For example:
Many companies don’t measure employee retention and/or productivity.
Many companies do not have onboarding programs and most do not have a
specified budget for this program.
Many firms do not provide coaching or mentoring.
Training is not a component of many onboarding programs.
Many companies do not establish clear expectations.
Most companies do not conduct “stay interviews.”
The financial toll for these oversights is very significant. When an employee leaves,
the hiring process begins anew. To fill one position costs on average $10,731, with
an additional $21,033 per new hire for relocation, according to earlier results
of the survey.
The 2012 Allied Workforce Mobility Survey, sponsored by Allied Van Lines, asked HR
professionals about strategies, practices and performances related to workforce
mobility. The results below address onboarding and retention. Survey results on
3
recruiting and relocation were released in April, and another detailed analysis will
follow June 11.
Five hundred HR professionals in the U.S. took part in the survey, sharing their
perspectives on how their organizations retain talent in the current economic
context. They noted what they’re doing well and where they need improvement.
In addition, they reported on best practices, which varied by the size of their
companies and the quality of the programs (see Segments for more). The
performances of these firms offer HR benchmarks on how organizations can
onboard and retain employees.
Onboarding Programs Fall Short at Many Companies While most firms have formal onboarding programs, these programs could be
more effective.
One-quarter of all respondents rate their onboarding programs as “highly
successful.” That’s good, but 48 percent rate them as “somewhat successful”
and one-fifth don’t have a formal program at all (Figure 2).
Further, training is not a significant component of many onboarding programs.
Only 66 percent train their new employees as part of an onboarding program. Even
among companies rated best in class for onboarding, one-quarter do not train their
new employees. Other best practices are also not employed at many companies:
Only 58 percent of companies provide clear job titles and identify expectations
for employees.
Only 39 percent of companies establish milestones and set goals for
new employees.
Ten percent of companies surveyed cite no onboarding and retention best
practices at all (Figure 3).

IQ2012 Allied Workforce Mobility Survey: Onboarding and Retentionwww.alliedHRIQ.com 05/2012
©2012 Allied Van Lines, Inc. U.S. DOT No. 076235, ALLIED and ALLIED ROADWAY DESIGN are registered trademarks and service marks of Allied Van Lines, Inc.
4
Many Employees Leave, Many UnproductiveCompanies lose on average 23 percent of new hires before the one-year
anniversary. Thirteen percent of companies lose half or more of their new hires in
the first year.
In addition, one-third of employees fail to meet company expectations in terms of
productivity, and only 26 percent go on to become corporate influencers/leaders
(Table 1).
For a new employee to become fully productive, it takes eight months on average,
but the ranges reported vary widely:
Twenty-seven percent of companies report that it takes a year or more for new
hires to reach full productivity.
Twenty-five percent of companies report that it takes three months or less.
Remarkably, 58 percent do not measure new-hire productivity at all (Figure 4).
Onboarding Is Underfunded at Most CompaniesCould new-employee retention rates and productivity be higher? According to the
survey, the answer is yes, if companies spent more money on onboarding.
Four out of five companies don’t have a specific budget for onboarding (Figure 5).
One-third spend $0 on onboarding.
The average annual spend on onboarding is $99,191. This figure represents
all companies in the survey, including those that do not have a formal
onboarding program.
The average number onboarded among all companies is 1,471, so the spend
per employee is about $67.
The average spend among companies with a formal onboarding program is
$126,824, yet even among this group there are some with limited or no specific
budget.
An investment in onboarding can be felt in a company’s bottom line, the survey
suggests. Companies that are best in class at onboarding spend $178,868 on
average. One-third of the companies in this category have a specific budget for their
programs. These companies are more likely to*:
Retain their employees,
Get them to full productivity, and
Develop them into corporate leaders/influencers.
Reasons Employees LeaveA basic onboarding practice overlooked at many companies is coaching/mentoring.
So it’s not surprising HR professionals cite employee-manager relationships as a
top reason employees leave. Job performance is the second most likely reason that
employees leave, according to the survey (Table 2).
Relocation packages, when applicable, were the least likely reason for an employee
to leave. While the quality of the relocation package improves recruiting, other
variables are far more likely to affect employees after they’re hired. In fact,
73 percent of HR professionals say that better relocation packages do not improve
onboarding and productivity.
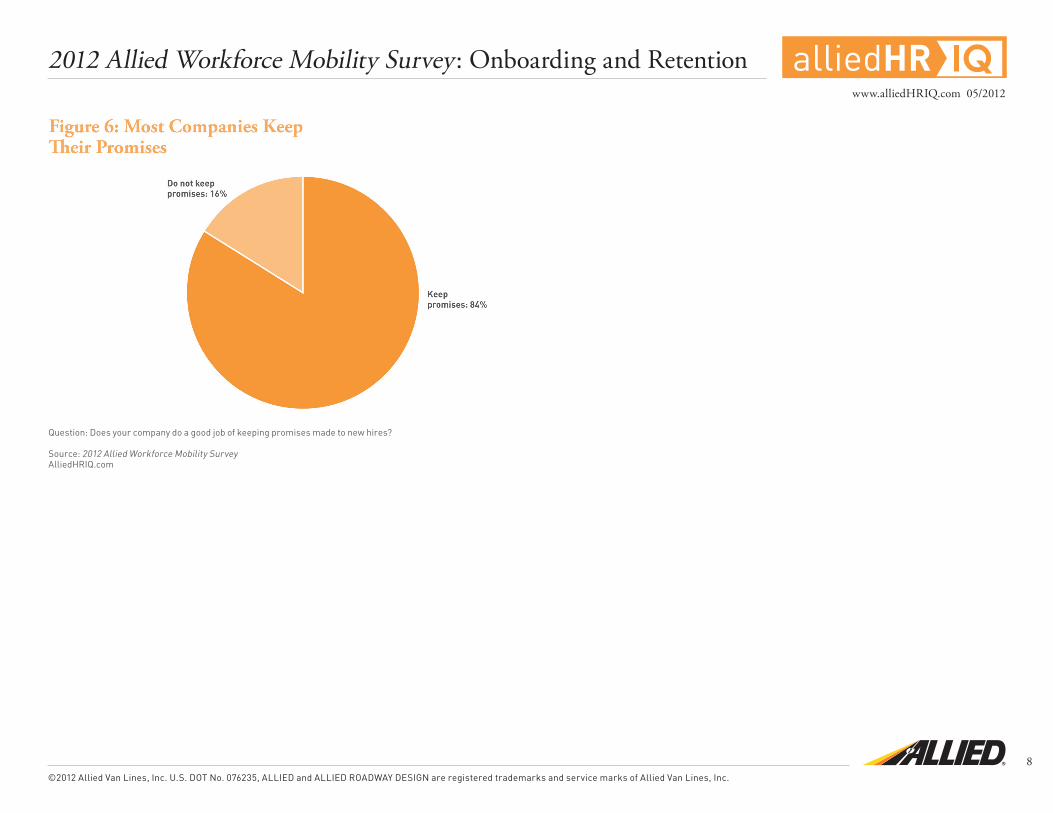
One component of a company’s relationship with a new employee concerns
promises. For example, during the hiring process, a company may promise that
“the right position will open up” or that an “annual bonus is a given.” New hires don’t
forget promises. Most companies keep their promises, according to the survey, but
16 percent do not (Figure 6).
*For more insight on how best-in-class companies differ from others, see Segments.

IQ2012 Allied Workforce Mobility Survey: Onboarding and Retentionwww.alliedHRIQ.com 05/2012
©2012 Allied Van Lines, Inc. U.S. DOT No. 076235, ALLIED and ALLIED ROADWAY DESIGN are registered trademarks and service marks of Allied Van Lines, Inc.
5
Question: How has the current mobility environment impacted your company’s ability to retain talent?
Source: 2012 Allied Workforce Mobility Survey AlliedHRIQ.com
Question: How successful is your onboarding program?
Figure 2 shows the percentage of HR professionals assigning a particular rating of success to their onboarding program.
Source: 2012 Allied Workforce Mobility Survey AlliedHRIQ.com

IQ2012 Allied Workforce Mobility Survey: Onboarding and Retentionwww.alliedHRIQ.com 05/2012
©2012 Allied Van Lines, Inc. U.S. DOT No. 076235, ALLIED and ALLIED ROADWAY DESIGN are registered trademarks and service marks of Allied Van Lines, Inc.
6
Figure 3 shows the percentage of HR professionals who employ these best practices in their onboarding programs.
Source: 2012 Allied Workforce Mobility Survey AlliedHRIQ.com
Source: 2012 Allied Workforce Mobility SurveyAlliedHRIQ.com
Question: Does your company measure new-hire productivity?
Source: 2012 Allied Workforce Mobility SurveyAlliedHRIQ.com

IQ2012 Allied Workforce Mobility Survey: Onboarding and Retentionwww.alliedHRIQ.com 05/2012
©2012 Allied Van Lines, Inc. U.S. DOT No. 076235, ALLIED and ALLIED ROADWAY DESIGN are registered trademarks and service marks of Allied Van Lines, Inc.
7
Question: Does your company have a specified budget for onboarding?
Source: 2012 Allied Workforce Mobility SurveyAlliedHRIQ.com
HR professionals were asked to rate the likelihood of an employee leaving for the reasons listed above. Table 2 shows the percentage of respondents that chose each of the possible ratings.
Source: 2012 Allied Workforce Mobility SurveyAlliedHRIQ.com
IQ2012 Allied Workforce Mobility Survey: Onboarding and Retentionwww.alliedHRIQ.com 05/2012
©2012 Allied Van Lines, Inc. U.S. DOT No. 076235, ALLIED and ALLIED ROADWAY DESIGN are registered trademarks and service marks of Allied Van Lines, Inc.
Question: Does your company do a good job of keeping promises made to new hires?
Source: 2012 Allied Workforce Mobility SurveyAlliedHRIQ.com
8
IQ2012 Allied Workforce Mobility Survey: Onboarding and Retentionwww.alliedHRIQ.com 05/2012
©2012 Allied Van Lines, Inc. U.S. DOT No. 076235, ALLIED and ALLIED ROADWAY DESIGN are registered trademarks and service marks of Allied Van Lines, Inc.
Segments Onboarding Success Differentiates Companies The 2012 Allied Workforce Mobility Survey asked HR professionals to evaluate
the performance of their own companies in several areas, rating them as “highly
successful,” “somewhat successful” or “unsuccessful.”
These self-appraisals were used to examine specific areas of HR performance,
such as onboarding programs, and do not refer to a company’s overall performance,
profits or financial standing. Still, they are useful in identifying why some companies
outperform others.
Approximately 28 percent of HR professionals rate their company’s onboarding
program as “highly successful.” Forty-eight percent rate their program as
“somewhat successful.” And 24 percent rate their program as “unsuccessful” or
report that they do not have a formal onboarding program. (For shorthand in this
report, “highly successful” companies are referred to as “best in class.”)
Best-in-class companies are more likely to put money behind onboarding. Further,
new employees at best-in-class companies are more likely to:
Stay at the company for at least one year
Meet or exceed corporate productivity goals
Become corporate leaders or influencers
The analysis below reviews the best-in-class findings for onboarding programs.
Findings released in April focused on recruiting and relocation programs. A third
set of findings in June will report on additional findings.
Best in Class Spend More, Dedicate Special Budgets to Onboarding Best-in-class firms spend more on onboarding – nearly twice as much as the
average among all companies represented in the survey (Figure 7). The average
spend among best-in-class companies is $178,868.
9
Further, best-in-class companies are far more likely to have a specific budget for
onboarding. But even among this group the percentage is low. Only 31 percent of
best-in-class companies have an onboarding budget, suggesting that even many
successful firms have not gotten senior leadership behind the onboarding function
(Figure 8).
Survey findings suggest that onboarding budgets are more likely to be obtained
when corporate HR is the owner, as opposed to a unit or site HR office or a
department outside of HR (Figure 9).
At best-in-class companies, corporate HR is more likely to own the onboarding
budget. This is the case at 58 percent of the best-in-class companies.
Best in Class Employ More Best Practices Best-in-class companies are more likely to use a range of best practices to assist
new employees in acclimating to their new positions. For example, 80 percent of
best-in-class companies have a formal orientation program, as compared to 71
percent and 34 percent of “somewhat successful” and “unsuccessful” companies,
respectively.
Further, best-in-class companies are much more likely to track retention and
productivity rates. Fifty-one percent of best-in-class companies track retention,
as compared to 33 percent and 7 percent of “somewhat successful” and
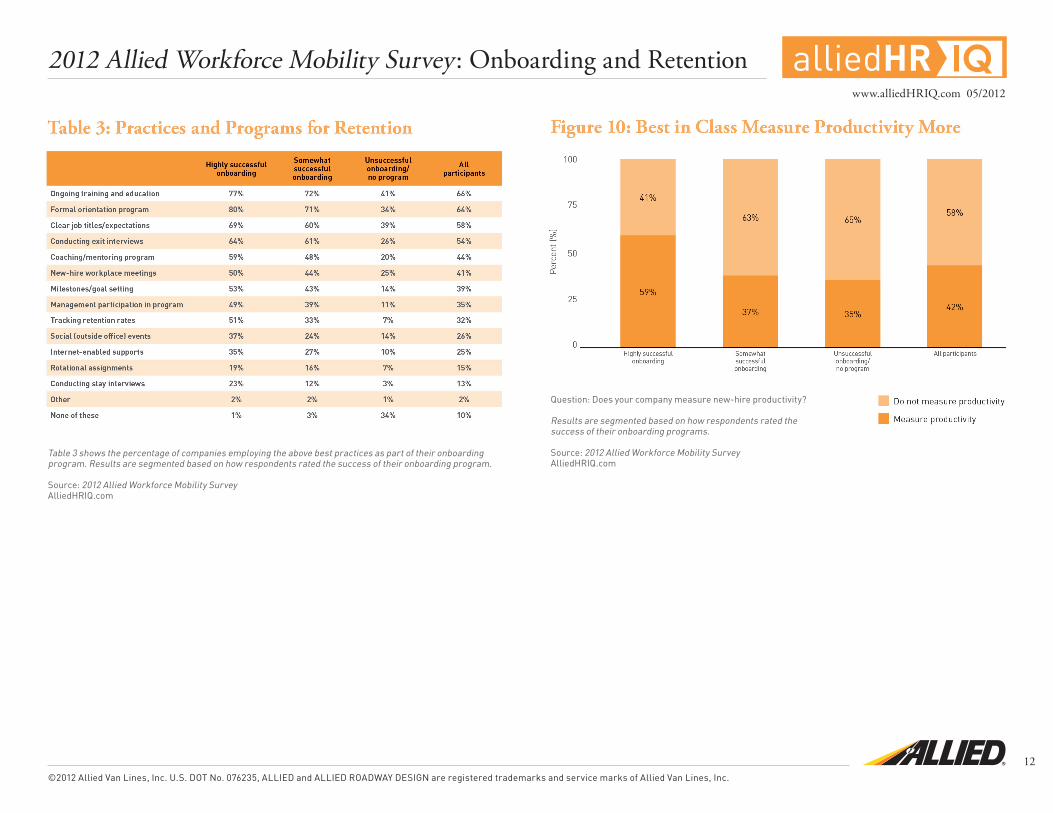
“unsuccessful” companies, respectively (Table 3). Fifty-nine percent of best-in-class
companies measure productivity of new hires versus 37 percent of
“somewhat successful” companies (Figure 10).
HR professionals at best-in-class companies seem to know more about onboarding.
Seventy-six percent describe themselves as “expert” or “very familiar” with
onboarding. That contrasts with just 58 percent and 32 percent among “somewhat
successful” and “unsuccessful” companies (Figure 11).

IQ2012 Allied Workforce Mobility Survey: Onboarding and Retentionwww.alliedHRIQ.com 05/2012
©2012 Allied Van Lines, Inc. U.S. DOT No. 076235, ALLIED and ALLIED ROADWAY DESIGN are registered trademarks and service marks of Allied Van Lines, Inc.
10
Best in class at onboarding also are better at keeping promises: 94 percent
of best-in-class companies do a good job of “keeping promises made to new
hires,” as compared to 82 percent and 75 percent of “somewhat successful” and
“unsuccessful” companies, respectively, according to HR professionals.
Best in Class Perform BetterBetter practices and bigger budgets should result in better performance, and it
does generally, according to survey results.
Best-in-class companies retain a higher percentage of new employees through
their one-year anniversary date. Further, new employees are more likely to meet
or exceed productivity targets and, ultimately, develop into corporate influencers or
leaders (Table 4).
Of note, though, is that the average length of time for a new hire to reach full
productivity at best-in-class companies is comparable to other firms, implying that
employees everywhere simply take time to become effective contributors (Table 4).
Best in Class Are Larger Companies, But Small Companies Also Can ExcelCompanies best in class at onboarding are larger than unsuccessful companies.
Forty-one percent of best-in-class companies could be considered “large
companies,” with annual revenues of more than $1 billion.
Yet best-in-class companies also are found among smaller companies. For
example, 34 percent of companies with revenues of $10 million to $100 million are
best in class at onboarding.
Every company, regardless of its size, needs to do all it can to leverage their new
employees, given the high costs of recruiting and relocation, which can cost on
average more than $30,000 per hire. An investment in onboarding and retention
makes good financial sense.
Best in Class in Onboarding Are More Likely to be Best All Around HR professionals at companies best in class at onboarding are far more likely
to rate their companies “highly successful” at recruiting and relocation. In other
words, these companies are better in all three areas. The best HR departments
efficiently and successfully move individuals through the talent pipeline, from
recruiting and relocation through onboarding (Figure 12).
Figure 7 represents average spending on onboarding. Results are segmented based on how respondents rated the success of their onboarding programs.
Source: 2012 Allied Workforce Mobility SurveyAlliedHRIQ.com

IQ2012 Allied Workforce Mobility Survey: Onboarding and Retentionwww.alliedHRIQ.com 05/2012
©2012 Allied Van Lines, Inc. U.S. DOT No. 076235, ALLIED and ALLIED ROADWAY DESIGN are registered trademarks and service marks of Allied Van Lines, Inc.
11
Figure 8 shows the percentage of companies with a specific budget for onboarding. Results are segmented based on how HR professionals rated the success of their onboarding programs.
Source: 2012 Allied Workforce Mobility SurveyAlliedHRIQ.com
Question: Who “owns” the onboarding function in your company?
Results are segmented based on how respondents rated the success of their onboarding programs.
Source: 2012 Allied Workforce Mobility SurveyAlliedHRIQ.com
IQ2012 Allied Workforce Mobility Survey: Onboarding and Retentionwww.alliedHRIQ.com 05/2012
©2012 Allied Van Lines, Inc. U.S. DOT No. 076235, ALLIED and ALLIED ROADWAY DESIGN are registered trademarks and service marks of Allied Van Lines, Inc.
12
Table 3 shows the percentage of companies employing the above best practices as part of their onboarding program. Results are segmented based on how respondents rated the success of their onboarding program.
Source: 2012 Allied Workforce Mobility SurveyAlliedHRIQ.com
Question: Does your company measure new-hire productivity?
Results are segmented based on how respondents rated the success of their onboarding programs.
Source: 2012 Allied Workforce Mobility SurveyAlliedHRIQ.com

IQ2012 Allied Workforce Mobility Survey: Onboarding and Retentionwww.alliedHRIQ.com 05/2012
©2012 Allied Van Lines, Inc. U.S. DOT No. 076235, ALLIED and ALLIED ROADWAY DESIGN are registered trademarks and service marks of Allied Van Lines, Inc.
Figure 11 shows the portion of HR professionals who regard themselves as “expert” or “very familiar” with onboarding. Results are segmented based on how respondents rated the success of their onboarding programs.
Source: 2012 Allied Workforce Mobility SurveyAlliedHRIQ.com
Table 4 shows the average percentage of new employees achieving certain outcomes. Results are segmented based on how respondents rated the success of their onboarding program.
Source: 2012 Allied Workforce Mobility SurveyAlliedHRIQ.com
Figure 12 shows the percentage of HR professionals rating their relocation and recruiting programs as “highly successful.” Results are segmented based on how the respondents rated the success of their onboarding programs.
Source: 2012 Allied Workforce Mobility SurveyAlliedHRIQ.com
13

IQ2012 Allied Workforce Mobility Survey: Onboarding and Retentionwww.alliedHRIQ.com 05/2012
©2012 Allied Van Lines, Inc. U.S. DOT No. 076235, ALLIED and ALLIED ROADWAY DESIGN are registered trademarks and service marks of Allied Van Lines, Inc.
14
Implications Five Lessons for Onboarding Success Based on the 2012 Allied Workforce Mobility Survey, here are five lessons to help
retain the talent you’ve recruited.
These lessons relate to the second set of research findings, focused on onboarding
and retention. Initial research findings on recruiting and relocation were released
in April, and additional implications will be posted June 11.
Lesson 1: Establish an Onboarding Program at Your Company To fill one position, companies spend upwards of $10,000 on average (not counting
relocation costs) and mobilize all kinds of internal resources. And yet, these same
companies allow many new employees to slip away or linger in a low-productivity
limbo.
The companies represented in the survey onboard 1,471 hires on average per year,
yet lose 338 of them within one year of their start date.
The good news is that certain cross sections of survey participants do better. For
example, 35 percent of large companies (> 10,000 employees) retain 90 percent or
more of new hires beyond the one-year point. These companies are more likely to
have successful onboarding programs aimed at retention. Does your company have
an onboarding program?
Lesson 2: Put Money Behind Onboarding Companies represented in this survey spend on average $99,191 annually on
onboarding. That works out to about $67 per new employee.
If it costs $10,000 to fill a single position, does it make sense to spend so little to
assist the new employee in becoming productive?
Only 19 percent of HR professionals say their companies have a dedicated budget for
onboarding. Yet companies with specific budgets for onboarding are almost twice as
likely to have highly successful onboarding programs (Figure 13).
Lesson 3: Measure Retention and Productivity Companies that measure the effectiveness of their retention and productivity rates
among new employees perform better in three areas (Table 5):
Retaining new employees
Enabling new employees to reach productivity targets
Developing new hires into corporate leaders and influencers
Do you measure your retention and productivity rates for your new employees? If
you don’t measure, you’re less likely to improve.
Lesson 4: Address the Hot Spots There are a few hot spots – most common reasons that employees leave before
their one-year anniversary – according to the survey:
Relationship with manager
Job performance
Career advancement opportunities

IQ2012 Allied Workforce Mobility Survey: Onboarding and Retentionwww.alliedHRIQ.com 05/2012
©2012 Allied Van Lines, Inc. U.S. DOT No. 076235, ALLIED and ALLIED ROADWAY DESIGN are registered trademarks and service marks of Allied Van Lines, Inc.
The survey suggests that many companies are not sufficiently addressing
these hot spots:
Just 44 percent of companies have coaching/mentoring programs, which could
improve employee/manager relationships.
Management participates in onboarding programs at just 35 percent of
companies. Participation could strengthen ties between new hires and their
managers.
Forty-two percent of companies don’t identify clear job titles/expectations.
Performances are sure to suffer if employees do not understand what they’re
expected to do.
Only 39 percent of companies set milestones and goals for career
advancement.
What’s more, many HR professionals probably don’t know that employees are
unhappy until they’re already out the door. Fifty-four percent of companies conduct
“exit” interviews, but only 13 percent of companies conduct “stay” interviews, which
are intended to evaluate employee satisfaction while they are still employed.
Lesson 5: Learn from the Best At companies best in class at onboarding, new employees are more likely to stay
with the company past their one-year anniversary, more likely to reach productivity
targets and more likely to become corporate influencers/leaders. Why?
Here are the best practices employed by more than half of the companies best in
class at onboarding:
Ongoing training and education
Formal orientation program
Clear job titles/expectations
Conducting exit interviews
Coaching/mentoring program
New-hire workplace meetings
Milestones/goal-setting
Management participation in program
Tracking retention rates
For specific percentages, see Segments or Table 3.
And, sadly, 10 percent of HR professionals said their companies do not use any
of the 13 onboarding best practices named in the 2012 Allied Workforce Mobility
Survey (Figure 3).
15

IQ2012 Allied Workforce Mobility Survey: Onboarding and Retentionwww.alliedHRIQ.com 05/2012
©2012 Allied Van Lines, Inc. U.S. DOT No. 076235, ALLIED and ALLIED ROADWAY DESIGN are registered trademarks and service marks of Allied Van Lines, Inc.
Figure 13 shows the percentage of companies with and without a specific onboarding budget. Results are segmented based on how respondents rated the success of their onboarding programs.
Source: 2012 Allied Workforce Mobility SurveyAlliedHRIQ.com
Table 5 shows the average percentage of new employees achieving certain outcomes. Results are segmented based on whether companies measure retention and productivity.
Source: 2012 Allied Workforce Mobility SurveyAlliedHRIQ.com
16