
04 18 34 50waterjournal.ormansu.gov.tr/assets/docs/TURKISHJOURNAL_TEK_SUTUNLU_27... · Associate...
84
July - August - September - October - November - December / Volume: 1 Issue: 2 Year: 2017 Türkiye Su Bilimi ve Yönetimi Dergisi 04 Identification of Specific Pollutants and Derivation of Environmental Quality Standards in Turkey 18 Flash Flooding and Green Stormwater Infrastructure in Philadelphia: Areas for Further Improvement 34 Institutional Framework in Flood Management in France and Recommendations for Turkey 50 Planning of Sectoral Water Allocation: A Case Study of Seyhan River Basin (ISSN 2536 474X)
Transcript of 04 18 34 50waterjournal.ormansu.gov.tr/assets/docs/TURKISHJOURNAL_TEK_SUTUNLU_27... · Associate...
July - August - September - October - November - December / Volume: 1 Issue: 2 Year: 2017Tü r k i y e S u B i l i m i v e Yö n e t i m i D e r g i s i
04Identification of Specific Pollutants and Derivation of Environmental Quality Standards in Turkey
18Flash Flooding and Green Stormwater Infrastructure in Philadelphia:Areas for Further Improvement
34Institutional Framework in Flood Management in France and Recommendations for Turkey
50 Planning of Sectoral Water Allocation:A Case Studyof Seyhan River Basin
(ISSN 2536 474X)

TURKISH JOURNAL OF WATER SCIENCE & MANAGEMENT
2
THE REPUBLIC OF TURKEYMINISTRY OF FORESTRY AND WATER AFFAIRS
EDITORProf. Dr. Cumali KINACIGeneral Directorate of Water ManagementMinistry of Forestry and Water Affairs, The Republic of Turkey
EDITORIAL BOARDProf. Dr. Ahmet Mete SAATÇİTurkish Water InstituteMinistry of Forestry and Water Affairs, The Republic of Turkey
Prof. Dr. Doğan ALTINBİLEKWorld Water Council;Turkish Contractors Association,
Prof. Dr. Hasan Zuhuri SARIKAYAInternational University of Sarajevo
Prof. Dr. Meriç ALBAY Faculty of Fisheriesİstanbul University
Associate Prof. Dr. Mustafa COŞKUNTurkish State Meteorological ServiceMinistry of Forestry and Water Affairs, The Republic of Turkey
Dr. Bülent SELEKGeneral Directorate of State Hydraulic Works, Ministry of Forestry and Water Affairs,The Republic of Turkey
Prof. Dr. Ülkü YETİŞDepartment of Environmental EngineeringMiddle East Technical University,
ASSOCIATE EDITORSAslıhan URALCeren YÜCEÇAMGökçe CEYLANDr. Tolga ÇETİNMinistry of Forestry andWater Affairs, Republic of Turkey
PUBLISHERAhmet Rıfat İLHANMinistry of Forestry andWater Affairs, The Republic of Turkey
PUBLISHING MANAGERAssoc. Prof. Dr. Özlem Sıla OLGUNMinistry of Forestry andWater Affairs, The Republic of Turkey
PRINTING EDITORSongül ÖZTÜRKMinistry of Forestry andWater Affairs, The Republic of Turkey
PUBLISHING EDITORSEnder YILMAZCahit YILMAZGülşen KAYBALMinistry of Forestry andWater Affairs, The Republic of Turkey
Contents
Identification of Specific Pollutants and Derivation of Environmental Quality Standards in Turkey Aybala KOÇ ORHON, Esra ŞILTU, Sibel Mine GÜÇVER,Yakup KARAASLAN 4
Flash Flooding and Green Stormwater Infrastructure in Philadelphia:Areas for Further ImprovementEla DOĞANAY, Jamie MAGAZINER 18
Institutional Framework in Flood Management in France and Recommendations for TurkeyIşıl SAKIN 34
Planning of Sectoral Water Allocation: A Case Study of Seyhan River BasinNuray AYTEN,Saliha DEĞIRMENCIOĞLU,Taner KIMENÇE 50
Optimization and Modelling of Pressurized Irrigation Networks Keh-Han WANG, Mustafa DAL 64
MoFWA
July - August - September - October - November - December / Volume: 1 Issue: 2 Year: 2017
3
Aims and ScopeWe, within Republic of Turkey Ministry of Forestry
and Water Affairs General Directorate of Water Mana-gement, are committed to consistently provide access
to the accurate, reliable and global information that are necessary for water education, research and public ser-vice regarding water management. We aim to become a well-known scientific journal, indexed and referred
at both national and international level.Turkish Journal of Water Science and Management is a reliable, innovative and peer-reviewed scientific jour-nal that is open to all kinds of up-to-date technological and scientific progress suitable for the future education and research needs on water, offering accurate scienti-
fic information to all the readers.Submission of manuscripts
Please kindly access to the main page of the Journal via "http://dergipark.gov.tr/tjwsm" to register as user and submit your papers through "Submit a Manusc-ript". If you have any problems, please kindly see
the related video via "http://forum.dergipark.gov.tr/t/uds-kullanim-videolari/488/10". Manuscripts under review, accepted for publication or published elsew-
here are not accepted. Please kindly go to "http://waterjournal.ormansu.gov.tr" to see the instructions for
manuscript preparation..Disclaimer
Any statements expressed in these materials are those of the individual authors, and do not necessarily rep-resent the views of MoFWA which takes no respon-sibility for any statements made herein. Therefore,
no reference made in this publication to any specific method, product, process or service constitutes or
implies an endorsement, recommendation or warranty by MoFWA. The materials are for general information only and do not represent a standart of MoFWA, nor are they intended as a reference in Turkish specifi-
cations, contracts, regulations, statutes, or any other legal document. MoFWA makes no represantation or warranty of any kind, whether expressed or implied, concerning the accuracy, completeness, suitability, or utility of any information, apparatus, product, or pro-cess discussed in this publication and therefore assu-mes no liability. This information should not be used without first securing competent advice with respect
to its suitability for any general or specific application. Anyone utilizing this information assumes all liability
arising from such use, including but not limited to infringement of any patent or patents.
Turkish Journal ofWater Science and Management
is abstracted and indexed in Dergi Park, in compliance with APA format.
Turkish Journal of Water Science and Management
is published once everysix months in Jan., and Jul. by the Ministry of Forestry
and Water AffairsGeneral Directorate of Water Management,
Beştepe DistrictAlparslan Turkeş Street N: 71
Yenimahalle /Ankara, Turkey 06510,
Tel: +90 312 207 63 30,Fax: +90 312 207 51 87,
email: [email protected].
Publishing OfficeSupport Services
Head of DepartmentPrinting and Photo-Film
Branch OfficeEtlik- Ankara.
The Cover isdesigned by Ajans 46.

TURKISH JOURNAL OF WATER SCIENCE & MANAGEMENT
4
Abstract
Specific pollutants are defined as the substances posing a risk on national or river basin level due to being discharged in serious amount according to Water Framework Directive (2000/60/EC) and control of them in sur-face waters is ensured by the implementation of environmental quality standards (EQS). As a candidate for EU membership, Turkey, has conducted studies on determination of specific pollutants between 2011 and 2015. In this scope, firstly, list of candidate pollutants were prepared based on the field studies, questionnaires and literature surveys. Different prioritization methods were then applied for candidate chemicals considering hazard characte-ristics, exposure levels and production/use patterns of the substances. Finally, 117 point sourced and 133 non-point sourced specific pollutants were designated with their national EQSs.
Key words: specific pollutants, environmental quality standards, prioritization, hazard characteristics
ÖzSu Çerçeve Direktifi’ne göre, belirli kirleticiler, sulara önemli miktarda deşarj edilmeleri sebebiyle ulusal
veya nehir havzası ölçeğinde risk teşkil eden maddeler olup bu maddelerin yerüstü sularındaki kontrolü çevresel kalite standartlarının (ÇKS) uygulanması ile sağlanmaktadır. AB üyeliği için aday ülke konumundaki Türkiye’de, belirli kirleticilerin ortaya konulmasına yönelik 2011-2015 yılları arasında çalışmalar yürütülmüştür. Bu kapsam-da, ilk olarak, saha çalışmaları, anketler ve literatür araştırmalarından faydalanılarak aday kirletici listesi oluştu-rulmuştur. Çalışmanın devamında, maddelerin tehlike özellikleri, maruziyet seviyeleri ve üretim/kullanım biçim-leri dikkate alınarak aday kirleticiler için farklı önceliklendirme metotları uygulanmıştır. Neticede, 117 noktasal kaynaklı ve 133 yayılı kaynaklı belirli kirletici ile bu kirleticilere ilişkin ulusal ÇKS değerleri ortaya konulmuştur.
Anahtar sözcükler: : belirli kirleticiler, çevresel kalite standartları, önceliklendirme, tehlike özellikleri
IntroductionHazardous substances in surface waters are the chemicals having a property of toxici-
ty, persistency and bio-accumulation. Industrial chemicals, personal care products, pesticides, pharmaceuticals, detergents and metals are some of the hazardous substance groups commonly used in daily life.
According to Water Framework Directive (2000/60/EC), hazardous substances can be either priority substances or specific pollutants. Priority substances are defined as the sub-stances posing a significant risk for water environment which also including priority hazardous substances among them (Directive 2000/60/EC; Directive 2013/39/EU) and recently reviewed by the Directive 2013/39/EU on EU level. Specific pollutants, on the other hand, are the sub-stances posing a risk on national or river basin level due to being discharged in serious amount and they are designated by Member States on a country basis. Control of priority substances and specific pollutants in surface waters are ensured by the implementation of their environ-mental quality standards (EQS), concentrations in water, sediment or biota which should not be
Identification of Specific Pollutants and Derivation of Environmental Quality Standards in Turkey
Research Article
Aybala KOÇ ORHON1, Esra ŞILTU1, Sibel Mine GÜÇVER1, Yakup KARAASLAN1
1Ministry of Forestry and Water Affairs General Directorate of Water Management, 06510, [email protected], [email protected], [email protected], [email protected]
Received date: 14.03.2017, Revised date: 07.07.2017, Accepted date: 19.07.2017

July - August - September - October - November - December / Volume: 1 Issue: 2 Year: 2017
5
exceeded in order to protect human health and the environment.
As a candidate for EU membership, Turkey, has conducted the scientific studies on the surface water management of hazardous pollutants between the years of 2011-2015 by consid-ering the abovementioned issues. Within the scope of these studies, efforts were being made on the determination of river basin specific pollutants in surface water resources, monitoring of these substances in receiving water bodies and wastewaters, and setting EQSs for them.
In this paper, specific information is provided on the prioritization of chemicals and se-lection of national specific pollutants and derivation of EQSs.
MethodPrioritization of chemicals
First step of the identification of specific pollutants was the constitution of the list of candidate chemicals. This list was prepared based on the field studies in the pilot regions, ques-tionnaires, literature surveys and the list of chemicals produced or imported more than 1 tons annually in Turkey. Second step was the screening and prioritization of chemicals in the candi-date list. In this stage, Combined Monitoring and Modeling Based Priority Setting (COMMPS) and Total Hazard Score (THS) methodologies were applied.
COMMPS methodology.
COMMPS methodology is developed by Fraunhofer Institute of Environmental Chem-istry and Ecotoxicology and used for the aim of identifying priority pollutants under the Water Framework Directive (Klein et al., 1999). Both the exposure and the hazards are evaluated in this methodology. The risk score is calculated by the Equation 1:
I_PRIO = I_EXP × I_EFF (1)
I_EXP stands for the exposure score of the substances and I_EFF stands for the effect score of the substances.
Two different exposure scores can be calculated by this method. These are modeling based exposure score and the monitoring based exposure score (Şıltu, 2015). Monitoring based exposure score is calculated based on the arithmetic mean of the results in each monitoring station by the Equation 2:
log(Ci / (Cmin × 10-1))
I_EXP (substance i) = --------------------------------- * 10 (2)
log(Cmax / (Cmin × 10-1))

TURKISH JOURNAL OF WATER SCIENCE & MANAGEMENT
6
The minimum and maximum values are given in Table 1:
Table 1. Maximum and minimum values used in calculations
Cmax
Cmin
Unit
Organic substances in the water phase 100 0.0001 pg/1
Organic substances in the water phase (maximum likelihood 100 0.0001 pg/1
Metil compaunds in the water phase 200 0.2 pg/1
Organic substances in the sediment 10000 0.01 pg/kg
Metil compaunds in the sediment 2000 6 pg/kg
The modeling based exposure score is calculated based on the emission, degradation and dispersion by using the below equations:
I_EXP
= 1,37 (log(EEXV) + 1,301) (3)
EEXV = EMISSION x DISTRIBUTION x DEGRADATION (4)
I_EXP is normalized such that the range is between 0 and 10. The calculation of each component of this equation is as follows.
EMISSION= 0,01×T1 + 0,1×T2 + 0,2×T3 + 1,0×T4 (5)
Table 2. Values used in emission factor calculation
Main use category Fraction
1 Used in closed systems 0.01
2 Use resulting in inclusion in matrix 0.10
3 Non-dispersive use 0.20
4 Wide dispersive use 1.00
Default 1.00
The factor “DISTRIBUTION” represents the fraction of a chemical which partitions at equilibrium into the aquatic compartment and it is calculated by using the Mackay I Model ac-cording to the environmental characteristics given in the model (Mackay, 2001). By this model, fugacity (f) of the chemicals in each environmental compartment can be calculated. Fugacity is the tendency of a chemical to escape from a system. The model requires the calculation of fugacity capacity (Z) for each compartment and the fugacity is related to the concentration of the chemical in the environmental compartments.
July - August - September - October - November - December / Volume: 1 Issue: 2 Year: 2017
7
C=Zf (6)
Air (1) Z1 = 1/RT (7)
Water (2) Z2 = CS /VPS (8)
Soil (3) Z3 = Z2 n3f
oc3 K
oc / 1000 (9)
Sediment (4) Z4 = Z2 n4f
oc4 K
oc / 1000 (10)
Susp. Solids (5) Z5 = Z2 n5f
oc5 K
oc / 1000 (11)
Fish (Biota) (6) Z6 = Z2 n6 L K
ow / 1000 (12)
R : Gas constant (8.314 J/mol K)
T : Temperature (K)
Cs : Water solubility (mol/m3)
VPs : Vapour pressure (Pa)
ni : Density of phase i (kg/m3)
foci : Mass fraction of organic carbon in phase i
L : Lipid content in fish (0.10)
Koc is derived from Kow according to Mackay model: Koc = 0.41
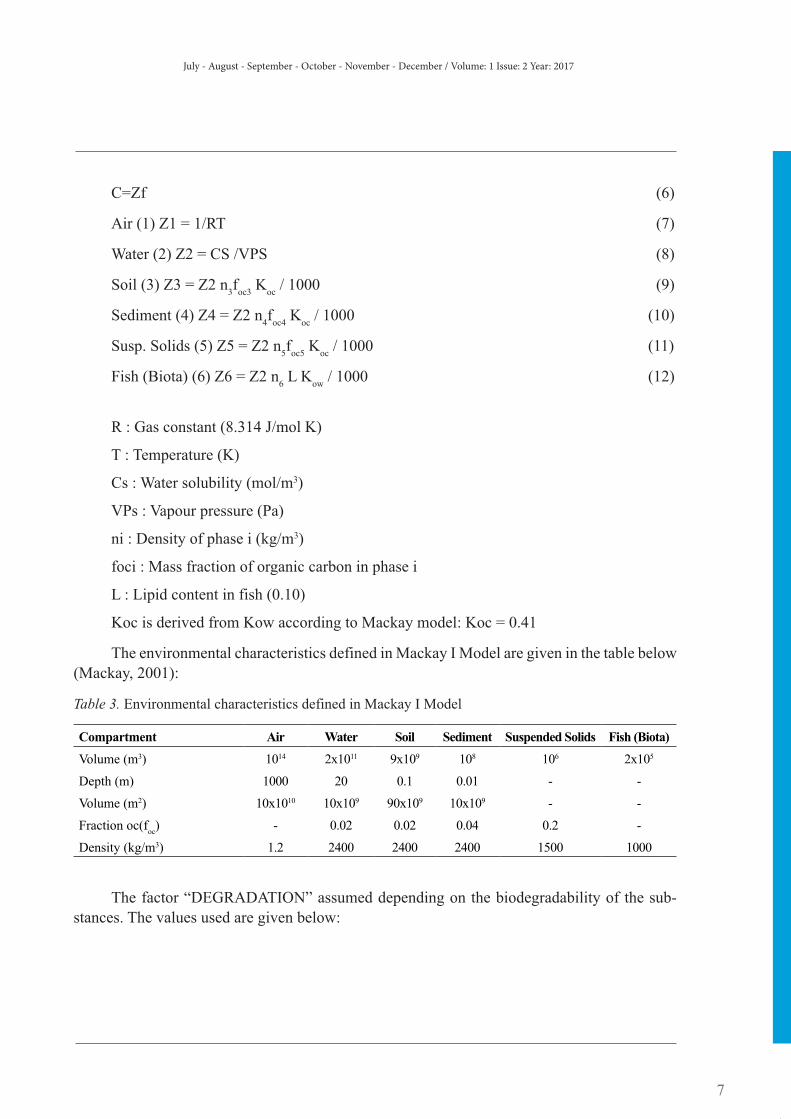
The environmental characteristics defined in Mackay I Model are given in the table below (Mackay, 2001):
Table 3. Environmental characteristics defined in Mackay I Model
Compartment Air Water Soil Sediment Suspended Solids Fish (Biota)
Volume (m3) 1014 2x10¹¹ 9x10⁹ 108 106 2x10⁵
Depth (m) 1000 20 0.1 0.01 - -
Volume (m2) 10x1010 10x109 90x109 10x109 - -
Fraction oc(foc
) - 0.02 0.02 0.04 0.2 -
Density (kg/m3) 1.2 2400 2400 2400 1500 1000
The factor “DEGRADATION” assumed depending on the biodegradability of the sub-stances. The values used are given below:

TURKISH JOURNAL OF WATER SCIENCE & MANAGEMENT
8
Table 4. Values used as degradation factor
Biodegradabilty Fraction
Ready biodegradabilty 0.1
Internet Biodegradabilty 0.5
President 1.0
Default 1.0
The effect score is calculated according to the equation shown below:
I_EFF = EFSd (5) + EFSi (3) + EFSh (13)
Where EFSd stands for the direct aquatic effect score, EFDi for indirect aquatic effect score and EFSh for human health effect score.
log (PNECi /(10 × PNEC
max))
EFSd (substance i) = ------------------------------------------ × WF (14) log (PNEC
min /(10 × PNEC
max))
WF Weighting factor for direct effects (5 for organic substances, 8 for metals).
The PNEC values used are:
Table 5. Maximum and minimum PNEC values
PNECmax
PNECmin
Unit
Organic substances in the water phase 1 0.000001 mg/l
Organic substances in the sediment (see chap. 5.2) 10 0.000001 mg6kg
Metal compounds in the water phase (see chap. 5.3) 0.1 0.000001 mg/l
EFSi is determined according to the criteria given in Table 6:
Table 6. Criteria of determining indirect aquatic effect score (EFSi)
logPow
Molecular Eight Bioconcentration Factor (BCF) Scores
< 3 or < 700 < 100 0
3 <= log Pow < 4 and < 700 100 - < 1000 1
4 <= log Pow < 5 and < 700 1000 - < 10000 2
>= 5 and < 700 > 10000 3
default (nologPow) and < 700 no BCF 3

July - August - September - October - November - December / Volume: 1 Issue: 2 Year: 2017
9
EFSh is determined according to the criteria given in Table 7:
Table 7. Criteria of human health effect score (EFSh)
Carcinogenicity Mutagenicity Effects on Reproduction Chronic Effects (oral) Scores
R45 R46 R47,R60 or R61 - 2
R40 R40 R62,R63 or R64 - 1.8
- no test no testR48
in any combination withR23 - R28
1.4
- -R48
in any combination withR20 - R22
1.2
- - - R33 1
- - - - 0
The maximum risk score calculated is 100 by COMMPS methodology. There is no cut-off criteria defined for the evaluation of risk scores and this is a shortcoming of the COMMPS methodology (Şıltu, 2015).
THS methodology.
The original methodology is developed in UK to propose an alternative screening tool for the identification of priority pollutants under Water Framework Directive (Daginnus et al., 2011). The methodology consists of both hazard and exposure assessment. However, due the data gaps on environmental levels of chemicals, only hazard assessment was considered in these studies. The equation used for the hazard score calculation is given below:
THS= P+B+T+ED (15)
Where P stands for Persistent (no persistence = 0, persistent = 1), B for Bioaccumulative (no bioaccumulation = 0, bioaccumulative = 1), T for Toxic (no toxicity = 0, toxic = 1) and ED for being in the Endocrine Disruptors list Categories 1 and 2 (no ED activity = 0, ED = 1). An additional +1 was added to the total score if the substance fulfilled all the screening criteria or if the substance was classified as vPvB (v= very).
The cutoff values used in the studies are:
P=1 if half-life in water > 40 days
B=1 if BCF > 2000, if BCF > 5000 then vB
T=1 if NOEC < 0,01 mg/L or E(L)C50
< 0,1 mg/L
Therefore, the maximum hazard score is 4 which corresponds to a substance classified as PBT or vPvB, while the minimum score is 0.
TURKISH JOURNAL OF WATER SCIENCE & MANAGEMENT
10
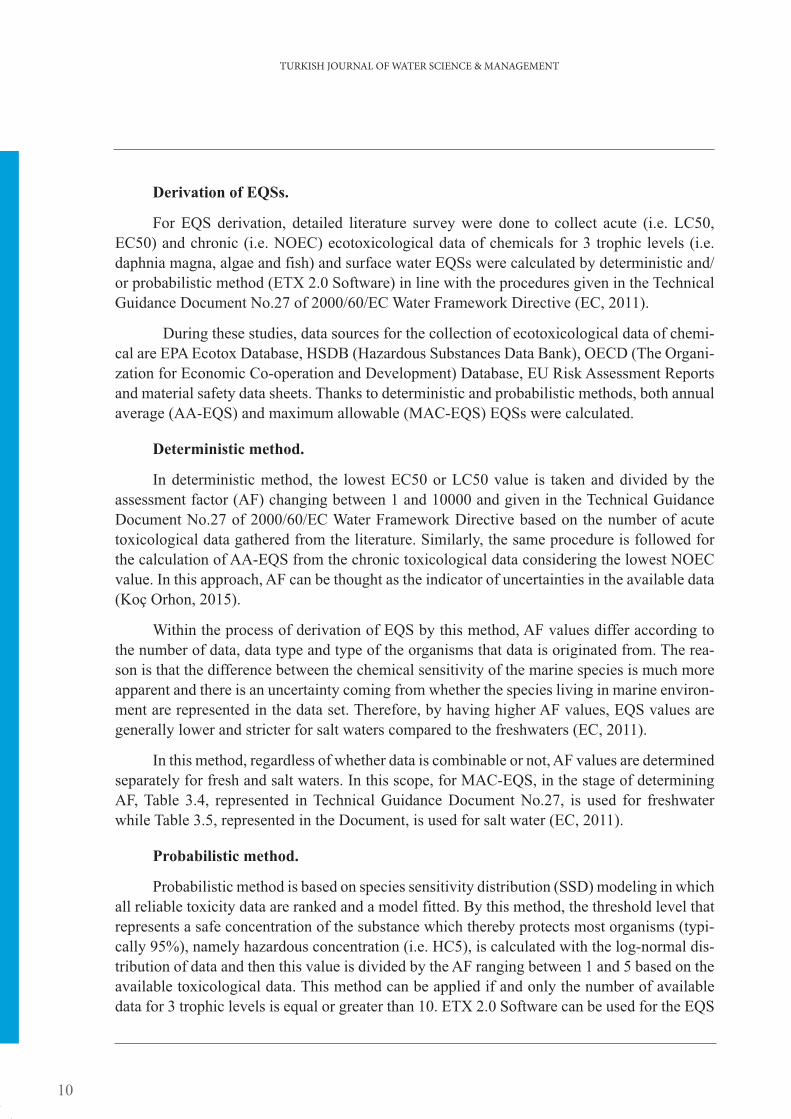
Derivation of EQSs.
For EQS derivation, detailed literature survey were done to collect acute (i.e. LC50, EC50) and chronic (i.e. NOEC) ecotoxicological data of chemicals for 3 trophic levels (i.e. daphnia magna, algae and fish) and surface water EQSs were calculated by deterministic and/or probabilistic method (ETX 2.0 Software) in line with the procedures given in the Technical Guidance Document No.27 of 2000/60/EC Water Framework Directive (EC, 2011).
During these studies, data sources for the collection of ecotoxicological data of chemi-cal are EPA Ecotox Database, HSDB (Hazardous Substances Data Bank), OECD (The Organi-zation for Economic Co-operation and Development) Database, EU Risk Assessment Reports and material safety data sheets. Thanks to deterministic and probabilistic methods, both annual average (AA-EQS) and maximum allowable (MAC-EQS) EQSs were calculated.
Deterministic method.
In deterministic method, the lowest EC50 or LC50 value is taken and divided by the assessment factor (AF) changing between 1 and 10000 and given in the Technical Guidance Document No.27 of 2000/60/EC Water Framework Directive based on the number of acute toxicological data gathered from the literature. Similarly, the same procedure is followed for the calculation of AA-EQS from the chronic toxicological data considering the lowest NOEC value. In this approach, AF can be thought as the indicator of uncertainties in the available data (Koç Orhon, 2015).
Within the process of derivation of EQS by this method, AF values differ according to the number of data, data type and type of the organisms that data is originated from. The rea-son is that the difference between the chemical sensitivity of the marine species is much more apparent and there is an uncertainty coming from whether the species living in marine environ-ment are represented in the data set. Therefore, by having higher AF values, EQS values are generally lower and stricter for salt waters compared to the freshwaters (EC, 2011).
In this method, regardless of whether data is combinable or not, AF values are determined separately for fresh and salt waters. In this scope, for MAC-EQS, in the stage of determining AF, Table 3.4, represented in Technical Guidance Document No.27, is used for freshwater while Table 3.5, represented in the Document, is used for salt water (EC, 2011).
Probabilistic method.
Probabilistic method is based on species sensitivity distribution (SSD) modeling in which all reliable toxicity data are ranked and a model fitted. By this method, the threshold level that represents a safe concentration of the substance which thereby protects most organisms (typi-cally 95%), namely hazardous concentration (i.e. HC5), is calculated with the log-normal dis-tribution of data and then this value is divided by the AF ranging between 1 and 5 based on the available toxicological data. This method can be applied if and only the number of available data for 3 trophic levels is equal or greater than 10. ETX 2.0 Software can be used for the EQS

July - August - September - October - November - December / Volume: 1 Issue: 2 Year: 2017
11
calculation by this method (Aldenberg and Jaworska, 2000). This method is more reliable than the deterministic method due to running with lower AF value; therefore; it should be preferred for EQS calculation when there is available sufficient data (Koç Orhon, 2015).
Rationale behind SSD by ETX 2.0 Software:
ETX 2.0 Software uses the method of Aldenberg and Jaworska (2000) for HC5 calculation.
Log HC5 = Xm-k×s (16)
Where:
Xm: mean of log-transformed data
k: extrapolation constant depending on protection level and sample size (according to Aldenberg and Jaworska, 2000)
s: Standard deviation of log-transformed data
EQS = HC5 / AF (AF: 1-5) (17)
According to fraction affected (%), there is a table giving the value of k constant based on the number of toxicity data available. Rows are sample size, columns are fraction affected in this table. There are 6 sets of fraction affected as 1%, 2%, 5%, 10%, 25% and 50%. Sample size changes between 2 and infinity. “k” value is independent of the substance involved (Aldenberg and Jaworska, 2000).
According to the Guidance Document, an AF of 5 is used by default but it may be re-duced where evidence removes residual uncertainty. The exact value of the AF depends on an evaluation of the uncertainties around the derivation of the HC5. Generally, the number of data used in HC5 derivation is taken as a baseline and different AFs between 1 and 5 are designated depending on the number of available data. In these studies, AFs were determined based on the considerations in Table 8.
Table 8. AF values for probabilistic method
Number of Data Fraction
10-15 5
16-20 4
21-25 3
26-30 2
> 30 1

TURKISH JOURNAL OF WATER SCIENCE & MANAGEMENT
12
Results
In the first stage of the studies, candidate chemical list covering nearly 3300 substances were prepared considering the results of field studies and questionnaires in the pilot regions and benefiting from the scientific articles and documents in the literature. Also, the chemicals assigned as specific pollutants in EU countries were assessed in the candidate list. For the point sourced pollutants, production and wastewater treatment processes of pilot urban and industrial facilities were investigated, literature survey was conducted, BREF documents of industrial sectors were studied and national/international legislations were searched. For the identifica-tion of diffuse pollutants, lists of pesticides that are in use and prohibited were investigated and questionnaires were made with the distributors of plant protection products in the pilot regions. At the end, inventory of pesticides was established by considering the agricultural production pattern in different river basins.
In order to deal with the chemicals of highest priority among the candidate list, different prior-itization methods such as COMMPS and THS were used according to available data on the hazard characteristics, exposure profile and production/use amount of each substance. During the prioriti-zation, COMMPS method was not widely applied since usage and monitoring data are lacking for the chemicals in the list. On the other hand, THS methodology was used for the prioritization of the majority of the substances due to less data requirement and simple way of calculation.
In addition to prioritization scores, results of chemical monitoring studies were taken into consideration for the identification of final specific pollutants, as well. The chemicals detected at significant concentrations in surface waters were also designated as specific pollutants although their prioritization scores were lower. At the end, 117 point sourced and 133 diffuse sourced specific pol-lutants were determined on national level. Specific pollutant list includes heavy metals, polychlori-nated biphenyls, halogenated organics, endocrine disrupters, aromatic hydrocarbons and pesticides.
For these specific pollutants, national EQS values were also calculated by the probabilistic and deterministic methods the details of which are defined in the Technical Guidance Document No.27 of 2000/60/EC Water Framework Directive. Different EQS values were derived for freshwaters and saline waters depending on the acute and chronic toxicological data. In general, for the same specific pollutant, saline water EQSs were found to be more strict compared to the ones of fresh waters. For the calculations, deterministic method was mostly used due to limitation of toxicological data. Acute toxicological data were dominant to chronic toxicological data in literature. This situation has resulted in higher uncertainties in derived AA-EQS values since larger AF values were used to extrapolate to safe concentration.
Discussion and Conclusion
Results of these studies, namely, specific pollutants and their EQSs in freshwaters and saline waters, were adapted to the national legislation called “By-Law on Surface Water Quali-ty” on August 10, 2016. As of this date, these chemicals have been started to monitor in surface waters and quality classification of surface waters has been made by considering their EQSs, as well. In this way, now, it becomes possible to control these pollutants in surface water resources
July - August - September - October - November - December / Volume: 1 Issue: 2 Year: 2017
13
and take necessary precautions in time in order to protect and improve water quality when there is an identified risk of not attaining water quality objectives.
However, the outcomes of these studies demonstrated that there are still important data gaps more specifically on the hazard and exposure profiles, production and use amount and toxicity thresholds of the some chemicals. Monitoring studies were also lacking since most of the chemicals among the candidate specific pollutant list are so-called emerging pollutants and they were not monitored continuously in the surface waters before. Till the next prioritization which should be made after 6 years according to Water Framework Directive (2000/60/EC), the extent of inventory, toxicity and monitoring studies for the chemicals must be enhanced so that more reliable and realistic assessments can be obtained.
Acknowledgements
This study was conducted considering the outcomes of “Project on the Control of Pollution Caused by Hazardous Substance (2011-2013)”, “Project on the Determination of Hazardous Sub-stances in Coastal and Transitional Waters and Ecological Coastal Dynamics (2012-2014)” and “Project on the Determination of the Water Pollution Caused by Use of Plant Protection Products and Identification of Environmental Quality Standards for Substance or Substance Groups (2012-2014)”. The authors thank to the contractors of the projects, Scientific and Technological Research Council of Turkey Marmara Research Center and Io Environmental Solutions R&D Co., and all the experts and academicians involved in these projects for their valuable supports.
References
Aldenberg, T., Jaworska, J.S. (2000). Uncertainty of the hazardous concentration and fraction affected for normal species sensitivity distributions. Ecotoxicology and Environmental Safety, 46 (1), 1-18.
Daginnus, K., Gottardo, S., Payá-Pérez, A., Whitehouse, P., Wilkinson, H., Zaldívar, J. (2011). A model-base prioritisation exercise for the European Water Framework Directive. Int. J. Environ. Res. Public Health, 8, 435-455.
European Commission (2011) WFD CIS Guidance Document No. 27. Technical Guidance for Deriving Environmental Quality Standard, ISBN: 978-92-79-16228-2, DOI: 10.2779/43816.
EPA Ecotox Database (2017) from http://cfpub.epa.gov/ecotox.
EU Risk Assessment Reports (2008): http://echa.europa.eu/en/web/guest/search?p_p_id=e chasearch_WAR_ echaport let&p_p_lifecycle=0&p_p_state=normal&p_p_mode=view&p_p_col_id=column-1&p_p_col_ count=1&_echasearch_WAR_echaportlet_doSearch=true&_echasearch_WAR_echaportlet_ forceAdvanced=true
HSDB (Hazardous Substances Data Bank): http://toxnet.nlm.nih.gov/cgi-bin/sis/search2
Klein, W., Denzer, S., Herrchen, M., Lepper, P., Müller, M., Sehrt, R., Strom, A., Volmer, J. (1999). Revised Proposal for a List of Priority Substances in the Context of Water Framework Directive (COMMPS Procedure). Germany: Fraunhofer Institute of Environmental Chemistry and Ecotoxicology.
Koç Orhon, A. (2015). Yerüstü Sularında Bulunan Tehlikeli Maddelere ilişkin Çevresel Kalite Standartlarının Geliştirilmesine Yönelik Metodoloji. T.C. Orman ve Su İşleri Bakanlığı, Uzmanlık Tezi.

TURKISH JOURNAL OF WATER SCIENCE & MANAGEMENT
14
Mackay, D. (2001). Multimedia environmental models: the fugacity approach. Lewis Publishers.
OECD (The Organization for Economic Co-operation and Development) Database: http://webnet.oecd.org/CCRWEB/Search.aspx
Şıltu, E. (2015). Su Ortamında Bulunabilecek Tehlikeli Maddelerin Önceliklendirilmesi Açısından Türkiye’de
Uygulanabilecek Metodolojinin Belirlenmesi. T.C. Orman ve Su İşleri Bakanlığı, Uzmanlık Tezi.
Extended Turkish Abstract(Genişletilmiş Uzun Türkçe Özet)
Türkiye'de Belirli Kirleticilerin Tespit Edilmesi,Çevresel Kalite Standartlarının Belirlenmesi
2000/60/EC sayılı Su Çerçeve Direktifi (SÇD), yerüstü su kaynaklarının kalitesinin korunması ve sucul ekosistemlerin durumunun iyileştirilmesi hedefine yönelik olarak çevre koruma ve yönetimi konusunda bütünleşik bir yaklaşım getirmektedir. Bu yaklaşımlardan biri de, su kaynakları için risk teşkil eden tehlikeli maddeler için alıcı ortam çevresel kalite standartlarının (ÇKS) belirlenmesi ve uygulamaya alınması şek-lindedir.
ÇKS’ler, su kütlelerinin ekolojik ve kimyasal durum tespiti ve değerlendirilmesi için gerekli araçlar olmakla birlikte su, sediman ve biyota için bağımsız olarak türetilmektedir. SÇD’ye göre, ÇKS’ler önce-likli maddeler ve belirli kirleticiler için oluşturulmaktadır. Öncelikli maddelere ilişkin ÇKS’ler sırasıyla “2008/105/EC sayılı Çevresel Kalite Standartları Direktifi (ÇKSD)” ve “Su Politikası Alanında Öncelikli Maddeler Açısından 2000/60/EC Sayılı Direktifi ve 2008/105/EC Sayılı Direktifi Değiştiren 2013/39/EU Sayılı Direktif” ile Avrupa Birliği (AB) düzeyinde belirlenmiştir. Diğer taraftan, belirli kirleticiler ve bu kir-leticilere ilişkin ÇKS’ler ise, SÇD’de verilen muhtemel madde grupları esas alınarak, her bir ülke tarafından kendi endüstriyel ve tarımsal üretim portföyüne bağlı olarak belirlenmektedir. Belirli kirleticiler su kütlesine, kalitesini olumsuz yönde etkileyebilecek miktarda deşarj edilmeleri sebebiyle sucul ortamlar için risk teşkil eden maddeler olarak tanımlanmakta olup, organik ve inorganik maddeler ile konvansiyonel kirleticiler be-lirli kirletici grupları arasında yer alabilmektedir.
AB üyeliği için aday ülke konumundaki Türkiye’de, kıyı ve geçiş suları dâhil yerüstü su kaynakların-da bulunan tehlikeli maddelerin tespit edilmesi ve bu maddelere ilişkin alıcı ortamda aşılmaması gereken limit değerleri ifade eden ÇKS’lerin geliştirilerek, mevzuata aktarılmak üzere ülkemize özgü noktasal ve yayılı kaynaklı belirli kirleticilerin belirlenmesi çalışmasına altlık oluşturmak maksadıyla 2011-2015 yılları arasında çalışmalar yürütülmüştür. Bu çalışmalar kapsamında, aday kimyasal listesi oluşturulmuş, kimyasa-llar tehlikelilik özelliklerine göre önceliklendirilmiş, kimyasallara ilişkin çok kapsamlı ve detaylı envanter çalışmaları yürütülmüş, izleme çalışmaları gerçekleştirilmiş ve alıcı ortam kalite standartları geliştirilmiştir.
Noktasal kaynaklı kirliliğin tespitine yönelik olarak, pilot olarak seçilen alanlarda tehlikeli madde kirliliğine neden olan ve kıyı ve geçiş suları ile iç sulara deşarj yapan kentsel ve endüstriyel faaliyetlere ilişkin pilot tesisler belirlenmiştir. Yayılı kaynaklı kirliliğin tespitine yönelik olarak, ülkemizde yasaklı ve izinli pestisitlerin listesi temin edilmiş ve pilot alanlardaki bitki koruma ürünü bayileri ile anket çalışmaları gerçekleştirilmiştir. Aday kimyasal listesi oluşturulurken; pilot tesislere gerçekleştirilen saha çalışmaları ver-ileri, pilot tesislerde kullanılan hammaddeler ve proses sırasında oluşan yan ürünler, endüstriyel sektörlere il-işkin BREF dokümanları ve literatür bilgileri, bitki koruma ürünü bayileri ile gerçekleştirilen anket sonuçları,

July - August - September - October - November - December / Volume: 1 Issue: 2 Year: 2017
15
AB’de belirlenen belirli kirleticiler ile ulusal ve uluslararası mevzuat ve sözleşmelerden yararlanılmıştır. Neticede, yaklaşık 3300 maddeden oluşan aday kimyasal listesi hazırlanmıştır.
Çalışmanın devamında, aday kimyasal listesindeki maddeler risk derecelerine göre önceliklendirme çalışmasına tabii tutulmuştur. Önceliklendirme yapılırken, kimyasala ilişkin üretim verisinin mevcut olup olmamasına bağlı olarak 2 farklı yöntem kullanılmıştır. Kimyasala ilişkin üretim verisinin mevcut olması halinde Birleşik İzleme-Bazlı ve Model Bazlı Önceliklendirme Prosedürü (COMMPS), üretim verisinin mevcut olmaması halinde ise Toplam Tehlike Skoru (TTS) metodu kullanılmıştır. COMMPS metodu AB’de SÇD “Öncelikli Maddeler Listesi” oluşturulurken uygulanan önceliklendirme metodu olup, bu yöntemde 5 kademeli bir seçim sistemi uygulanmaktadır. Bunlar sırasıyla; aday listenin belirlenmesi, maruziyet sko-runun (I_EXP: maruziyet indeksi) hesaplanması (izleme ve modelleme bazlı), etki skorunun (I_EFF: etki indeksi) hesaplanması, risk bazlı skorun hesaplanması ve öncelikli kirleticilerin belirlenmesidir. TTS meto-dunda kimyasalların tehlikeliliklerine ilişkin değerlendirme yapılmakta olup neticede bir tehlike skoru hes-aplanmaktadır. Tehlike skoru; kimyasalın kalıcı (P), toksik (T), birikim potansiyeli (B) ve endokrin bozucu (ED) olup olmadığı dikkate alınarak hesaplanmaktadır. Söz konusu her bir değerlendirme kriteri için ilgili sınır değer aşılmışsa skor ‘1’, aşılmamışsa ‘0’ olarak alınmaktadır. Bir madde eğer çok dirençli ve çok bi-yoakümülatif (vPvB) olarak sınıflandırılıyorsa, toplam skora ‘1” eklenmektedir.
COMMPS ve TTS metotları ile yapılan önceliklendirme sonuçları ile pilot alanlarda gerçekleştirilen izleme sonuçlarının birlikte değerlendirilmesi neticesinde 117 noktasal kaynaklı ve 133 yayılı kaynaklı ol-mak üzere toplamda 250 adet belirli kirletici ortaya konulmuştur. Bu aşamada, bir kimyasal izleme çalışma-larında önemli konsantrasyonlarda tespit edilmişse, önceliklendirme skoru çok yüksek olmasa da uzman görüşü ile belirli kirletici listesine dâhil edilmiştir.
Belirli kirleticiler için tatlı ve tuzlu sularda yıllık ortalama ve maksimum ÇKS’lerin (YO-ÇKS, MAK-ÇKS) belirlenmesi maksadıyla, literatürden elde edilen ve kalite değerlendirmesinden geçen farklı taksono-mik gruplara ilişkin güvenilir ve ilgili akut ve kronik toksisite verileri bir araya getirilmiş ve ekstrapolasyon yöntemleri ile kalite standartları hesaplanmıştır. Hesaplama sırasında, veri sayısı ve türüne bağlı olarak kul-lanılan yöntem değişiklik göstermiştir. ÇKS geliştirilirken, 2011 yılında SÇD için Ortak Uygulama Stratejisi kapsamında “Çevresel Kalite Standartlarının Belirlenmesine İlişkin Teknik Rehber Doküman”, kısa adıyla “27 No’lu Rehber Doküman”dan faydalanılmış ve “deterministik” ve “probabilistik” olmak üzere 2 temel metot kullanılmıştır. Deterministik metot, ekotoksikolojik veri sayısının kısıtlı olması durumunda kalite standardı belirlemede kullanılan bir yöntem olup, Rehber Dokümana göre ekotoksikolojik veri sayısının 10’dan az olması halinde bu metot ile ÇKS türetilmiştir. Deterministik metot kapsamında güvenilir en düşük toksisite verisi baz alınarak bu veriye 1 ila 10000 arasında değişen bir değerlendirme faktörü (DF) uygulan-mış ve bu şekilde elde edilen değer ÇKS olarak belirlenmiştir. Diğer taraftan, ekotoksikolojik veri sayısının 10 ve üzerinde olması halinde probabilistik metot kullanılmıştır. Probabilistik metot, ÇKS belirleme yön-temi olarak türlerin hassasiyet dağılımı (SSD) modelini esas almakta olup, kimyasala ilişkin tüm güvenilir toksisite verileri sıralanarak model çalıştırılmakta ve bu sayede kısaca HC5 olarak da bilinen söz konusu kimyasala karşı türlerin %95’i için koruma sağlayabilecek konsantrasyon eşiği belirlenmektedir. Bu yöntem-le elde edilen tehlike eşik değeri, deterministik metoda kıyasla daha küçük aralıkta seyreden ve eldeki veri sayısına bağlı olarak 1-5 arasında değişen bir DF’ye bölünmüş ve bu sayede modelde hesaba katılamayan diğer belirsizlikler de dikkate alınarak ÇKS değerleri hesaplanmıştır.
TURKISH JOURNAL OF WATER SCIENCE & MANAGEMENT
16
Flash Flooding and Green Stormwater Infrastructure in Philadelphia:Areas for Further Improvement
Abstract
Flash flooding is one of the most dangerous and the most common catastrophes among the other types of floods occure in USA. Flash flooding may occur in any area that may not even be located in floodplain zone. Since the flash flooding can take a few minutes or a few hours without any warning and has high damaging potential, in this study, it is focused on identifying areas prone to flash flooding in the Philadelphia city, which has many natural streams and high development rates. In this study therefore, an analytical model based on Geographic Information System (GIS) was developed to find the most flash flood prone areas in Philadelphia city and determine the relationship between the combined sewer area and the locations of green stormwater infrastructure projects.
Keywords: flood, flash flood, stormwater management, Philadelphia
Öz
Ani taşkınlar, Amerika Birleşik Devletleri’nde yaşanan taşkın çeşitleri arasında en tehlikeli ve en yaygın doğal afetle-rden bir tanesidir. Ani taşkınlar, taşkın riski taşımayan bölgelerde dahi, aşırı yağmur suyunun, doygunluğa ulaşmış toprak üstünde birikip yayılması ile, hiçbir uyarı vermeksizin bir kaç saat içerisinde meydana gelebilir. Bu çalışmada, bir çok nehire sahip ve yoğun kentleşmeye maruz kalan Filedalfiya şehrinde ani taşkın risk potansiyeli olan bölgeler belirlenmeye çalışılmıştır. Bu amaç doğrultusunda, Filedelfiya’daki ani taşkın riski olan bölgeleri belirlemek amacıyla Coğrafik Bilgi Sistemi (CBS)’ne dayalı analitik bir model oluşturulmuştur. Analiz sonucunda riskli olduğu belirlenen bölgelerde mevcut bulunan kanalizasyon şebekelerinin konumu ve bu bölgelerde çevreci yağmursuyu toplama yapılarının olup olmadığı ve bu sistemlerin birbiriyle olan etkileşimleri incelenmiştir.
Anahtar sözcükler: taşkın, ani taşkınlar, yağmur suyu kontrolü, Filedelfiya
Introduction
Philadelphia is at the forefront of using green stormwater infrastructure to mitigate flooding and stormwater issues. Philadelphia, just like many other cities those have old part in the USA, has combined sewer systems (CSS). In dry periods, sewage and stormwater do not interact, but in mod-erate to large rain events, sewage and stormwater combine and flow together into river systems. This is referred to a combined sewage overflow (CSO) and violates the EPA’s Clean Water Act (CWA). It is because of this that Philadelphia, along with several other cities, is under mandate to decrease the number of CSOs those occur often (PWD, 2014). On the other hand, it is well known that CSOs negatively influence river ecosystems, aquatic wildlife, and water quality. They also incur more cost as a higher quantity of water sent to treatment plants. Philadelphia’s long-term CSO control plan is the Green City (“with” or “together with”) Clean Waters program. Due to the above reasons, Phil-adelphia should be strategic in its placement of green stormwater infrastructure. This project looks at the relationship between flash flooding and Philadelphia’s combined sewer system. Furthermore,
Ela DOĞANAY1, Jamie MAGAZINER2
1Ministry of Forestry and Water Affairs General Directorate of Water Management 06510, Yenimahalle-Ankara - [email protected]
2Montgomery County’s Planning Commission, Norristown, PA, [email protected]
Received date: 03.05.2017, Revised date: 11.07.2017 Accepted date: 17.07.2017
Case Study

July - August - September - October - November - December / Volume: 1 Issue: 2 Year: 2017
17
it intends to look at the potential impacts of flash flooding on combined sewer overflows.
Objective
The purpose of this analysis is to find the areas in which green stormwater projects are missing within and around Philadelphia’s combined sewer area based on areas which has high flash flooding probability. The analysis is based on reclassification and weighted overlay tools for areas at highest flash flood risk. Projects will be recommended within the combined sewer area if projects are missing in the vulnerable areas defined by our analysis. The locations within both the analysis result and combined sew-er area will be subjected to recommendation for further stormwater management tools.
Background
Flooding is one of the most dangerous catastrophes and the most common natural hazard in the United States. A flood can impact a local area, an entire community, or large metropolitan region, whether or not it is located within the floodplain boundary (Carlin, 2009). There are different types of flooding. Some of them develop slowly, over a period of days, while others such as flash floods, can develop intensely; in just a few minutes with little warning. Flash flooding may occur due to an accumulation of rainwater on saturated ground and the water has nowhere else to go in an area that may not even be located in floodplain zone. Increasing urbanization is one of the reasons for increasing flood risk in the areas around urban streams and rivers (Bartosova et al., 2000). This is largely due to the high density of impervious cover. Since flash flooding occures oftenly in a few minutes or hours and has high damaging potential, in this study, it was focused on identifying prone areas has flash flooding probability in the Philadelphia city, which has many natural streams and high development level.
As mentioned above, Philadelphia has approached the issue of combined sewer overflows with its long term control plan of Green City – Clean Waters program. The policies within this plan only effects the future development and runoff problems and seek to reduce the risk of pollution any further, rather than requiring mitigation for past development. At the end of the 25-year pro-gram, $2.4 billion will have been invested by the PWD into stormwater management (PWD, 2011). In 2009, the EPA created the Urban Waters Initiative with the goals of: improving water quality to a level that makes rivers fishable/swimmable/drinkable, improving public health, the environ-ment and quality of life, and sustaining community improvements over multiple generations (PWD, 2011). The Green Cities, Clean Waters program followed in the footsteps of this initiative and states in its report that it will keep these goals in mind in its long-term plan.
The city of Philadelphia has made great strides in mitigating the stormwater issues faced by the city in its innovative LTCP. Other cities, such as Cleveland and Washington DC, who are also under mandate by the EPA, have designed stormwater programs with a focus on ‘grey infra-structure’. Grey infrastructure is the underground matrix of drainage and pipes that swiftly removes wastewater from the surface (EPA, 2013). Particularly in older cities, this infrastructure is in decline and is very costly to repair. Philadelphia’s Green City – Clean Waters program is focused on green

TURKISH JOURNAL OF WATER SCIENCE & MANAGEMENT
18
infrastructure, which is a general term for more ‘environmentally friendly’ stormwater manage-ment techniques (EPA, 2013). Other green infrastructure tools include: 1) stormwater tree trenches, 2) green roofs, 3) rain barrels, 4) pervious surfaces/paving, 5) stormwater wetlands, 6) lanters, 7) bump-outs, and 8) rain gardens (PWD, 2014). The plan also includes pipe laying and sewer recon-struction. The program is a part of the Mayor Nutter’s Greenworks plan toward making Philadelphia “The Greenest City in America” (PWD, 2011).
The following map (Figure 1) shows the boundaries of Philadelphia, its combined sewer system, surface streams, and green stormwater infrastructure projects.
Scope
The purpose of this analysis is to find the areas in which green stormwater projects are miss-ing within and around Philadelphia’s combined sewer area has high probability of flash flooding. The analysis is based on reclassification and weighted overlay tools for areas at highest flash flood risk. Projects will be recommended within the combined sewer area if projects are missing in the vulnerable areas defined in this study. The locations within both the analysis result and combined sewer area will be subjected to recommendation for further stormwater management tools. This research seeks to answer several questions listed below:
Figure 1. The boundaries of Philadelphia, its combined sewer system, surface streams, and green stormwater infrastructure projects

July - August - September - October - November - December / Volume: 1 Issue: 2 Year: 2017
19
• What areas of Philadelphia are susceptible to flash flooding?
• Are these areas at inside or outside of the combined sewer area?
• Are green stormwater infrastructure projects present in these areas?
The answers to these questions and their analysis can be found in the Analysis and Results section of this paper.
Literature Review and Case Studies
The literature reviewed in this paper includes works regarding green stormwater man-agement and its success in US cities as well as GIS projects which used the similar analysis and methodology to this work. Use of a combination of these literature types helps to this project to have a strengthened and clarified focus.
The use of green infrastructure in stormwater management plans has been growing rap-idly in recent years. Keeley et al (2012) defines green infrastructure as a term “referring to the management of landscapes in ways that generate human and ecosystem benefits”. Warren et al (2009) provides a more complex definition: “a structure of interconnected greenways (trails, stream corridors) and green hubs (forests, farms, parks) located throughout a region to protect wildlife diversity, ecological processes, air and water quality and recreation opportunities. In “Perspectives on the Use of Green Infrastructure for Stormwater Management in Cleveland and Milwaukee”, Keeley et al (2012) analyzes the challenges of integrating both grey and green infrastructure using the two cities as case studies. Green infrastructure was identified as having two major roles: stormwater management and urban revitalization. Challenges were measured across the categories of financial, administrative and political, and technical. The study con-cluded that financial issues were the strongest indicator of green infrastructure installation.
The Warren et al (2009) examined the benefits of green infrastructure in great depth. The research states that green infrastructure has been shown to protect and/or improve water quality mainly through increased infiltration. Incorporation of green infrastructure in a water-shed-based plan could significantly decrease stormwater runoff volume and water pollution. Green infrastructure can potentially lower maintenance costs in the long-term mainly due to the reduction in stormwater flowing through ‘structural controls’ (Warren et al, 2009). The study also discussed the prospect of green infrastructure planning and implementation at the state, regional and local levels. In evaluating the most successful GI principles, Warren et al (2009) point out that green infrastructure systems operate much more efficiently when whole rather than fragmented. These systems are typically composed of larger and smaller ‘hubs’ or areas of open space with links, which can be greenways or stream corridors (Warren et al, 2009). The literature supports the idea that protection of large undeveloped tracts of land, particularly surrounding stream areas, is a significant component of protecting water quality and infiltration (Warren et al., 2009). This is referred to as ‘large tract conservation’ and should be considered an important component of watershed-based stormwater control plans.

TURKISH JOURNAL OF WATER SCIENCE & MANAGEMENT
20
A study conducted by Nancy Carlin, was very valuable to the research conducted for this project. She explored flash flooding risk in this region in Wisconsin (Carlin, 2009). The author stated that most flash flooding occurs when too much water accumulated on saturated ground by heavy rains and the water has nowhere else to go. Flash flooding can take minutes or hours to develop and transpire with little warning, making flash flooding extremely dangerous (Carlin, 2009). Carlin’s study was focused on evaluating areas susceptible to repeat flash flooding in La Crosse County, Wisconsin. To define areas with highest risk factors (i.e. most likely to flood, soil type, land use, slope, and stream proximity etc.) were used in three levels: 1) most favorable or best locations to least likely to experience flash flooding, 2) moderate conditions, and 3) the least favorable or areas most likely to experience flash flooding. The study also looked at infrastructure damage in comparison to the flash flood area results. The results of the study found that most infrastructure sites were not in the flash flood risk area. This is most likely due to the fact that buildings were not placed in this area due to being located in floodplains or having a history of flooding. This approach was used in this study to build the methodology of defining areas susceptible to flash flooding in Philadelphia.
MethodData Acquisition
This study is based on four different sorts of data. These are soil types, land use, streams, and elevation. Soil was obtained from the Natural Resources Conservation Service (NRCS). Land use, streams, and contours were accessible through the Pennsylvania Spatial Data Access (PASDA).
Data Preparation
A ranking process to rate the susceptibility of areas to flash flooding is used in this study. This process is based on the Carlin (2009) mentioned previously. The process can be presented as follows:
• 1: Least likely to experience flash flooding• 2: Moderately likely to experience flash flooding• 3: Most likely to experience flash flooding
All original data was in vector format and through our analysis was converted to raster by using ‘topo to raster’ and ‘polygon to raster’ tool. A cell size of 50 feet was used for the output raster data that gave the clearest and most aesthetically pleasing result. The soil layer required slightly more preparation prior to the analysis. Tabular data had to be joined to the shapefile in order for it to contain the necessary attribute information. This data was used as the field con-taining soil drainage information.
Soil Layer
The soil types were classified into three groups based on soil drainage characteristics. The folowing tables show the soil types contained in each class (Tables 1 – 3).
July - August - September - October - November - December / Volume: 1 Issue: 2 Year: 2017
21
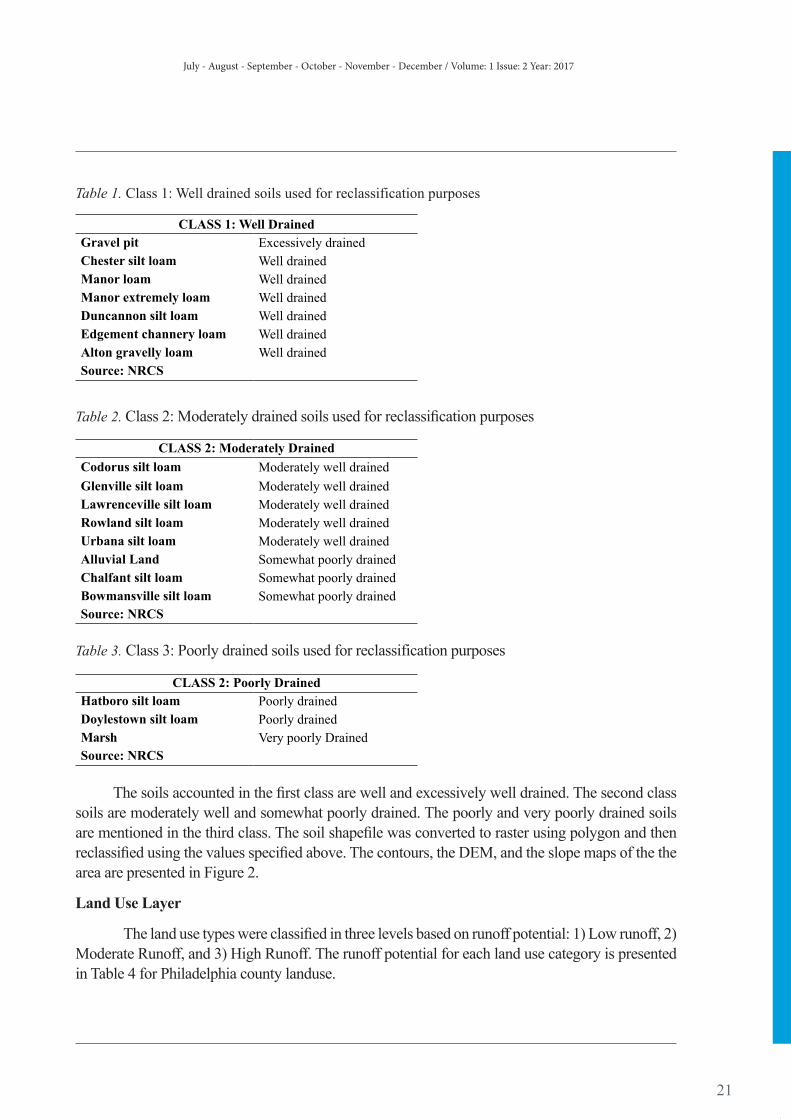
Table 1. Class 1: Well drained soils used for reclassification purposes
Table 2. Class 2: Moderately drained soils used for reclassification purposes
Table 3. Class 3: Poorly drained soils used for reclassification purposes
The soils accounted in the first class are well and excessively well drained. The second class soils are moderately well and somewhat poorly drained. The poorly and very poorly drained soils are mentioned in the third class. The soil shapefile was converted to raster using polygon and then reclassified using the values specified above. The contours, the DEM, and the slope maps of the the area are presented in Figure 2.
Land Use Layer
The land use types were classified in three levels based on runoff potential: 1) Low runoff, 2) Moderate Runoff, and 3) High Runoff. The runoff potential for each land use category is presented in Table 4 for Philadelphia county landuse.
CLASS 1: Well DrainedGravel pit Excessively drainedChester silt loam Well drainedManor loam Well drainedManor extremely loam Well drainedDuncannon silt loam Well drainedEdgement channery loam Well drainedAlton gravelly loam Well drainedSource: NRCS
CLASS 2: Moderately Drained
Codorus silt loam Moderately well drained
Glenville silt loam Moderately well drainedLawrenceville silt loam Moderately well drainedRowland silt loam Moderately well drainedUrbana silt loam Moderately well drainedAlluvial Land Somewhat poorly drainedChalfant silt loam Somewhat poorly drainedBowmansville silt loam Somewhat poorly drainedSource: NRCS
CLASS 2: Poorly DrainedHatboro silt loam Poorly drainedDoylestown silt loam Poorly drainedMarsh Very poorly DrainedSource: NRCS

TURKISH JOURNAL OF WATER SCIENCE & MANAGEMENT
22
Table 4. Class 3: Poorly drained soils used for reclassification purposes
Park/open space and vacant land uses were given a low runoff potential, culture/recreation and transportation areas were given a moderate runoff potential and civic/institution, commer-cial, industrial and residential areas were given a high runoff potential. Herein the land use was converted to a raster file using polygon to raster and reclassified using the above classification. Reclassification of land use can be seen in Figure 3.
Elevation Layer
The elevation layer required several more steps before reclassification. This process is dis-played in Figure 2. First, a topo to raster conversion was done to get a digital elevation model (DEM) for Philadelphia. Next the slope tool was used. The slope was classified into three groups using natural breaks. Three elevation rankings were determined according to the slope percentage. Areas that have less than 8 percent slope were represented with the class # 1. The land in this class are most favorable areas or least likely to experience flash flooding. Areas that have slope of 8-27 percent were represented with the class #2. Such areas are moderately favorable or areas moderately likely to experience flash flooding. Areas with the slope greater than 27 percent were accounted in the third class. According to the above mentioned consideration, the lands were reclassified and the reclassification based on land elevation were mapped as seen in Figure 2.
Figure 2. Conversion of Contours Data to Slope: a) contours, b) DEM, and c) slope
Philadelphia County Landuse
Runoff Potential Acres % of CountyCivic/Institution High 4390 4.8
Commercial High 4370 4.8Culture/Recreation Moderate 3251 3.6
Industrial High 10773 11.8Park/Open Space Low 8842 9.7
Residential High 25922 28.3Transportation Moderate 23838 26.1Vacant or Other Low 4869 5.3
Water Restricted 5248 5.7County Total - 91503 100
Source: PASDA, 2013

July - August - September - October - November - December / Volume: 1 Issue: 2 Year: 2017
23
Stream Layer
Because sites close to streams have the highest flooding risk, a multiple ring buffer anal-ysis was made for each 100, 200, and 300 feet elevation. This polygon buffer output was then converted to a raster via polygon to raster based on the weight field. The areas between 300 and 200 feet altitude were evaluated in the first class. Such lands are the most favorable areas or the least likely to experience flash flooding. The areas between 200 and 100 feet altidute were accounted in the second class. Such areas are moderately likely to experience flash flooding. The areas have the altidute less than 100 feet (i.e. closest to a stream) were accepted as third class lands. These lands are the least favorable and the most likely to experience flash flooding. Next, the raster was reclassified based on the above classification as mapped in the Figure 3.
Figure 3. Reclassification of Flood Prone Areas: a) land use, b) streams, c) soil, d) slope
ResultsAnalysis and Results
Using the reclassified streams, soil, land use, and slope outputs, a weighted overlay was determined to find the areas most susceptible to flash flooding in Philadelphia. The entire meth-odology and analysis is resulted as a flood risk mapp which is presented in Figure 4. A similar symbology was used throughout this analysis to remain consistent. Red areas represent areas highly likely to experience flash flooding, yellow represent areas moderately likely to experi-ence flash flooding, and finally, green represents areas least likely to experience flash flood-ing. One can see from the map that green stormwater projects are largely focused within the combined sewer area. This is important for decision making on the which area has the highest likelihood to reduce combined sewer overflows and meet the EPA mandate for the city.

TURKISH JOURNAL OF WATER SCIENCE & MANAGEMENT
24
It can also be seen that the areas susceptible to flash flooding are outside of the combined sewer system. This situation has several reasons: First, since these streams are buried in ground into the pipes and culverts, when looking within the combined sewer system the surface of the streams is invisible. On the other hand, since stream data was one of the components of the reclassification and overlay, any flash flood areas is not be expected on a stream free zone. Additionally, the used soil data had a ‘blank’ value for a large area of Philadelphia, particularly within the combined sewer area. This may be because of high impervious cover but it is yet to be determined. This is also contributed to the resulted locations.
Based on concentrated areas of high risk, we focused on three areas to recommend further evaluation. These can be seen in Figure 4. and Figure 5. Policy recommendations for these areas are in the relevant section below. The first focus area is entirely outside of the combined sewer system in an area with a high slope. This location contains the highest concentration of high risk area in the city. There are only 3 green stormwater projects in this severe area. The following two focused areas are bordering the combined sewer system with some areas overlapping it. These two ‘bordering’ areas both only contain one project in or in close proximity to them. This lack of projects may have an impact on how floodwaters interact with these areas and enter the combined sewer system. Further discussion of these areas is in the Policy Recommendations section.
Figure 4. Areas Susceptible to Flash Flooding in Philadelphia

July - August - September - October - November - December / Volume: 1 Issue: 2 Year: 2017
25
Figure 5. Areas Susceptible to Flash Flooding in Philadelphia
Figure 6. Areas Susceptible to Flash Flooding in Philadelphia
Issues, Solutions and Future Tasks
There was one significant issue with data for this project. The green stormwater project data, obtained from PASDA, was updated and available on January 2nd, 2013. However, on the Green City, Clean Waters website, the numbers of projects is significantly higher than the number of proj-

TURKISH JOURNAL OF WATER SCIENCE & MANAGEMENT
26
ect data used in the analysis. The webpage is recorded as being updated on March 28th, 2014; thus, the used data does not reflect the current situation. Tables 5 and 6 display the differences in the nu-merical information for green stormwater projects in Philadelphia.
Table 5. Green Stormwater Data Used in Analysis
Table 6. Green Stormwater Numbers on Philly Watersheds website
Project Type Number of ProjectsStormwater Tree Trenches 342
Stormwater Planters 38Stormwater Bumpouts 45
Rain Gardens 101Stormwater Basins 5
Infiltration/Storage Trenches 112Porous Paving 37
Swales 23Stormwater Wetlands 2Cistern or Rain Barrel 1
Downspout Planters 33Other 17Total 756
PWD Data updated 1/2/13
It can be seenfrom the tables that the updated information contains a total of 756 projects as compared to the 277 projects recorded in the data used in the analysis. The newly updated infor-mation is not yet available as downloadable data. It may due to the fact that our results may not be accurate in revealing trends in the locations of green stormwater projects. When simply looking at the maps in comparison one to another, they do seem to avoid the edges of the combined sewer area. These are the areas that we suggest need projects due to flood risk, because our results may still be relatively accurate. We suggest that this analysis should be redone at the time of updated data avail-ability to ensure this accuracy. It is important to note that many of these projects are in design and in
Project Type Number of ProjectsStormwater Tree Trenches 138
Stormwater Planters 13Stormwater Bumpouts 33
Rain Gardens 37Stormwater Basins 3
Infiltration/Storage Trenches 12Porous Paving 27
Swales 2Stormwater Wetlands 2Cistern or Rain Barrel 0
Downspout Planters 0Other 10Total 277
PWD Data updated 1/2/13
July - August - September - October - November - December / Volume: 1 Issue: 2 Year: 2017
27
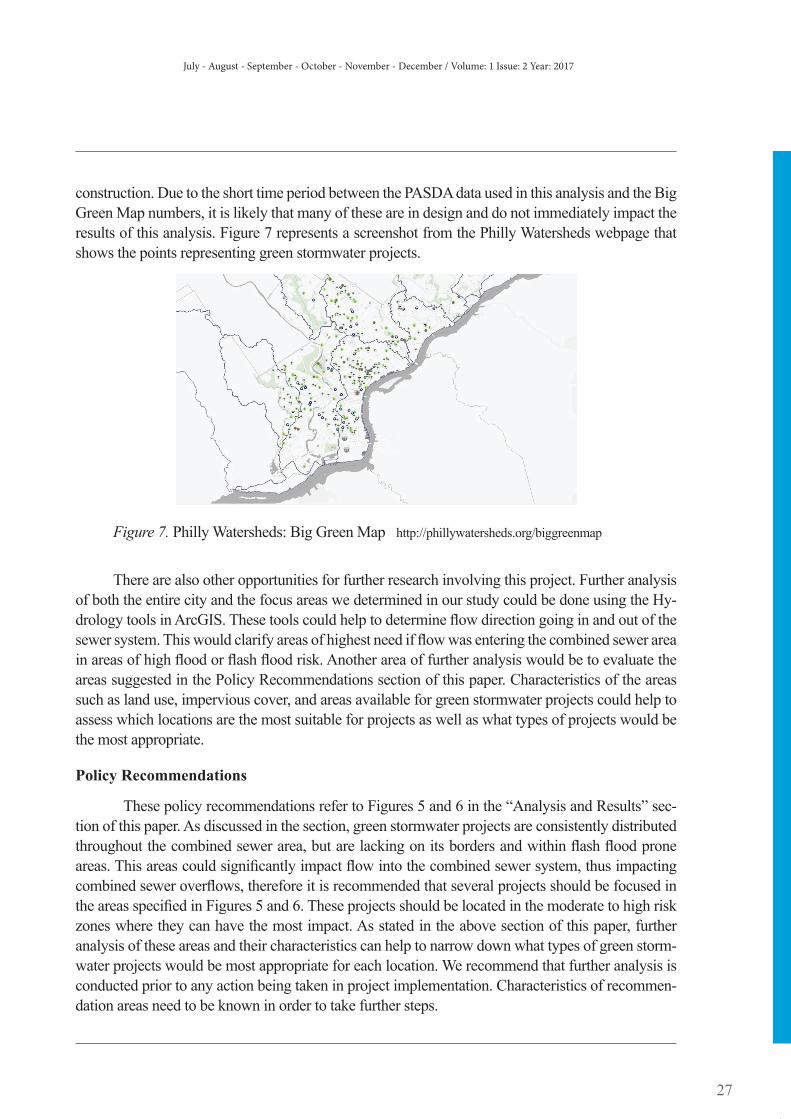
construction. Due to the short time period between the PASDA data used in this analysis and the Big Green Map numbers, it is likely that many of these are in design and do not immediately impact the results of this analysis. Figure 7 represents a screenshot from the Philly Watersheds webpage that shows the points representing green stormwater projects.
Figure 7. Philly Watersheds: Big Green Map http://phillywatersheds.org/biggreenmap
There are also other opportunities for further research involving this project. Further analysis of both the entire city and the focus areas we determined in our study could be done using the Hy-drology tools in ArcGIS. These tools could help to determine flow direction going in and out of the sewer system. This would clarify areas of highest need if flow was entering the combined sewer area in areas of high flood or flash flood risk. Another area of further analysis would be to evaluate the areas suggested in the Policy Recommendations section of this paper. Characteristics of the areas such as land use, impervious cover, and areas available for green stormwater projects could help to assess which locations are the most suitable for projects as well as what types of projects would be the most appropriate.
Policy Recommendations
These policy recommendations refer to Figures 5 and 6 in the “Analysis and Results” sec-tion of this paper. As discussed in the section, green stormwater projects are consistently distributed throughout the combined sewer area, but are lacking on its borders and within flash flood prone areas. This areas could significantly impact flow into the combined sewer system, thus impacting combined sewer overflows, therefore it is recommended that several projects should be focused in the areas specified in Figures 5 and 6. These projects should be located in the moderate to high risk zones where they can have the most impact. As stated in the above section of this paper, further analysis of these areas and their characteristics can help to narrow down what types of green storm-water projects would be most appropriate for each location. We recommend that further analysis is conducted prior to any action being taken in project implementation. Characteristics of recommen-dation areas need to be known in order to take further steps.

TURKISH JOURNAL OF WATER SCIENCE & MANAGEMENT
28
Discussion and ConclusionFlash flood risk is a high concern for the focused areas determined by this study. The results
imply that green stormwater management projects are consistently distributed across the combined sewer area but are not typically present around its boundaries which are aligned with Philadelphia’s rivers and flash flood prone areas. Flash flood prone areas are mainly at the outside of the combined sewer area but likely have an impact on how flooding occurs near and within the CSS. The method-ology used in this study has the potential to be replicated and expanded upon for further research. It is clear that green stormwater infrastructure projects are well distributed across the combined sewer area. The results of this analysis conclude that there is room for further expansion of projects in areas bordering the CSS in zones of high flash flood risk. Further analysis of characteristics of these areas is necessary in order to determine the types of projects most appropriate. Due to the seriousness of combined sewer overflows, these recommendations should not be taken lightly as they have high potential of reducing CSOs. Further research could strengthen this study and reinforce its recom-mendations for Philadelphia.
AcknowledgementSome parts of the article was presented as poster presentation at the meeting of the Philadel-
phia Metropolitan Area Section of the American Water Resources Association (AWRA-PMAS) .

July - August - September - October - November - December / Volume: 1 Issue: 2 Year: 2017
29
ReferencesBartosova, A. ,Clark, D., Novotny,V.& Taylor, K. (2000). Using GIS to Evaluate the Effects of Flood Risk on Residential Property Values. Retrieved May 1 2014 from http://epublications. marquette.edu/cgi/viewcontent.cgi?article=1132&context=econ_fac
Carlin, N. (2009). Spatial Analysis Using GIS to Evaluate Areas Susceptible to Flash Flooding in La Crosse County, Wisconsin. Retrieved April 29 2014 from http://www.gis.smumn.edu/ GradProjects/CarlinN.pdf
EPA. (2013). Case Studies Analyzing the Economic Benefits of Low Impact Development Green Infrastructure Programs. Retrieved April 25 2014 from http://water.epa.gov/infrastructure/ greeninfrastructure/gi_costbenefits.cfm
EPA. (2013). Green and Gray Infrastructure Research. Retrieved April 20 2014 from http://www. epa.gov/nrmrl/wswrd/wq/stormwater/green.html
Keeley, M., Koburger, A., Dolowitz, D. P., Medaris, D., Nickel, D., & Shuster, W. (2013). Perspectives on the Use of Green Infrastructure for Stormwater Management in Cleveland and Milwaukee. Environmental Management, 51, 1093-1198.
Philadelphia Water Department (PWD). (2011). Green City Clean Waters: The City of Philadelphia’s Program for Combined Sewer Overflow Control. Retrieved April 18 2014 from http://www.phillywatersheds.org/what_were_doing/documents_and_data/cso_long_ term_control_plan
PWD. (2012). Green Cities, Clean Waters. Retrieved April 18 2014 from http://www. phillywatersheds.org/what_were_doing/documents_and_data/cso_long_term_control_plan
PWD. (2014). Mandates. Retrieved April 20 2014 from http://phillywatersheds.org/watershed_ issues/mandates
Warren, M. P., Younos, T. & Randolph, J. (2009). Implementing Watershed-Based Green Infrastructure for Stormwater Management: Case Study in Blacksburg, Virginia. Retrieved April 20, 2014, from http://vwrrc.vt.edu/special_reports.html
TURKISH JOURNAL OF WATER SCIENCE & MANAGEMENT
30
Extended Turkish Abstract(Genişletilmiş Uzun Türkçe Özet)
Filedalfiya’da Ani Taşkınlar ve Çevreci Yağmur Suyu Altyapıları:Geliştirilmesi Gereken Bölgeler
En tehlikeli afetlerden olan taşkın Amerika Birleşik Devletlerin’de en çok yaşanan doğal afetlerden biridir. Her taşkın aynı şekilde gerçekleşmez. Taşkınların bazıları birkaç gün sürerken, çok kısa sürede yaşanan ani taşkınlar da vardır. Ani taşkınlar, taşkın riski taşımayan bölgelerde dahi aşırı yağmur suyunun doygunluğa ulaşmış toprak üstünde birikip yayılmasından dolayı kısa sürede meydana gelebilir. Artan kentleşme ile birlikte şehirlerde geçirimsiz yüzey-lerin çoğalması, şehir taşkınlarının artmasındaki en önemli etkenlerden biri haline gelmiştir (Bartosova et al, 2000). Ani taşkınların birçoğu yoğun yağış durumunda, bir kaç dakika ya da bir kaç saat içinde meydana gelir ve hasar verme potansiyeli yüksektir. Bundan dolayı, bu çalışmada birçok nehire sahip ve yoğun kentleşme görülen Filedelfiya şehrinde ani taşkın riski taşıyan bölgelerin belirlenmesi amaçlanmıştır.
Filedelfiya taşkın ve yağmur suyu kontrolünde çevreci yağmur suyu toplama altyapıları kullanımında öncü bir şehirdir. Filedelfiya, Amerika Birleşik Devletleri’ndeki diğer pek çok eski şehir gibi birleşik kanalizasyon sistemine (BKS) sahiptir. Yağmur yağmadığı zamanlarda, sistem sadece atıksu taşımakta, yağmur yağdığı du-rumlarda, aşırı yağmur suyu kanalizasyon sisteminde toplanmakta, sistemin kapasitesini aşması durumunda ise kanalizasyon taşkınını önlemek amacıyla atıksu, yağmur suyu ile birlikte akıp nehre dökülmektedir. Bu durum kanalizasyon kapasitesinin aşılması (KKA) durumu olarak ifade edilmektedir. Nehir ekolojisini, sucul yaşamı ve su kalitesini olumsuz etkilemesinden dolayı Filedelfiya Çevre Ajansı’nın yürütmekle sorumlu olduğu Tem-iz Su Kanunu’nu (TSK) ihlal edilmektedir. Bu Kanun gereği KKA durumunun önlenmesi zorunludur (PWD, 2014). Bundan dolayı Fildelfiya’da uzun vadede yağmur suyu kontrolünü ve su kalitesini korumak amacıyla Yeşil Şehir-Temiz Su Programı hazırlanmıştır. Bu programla, hem programın amacını gerçekleştirmek hem de KKA oluşumunu önlemek için çevreci yağmur suyu altyapıları uygulamasına başlanmıştır. Bu makale çalışması kapsamında, Filedelfiya’da ani taşkın riski taşıyan bölgelerin, birleşik kanalizasyon sistemine mesafeleri ve bu bölgelerde çevreci yağmur suyu altyapılarının mevcudiyeti belirlenmeye çalışılmıştır. Bu amaç doğrultusunda, Filedelfiya’daki ani taşkın riski olan bölgeleri belirlemek amacıyla Coğrafik Bilgi Sistemi (CBS)’ ne dayalı anali-tik bir model oluşturulmuştur. Analiz sonucunda riskli olduğu belirlenen bölgelerde mevcut bulunan kanalizasyon şebekelerinin konumu ve bu bölgelerde çevreci yağmursuyu toplama yapılarının olup olmadığı ve bu sistemlerin birbiriyle olan etkileşimleri incelenmiştir.
Bu çalışma kapsamında şu sorulara cevap aranmıştır:
• Filedelfiya’da ani taşkın riski taşıyan bölgeler
• Bu bölgelerin, birleşik kanalizasyon sistemine sahip alanların içerisinde kalıp kalmadığı
• Çevreci yağmur suyu altyapılarının bu bölgelerde mevcudiyeti.
Bu çalışmada CBS programının Weighted Overlay özelliği kullanılmıştır. Bu özelliğin çalışma prensibi, model için kullanılan verileri, özelliklerine göre kendi içinde gruplandırıp belirlenen kritere dayanarak veriye bir değer atamak şeklindedir. CBS modelinde, toprak cinsi, arazi kullanımı, nehre yakınlık ve sayısal yükseklik verileri olmak üzere 4 farklı veri kullanılmıştır. Toprak verisi Doğal Kaynakları Koruma Servisi'nden (Natural Resources Conservation Ser-vice-NRCS), arazi kullanımı, nehre yakınlık ve sayısal yükseklik verileri ise Pensilvanya Mekânsal Veri Erisimi’nden (Pennsylvania Spatial Data Access (PASDA) elde edilmiştir. Bir bölgenin ani taşkın riski potansiyelini belirlemek için bir puanlama yöntemi kullanılmıştır.

July - August - September - October - November - December / Volume: 1 Issue: 2 Year: 2017
31
• 1 puan: Taşkın riski olma ihtimali en az
• 2 puan: Taşkin riski olma ihtimali orta derece
• 3 puan: Taşkin riski olma ihtimali yüksek
Her veri, verinin taşkın riskini etkileme değerine göre gruplandırılarak puanlanmıştır. Toprak yapısı verisi drenaj kalite-sine göre üç gruba ayrılmıştır: iyi drene, orta drene ve kötü drene toprak olmak üzere. İyi drene toprağın su geçirgenliği yüksek olduğundan çok miktarda su hızlı bir şekilde toprağa sızacak ve akışa geçen su miktarı daha az olacaktır. Bu sebeple puanlama yapılırken iyi drene toprağa taşkın riski çok düşük olduğu için 1 puan, orta drene toprağa 2 puan ve kötü drene toprağa ise, nispeten daha az su sızacağı için ani taşkın riski yüksek olduğu öngörülerek 3 puan atanmıştır. Endüstriyel alanlar, yerleşim yerleri, parklar, tarihi mekânlar, şehir merkezleri, yollar ve boş alanlardaki toprağın kaplı olduğu malzemeye göre yağmur suyu akışının değişeceği gerçeğinden hareketle değerlendirme yapılmıştır. Örneğin endüstriyel bölgelerde toprak üstünün betonla kaplı olduğu alanların miktarı çok olacağından akışa geçen su miktarının da aşırı olacağı öngörüsünden hareket edilmiştir. Park ve mesire yerlerinde genel olarak toprak yüzeyi bitkilerle örtülmüş veya çıplak olacağından dolayı yağmur suyunun büyük oranda toprağa sızacağı ve daha az akış olacağı ön kabulüyle hareket edilmiştir. Akışa geçen su miktarı az, akışa geçen su miktarı orta ve akışa geçen su miktarı çok olarak veriler üç grupta toplanmış ve her gruba sırasıyla 1, 2 ve 3 puanları atanmıştır. Nehre yakınlık riski için nehre 100, 200 ve 300 fit uzaklık dikkate alınarak 3 ayrı tampon bölge oluşturulmuştur. Nehre 100 fit uzaklığındaki bölge, nehrin taşması durumunda, nehre yakın olmasından dolayı daha çok risk taşımaktadır. Bu sebeple 100 fit uzaklıktaki bölgeye 1, 200 fit uzaklıktaki bölgeye 2 ve 300 fit uzaklıktaki bölgeye 3 puan verilmiştir. Son olarak sayısal yük-seklik verisi kullanılarak eğimli bölgeler belirlenmiştir. Eğim verileri, % 8’den düşük eğim, % 8 ile 27 arası eğim ve % 27’den yüksek olmak üzere üç gruba ayrılmıştır. Eğimin yüksek olduğu yerlerde yağmur suyu akış hızının da yüksek olacağı ve bu sebeple suyun toprağa sızma miktarının düşük olacağı göz önünde bulundurularak % 8’den düşük olan gruba 1, eğimi % 8 ile yüzde 27 arasında olan gruba 2 ve eğimi yüzde 27’den yüksek olan gruba 3 puan verilmiştir.
CBS programında Weighted Overlay özelliği ile veriler kendi içinde sınıflandırılıp ani taşkın riski potansiyellerine göre derecelendirilip analizi yapılmıştır. Analiz sonucu elde edilen haritalarda Filedelfiya şehrinde ani taşkın olma ihti-mali yüksek olan bölgeler öngörülmüştür. Harita üzerinde riskli bölgelerin birleşik kanalizasyon sistemine yakınlığı ve o bölgelerde çevreci yağmur suyu toplama altyapılarının mevcudiyeti de değerlendirilmiştir.

TURKISH JOURNAL OF WATER SCIENCE & MANAGEMENT
32
Institutional Framework in Flood Management in France and Recommendations for Turkey
Abstract
The purpose of this study is to; make proposals regarding the authority, duty and responsibility distribution in the Flood Risk Management through the examination of the example from an EU member country and compar-ison with the existing practices in Turkey in order to provide flood management plans prepared at the basin scale in Turkey with the active participation of all stakeholders and to provide the necessary coordination on flood man-agement at all scales. Within this context, a quick scan study on Member States of the European Union was carried out, legal framework, institutional framework, responsibility distribution and the major institutions involved in flood risk management in France were examined and compared with the implementation in Turkey. By taking the advantage of the information gained from this assessment and taking into consideration the current situation, the proposals were made regarding the duties and responsibilities of the Flood Risk Management Turkey.
Keywords: flood risk management in France, institutional framework of flood risk management, flood risk mangement recomendations for Turkey
Öz
Bu çalışmanın maksadı, Türkiye’de taşkın yönetim planlarının tüm paydaşların aktif katılımıyla havza ölçeğinde hazırlanması ve taşkın yönetimi ile ilgili gerekli koordinasyonun her ölçekte sağlanabilmesi için; AB üye ülke örneği incelenmesi ve Türkiye’deki mevcut uygulamalarla karşılaştırılması yoluyla Taşkın Riski Yönetiminde yetki, görev ve sorumluluk dağılımı ile ilgili öneriler sunulmasıdır. Bu kapsamda Avrupa Birliği üyesi ülkeler ile ilgili bir hızlı tara-ma çalışması yapılmış, Fransa’daki taşkın riski yönetiminin yasal çerçevesi, genel çerçevesi, sorumluluk dağılımı ve taşkın riski yönetiminde yer alan başlıca kurumlar incelenerek Türkiye’deki uygulamalar ile karşılaştırılmıştır. Bu değer-lendirmeden elde edilen bilgilerden faydalanılarak ve mevcut durum göz önüne alınarak Türkiye’deki Taşkın Riski Yönetiminde yetki, görev ve sorumluluk dağılımı ile ilgili öneriler sunulmuştur.
Anahtar sözcükler: Fransa’da taşkın riski yönetimi, taşkın risk yönetiminde kurumsal çerçeve, taşkın risk yönetimi için Türkiye’ye öneriler
IntroductionFlood events are among the most important disasters in the world, and even though they
are natural disasters, human activities are the main reason of their effects being so great. Settle-ments activities in floodplains, interventions in riverbeds, increased urbanization and industri-alization activities are some of those activities. In addition to human activities, another reason for the increase in flood risk in recent years is thought to be climate change and an increase in heavy rainfalls through the impact of climate change is foreseen. Taking these factors into consideration, it is expected that the floods may increase both in frequency and damage and depending on this, the importance of flood management increases day by day.
Since it is known that damages caused by floods cannot be prevented only by controlling flood control, flood risks must be managed through a multidisciplinary and holistic approach in
Işıl SAKIN1
1Ministry of Forestry and Water Affairs General Directorate of Water Management, 06510, [email protected]
Received date: 12.04.2017, Revised date: 07.07.2017, Accepted date: 17.07.2017
Review Article

July - August - September - October - November - December / Volume: 1 Issue: 2 Year: 2017
33
order to ensure that these damages are reduced or even completely eliminated when possible. In this context, it is necessary to assess the basin as a whole, taking into account the upstream - downstream relationship in the basin and focusing not only to floods, but also to parameters that can affect or can be affected from floods.
In many countries, notably in European countries, the local flood prevention approach has been shifted to “management of flood risks on a wider scale”. However, in order to realize this comprehensively, according to the multidisciplinary approach; it is necessary to include many institutions and organizations into the flood risk, which constitutes the important part of the flood risk management, provide them perform their activities in coordination, and in coop-eration when necessary, with each other. Moreover, Flood Risk Management Plans should be prepared at basin scale and with the active participation of all stakeholders.
Each institution in Turkey performs their activities regarding Flood Management sep-arately within its field of activity and responsibilities. A flood risk management structure, by which all institutions having activities related to floods can participate in and contribute to the decision making process, will contribute to more effective management of floods, obtain more efficient results, prevent duplication of work and ensure the effective use of resources.
The establishment of the General Directorate of Water Management within the Ministry of Forestry and Water Affairs of Turkey and the studies carried out in this context are considered as im-portant steps taken in this direction. Another important step was the establishment of Basin Manage-ment Committees and Provincial Water Management Coordination Boards. Following those steps; it will be beneficial to review and strengthen the existing institutional structure and legal regulations in order to implement the basin-scale flood risk management approach more effectively.
Although the legal framework and institutional structure are complementary subjects, the fo-cus of this study is on institutional structure since each one is the subject of a comprehensive study.
Within this context, legislative framework, general framework of flood risk manage-ment, responsibility distribution and the main institutions involved in flood risk management in France, which is one of the Member States of the European Union, have been examined.
As a conclusion, suggestions for the strengthening the Flood Risk Management in Turkey have been presented by benefiting from France’s experiences.
MethodThe country to be studied, for the authority-responsibility distribution and cooperation
between institutions in flood risk management, has been selected among the Member States of the European Union with the aspect of being an example both for basin-scale governance and implementation of Floods Directive.
A quick scan of the current 28 EU member countries was conducted and the information was gathered on the; year of incorporation, population, surface area, number of basins, institu-
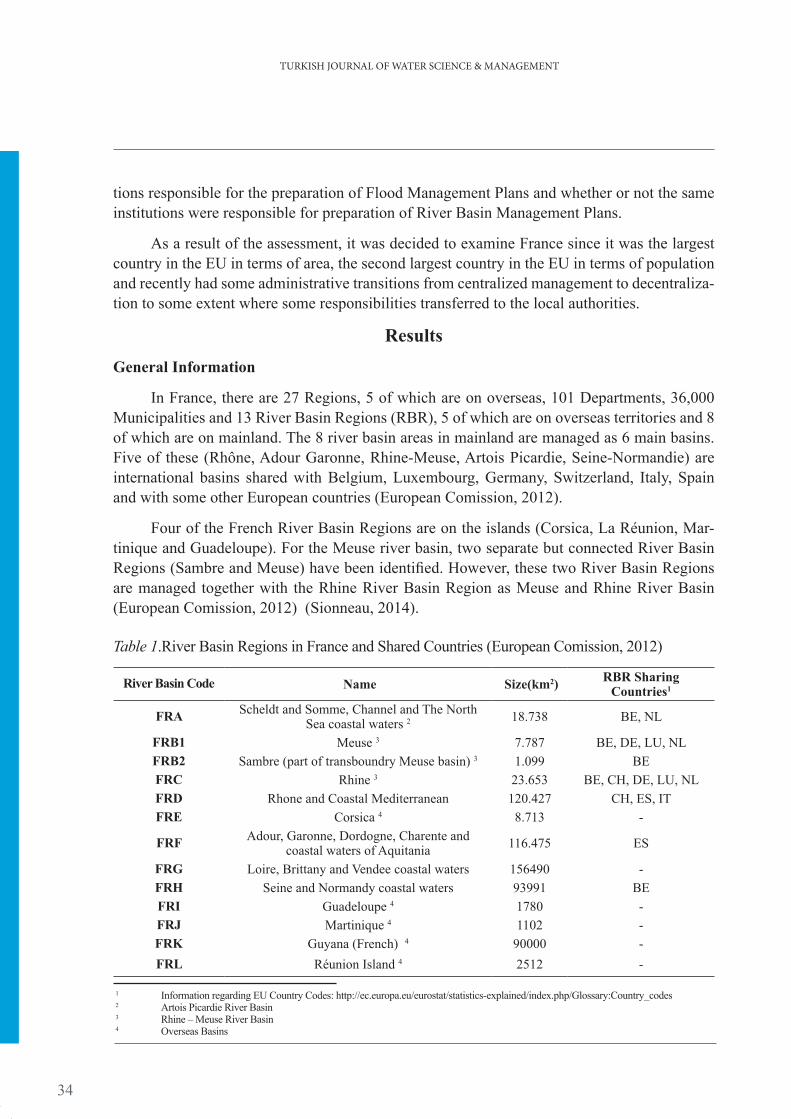
TURKISH JOURNAL OF WATER SCIENCE & MANAGEMENT
34
tions responsible for the preparation of Flood Management Plans and whether or not the same institutions were responsible for preparation of River Basin Management Plans.
As a result of the assessment, it was decided to examine France since it was the largest country in the EU in terms of area, the second largest country in the EU in terms of population and recently had some administrative transitions from centralized management to decentraliza-tion to some extent where some responsibilities transferred to the local authorities.
ResultsGeneral Information
In France, there are 27 Regions, 5 of which are on overseas, 101 Departments, 36,000 Municipalities and 13 River Basin Regions (RBR), 5 of which are on overseas territories and 8 of which are on mainland. The 8 river basin areas in mainland are managed as 6 main basins. Five of these (Rhône, Adour Garonne, Rhine-Meuse, Artois Picardie, Seine-Normandie) are international basins shared with Belgium, Luxembourg, Germany, Switzerland, Italy, Spain and with some other European countries (European Comission, 2012).
Four of the French River Basin Regions are on the islands (Corsica, La Réunion, Mar-tinique and Guadeloupe). For the Meuse river basin, two separate but connected River Basin Regions (Sambre and Meuse) have been identified. However, these two River Basin Regions are managed together with the Rhine River Basin Region as Meuse and Rhine River Basin (European Comission, 2012) (Sionneau, 2014).
Table 1.River Basin Regions in France and Shared Countries (European Comission, 2012)
River Basin Code Name Size(km2) RBR Sharing Countries1
FRA Scheldt and Somme, Channel and The North Sea coastal waters 2 18.738 BE, NL
FRB1 Meuse 3 7.787 BE, DE, LU, NL
FRB2 Sambre (part of transboundry Meuse basin) 3 1.099 BE
FRC Rhine 3 23.653 BE, CH, DE, LU, NL
FRD Rhone and Coastal Mediterranean 120.427 CH, ES, IT
FRE Corsica 4 8.713 -
FRF Adour, Garonne, Dordogne, Charente and coastal waters of Aquitania
116.475 ES
FRG Loire, Brittany and Vendee coastal waters 156490 -
FRH Seine and Normandy coastal waters 93991 BE
FRI Guadeloupe 4 1780 -
FRJ Martinique 4 1102 -
FRK Guyana (French) 4 90000 -
FRL Réunion Island 4 2512 -
1 Information regarding EU Country Codes: http://ec.europa.eu/eurostat/statistics-explained/index.php/Glossary:Country_codes 2 Artois Picardie River Basin 3 Rhine – Meuse River Basin 4 Overseas Basins

July - August - September - October - November - December / Volume: 1 Issue: 2 Year: 2017
35
France has a pyramidal structure due to the centralization of power for a long time. However, since the beginning of the 1980s, the process of “transition to decentralization” has resulted hand-ing the authority to the three levels of local authorities (Region, Department and Local Authority) and the central government has retained the authority regarding some fields such as the risk man-agement, Health Care, Justice or National Security. The transitional movement has assigned many responsibilities, such as economic development, environmental policies and city planning to around 36,000 local governments. These separations of responsibilities have led to considerable difficulties and contradictions for local authorities, and the lack of a concrete co-operation between the govern-ment and local authorities have led to disorders (Larrure, Gralepois, & Trémorin, n.d).
The flood policy was renewed in 1995 with a new legal document called Flood Risk Pre-vention Plan (Plan de Prévention des Risques d'Inondations - PPRI). Following some dramatic events in the south of France, the central administration intended to reduce urbanization in flood plains including possible flood risk areas, local authorities responsible for planning were restricted for this reason, and PPRI was interpreted as a way to establish control over local author-ities and the decision making process for spatial planning (Larrure, Gralepois, & Trémorin, n.d).
In 2002, an integrated approach at basin scale was promoted by providing public finan-cial support to are provided to the programs called "Flood Prevention Action Programs (PAPI), which allows, in order to promote an integrated approach at basin scale . The purpose of these programs is to support an integrated approach to the protection and hazard reduction activities by focusing simultaneously on regulating the flow of the rivers in the upstream, protecting residential areas and reducing the vulnerability (OECD Publications, 2006). The basis of PAPI programmes is to finance the investments to redesign, re-locate or build new flood protection infrastructures that transmit flood runoffs from the areas with high vulnerability (mostly urban areas) to the areas with low vulnerability (such as natural land and agricultural land) in order to reduce total risks at the river basin scale (Enjolras, Erdlenbruch, Grelot, Kast, & Thoyer).
On August 1s t1st 2003, the Advisory Board for the Prevention of Large Scale Natural Risks (Conseil d’orientation pour la prevention des risques naturels majeurs -COPRNM) was founded and commissioned under the supervision of the Ministry responsible for ecology and sustainable development to "provide ideas and proposals in the field of prevention of natural risks" (Decree No: 2003-728). Members are composed of all relevant ministries, insurance companies, local authorities, the National Assembly and the Senate (OECD Publications, 2006)
Together with the EU Floods Directive, a new national policy for flood risk management has been developed in France and incorporated into French legislation under the environmental law of 12 July 2010 (Sionneau, 2013)
The Mixed Flood Commission (CMI), which consists of representatives of the state, local authorities and civil society, was established in 2011 to monitor the implementation of the flood risk management policy (MEDDE, n.d)5 The basin mentioned here is not the large basins specified within the scope of the Water Framework Directive and the Floods Directive, it is rather the catchment areas that can be defined as the sub-basins of these large basins6 The strategy of National Flood Risk Management was determined by the Ministry of Environment Energy and Sea (Risk Prevention Department) with the contribution of the Mixed Flood Commission.
TURKISH JOURNAL OF WATER SCIENCE & MANAGEMENT
36
Under the Law on the national commitment to the environment (LENE) of 12 July 2010, the Commission is responsible for the transposition of the national policy on flood risk man-agement and the EU Floods Directive into the French Law. In its formation, representation of all of the national partners involved in flood risk management (state, politics, authorities, basin public institutions, insurance and non-governmental organizations) is aimed.
CMI has the task of reviewing proposed projects to be defined as "PAPI" or "PSR" (Sud-den Flood Plans) and participating in the development of the National Flood Management Strategy (SNGRI) (AFPCN, 2014)
Formulation of the national policy on flood risk management in France has been initiated as a part of the implementation of the European Union Directive on the assessment and man-agement of flood risks. For this reason, France has adopted the national strategy for flood risk management (SNGRI) for the first time, which covers short, medium and long terms.
The National Strategy states that everyone has a role related to flood risk and it is neces-sary for them to harmonize their behaviour with the risk of flooding, involvement of all stake-holders and to have a better understanding of the risks they are exposed to (MEDDE, n.d)
The flood management strategy at the basin level is determined by the Basin Flood Com-mittee according to the basin characteristics, within the framework of the aforementioned na-tional strategy.
In France, legislation including the flood-related articles consists of the following laws:
• Environment Law (Code de l’environnement )
• Strengthening Environmental Protection (renforcement de la protection de l'environnement)
• Urbanism Law (Code de l'urbanisme)
• Regional Units Act (Code General Des Collectivites Territoriales)
• National Environmental Commitment Act (Portant Engagement National Pour l’envi-ronnement )
Liability Distribution
In France, the flood policy is implemented at four levels; national, basin, department and municipal levels , (MoFWA, 2012) (Sionneau, 2014)
Main actors in flood management are; The Ministry, regional organization (field services) of the Ministry, basin organizations and local decision makers. In addition, both national and basin level consultation and decision-making bodies have been developed to ensure that the uttermost coordination at national, local and union level is achieved. Their purposes are the de-velopment of a common strategy for risk management at the national and river basin level and the implementation of action plans at the basin level.

July - August - September - October - November - December / Volume: 1 Issue: 2 Year: 2017
37
National Level
In France, "Risk Prevention Department" of the Ministry of Environment Energy and Sea is responsible for the Flood Risk Management at national level together with transposing and imple-menting the Floods Directive. Risk Prevention Department determines policies, strategies and stan-dards for the studies undertaken at the regional and local level with the contributions of the Mixed Flood Commission. Regional and local administrations are obliged to organize their work within the framework of these strategies and to act in accordance with the relevant format. The Ministry is also responsible for reporting to the European Union under the Floods Directive (MoFWA, 2012).
At the national level consultation and decision-making bodies have been developed to ensure coor-dination in the best possible way. These are Large Scale Natural Risks Prevention Advisory Commission and the Mixed Flood Commission. The Mixed Flood Commission is consisted of the members of the Large Scale Natural Risk Mitigation Commission and the National Water Committee.
Institutional structure of flood preparedness and forecasting system is also carried out under the General Directorate of Risk Prevention under the Ministry of Environment Energy and Sea. In this context, there is a network of hydrometry and flood forecasting which are among the respon-sibilities of The Central Hydrometeorology and Flood Forecasting Support Service (SCHAPI) at national level. Data obtained from regional flood forecasting units are evaluated at this center and the necessary warnings are made. SCHAPI is also responsible for the management of the national database and the development of new methods and tools.
METEO FRANCE's National Forecasting Center, which is responsible for the meteorological activities, carries out the operation of the numerical weather prediction model and coordinates the output of flood preparedness and forecasting systems. METEO FRANCE is responsible for predic-tions at synoptic and larger scales and works in coordination with SCHAPI.
Another important element in flood prevention is insurance. The insurance agreements cover not only floods, but also other disasters. Compensation for those who have suffered damage is made by their own insurance companies (MoFWA, 2012)
However, when there is a huge disaster, national solidarity comes into play. The size of the catastrophe is determined by the Mixed Commission. The process starts with the relevant municipal-ity's application to the governor. Subsequently, the governor applies to the Natural Disaster Commit-tee, the Committee transmits its decision to the Government, and the national disaster is declared by the state. When it is declared by the state, the damage from which the citizens are suffered by citizens is covered by their insurance company but it is reimbursed from the Government by the insurance companies (MoFWA, 2012)
The fund used for reimbursement purpose consists of the national pool of funds collected un-der the CATNAT system (National solidarity system to compensate the victims of natural disasters). While this system covers all disasters, currently 80% of this insurance is used for floods. This fund is also used for the studies aiming to reduce flood risk and recovery (MoFWA, 2012)

TURKISH JOURNAL OF WATER SCIENCE & MANAGEMENT
38
Tasks related to post-disaster works belong to the Ministry of Interior and the Civil Protection Departments and, where necessary, the Army is involved in these activities.
Basin Level
At the river basin level, there are the River Basin Committees established by the Water Law, which was enacted in 1964. These Committees, also called the water parliament, are responsible for directing the water policy at the basin level. These bodies discuss water management issues and ana-lyze the Water Agency's planning documents. The Committee is also responsible for the preparation of the Basin Management Plans under the Water Framework Directive.
While studies on floods were conducted by government agencies at the level of municipali-ties before PAPI, after PAPI this approach was shifted to the basin level management, which takes hydrographic borders into consideration, not administrative ones. However, the management at the basin level has not been applied at the same level which is currently applied under the Floods Direc-tive as 6 main basins. It was applied at the level of catchment, which can be considered as sub-basins of those main basins.
The current governance on floods in the basin is based on the Basin Committee, Committee, which is defined by the governor of the each basin and includes actors from local public authorities and local authorities responsible for spatial planning and urban planning in the basin,, in accordance with the instructions issued by the Ministry. The Basin Flood Committee is a committee headed by the Basin Governor, and it includes other actors in flood management field in addition to the Basin Committee and contributes to the implementation of the various components of the Floods Directive (Sionneau, 2013) (Sionneau, 2014).
The extent of the Basin Flood Committee is similar to that of the national level. It is a general forum where local actors come together to discuss the basin scale flood risk management policy, the Flash Flood Plans and the Flood Prevention Action Programs. The Basin Flood Committee and other actors in tüe flood area, including actors involved related to coastal zones and transboundary waters, contribute to the implementation of various components of the Floods Directive (Sionneau, 2013).
The Basin Governor is responsible for the implementation of the Floods Directive at the basin level. Studies at basin scale flood management are carried out by the regional organization of the Ministry of Environment Energy and Sea - DREAL (Regional Directorate of Environment, Planning and Housing), under the Basin Governor. Even though the structuring of DREAL is at the level of the regions, with transition to the basin scale management after the Floods Directive, Coordinator DREAL regional directorates, who will be responsible for the entire basin, have been appointed for each basin (MoFWA, 2012) (Sionneau, 2013) (Sionneau, 2014).
The Regional Director of the Coordinator DREAL fulfils its mission as a basin representative under the control of the Coordinator Governor of the basin, assists the Basin Governor, carries out the secretariat of the Basin Administrative Commission, coordinates the activities of the state units in the water field, advises to the basin organizations and provides technical support (Sionneau, 2013).
July - August - September - October - November - December / Volume: 1 Issue: 2 Year: 2017
39
DREAL is responsible for all Flood Risk Management Plans and conducts the implemen-tation of Flood Risk Management Plans within the scope of the Directive (MoFWA, 2012). Risk prevention plans prepared within the scope of the Law issued in 1995 are evaluated at the basin level and used in preparation of flood risk management plans within the scope of the Directive.
The hydrometry network is under the responsibility of six coordinator DREALs at the local level. These units are responsible for the design of measurement networks, strategy development and arrangement of distribution of tools / resources. Flood forecasting services under DREAL deter-mine also the normal level, warning level and crisis level for water levels in rivers.
At the basin level there are also Water Agencies which aim to promote balanced and efficient use of water resources and aquatic environments, water supply, flood control and sustainable devel-opment. Water agencies collect and manage data, prepare and submit draft policies, and work on fi-nancial requirements. The role of water agencies in flood management is to provide the coordination of different plans and the connection between WFD and FD. It can also provide financing support for flood-related works in some exceptional cases (in the case that the concerning work also have environmental benefits (MoFWA, 2012) (Sionneau, 2014).
Regional Level
Region; is one of the oldest local governments in France. Legal arrangements in 1982 led to an autonomous structure. The local administrator "Council" is elected once in every 6 years and they elect their own chairman with consensus.
The flood management studies at the regional level are coordinated by DREAL (Regional Directorate of Environment, Planning and Housing) and the regional organization of the Ministry of Environment Energy and Sea (MoFWA, 2012) (Sionneau, 2014).
The Flood Risk Prevention Plans (PPRI), prepared in accordance with the law in 1995, are still in force and are being used in national, regional and local arrangements. However, the plans were revised within the scope of the Floods Directive issued in 2007 and necessary changes were made in line with the requirements of the Floods Directive (MoFWA, 2012) (Sionneau, 2014).
There are regional flood forecasting centers in nineteen out of twenty seven provinces in France. These flood forecasting centers, under DREAL, carry out duties such as hydrometeorological forecasting and monitoring in more than one sub basin, and thus develop knowledge and expertise on floods.
Department and Municipal Level
Departments; are managed by department councils. The councils are elected for 6 years. De-partment councils elect their own chairman, and chairman have broad responsibilities. They have activities on such as social responsibilities and infrastructure studies. The Department Chairman represents the Government at the Department level. Since the recognition of water as a part of the national heritage, its preservation has gained importance in line with common interests and led to the legal increase of the power and influence of the Department Presidents. Each Department has "Crisis
TURKISH JOURNAL OF WATER SCIENCE & MANAGEMENT
40
forces" that are engaged when necessary for situations e.g. drought and flood. The Department is the main management level in the Government's water resources management and policy. The units of Ministries in Departments are affiliated to the President of the Department.
The municipalities are the smallest local governments in France. City councils are determined by general elections once in every 6 years. In the communes, the administration is composed of a council and a mayor. The City Council and the Mayor are obliged to perform all the necessary investments for the water supply and sewerage services and to collect taxes for the financing thereof (MoFWA, 2012).
Within the framework of the National Flood Management Strategy, Risk Prevention Plans and Action Plans for Flood Protection, Departments and Municipalities, are responsible for;
• Land planning by taking flood risks into consideration,
• Informing citizens about flood risks in the area (e.g. with signs indicating past floods), and
• Crisis Management, mainly under the responsibility of the Mayor, but can also be supported by state powers.
Carrying out flood protection activities is the responsibility of municipalities or municipal associations (unions) (AIDA, 2000).
The evacuation plans are prepared by the Municipalities and the Governor of the Department. When the river exceeds the determined crisis level, evacuation efforts are carried out by the relevant units determined on the plan, under the direction of the municipal police and with the help of the firefighter department (MoFWA, 2012) (Sionneau, Flood Risk Management in France, 2014). Mu-nicipalities and/or Departments may come together to form basin-scale authorities, although it is not an obligation.
Department Regional Offices (DDT) of the Ministry of Environment Energy and Sea, per-form duties such as contributing to the sustainable development of regions in the planning process, supporting communities in the planning phase of the legislative processes of the land planningplan-ning, establishing housing and sheltering policy, urban transformation and sustainable development policy, prevention of national and technological hazards and the management of waterways in public access, under the direction of the Department's Governor (MoFWA, 2012).
Flood Risk Prevention Plans (PPRI) was prepared by Department Regional Directorate (DDT - Direction Départementale des Territoires) in accordance with the Law in 1995. Information about past floods, possible future floods, future measures and maps are covered by those plans (MoFWA, 2012) (Sionneau, 2014).
The main objective of Flood Risk Prevention Plans (PPRI) is to ensure that construction is not allowed in the areas with the highest risk, and the floodplain areas are preserved. These plans set out the boundaries of the areas that construction cannot be done and the areas where construction can be done under certain conditions, includes urbanization, construction and management rules, and brings specific urban planning arrangements such as construction permit requests (MoFWA, 2012).

July - August - September - October - November - December / Volume: 1 Issue: 2 Year: 2017
41
PPRI is approved by the governor. As soon as those plans are approved, it becomes compul-sory for the Municipalities to comply with. The units in the region are included in the process of preparing the document.
Discussion and ConclusionDiscussion
In France, different activities are carried out at the regional, departmental and municipal level as a result of transition from its centralized management in the past to current decentralized management.
Strategies, policies and legislation related to flood management are established at the national level by the Ministry of Environment Energy and Sea (Risk Prevention Department). In addition, different commissions have been formed at the national level to ensure coordination of relevant stakeholders. The decisions of these committees have the characteristic of recommendation for the Ministry. At the basin level, there are structures such as Basin Management Committees, Basin Flood Management Committees and Water Agencies together with DREAL, which is the regional organization of the Ministry, and the activities related to flood risk management are mainly carried out by the Coordinator DREAL determined for each Basin. The aforementioned Basin Flood Com-mittees are the Committees where the active participation of relevant stakeholders is provided and water related issues are discussed at the basin scale. However, except some particular plans, the decisions of the Basin Flood Committees are advisory for the Ministry, which is responsible for approving the plans.
The Flood Prevention Action Plans, called PAPI, were prepared at the level of the hydrographic basins, which can be described as the sub-basins, by the Department Unit of Ministry (DDT). These plans have also formed a basis for the work carried out within the framework of the Floods Directive.
Hereby, it is observed that the planning of the flood management in France is carried out by the organization of the central institution at different levels by ensuring effective participation of all stakeholders at the national, local and basin level, since the main role of the flood risk management is undertaken by the Ministry's organizations at different levels.
Nevertheless, at the point of the implementation of the measures, France does not apply this state-led implementation approach and leaving the implementation of the measures to the depart-ments and municipalities. However, this approach makes it difficult to ensure the standards for struc-tural measures –-such as the construction of dikes-,-, maintenance to maintain of these measures and being sure about their protection level, even though the standards are set by the government.
In France, the studies carried out by various institutes/agencies also have an important place in managing flood risks. The studies such as preparation of maps and inventories, production, storage and distribution of data, development of methodologies and software to be used in the studies such as Flood Risk Assessment, preparation of Flood Hazard and Flood Risk Maps, flood forecasting and early warning system, are being carried out.
TURKISH JOURNAL OF WATER SCIENCE & MANAGEMENT
42
In comparison with the implementations in Turkey, the differences are as follows;
• Flood Management Plans are prepared at the basin level in France by the Ministry's basin/regional level organizations and in Turkey at the headquarters of the Ministry for each basin.
• In both countries, there are different plans regarding floods that were prepared in the past, except Flood Risk Management Plans. These plans were prepared at the regional / local level in both the France and Turkey, by field services of Ministry in France and by subsidiary institution in Turkey.
• In France, coordination is provided by commissions at the national level and by the Basin Governor at the basin level. In Turkey, the Ministry and commissions provide coordination at the central level and the Basin Management Committees at the Basin level.
• Flood Control Measures are taken by the municipalities in France. In Turkey, they are taken by the field services of the Ministry's subsidiary institution (DSİ) and also the by the municipalities in Metro-politan Cities. The same institutions are responsible for maintenance of these structures in both.
• Land use planning and planning activities are carried out both at central and local level in Turkey and directly at Regional/local level in France.
• In France, while studies on hydrological monitoring and flood forecasting are carried out at the regional level, evaluation and dissemination are carried out at the central level. The necessary meteorological data are obtained from the central Meteorological Administration. Similarly; hydro-meteorological monitoring is being carried out by the regional services of two General Directorates of the Ministry in Turkey (DG Meteorology for Meteorological observation and State Hydraulic Works for hydrological monitoring). Evaluation and dissemination are carried out at the central level.
• Flood insurance in France is within the scope of national “natural disaster insurance system – CATNAT –”. In Turkey there is no specific insurance for flood disaster hovewer it is covered under different insurance clauses of some insurances such as agricultural insurance, household insurance, etc.
• Training and awareness-raising activities are carried out in France at the regional / local level.
• Ensuring active participation is carried out at basin level in France
July - August - September - October - November - December / Volume: 1 Issue: 2 Year: 2017
43
Conclusion
The approach being implemented in France; flood management planning carried out by the Ministry and the Field Services of Ministry by ensuring the active participation of all stakeholders at the national, basin and local levels; is a very effective system in terms of ensuring that both partici-pation of relevant institutions at all levels and providing the management of flood risks conducted in line with the strategy of central level. From the point of view of Turkey, it is considered that it may be beneficial to support the related unit, which is currently conducting studies from the central level, with a regional organization.
In France, different commissions consisted from relevant stakeholders have been constituted at the national level in order to ensure coordination. As there are similar commissions in Turkey, in, intensification of their activities would support benefiting from them more effectively.
The experience of France on the implementation of the structural measures, transferring re-sponsibility to local stakeholders instead of implementation by the state should be taken into ac-count. It is very important to make sure the level of protection of these structures are ensured, so that it is important to ensure the standards of construction and maintenance of those. In this regard, it would be very beneficial to continue the current approach in Turkey, which is the implementation, operation and maintenance activities for those measures being performed by state institutions which are highly experienced in their field.
In France, flood risk prevention plans determine the boundaries of the areas construction pro-hibited and the areas that construction is permitted under certain conditions. City planning, construc-tion and management rules for these areas are included in flood risk prevention plans and they bring together special urban planning regulations like construction permission requests. In Turkey, studies for establishing the necessary background for the implementation of such practices -e.g. determina-tion of different building standards according to flood risk level, regulation of legislation related to this issue,-- will provide great benefits in the medium and the long term.
TURKISH JOURNAL OF WATER SCIENCE & MANAGEMENT
44
ReferencesAFPCN. (2014). Association Française pour la prévention des Catastrophes Naturelles. Commission mixte inondation et SNGRI: retrieved from http://afpcn.org/animation-et-reseau-dacteurs/participation- aux-commissions/commission-mixte-inondation-et-sngri/
AIDA. (2000, 09 21). Livre II : Milieux physiques (Partie législative) - AIDA. Accueil - AIDA: retrieved from http://www.ineris.fr/aida/consultation_document/1761
Enjolras, G., Erdlenbruch, K., Grelot, F., Kast, R., & Thoyer, S. (n.d). Flood management at the basin level in France: Sustainability of local risk–sharing policies. retrieved from http:// www.iwra.org/congress/2008/resource/ authors/abs612_article.pdf
European Comission. (2012, 11 14). Commission Staff Working Document. European Comission - Environment: retrieved from http://ec.europa.eu/environment/water/water-framework/pdf/CWD-2012-379_ EN-Vol3_FR.pdf
European Comission. Glossary: Country Codes, retrieved from http://ec.europa.eu/eurostat/statistics-explained/index. php/Glossary:Country_codes
Larrure, C., Gralepois, M., & Trémorin, J.-B. (n.d). Flood Risk Management Strategies In France’s Recent Past: A Story Of Scale And Powers.- STAR FLOOD. STAR FLOOD - Towards More Resilient Flood Risk Governance: retrieved from http://www.starflood.eu/column/flood-risk-management-strategies-in-frances-recent-past-a- story-of-scale-and-powers/
MEDDE. (n.d). Quelle politique française pour la gestion des inondations? retrieved from http://www. developpement-durable.gouv.fr/Quelle-politique-francaise-de.html
MoFWA. (2012). EU Twinning project on “Capacity Building to Implement Floods Directive” Study Visit Report (17-21.12.2012). TR Ministry of Forestry and Water Affairs, Ankara.
OECD Publications. (2006). OECD Studies in Risk Management – France: Policies for Preventing and Compensation Flood-Related Damage, OECD 2006. retrieved from http://www.oecd.org/france/37397241.pdf
Sionneau, P. (2013). Implementation of Flood Policies in France. retrieved from EU Twinning project on Capacity Building to Implement Floods Directive.
Sionneau, P. (2014). Flood Risk Management in France. (I. SAKIN, Interviewer)

July - August - September - October - November - December / Volume: 1 Issue: 2 Year: 2017
45
Extended Turkish Abstract(Genişletilmiş Uzun Türkçe Özet)
Fransa’da Taşkın Riski YönetimindeKurumsal Çerçeve ve Türkiye için Öneriler
Bu çalışmanın maksadı, Türkiye’de taşkın yönetim planlarının tüm paydaşların aktif katılımıyla havza ölçeğinde hazırlanması ve taşkın yönetimi ile ilgili gerekli koordinasyonun her ölçekte sağlanabilmesi için; bir AB ülkesinin örnek olarak incelenmesi ve Türkiye’deki mevcut uygulamalarla karşılaştırılması yoluyla taşkın riski yönetiminde yetki, görev ve sorumluluk dağılımı konusunda öneriler sunulmasıdır.
Bu kapsamda hem havza düzeyinde yönetime hem de Taşkın Direktifi uygulamalarına örnek oluşturacak bir Avrupa Birliği üyesi ülkesi seçimi için hızlı tarama yapılmış, AB üye ülkeleri arasında yüzölçümü bakımından en büyük, nüfus bakımından ise ikinci büyük ülke olması ve yakın geçmişte merkezi yönetimin bazı sorumluluk-larını yerel yönetimlere devrederek yürütülmesine geçiş yapmış olması sebebiyle Fransa’nın incelenmesine karar verilmiştir.
Fransa’da 5’i denizaşırı olmak üzere 27 bölge, 101 departman, 36000 belediye ve 5’i denizaşırı topraklar-da 8’i anakarada olmak üzere 13 nehir havzası bölgesi (nhb) bulunmaktadır. Anakarada bulunan 8 nehir havzası bölgesi 6 ana havza olarak yönetilmektedir. Bunlardan 5 tanesi (Rhône, Adour Garonne, Rhin-Meuse, Artois Picardie, Seine-Normandie) Belçika, Lüksemburg, Almanya, İsviçre, İtalya, İspanya ve diğer Avrupa ülkeleriyle paylaşılan havzalardır.
Fransa’da taşkın politikaları dört seviyede ulusal, havza, departman ve belediye düzeylerinde uygulan-maktadır. Taşkın yönetiminde temel aktörler: bakanlık, bakanlığın bölge teşkilatı, havza organizasyonları ve yerel karar vericilerdir. Bunun dışında ayrıca, ulusal, yerel ve birlik düzeyinde koordinasyonun en iyi şekilde sağlan-ması için hem ulusal hem de havza bazında danışma ve karar alma organları geliştirilmiştir. Bunların maksadı; ulu-sal ve nehir havzası düzeylerinde taşkın riski yönetimi için ortak bir stratejinin geliştirilmesi ve havza düzeyinde eylem planlarının uygulanmasıdır.
Fransa’da taşkın yönetimi ile ilgili strateji, politika ve mevzuat ulusal düzeyde Çevre, Enerji ve Deniz Bakanlığı (Risk Önleme Birimi) tarafından oluşturulmaktadır. Bakanlık ayrıca Taşkın Direktifi kapsamında Avru-pa Birliğine raporlama görevini de yürütmektedir. Ulusal düzeyde koordinasyonun sağlanabilmesi için ayrıca, ilgili paydaşlardan oluşan farklı komisyonlar mevcuttur. Bu komisyonların kararları Bakanlık için tavsiye niteliği taşımaktadır.
Havza düzeyinde ise havza yönetim heyetleri, havza taşkın yönetim heyetleri ve su ajansları gibi yapılan-malarla beraber Bakanlığın bölge teşkilatı olan DREAL bulunmaktadır. Taşkın riski yönetimi ile ilgili faaliyetler esas olarak her bir havza için belirlenmiş olan koordinatör DREAL tarafından gerçekleştirilmektedir. Söz konusu Havza (Taşkın) Heyetleri, havza ölçeğinde ilgili paydaşların aktif katılımının sağlandığı ve su ile ilgili konu-ların görüşüldüğü heyetlerdir. Bununla birlikte havza taşkın heyetlerinin kararları, bazı istisnai planlar haricinde, Bakanlık için tavsiye niteliği taşımakta olup planlar Bakanlık tarafından onaylanmaktadır.
Departman düzeyinde ise, daha ziyade alt havza olarak da nitelendirilebilecek hidrografik havzalar düzeyinde PAPI olarak adlandırılan Taşkın Önleme Eylem Planları Bakanlığın Departman teşkilatı DDT tarafın-dan hazırlanmıştır. Hazırlanmış olan bu planlar, taşkın direktifi çerçevesinde yapılan çalışmalara da altlık oluştur-muştur.

TURKISH JOURNAL OF WATER SCIENCE & MANAGEMENT
46
Taşkına hazırlıklı olma ve tahmin sistemi Çevre, Enerji ve Deniz Bakanlığına bağlı Risk Önleme Genel Müdürlüğü altında yapılanmıştır. Bu kapsamda oluşturulan hidrometri ve taşkın tahmini ağı ise ulu-sal düzeyde Merkezi Hidrometeoroloji ve Taşkın Tahmin Destek Servisi SCHAPI’nin sorumluluğundadır. Bölgesel taşkın tahmin birimlerinden gelen veriler bu merkezde değerlendirilmekte ve gerekli uyarılar yapıl-maktadır. SCHAPI ayrıca ulusal veri tabanının yönetiminden ve yeni metotlar ile araçların geliştirilmesin-den sorumludur. Meteorolojik faaliyetlerden sorumlu METEO FRANCE’ın Ulusal Tahmin Merkezi sayısal hava tahmin modelinin işletilmesinden sorumlu olup taşkına hazırlıklı olma ve tahmin sisteminin çıktılarının koordinasyonunu sağlamaktadır. METEO FRANCE Sinoptik ölçek ve üzerindeki tahminlerden sorumlu olup SCHAPI ile koordinasyon içerisinde çalışmaktadır.
Bu şekliyle bakıldığında, her düzeyde taşkın riski yönetimi ile ilgili esas rolün Bakanlığın teşkilatı tarafından üstlenilmesi sebebiyle, Fransa’da taşkın yönetiminin planlanmasının ulusal, yerel ve havza düzeyinde tüm paydaşların etkin katımı sağlanarak merkezi kurumun farklı düzeylerdeki teşkilatı eliyle yürütüldüğü görülmektedir.
Bununla beraber, tedbirlerin uygulanması noktasında Fransa bu devlet eliyle yürütme yaklaşımını uygulamamakta, tedbirlerin uygulanmasını departman ve belediyelere bırakmaktadır. Ancak her ne kadar devlet tarafından standartları belirlense de, bu yaklaşımın sedde yapımı gibi yapısal tedbirler ve bunların bakımı ilgili olarak bir standardın yakalanmasını ve bu yapıların koruma seviyesinden emin olunmasını zor-laştırdığı ifade edilmektedir.
Taşkın hususunda diğer bir önemli unsur ise sigortadır. Zarara uğrayanların tazminatını kendi sigorta şirketleri karşılamaktadır. Bununla birlikte çok büyük bir afet olduğunda Ulusal Dayanışma devreye girmek-tedir. Bu şekilde milli afet ilan edildiği durumlarda vatandaşın zararı yine sigorta şirketlerince karşılanmakta ancak, sigorta şirketleri ödemelerini devletten geri almaktadır.
Afet sonrası çalışmalar ise İçişleri Bakanlığı ve sivil savunma birimlerince yürütülmekte, gerekli du-rumlarda ordu da bu çalışmalara katılmaktadır.
Fransa’da çeşitli enstitüler/ajanslar tarafından taşkın riski ön değerlendirmesi, taşkın tehlike ve taşkın risk haritalarının oluşturulması, taşkın tahmin ve erken uyarı sistemi gibi çalışmalarda kullanılacak met-odolojilerin ve yazılımların geliştirilmesi, haritaların ve envanterlerin oluşturulması ve verilerin üretimi, saklanması, dağıtılması gibi çalışmalar yapılmaktadır Bu çalışmalar taşkın riski yönetiminde önemli bir yere sahiptir.
Türkiye’deki uygulamalar ile karşılaştırıldığında;
• Fransa’da uygulanmakta olan; taşkın yönetimi planlanmasının ulusal, yerel ve havza düzeyinde tüm paydaşların etkin katımı sağlanarak Bakanlık ve Bakanlığın bölge teşkilatı tarafından yürütülmesi yaklaşımı hem tüm düzeylerde ilgili kurumların katılımını hem de taşkın riski yönetiminin merkezi stratejiye uygun yönetilmesini sağlamak açısından oldukça etkin bir sistemdir. Türkiye’de halihazırda bu alandaki çalışmaları merkezi düzeyden yürüten ilgili birimin bölge teşkilatı ile desteklenmesinin faydalı olabileceği değerlendir-ilmektedir.
• Fransa’da koordinasyonun sağlanabilmesi için ulusal düzeyde ilgili paydaşlardan oluşan farklı komisyonlar oluşturulmuştur. Türkiye’de de benzer komisyonlar olmakla birlikte, bu komisyonların faali-yetlerinin yoğunlaştırılması ile komisyonlardan daha etkin şekilde fayda sağlanabilecektir.
• Fransa’nın özellikle sedde vb. yapısal tedbirler ile ilgili uygulamanın devlet eliyle yapılması yerine sorumluluğun yerel paydaşlara devredilmesi konusundaki tecrübeleri dikkate alınmalıdır. Bu yapıların ko-ruma seviyesinden emin olunması, dolayısıyla yapımı ve bakımı ile ilgili olarak bir standardın yakalanması

July - August - September - October - November - December / Volume: 1 Issue: 2 Year: 2017
47
oldukça önemlidir. Konusunda oldukça tecrübeli devlet kurumları tarafından bu tedbirlere yönelik uygula-ma, işletme ve bakım faaliyetlerinin yürütülmesi şeklindeki Türkiye’deki mevcut yaklaşımın devam ettir-ilmesinin faydalı olacağı değerlendirilmektedir.
• Fransa’da taşkın risk önleme planları ile inşaat yapılamayacak olan bölgelerin ve belli koşullar altın-da inşaat yapılabilecek olan bölgelerin sınırları belirlenmekte, bu alanlara yönelik şehircilik, inşaat ve yöne-tim kurallarına yer verilmekte ve bu planlar inşaat izni talebi gibi özel şehircilik düzenlemelerini beraberinde getirmektedir. Türkiye’de de bu tarz uygulamaların yapılabilmesi için gerekli teknik ve yasal altyapının oluşturulmasına yönelik çalışmalar yapılması (taşkın riskinin düzeyine göre farklı yapı standartlarının belir-lenmesi, bu konuya yönelik mevzuat düzenlenmesi vb.) orta ve uzun dönemde büyük faydalar sağlayacaktır.
• Fransa’da ayrıca, çeşitli enstitüler ve ajanslar tarafından taşkın yönetiminin farklı aşamalarında ge-rekli altlıkların oluşturulması, metodolojilerin ve yazılımların geliştirilmesi gibi oldukça önemli çalışmalar yapılmaktadır. Bu tarz çalışmaların çeşitli enstitülerce Türkiye’de gerçekleştirilmesi, kısa vadede sonuçları çok belirgin olmasa da, orta ve uzun vadede ciddi faydalar sağlayacaktır
TURKISH JOURNAL OF WATER SCIENCE & MANAGEMENT
48
Planning of Sectoral Water Allocation:A Case Study of Seyhan River Basin
Abstract
In this study optimum water allocation among sectors has determined for Seyhan Basin that is the second largest after the Nile basin located in the eastern Mediterranean. Sectoral water demands in terms of irrigation, production and domestic use by considering environmental and socio-economic conditions as well as water potential were analyzed in the basin. Scenarios were created to represent optimal water use under different conditions. The major finding is that in the near future probably there will be competition for inter-sectoral water demands depending on the reduction of water potential due to the impacts of climate change. Consequently, all sectors' water demands were met and optimum water allocation were provided. Agricultural needs are met in the range of 90% level (the year 2037) to 94% level (2017), and environmental flow needs are met in C level of environmental management class in the context of the applied method.
Keywords: water resources management, water potential, sectoral water demands, sectoral subbasin, wa-ter allocation.
Öz
Bu çalışma ile Doğu Akdeniz’de yer alan ve Nil Havza'sından sonra ikinci en büyük havza olan Seyhan Havzası için sektörler arası optimum su tahsisi belirlenmiştir. Çalışmada su potansiyeli yanı sıra çevresel ve sosyo-ekonomik koşullar göz önünde bulundurularak sulama, üretim, evsel kullanım gibi amaçlar için sektörel su talepleri analiz edilmiştir. Farklı koşullar altında optimal su kullanımını gösteren senaryolar geliştirilmiştir. En önemli bulgu, yakın gelecekte, iklim değişikliğinin etkilerinden dolayı su potansiyelinin azalmasına bağlı olarak sektörler arası rekabetin yaşanabileceğidir. Yapılan değerlendirmeler neticesinde, mevcut şartlarda ve gelecek dönemler için sektörel ihtiyaçların muhtelif oranlarda karşılandığı görülmektedir. Tarımsal su ihtiyacı 2017 yılında %94 seviyesinde, 2037’de ise %90 seviyesinde temin edil-irken, çevresel akış ihtiyacı, uygulanan metoda göre, C seviyesi çevresel yönetim sınıfı olarak karşılanmaktadır.
Anahtar sözcükler: su kaynakları yönetimi, su potansiyeli, sektörel su talepleri, sektörel althavza, su tahsisi.
IntroductionThe problems of water need and management in the different regions of the world are parallel:
Agricultural irrigation has the largest share of water consumption in the world scale as it is in our country. Domestic use and industrial water use follow this. But the practices differ in terms of water management. In areas where water resources and precipitation are abundant, water management is shaped to combat flood. On the other hand, it is seen that drought is being struggled in areas rainfall is insufficient. However, the intensity of socio-economic activities has brought the philosophy of planned use of water resources around the world, even if there is no water shortage. In this context, it is seen that the evaluation of the management of water resources at the watershed scale and the analysis of the water usage of the sectors and the meeting of the demands are on the agenda.
As a result of growing demand for water, efficient use of resources is becoming vital. The main objective of water management is to protect and enhance the water in terms of quality and quantity for the benefit of society and ecosystem. Similarly, water allocation among sectors
Nuray AYTEN1, Saliha DEĞIRMENCIOĞLU1, Taner KIMENÇE1
1Ministry of Forestry and Water Affairs, Directorate General for Water Management 06510, [email protected], [email protected], [email protected]
Received date: 23.03.2017, Revised date: 22.05.2017, Accepted date: 17.07.2017
Case Study

July - August - September - October - November - December / Volume: 1 Issue: 2 Year: 2017
49
1Ministry of Forestry and Water Affairs, Directorate General for Water Management 06510, [email protected], [email protected], [email protected]
Received date: 23.03.2017, Revised date: 22.05.2017, Accepted date: 17.07.2017
aims to recognize all the interest of different users, all requirements including cultural, social, and environmental. Water use planning, as an answer to the pressures on the water resources, has been providing the optimization of existing supply and balance between sectors via eco-nomic, social and environmental analysis. Water allocation among sectors is also a significant issue in Turkey depending on the sectoral structure since at river basin the annual available water potential exceeds or the limits available enforce (Alcamo et al. 2000).
The planning of the sectoal water use in the present and long run to ensure the use of water resources and environmental sustainability will provide a solution to the problem of meeting the rising water demand (Tena et. al., 2015) The planning of sectoral water demands is seen as an exit point.Within this approach, it is evaluated together with other dynamics in the present and future potential basin scale of the water resource, and the determined optimum water consumption pattern provides an insight into the development of socio-economic activities.
In this study, water allocation was studied for Seyhan River Basin with an area about 21 000 km2 that are the second largest after the Nile basin located in the eastern Mediterranean covering 2% of the surface area of Turkey. Seyhan River pouring to the Mediterranean Sea has a length of 560 km, the western part of Çukurova. The basin was selected because of preliminary studies that are showed it as the most sensitive and vulnerable region to global warming by Intergovernmental Panel on Climate Change (IPCC) Mediterranean Region. Therefore, in addition to the growing de-mands for water in the Seyhan River Basin, it has been expected to be negatively affected by climate change. The purpose of the project is to the preparation of sectoral water allocation plan in the Sey-han River Basin based on the total water potential and an appropriate supply-demand balance. The basin separated into three subsection to evaluate efficiently sectoral interaction. In the context of the study, these sections were named sectoral subbasin that refers to subbasins or zones that are merged or divided taking into account these sectoral uses of water in a river basin as Zamanti, Göksu and Seyhan sectoral subbasin that are river systems in Seyhan River Basin. Seyhan river is the stream starting at the junction of Zamanti and Göksu rivers.
Figure 1. Seyhan River basin and sectoral subbasins

TURKISH JOURNAL OF WATER SCIENCE & MANAGEMENT
50
The average precipitation is reported 615 mm in the Basin Master Plan completed by DSI. The yearly water potential of Zamanti and Göksu river are 2 049 hm3 and 1 828 hm3, respec-tively. The basin has two big reservoirs: Çatalan and Seyhan Reservoir with 5 145 hm3 and 6 183 hm3 of water potential, respectively. The safe groundwater reserve defined in DSI Basin Master Plan for Seyhan is 1 259 hm3/year (DSI, 2014). Table 1 shows the water potential for the current and future periods of the basin.
Table 1.Water potential of Seyhan River Basin
Water Potantial (hm3) Current (2016) 2017 2022 2027 2037
Surface Water 5 991 5 386 6 063 5 462 5 194
Groundwater 1 145 1 145 1 145 1 145 1 145
TOTAL 7 135 6 530 7 207 6 606 6 338
In the study environmental flow and 4 sectors as agriculture, drinking water, industry and ener-gy were considered. First of all drinking water demand was evaluated and it is calculated depending on the rural and urban population in the basin. Under agriculture sector for existing irrigation area by examining the appropriate crop pattern is determined. The industry as another sector in basin accounts for just a small amount of water consumption with 54.1 hm3 per year composed of 41.2 hm3/year of surface and 12.9 hm3/year of groundwater in 2016. The interbasin transfers have been taking place in the basin, as well. Water transferred in the amount of water to be allocated were also taken into consideration. Hydrometeorological conditions were analyzed as well. Standard Precipitation Index (SPI) approach was used to evaluate drought conditions. The outcomes of the project of Impacts of Climate Change on Water Resources (by the General Directorate of Water Management) was used. In this context, current conditions (the year 2016) was defined as normal state and water resources in the coming years (2017, 2022, 2027 and 2037) were evaluated accordingly. The normal conditions, mild, moderate and severe drought classes were identified by using the outcomes of SPI analyses associat-ed with meteorologic drought (WMO). Then it was determined as normal conditions for 2016, mild drought conditions for 2017, moderate drought conditions 2027, severe drought conditions 2037. The work carried out in the study was addressed in three basic stages: social, environmental and economic analyses. At last stage, all results coming from sectoral analyses were optimized using the water allo-cation model (WEAP) which is an effective tool for planning water treatments (Arranz et al., 2007; Psomas et. al., 2016; Suryawanshi et. al., 2014) In total 16 different scenarios were created to show how the water should be evaluated in the short, medium and long term from 2017 to 2037.
Environmental Analysis
It is stated extensively that environmental flows are the indicator showing level of deteri-oration of ecosystems as a result of heavily use of the resources (Sánchez et. al., 2012; Tennant, 1976) As a key tool to maintain of ecosystem environmental flow analysed. The environment as a sector was evaluated under 4 topics: Environmental flow needs, fishery and aquaculture production, wetlands and water quality.

July - August - September - October - November - December / Volume: 1 Issue: 2 Year: 2017
51
Economic Analysis
In addition to drinking water and environmental flow, three main sectors considered in the context of the project including agriculture, industry, energy for Seyhan River Basin. The currently irrigated area accounts for approximately 208 000 hectares in the basin. This area is expected to increase to 327 000 hectares in the long term according to the other planning ac-tivities in the Seyhan River Basin. In this context, the irrigation needs, production amount, and economic value are defined.
It is seen that industrial water consumption accounts for the just small amount of total budget, 54.1 hm3/year. The industrial water consumption is based on the water allocation re-cords documented by General Directorate of State Hydraulics Works (DSI) for industrial activ-ities including also bottling, mining, thermal power plant.
The annual energy production by the hydroelectric power plants accounts for approxi-mately 6 007 GW-hour. The hydroelectric power plants under construction and planning meet another 1 369 GW-hour which in total represents 7 376 GW-hour production capacity. Water needs for hydropower and income from the sector were calculated. The sectoral water con-sumption for drinking-potable, agriculture and industry sectors is summarized in Figure 2.
Figure 2. Sectoral water use
Social Analysis
In the works, water management was handled from a social point of view as well. The people's attitude towards the protection of water resources was investigated by a survey. For this purpose, a survey was conducted by a method known as the willingness to pay frequently used in natural resource valuation. As a social dimension, the need for domestic water for the current situation and future in the basin was determined by considering regional and urban development plans. The terrestrial and temporal trends of the population in the basin were analyzed. It was
TURKISH JOURNAL OF WATER SCIENCE & MANAGEMENT
52
revealed via the survey that the people in rural area are willing to pay to 111.8 TL per year per capita while the people in the urban area are willing to pay 226.1 TL per year per capita. When the survey is taken into consideration it is estimated that the people in Seyhan River Basin are willing to pay a total of 431.1 million TL annually for the protection of the environment.
MethodThe methodology used during the study is based on environmental, social and economic
analyses. Various modeling tools and analysis methods have been used for evaluations such as Water Evaluation and Planning System (WEAP), Global Environmental Flow Calculation Model (GEFC), Population Statistical Package for the Social Sciences (SPSS), Penman-Mon-teith Method, IRSIS Computer Software and the Rainbow programme. Population projected for 1-5-10-20 years (for years 2017-2022-2027-2037) via population calculations and predic-tions on domestic water use by using SPSS. Minimum and maximum population predictions are made with linear and S-Curve method supplied by the software SPSS. The Linear method gives negative population values in the rural area, in that case, S-curve method is used for cal-culating minimum population. Current and future conditions for the water potential has been determined by the information below in Seyhan Basin and Sectoral subbasins:
• The period of 1970–2008 was used as a reference to determine flow-rainfall coefficiency.
• In order to determine reference period rainfall (1970 – 2008) data from gauging stations were used. Accordingly, average rainfall in each sectoral subbasin is calculated. For the refer-ence flow (1970 – 2008) natural flow conditions defined in DSI Master Plan were used.
• Rainfall changes in future were determined by using results from SYGM Project of Climate Model for Seyhan Basin. In the project had been used Regional Climate Model (Reg-CM4.3) and HadGEM2-ES, MPI-ESM-MR, and CNRM-CM5.1 which were produced for RCP4.5 and RCP8.5 scenarios (Representative Concentration Pathways). To define 2015 – 2100 period, data set of 30 years (1971 – 2000) has been used.
The Standard Precipitation Index (SPI) method was used for the assessment of drought conditions. As known, drought index values at 3-month, 6-month, 9-month, 12-month and 24-month intervals can be calculated in SPI analyzes. Using the results of the SPI analysis in the context of meteorological drought, normal conditions, mild drought, moderate drought and severe drought classes were identified.
The environmental flow was calculated by GEFC which is one of the hydrologic environ-mental flow calculation methods. It aims to sustain or improve the ecosystem in flow analysis at different levels under ecological management category or environmental management class. In GEFC for each environmental management class could be an environmental flow scenar-io in terms of the water allocated for the sustainability of the ecosystem. Therefore, monthly environmental flow quantities are calculated for 6 classes such as A,B,C,D, E, and F which are ranging from unmodified to critically modified conditions. C class in moderately changed category as optimal is selected in environmental flow calculations.
July - August - September - October - November - December / Volume: 1 Issue: 2 Year: 2017
53
The evaluation was performed by using 8 cross-sections located in gauging stations on the river system. In all cross-sections, the flow needs for fishery were met, as well. Akyatan and Tuzla Wetlands protected as Wildlife Development Field, as the most important wetland in the study area, were identified in the allocation model by reflecting the outcomes of a project final-ized by the General Directorate of Nature Conservation and National Parks of Turkey in 2010. Spatial and temporal changes in water quality also is another issue considered in works. The data sets recorded during the period of 1981-2014 by DSI from 37 gauging stations in Seyhan Basin was used. These data sets were used to identify surface water and groundwater quality through the use of relevant environmental quality standards. Water quality was evaluated ac-cording to the 3 different regulations in force.
Water quality was evaluated using 3 different regulations, by laws on The Quality of Sur-face Waters for Drinking Water Source, Surface Water Quality Management and Concerning Water Intended for Human Consumption, controlling the use of water resources. In accordance with regulations and usage purposes the quality is taken into consideration. Quality classes according to the purposes of water use are classified as Class I-high quality water, Class II-less contaminated water, Class III-contaminated water, Class IV-highly contaminated water. Hence, surface water quality in Seyhan Basin was identified. It is assessed that Zamantı Sectoral sub-basin is Class III and the result for Göksu Sectoral subbasin is Class II. The value in the lower part of Seyhan is defined as Class IV.
In the works, irrigation areas which are operated by several institutions are listed with their properties. The total estimated size of 517 irrigation areas is 327 000 hectare. Most of the area are located in Seyhan sectoral subbasin in the downstream. Data obtained from 11 meteo-rological stations were used in order to calculate water consumption of crops and timing plan of irrigation. Net income values for each crop were obtained from Ministry of Food, Agriculture, and Livestock. Irrigation areas in the basin were grouped according to cities, stations, and wa-ter usage operators. Optimum crop pattern and water -income relation is determined for each group. After this stage, the amount of water need for the agriculture sector and corresponding income value are determined for the current situation. Calculations also are made for short, medium and long terms. The Penman-Monteith method and the Rainbow program were used to determine irrigation water needs. Optimum water demand is taken into account in the agri-cultural sector, taking into account irrigation efficiency. By starting from the Plant Water Con-sumption, the irrigation water was determined and accordingly the irrigation time was planned. Optimum crop pattern was obtained (FAO).
Sectoral water allocation strategy and plan were prepared to take sectoral water usage, climate change, and drought conditions into consideration according to sectoral development, change and distribution in 2017, 2022, 2027 and 2037 years. At the final stage of the study, all results are incorporated by using Water Evaluation and Planning model (WEAP) to simulate optimum water use pattern in the basin for four different time horizon. WEAP model simulates demand points (irrigation area, hydropower plant, settlement area) changes conditions and de-mands as sectors as well as reservoirs in the basin.

TURKISH JOURNAL OF WATER SCIENCE & MANAGEMENT
54
ResultsIn the study allocation scenarios reflecting sectoral, environmental and economic condi-
tions are explained.
Sectoral Water Allocation
Sectoral water allocation scenarios were developed by using associated spatial and tem-poral data. Existing conditions (2016) and future conditions for scenarios from 2017 to 2037. The main characteristics of conditions for different years are summarized Table 2.
Table 2. The main characteristics of different years
Scenario(reference: 2016) Year
Total Water Potential
(hm3)
Population(million)
Irrigation area(million da) GEFC Class
1 year 2017 6.5 1.9 2.1 C
5 year 2022 7.2 2.1 3.1 C
10 year 2027 6.6 2.2 3.2 C
20 year 2037 6.3 2.4 3.3 C
In the study water allocation among sectors, expected economic values associated with sectoral water use, a vulnerability in the quantity of water allocation were evaluated. The exist-ing total water resources potential in the basin is determined approximately as 7.2 billion m3. Surface water accounts 6 billion m3 and the rest is groundwater (1.2 billion m3). It is estimated that the current potential will drop to 6.6 billion m3 in moderate drought conditions. The value will be 6.5 billion m3 in severe drought conditions due to the impacts of climate change. Water allocation in terms of demands was identified by considering total water resources potential and consumption of water resources in Seyhan basin. Considering sectoral demands basic condi-tions are shaped:
• Drinking-potable water and industrial water needs are met in all sectoral subbasins for all scenarios.
• Agriculture sector water needs are met in the range of 90% level in 2037 to 94% level in 2017.
• Environmental flow needs class C as environmental management class is met in all sectoral subbasins for all scenarios.
• Energy sectors hydroelectric power production was controlled through the operation model in which results represent a good level of accuracy at 94%. Energy sector water needs are met in the range of 85% (2022) to 94% level (2017).
• Total existing and future transfer was considered to be 229 million m3 per year from Zamanti sectoral subbasin. Interbasin transfer of water to İmamoglu Irrigation field from

July - August - September - October - November - December / Volume: 1 Issue: 2 Year: 2017
55
Yedigöze reservoir was assumed to be 543 million m3 yearly in the lower part of Seyhan. Fig-ure 3 shows changing of water allocation for three sectors from 2017 to 2037.
Economic Value of Sectoral Water Allocation
It is important to identify the economic value of the water resources allocated as part of the plan developed for Seyhan basin. In this context, the economic value of respective sectors are sum-marized: Seyhan sectoral subbasin leads high economic value in all sectors (agriculture, drinking- potable water, industry, and energy). The main reason is the fact that the sectoral production in using of water resources is the highest there. In Zamanti subbasin there are no industrial activities and agriculture sector shapes economic activities. The existing economic value was calculated of approximately 643 million TL. It is expected to reach approximately 2 billion TL by 2037. In Göksu subbasin economic value of energy sector from hydroelectric power plants follows industrial sector. The existing economic value in the energy sector of approximately 478 million TL is expected to reach approximately 1.5 billion TL by 2037. In Seyhan sectoral basin, industrial activities following agricultural activities generate the highest economic value.
Figure 3. Sectoral Water Allocation
The existing economic value in industry sector of approximately 12 billion TL is expected to reach approximately 31 billion TL by 2037. In Seyhan basin total existing economic value of all sectors of approximately 20 billion TL is expected to reach approximately 44 billion TL by 2037. Drinking-potable water sector, the city center of Adana located in Seyhan sectoral subbasin is the main driver of water consumption and associated economic value. The agriculture sector, the largest irrigated areas located in the Seyhan sectoral subbasin is the main driver of water consumption and associated economic value, but yet is below the economic value generated by the industry sector. The economic value generated in agriculture sector is lower than the economic value of industry sector. This highlights the importance of crop patterns in the agriculture sector to generate a higher

TURKISH JOURNAL OF WATER SCIENCE & MANAGEMENT
56
level of economic value. This structure needs to support through the use of strategic product policies and associated subsidies. The economic value generated by the industry sector is higher than the economic value of all other sectors in total. Principally the water needs of drinking-potable wa-ter and environmental flow are met without giving consideration to the economic value generated due to the use of water resources in these sectors. The economic value generated in each sector is summarized below (Table 3). The economic value of sectoral water allocation for all 16 scenarios is summarized in Figure 4. The irrigation needs, production amount and economic value in Seyhan basin are defined in Figure 5.
Figure 4. Economic value of sectoral water allocation for all 16 scenarios
Figure 5. Agriculture Sector Characteristics

July - August - September - October - November - December / Volume: 1 Issue: 2 Year: 2017
57
Table 3. Consumption, allocation and ratio in water use for agriculture and energy
TERMS SECTORS
Normal Mild Drought Moderate Drought Severe Drought
Con. All. Ratio Con. All. Ratio Con. All. Ratio Con. All. Ratio
2017
Agriculture (hm3/year)
1 345 1 269 94.4% 1 345 1 268 94.2% 1 345 1 267 94.2% 1 345 1 259 94%
Energy (GW-hour)
6 007 5 651 94.1% 6 007 5 552 92.4% 6 007 5 440 90.6% 6 007 4 590 76 %
2022
Agriculture hm3/year
2 195 2 018 91.9% 2 195 2 136 97.3% 2 195 2 117 96.5% 2 195 2 057 93.7%
Energy (GW-hour)
7 376 6 321 85.7% 7 376 5 959 80.8% 7 376 5 678 77.0% 7 376 4 721 64 %
2027
Agriculture (hm3/year)
2 239 2 070 92.5% 2 239 2 042 91.2% 2 239 2 048 91,4% 2 239 1 994 89%
Energy (GW-hour)
7 376 6 480 87.9% 7 376 6 177 83.7% 7 376 5 976 81.0% 7 376 4 905 67%
2037
Agriculture (hm3/year)
2 055 1 892 92.1% 2 055 1 864 90.7% 2 055 1 868 90.9% 2 055 1 840 90%
Energy (GW-hour)
7 376 6 892 93.4% 7 376 5 981 81.1% 7 376 5 753 78% 7 376 4 733 64%
Discussion and Conclusion
Sectoral Water Allocation Plan
The purpose of this study is to determine the sectoral water allocation which includes hydrological, environmental, economical, social analysis and optimal demand management for water potential in Seyhan Basin. This study is an example for our country in order to ensure sharing of water resources in the basin scale, planning for the future and fairly meeting the water needs of each sector. The studies were carried out in three stages, namely the current situation analysis, sectoral analysis and the Sectoral water allocation plan, in consideration of the environmental flow need, social objectives and socio-economic benefit analysis. The spatial distribution of surface and groundwater resources and sectoral use in the basin has been deter-mined in the current conditions (2016). Population, environmental flow, sectoral development, sector demand projection and economic analysis have been done. Following, the temporal and spatial distribution of both water resources and sectoral use are determined in future conditions from 2017, to 2037. Lastly, evaluations were made on the most appropriate water allocation taking into account socio-economic benefit optimization.
In the study drinking-potable water consumption was evaluated as first priority. It is fol-lowed by environment, agriculture, energy, and industry. The ecosystem water needs also are identified and guaranteed. The environmental flow has been evaluated at the basin scale by
TURKISH JOURNAL OF WATER SCIENCE & MANAGEMENT
58
using a modeling approach. The quantity and quality of water resources have been evaluated in sectoral allocation of water resources. The spatial and temporal relations are identified for availability and demand of water resources in the context of both quantity and quality. Water consumption, demand and allocation for all sectors were calculated using numerical models. Environment sector needs were met by considering an integrated approach and integrating wa-ter quality, environmental flow, fishery products and wetlands. Crop water requirements are calculated and optimum crop pattern is based. Trend analysis of precipitation was considered for long periods (30 and 50 years). It was considered that year 2017 represents mild drought conditions and 2037 represent severe drought conditions. In the basin scale the economic valu-es of agriculture, industry, the energy associated with the consumption of water resources are determined.
Benefits from water resources were identified by using optimization approach and economic analysis. The sustainable use of water resources is considered for economic development. Optimi-zation of benefits and economic analyses were undertaken in each sector. A comparative analysis of sectoral water consumption, demand, and economic return was implemented by WEAP. Sectoral development projections were identified for each sector and 16 scenarios were improved.
Acknowledgements
This study was supported by General Directorate of Water Management, the Ministry of Forestry and Water Affairs. We would like to thank the executives and the staff of Alfar Project Const. Ind. and Trade. Co. Ltd. who had executed the project.

July - August - September - October - November - December / Volume: 1 Issue: 2 Year: 2017
59
References
Alcamo, J., Henrich, T. & Rosch, T., (2000). Global modelling and scenario analysis for the World Commission on Water for the 21st Century. (Report A0002). Centre for Environmental System Research, University of Kassel, Germany.)
Arranz, R. & McCartney, M. (2007). Application of the Water Evaluation And Planning (WEAP) model to assess future water demands and resources in the Olifants catchment, South Africa. Colombo, Sri Lanka: International Water Management Institute. (IWMI Working Paper 116).
General Directorate for Nature Protection & National Parks (2010). Akyatan and Tuzla Lagoon Wetland Management Plan. The Ministry of Forestry & Water Affairs, Ankara, Turkey.
General Directorate of State Hydroulic Works (2014). Master Plan Report for Seyhan River Basin. The Ministry of Forestry & Water Affairs, Ankara, Turkey.
Allen, R.G., Pereira L. S., Raes D. & Smith M. (1998). Crop evapotranspiration Guidelines for computing crop water requirements. FAO Irrigation and Drainage Paper 56.
Huber-Lee, A., Yates, D., Purkey, D. Yu, W. & Runkle, B. (2003). Water, climate, food, and environment in the Sacramento Basin. Stockholm Environment Institute, Boston, MA, USA.
Authors (2013).Climate Change 2013 The Physical Science Basis. Contribution of Working Group I to the Fifth Assessment Report of the Intergovernmental Panel on Climate Change. Cambridge University Press, Cambridge, United Kingdom and New York, NY, USA..
Psomas, A., Panagopoulos, Y., Konsta, D. & Mimikou, M. (2016). Designing water efficiency measures in a catchment in Greece using WEAP and SWAT models. (2nd EWAS International Conference).Retrieved from http://www.sciencedirect.com
Raes, D., Mallants, D. & Song, Z. (1996). Rainbow: A software package for analyzing hydrologic data. Hydraulic engineering software VI. Southampton, Boston, Mass., Computational Mechanics publications
Suryawanshi, R. A. & Shirke,A. J. (2014). Watershed Management of Subernarekha River Basin using WEAP (International Journal of Recent Trends in Science and Technology, Vol. 12, No. 1, pp. 156-163.)
General Directorate of Water Management (2016). Sectorale Water Allocation Plan for Seyhan River Basin. The Ministry of Forestry & Water Affairs, Ankara, Turkey.
General Directorate of Water Management (2016). The Project of Impacts of Climate Change on Water Resources. The Ministry of Forestry & Water Affairs, Ankara, Turkey.
SPSS Statistics Base 17.0 User’s Guide. (2007).https://www.hks.harvard.edu/fs/pnorris/Classes/A%20SPSS%20 Manuals/SPSS%20Statistcs%20Base%20User's%20Guide%2017.0.pdf
Tena, B. A., Srinivasa, Rao G. V. R. & Abbulu, Y. (2016). WEAP Modeling of Surface Water ResourcesAllocation in Didessa Subbasin, West Ethiopia (Vol.2: pp.55–70 Sustainable Water Resources Management). Springer Customer Service Center GmbH,Heidelberg, Germany.
Tennant, D.L. (1976). Instream flow regimens for flush, wildlife, recreation and related environment resources (Fisheries, Volume 1, 1976 - Issue 4).
World Meteorological Organization (2012). Standardized Precipitation Index, User Guide.

TURKISH JOURNAL OF WATER SCIENCE & MANAGEMENT
60
Extended Turkish Abstract(Genişletilmiş Uzun Türkçe Özet)
Sektörel Su Tahsisi Planlaması:Seyhan Havzası Örneği
Bu çalışmanın amacı, Seyhan Havzası yeraltı ve yerüstü su kaynakları için hidrolojik, çevresel, ekonomik ve sosyal analizler yapılarak toplam su potansiyeline uygun talep yönetimini içeren sektörel su tahsis sonuçlarının değerlendirilmesidir. Su kaynaklarının havza ölçeğinde paylaşımının sağlanması, geleceğe yönelik planlanması ve her sektörün ihtiyacı olan suyun adil bir şekilde karşılanması için bu çalışma Türkiye açısından örnek teşkil etmektedir. Bilindiği gibi beşeri faaliyetlere bağlı olarak su kaynakları üzerinde kalite ve miktar açısından sistemli ve devamlı artan bir baskı söz konusudur. 2030 yılı itibariyle gıda ve enerji ihtiyaçlarının yaklaşık %50 oranında artacağı, su ihtiyacının ise %40 oranında artacağı öngörülmektedir. Bununla birlikte, iklim değişikliği tahminleri-ne göre yağışlı bölgelerin daha yağışlı ve kurak bölgelerin daha da kurak olacağı öngörülmektedir. Buna ilaveten, hem atmosferik hem de hidrolojik süreçlerde yaşanan değişimlerinden dolayı havzaların su potansiyeli olumsuz yönde etkilenmekte, bu sebeple havzalar arası su transferleri de gündeme gelmektedir. Tüm bu gelişmeler, su kaynakları yönetimini daha da meşakkatli hale getirmektedir. Başarılı bir su yönetimi, arz ve talep değişimlerinin öngörülmesini ve sosyo-ekonomik koşullar dikkate alınarak suyun verimli ve etkin kullanımını gerektirmekte-dir. Sektörel Su Tahsis Planlaması, su kaynaklarının adil ve dengeli paylaşımını sağlayan bütünleşik bir yönetim sistemidir. Bu kapsamda, su tahsisinin havza bazında ve sektörel ölçekte planlaması, Türkiye’de ilk defa Seyhan Havzası’nda gerçekleştirilmiştir. Seyhan Havzası Sektörel Su Tahsis Planında, içme-kullanma, çevresel akış, zirai sulama, sanayi ve enerji sektörlerinin ihtiyaçları dikkate alınmış ve bunlar arasındaki sosyo-ekonomik ilişkiler analiz edilmiştir. Planda, içmesuyu, tarım ve sanayi sektörleri suyu kullanan, enerji sektörü ve çevreselakış ise suyu tüketmeyen ancak suya ihtiyaç alanı olarak ele alınmıştır. Seyhan Havzası, Türkiye ve Avrupa’nın tarımsal açıdan en verimli bölgelerinden biridir. Biyolojik çeşitlilik bakımından da dünyanın en zengin bölgelerinden biri olan havza; tarım, sanayi, enerji, kentleşme, turizm alanında pek çok faaliyeti barındırmaktadır. Çalışmalar, hem havza bütünü hem de 3 sektörel alt havza ölçeğinde ilgili sektörler dikkate alınarak gerçekleştirilmiştir. Bu sektörel alt havzalar sırasıyla,
• Tarım sektörü faaliyetlerinin yoğun olduğu, su transferinin gerçekleştirildiği Zamantı Sektörel Alt Havzası
• Enerji sektörü faaliyetlerinin yoğun bir şekilde yapıldığı Göksu Sektörel Alt Havzası
• Tarım, sanayi ve enerji sektörü faaliyetlerinin yoğun olduğu, havza içi ve dışına su transferinin gerçekleş-tirildiği Seyhan Sektörel Alt Havzasıdır.
Çalışmalar, çevresel akış ihtiyacı, sosyal amaçlar ve sosyo-ekonomik fayda analizleri dikkate alınarak, mevcut durum analizi,sektörel analizler ve sektörel su tahsis planı hazırlama aşaması olmak üzere 3 aşamada gerçekleştirilmiştir: Mevcut yerüstü ve yeraltı su kaynakları ile sektörel su kullanımlarının havza içerisindeki me-kansal dağılımı belirlenmiştir. Mevcut durum analizinde ele alınan konuların birbirleriyle ilişkileri kurulmuştur. Bu kapsamda; nüfus, çevresel akış, sektörel gelişim, sektörlerin su talep projeksiyonu ile tüm bulguların ekonomik analizleri yapılmıştır. Bunu takiben hem su kaynaklarının hem de sektörel su kullanımlarının gelecek koşullarda zamansal ve mekânsal dağılımı belirlenmiştir. Gelecek koşulların tanımlanmasında; mevcut durum (2016 yılı) ile 2017, 2022, 2027 ve 2037 yıllarındaki koşullar esas alınmıştır. Son aşamada ekonomik ve sosyal açıdan en uygun düzey gözetilerek havzanın sektörel su tahsis planına yönelik sentezler ve buna bağlı değerlendirmeler yapılmıştır. Bu kapsamda; sektörel su tahsis kararlarının açıklandığı, genel ve özel hükümlerin yer aldığı sektörel su tahsis planı hazırlanmıştır. Çevresel, ekonomik, sosyal hedefler ve bu hedeflerin gerçekleştirilmesine esas teşkil eden stratejiler planlama yaklaşımı esasları dikkate alınarak açıklanmıştır. Su kaynakları potansiyeli, değişimi ve sektörel gelişmeler tespit edilerek en faydalı sektörel su kullanım koşulları belirlenmiştir. Proje sürecinde, tahsis
July - August - September - October - November - December / Volume: 1 Issue: 2 Year: 2017
61
planına altlık teşkil eden çevresel, sosyal ve ekonomik değerlendirmeler yapılmıştır. Sözkonusu değerlendirme-lerin yapılabilmesi için çeşitli modelleme araçları kullanılmıştır. Bu kapsamda: Su tahsis modeli çalışmaları için Su Kaynakları Değerlendirme ve Planlama Modeli, WEAP (Water Evaluation and Planning System) (Huber-Lee ve ark., 2003); Çevresel akış ihtiyacının hesaplanmasında Küresel Çevresel Akış Hesaplama Modeli (GEFC); Nüfus analizlerinin değerlendirilmesi kapsamında Sosyal Bilimler için İstatistiksel Paket Programı (Statistical Package for the Social Sciences) (SPSS, 2007); Sulama suyu ihtiyaçlarının belirlenmesinde Penman-Monteith yöntemi (FAO), IRSIS yazılımı ve Rainbow programı (Raes ve ark., 1996); ve Sosyo-ekonomik değerlendirmeye yönelik olarak da İstatistiksel yaklaşım ve Ödeme İstekliliği (WTP) metodu kullanılmıştır. Havzanın hidrolojik ve sosyo-ekonomik özelliklerine bağlı olarak kaynakları koruma ve geliştirme ilkeleri esas alınarak; 2017, 2022, 2027, ve 2037 yıllarındaki sektörel gelişim, değişim ve dağılıma göre sektörel su kullanımları, iklim değişikliği ve kuraklık koşulları da dikkate alınarak sektörel su tahsis stratejisi ve planı hazırlanmıştır. Seyhan Havzası’ndaki toplam su kaynakları potansiyeli ve su kaynakları kullanımlarına bağlı olarak sektörel su tahsis miktarları belirlen-miştir. Bu kapsamda elde edilen başlıca sonuçlar şunlardır:
• İçme-kullanma ve sanayi sektörlerinin su kaynakları ihtiyaçları tüm sektörel alt havzalarda ve tüm yıl-larda karşılanmaktadır. Tarım sektörünün gelecek yıllardaki su kaynakları ihtiyaçları yıllar içerisinde % 90 (2037 yılı) ile % 94 (2017 yılı) mertebesinde karşılanmaktadır. Çevre sektörünün temel ihtiyacı olan C sınıfı (çevresel yönetim sınıfı) için belirlenen su kaynakları ihtiyaçları tüm sektörel alt havzalarda ve tüm yıllarda karşılanmakta-dır.
• Enerji sektöründe mevcut koşullarda Seyhan Havzası’nın toplam enerji üretimi olan 6 007 GW-saat, işletme modeli kullanılarak 5 650 GW-saat olarak % 94 seviyesinde karşılanmıştır. Enerji sektörünün gelecek yıllardaki su kaynakları ihtiyaçları % 85 (2022 yılı) ile % 94 (2017 yılı) mertebesinde karşılanmaktadır.
• Havza genelinde mevcut durumda tüm sektörlerde üretilen toplam ekonomik gelir yaklaşık 20 milyar TL iken yapılan analizler neticesinde elde edilen optimizasyon sonuçlarına göre 2037 yılında bu değerin yaklaşık 44
milyar TL’ye ulaşacağı tespit edilmektedir..

TURKISH JOURNAL OF WATER SCIENCE & MANAGEMENT
62
Optimization and Modelling of Pressurized Irrigation Networks
Abstract
The agriculture holds the biggest share of the water consumption. Thus, design of irrigation networks which is vital for agriculture becomes very important for water conservation. Among the different types of irrigation net-work systems, the most efficient irrigation method is known as the pressurized irrigation. This study aims to better understand how to design and model a pressurized irrigation network. An Excel VBA (Visual basic for application) program is coded for optimization with the first formula of Clément. “Network Optimization” program which uses the same method but there is limited input section is used to control the output. So, the importance of how the minimal changes in input gives big differences in output is revealed.
Keywords: pressurized irrigation network, optimization, modelling, Clément formula
Öz
Su tüketiminde en büyük pay tarım sektöründedir. Bu sebeple sulama şebekelerinin tasarımı, suyun korunu-mu dikkate alındığında çok önemli olmaktadir. Farklı yöntemlerle tasarlanan sulama sistemleri arasında en verimli yöntem basınçlı sulama olarak bilinmektedir. Bu çalışma basınçlı sulama sistemlerinin tasarım ve modellenmesini in-celemek amacıyla yapılmıştır. Bu araştırmada Excel VBA kodlama dili kullanılarak, 1. Clément yöntemi ile basınçlı sulama sistemlerini optimize eden bir program üretilmiştir. Devlet Su İşleri (DSİ)’ nin kullanmakta olduğu ve aynı metod ile hesaplama yapan, MS-DOS ortamında çalışan, kullanımı zor ve sınırlı veri girişi yapılabilen “Network Optimizasyon” programı ile bu çalışmanın çıktıları karşılaştırılmıştır. Böylece, girdi olarak verilmesi gereken boru iç çapları gibi ufak detayların aslında sonuçlarda büyük farklar oluşturabileceği ortaya konulmuştur.
Anahtar sözcükler:basınçlı sulama şebekesi, optimizasyon, modelleme, Clément formülü
IntroductionIn the graphic of Food and Agriculture Organization of the United Nations (UN FAO), it
is mentioned three major consumer sectors as agriculture, industry and municipal sector. (FAO, 2010; Figure 1). Water resources have been consuming substantially during agricultural oper-ations. In 20th century, up to 1980’s in many countries, particularly in developing countries, irrigation has developed rapidly in order to meet food demand. For this reason, the amount of irrigated land on the world has increased dramatically. Truthfully, it is assumed that agriculture is the largest consumer of water resources and accounts for 80–90% of all freshwater (Shiklo-manov, 1998).
The continuous increase of water consumption in connection with rapid human popula-tion growth leads to reduction of water consumption per capita. Unfortunately, only the 20% of human population has access to the freshwater. According to the World Health Organization (WHO) in 10 years, water supply per capita is going to be 1/3 of today’s supply and 3.5 billion
Keh-Han WANG1, Mustafa DAL2
1University of Houston, Civil and Environmental Engineering, Houston TX, USA [email protected]
2Ministry of Forestry and Water Affairs General Directorate of Water Management, 06510, [email protected]
Received date: 13.03.2017, Revised date:11.07.2017, Accepted date:19.07.2017
Research Article
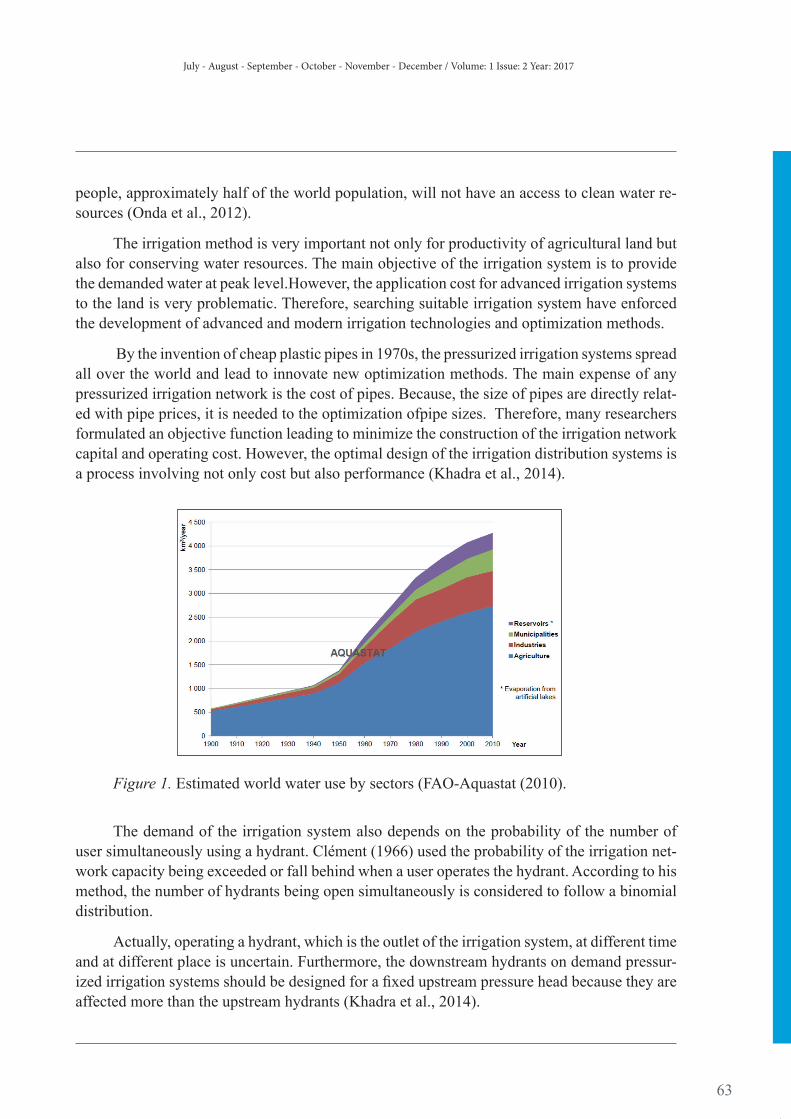
July - August - September - October - November - December / Volume: 1 Issue: 2 Year: 2017
63
people, approximately half of the world population, will not have an access to clean water re-sources (Onda et al., 2012).
The irrigation method is very important not only for productivity of agricultural land but also for conserving water resources. The main objective of the irrigation system is to provide the demanded water at peak level.However, the application cost for advanced irrigation systems to the land is very problematic. Therefore, searching suitable irrigation system have enforced the development of advanced and modern irrigation technologies and optimization methods.
By the invention of cheap plastic pipes in 1970s, the pressurized irrigation systems spread all over the world and lead to innovate new optimization methods. The main expense of any pressurized irrigation network is the cost of pipes. Because, the size of pipes are directly relat-ed with pipe prices, it is needed to the optimization ofpipe sizes. Therefore, many researchers formulated an objective function leading to minimize the construction of the irrigation network capital and operating cost. However, the optimal design of the irrigation distribution systems is a process involving not only cost but also performance (Khadra et al., 2014).
Figure 1. Estimated world water use by sectors (FAO-Aquastat (2010).
The demand of the irrigation system also depends on the probability of the number of user simultaneously using a hydrant. Clément (1966) used the probability of the irrigation net-work capacity being exceeded or fall behind when a user operates the hydrant. According to his method, the number of hydrants being open simultaneously is considered to follow a binomial distribution.
Actually, operating a hydrant, which is the outlet of the irrigation system, at different time and at different place is uncertain. Furthermore, the downstream hydrants on demand pressur-ized irrigation systems should be designed for a fixed upstream pressure head because they are affected more than the upstream hydrants (Khadra et al., 2014).

TURKISH JOURNAL OF WATER SCIENCE & MANAGEMENT
64
The increase of on demand and large scale irrigation systems in the early 1960s in France, leaded the development of statistical models to compute the design flows. The most used models are the first and the second Clément formulas (1966). But only the first formula of Clément has been widely used because of its simplicity and accuracy (Lamaddalena and Sagardoy, 2000).
The main step of designing on-demand irrigation network is the discharge calculation in each section (line) (Labye et al., 1988). In order to obtain the design flow, Clément used the av-erage water demand in the irrigation system. Designing each line and hydrant by their own crop and the water demand could be possible in a small area but generally these network systems are designed for large scale croplands. Moreover, in a district, all the farmers generally grow same or similar type of crop. Thus, instead calculating each line and each parcel by different flow demand, using an average water demand in an irrigation project is logical.
This work purposed to perfectly understand the hydraulics calculations required for pres-surized irrigation network. There are numerous hydraulics formulations necessary for optimi-zation and hydraulic calculations. By realizing there is not a contemporary program for solving the pressurized irrigation network, an Excel VBA program is also coded. This code is named as EPNO (Excel Pressurized Network Optimization) to not repeat the long words in the man-uscript a lot of times. Network Optimization Program, which is an optimization program used in the Mediterranean countries including Turkey, is used to compare the results from EPNO.
Irrigation
The Republic of Turkey the General Directorate of State Hydraulic Works (DSİ) defines the irrigation as supplying the moisture which is necessary for the vegetation growth in the ef-fective root depth without damage to the soil structure efficiency with minimum waste of water and soil and with minimum labor. This definition shows that the irrigation should be planned very well because the water is a need for crop growth although it could also be harmful. In ad-dition to that, the water waste should be minimized and an operational irrigation system should be well planned to deliver the demanded amount of water at the right time.
All farmlands have their own specific characteristics and all the farmers have their own farming traditions. This variety leads to many types of irrigation systems. Understanding the severity of water scarcity leads the researchers to focus on water conserving. There are many studies states that more than demanded amount of water is lost in surface irrigation methods. These researches leaded to invention of new irrigation methods such as sprinkler irrigation and drip irrigation. The sprinkler system is first introduced to the world in the 1930s and the drip irrigation method is invented in the 1960s. Both systems require pressurized irrigation network for their outlets to work accurately. The sprinkler and the drip irrigation are still the most effi-cient irrigation methods (Figure 2).

July - August - September - October - November - December / Volume: 1 Issue: 2 Year: 2017
65
Pressurized Irrigation System
People tried different types of irrigation methods but seeking the most efficient method and the closest to the natural irrigation leaded to invention of the sprinkler system. The sprin-kler system requires the pressurized irrigation network to run the sprinkler heads which is on the top of a sprinkler system and needs water pressure to turn the sprinkler’s nozzle. Thus, the sprinkler’s head makes the irrigation as like as rain. So, the crop gets the water in a natural way.
In an irrigation project, there is no way to shortage the amount of water that is demanded by the crop. So, the water conservation is needed to be involved in: storage, delivery, distribu-tion, operation and application.
Pressurized irrigation system is more efficient than the traditional surface irrigation meth-ods. The main advantages of the pressurized systems are: water consumption, area saving, less labor need, productivity, erosion control and crop protection. Transition to automation i.e. re-mote monitoring and controlling, is applicable to the pressurized system especially in need of metered water distribution.
Figure 2. Sprinkler and drip irrigation (DSI, 2009).
Material and MethodComputation of the Pressurized Irrigation System
The fluid mechanics have three main equations as follows: continuity, momentum and energy equations. For the high pressure irrigation flow is said to be steady, uniform and incom-pressible. Under these estimates continuity (1) and energy (2) equations, which are used mostly in the calculations of pressurized irrigation systems, are as follows:
(1)
(2)
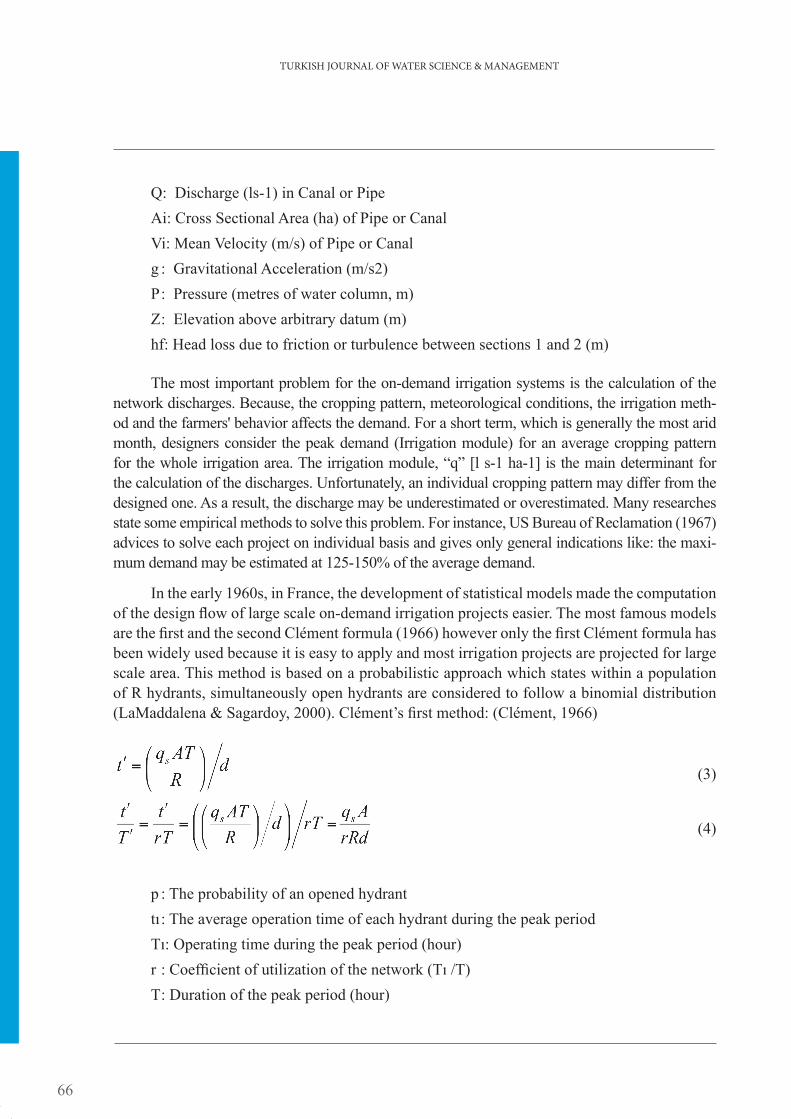
TURKISH JOURNAL OF WATER SCIENCE & MANAGEMENT
66
Q: Discharge (ls-1) in Canal or PipeAi: Cross Sectional Area (ha) of Pipe or CanalVi: Mean Velocity (m/s) of Pipe or Canalg : Gravitational Acceleration (m/s2)P : Pressure (metres of water column, m)Z : Elevation above arbitrary datum (m)hf: Head loss due to friction or turbulence between sections 1 and 2 (m)
The most important problem for the on-demand irrigation systems is the calculation of the network discharges. Because, the cropping pattern, meteorological conditions, the irrigation meth-od and the farmers' behavior affects the demand. For a short term, which is generally the most arid month, designers consider the peak demand (Irrigation module) for an average cropping pattern for the whole irrigation area. The irrigation module, “q” [l s-1 ha-1] is the main determinant for the calculation of the discharges. Unfortunately, an individual cropping pattern may differ from the designed one. As a result, the discharge may be underestimated or overestimated. Many researches state some empirical methods to solve this problem. For instance, US Bureau of Reclamation (1967) advices to solve each project on individual basis and gives only general indications like: the maxi-mum demand may be estimated at 125-150% of the average demand.
In the early 1960s, in France, the development of statistical models made the computation of the design flow of large scale on-demand irrigation projects easier. The most famous models are the first and the second Clément formula (1966) however only the first Clément formula has been widely used because it is easy to apply and most irrigation projects are projected for large scale area. This method is based on a probabilistic approach which states within a population of R hydrants, simultaneously open hydrants are considered to follow a binomial distribution (LaMaddalena & Sagardoy, 2000). Clément’s first method: (Clément, 1966)
(3)
(4)
p : The probability of an opened hydrant tı : The average operation time of each hydrant during the peak periodTı: Operating time during the peak period (hour)r : Coefficient of utilization of the network (Tı /T)T : Duration of the peak period (hour)

July - August - September - October - November - December / Volume: 1 Issue: 2 Year: 2017
67
qs: Irrigation Module, 24 hours per day (l s-1 ha-1)A: Irrigated Area (ha)R: Total number of hydrantsd : Nominal discharge of each hydrant ( l s-1)
The probability of an opened hydrant in a population of “R” homogeneous hydrants is “p” and the probability of a closed hydrant becomes “(1-p)”. The hydrants which are being operated by the farmers are considered to be a random variable with binomial distribution.
So the mean and the variance:
(5) (6)
µ: Mean of opened hydrant in a population of “R”
σ²: Variance of opened hydrant in a population of “R”
The cumulative probability, “Pq”, among the “R” hydrants (Maximum “N” hydrants simultane-ously operating):
(7)
(8)
: Combinations of “R” hydrants taken “K” at a time.
When “R” is large enough (R>10) and p > 0.2, the binomial distribution gets closer to the Laplace-Gauss normal distribution whose cumulative probability, “Pq”, having a maximum of “x” hydrants simultaneously operating (-∞< x < N) is:
(9)
“U(Pq)” is the standard normal variable corresponding to the probability “Pq”, and “u” is the standard normal deviation given by:
(10)
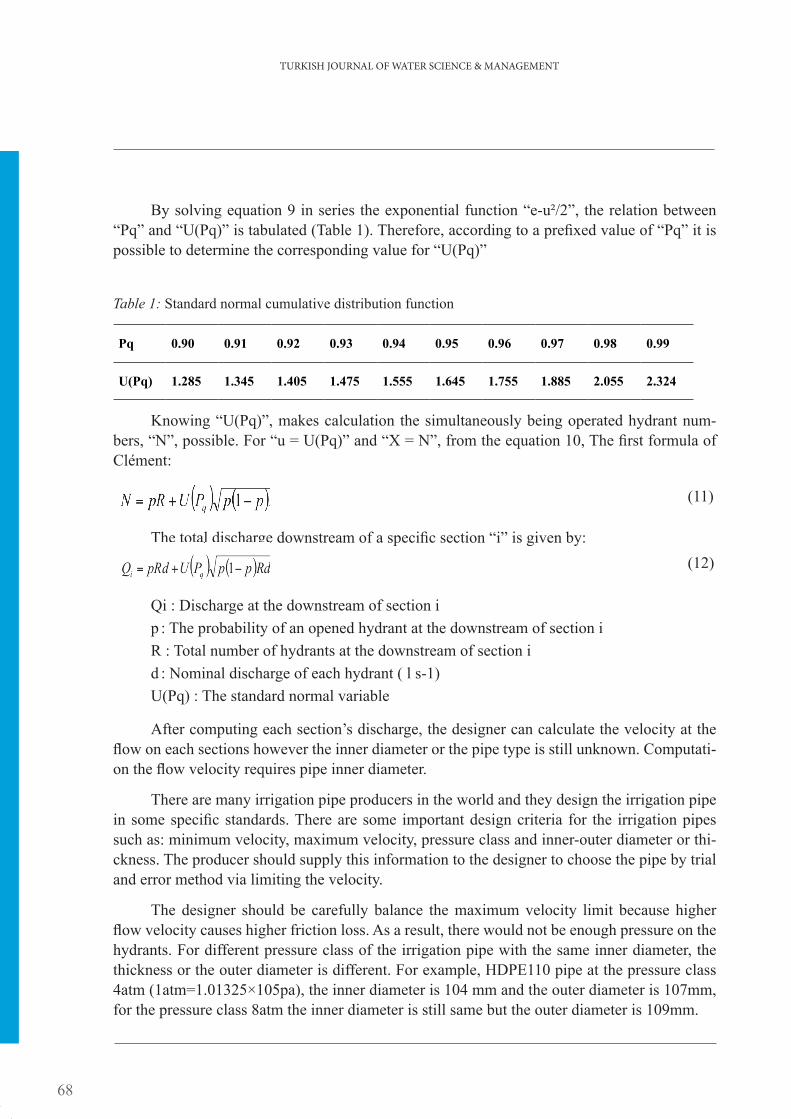
TURKISH JOURNAL OF WATER SCIENCE & MANAGEMENT
68
By solving equation 9 in series the exponential function “e-u²/2”, the relation between “Pq” and “U(Pq)” is tabulated (Table 1). Therefore, according to a prefixed value of “Pq” it is possible to determine the corresponding value for “U(Pq)”
Table 1: Standard normal cumulative distribution function
Pq 0.90 0.91 0.92 0.93 0.94 0.95 0.96 0.97 0.98 0.99
U(Pq) 1.285 1.345 1.405 1.475 1.555 1.645 1.755 1.885 2.055 2.324
Knowing “U(Pq)”, makes calculation the simultaneously being operated hydrant num-bers, “N”, possible. For “u = U(Pq)” and “X = N”, from the equation 10, The first formula of Clément:
(11)
The total discharge downstream of a specific section “i” is given by: (12)
Qi : Discharge at the downstream of section ip : The probability of an opened hydrant at the downstream of section iR : Total number of hydrants at the downstream of section id : Nominal discharge of each hydrant ( l s-1)U(Pq) : The standard normal variable
After computing each section’s discharge, the designer can calculate the velocity at the flow on each sections however the inner diameter or the pipe type is still unknown. Computati-on the flow velocity requires pipe inner diameter.
There are many irrigation pipe producers in the world and they design the irrigation pipe in some specific standards. There are some important design criteria for the irrigation pipes such as: minimum velocity, maximum velocity, pressure class and inner-outer diameter or thi-ckness. The producer should supply this information to the designer to choose the pipe by trial and error method via limiting the velocity.
The designer should be carefully balance the maximum velocity limit because higher flow velocity causes higher friction loss. As a result, there would not be enough pressure on the hydrants. For different pressure class of the irrigation pipe with the same inner diameter, the thickness or the outer diameter is different. For example, HDPE110 pipe at the pressure class 4atm (1atm=1.01325×10⁵pa), the inner diameter is 104 mm and the outer diameter is 107mm, for the pressure class 8atm the inner diameter is still same but the outer diameter is 109mm.
July - August - September - October - November - December / Volume: 1 Issue: 2 Year: 2017
69
After choosing the irrigation pipe size, the technician should calculate the maximum sta-tic pressure. It is a simple but very important calculation. Basically, subtracting the ground elevation at the node, from the head elevation gives out the maximum static pressure. In some cases, it is possible that between two nodes there could be a low elevation that requires more than the maximum static pressure calculated for the section between the nodes.
(13)
: Maximum static pressure at the node i (m)
: Maximum head elevation (m)
: Ground elevation at the node i (m)
The last part of the pressurized irrigation system’s hydraulic computation is maximum dy-namic pressure, which is the pressure at the hydrants while system is operating. The maximum energy loss on the irrigation network occurs due to friction however advanced pipe technology produces pipes with very low friction coefficient.
There are several methods to compute the friction loss such as Colebrook and Manning Equations. Hydraulic slope, which is the friction loss per length, is used to calculate the friction loss. The hydraulic slope needs to be calculated for each section I preferred to use the Man-ning’s equation.
(14)
(15)
Qi : Section’s discharge (ls-1)
Ai : Pipe’s inner area discharge (m2) at section i
Ri : Hydraulic radius (m) at section i (Ri=Di/4 for full flow pipes)
Ji : Hydraulic Slope (m/m) at section i
n : Manning’s friction coefficient (m)
Hydraulic slope, ”J” shows the friction loss per meter so:
TURKISH JOURNAL OF WATER SCIENCE & MANAGEMENT
70
(17)
: Friction Loss (m)
Li : Section i’s length (m)
Ji : Hydraulic Slope (m/m) at section I
There are also minor losses on the pressurized irrigation network. There are energy loss on the branches, hydrants, air intake valves, drain valves, and etc. These losses are very small according to the friction loss so they are negligible. Although they are very small, these minor losses become important for large scale irrigation systems. For each different type of irrigation network component there is a different minor loss coefficient. So, computation of these losses is harder. It is better to estimate an average minor friction loss than neglecting it.
(18)
: Minor loss (m) at node i
KM : Minor loss coefficient (KM=1.5)
V : Mean Velocity (m/s)
g : Gravitational Acceleration (m/s2)
If there is any pressure breaker or pump on the network, the designer should take them in the calculation. The minimum dynamic pressure is the minimum pressure that is necessary for the sprinkler or dripping system to operate. At the hydrants’ inlet there should be 35 m water column pressure for the sprinkler system. The head of the sprinkler requires 25 m water column pressure to work properly and there is an average 10 m local loss in a hydrant. For a large scale network (R>10), one hydrant with entrance pressure less than 30 m is negligible. Minimum dynamic Pressure:
(19)
: Minimum dynamic pressure at the hydrant i (m)
: Minimum head elevation (m)
: Ground elevation at the hydrant i (m)
: Total friction loss from the pipeline start to the hydrant (m)
: Total minor loss from the pipeline start to the hydrant (m)

July - August - September - October - November - December / Volume: 1 Issue: 2 Year: 2017
71
All these equations especially the first formula of Clément requires several parameters. These parameters, which their values are gained from DSİ are as follows:
Irrigation Module (q) [ls-1ha-1]: The amount of water in liter demanded by the crop in the peak term for a second in a hectare.
Irrigation Time [hour]: The average time of operation of the irrigation system for 24 hours (1day). For high Pressure irrigation systems, it is estimated as 20 hours. For pumped irrigation systems it is taken as 18 hours.
Net Area Factor: The total area should be decreased since it is going to be constructed on it and there will be a portion of the land is not going to be used for cropping. The net area factor is “0.873” for the piped irrigation systems.
The Standard Normal Variable U(Pq): It is also known as quality probability of the network. (U(Pq)=1.645)
Theoretical Parcel Area per Hydrant [ha]: The area for one hydrant. It is “8ha” for high pressure irrigation systems.
Hydrant Flow [ls-1]: The Flow that is going to be used in flexibility calculations for one hyd-rant. Depending on the theoretical parcel it is “10ls-1” for the high pressure irrigation systems.
Manning Friction Coefficient (n) [mm]: For HDPE and GRP pipes the manning fric-tion coefficient is “0.009mm” (n=0.009mm).
Number of Hydrants without Flexibility: In an irrigation network, two hydrants with the same properties, one of them is at the upstream and the other is at the downstream, the upstream one has bigger probability of the use of demanded water than the other one. In order to fix this problem at the end of the pipelines for a specific amount of discharge (80 ls-1) or for a number of hydrants (4) the discharge is calculated by linear method (Q=A-net*q). In some situation, it is possible that the discharge calculated from the first formula of Clément’s is bigger than the linear method. In this case, the higher discharge should be assigned for the hydrant.
Excel Pressurized Network Optimization Code
However, there is a big demand for pressurized irrigation network constructions, there is not a very good pressurized irrigation network optimization program in use. DSİ uses a MS-DOS (Micro Soft Disk Operating System) program named Network Optimi-zation Program which is an out-of-date program and it has some shortages. For example, there is no option to add all the pipes in production. So the results are not applicable to the produced pipes. Additionally, it requires too much time to prepare the input file and to understand the output file since it gives out messy outputs. Node assignment in the NOP is also a waste of time by itself.

TURKISH JOURNAL OF WATER SCIENCE & MANAGEMENT
72
For these reasons, a code written in excel visual basic which allows the user to work on the tables easily should be very helpful. Firstly, the coding should do node assignment by itself. It should calculate some input data by itself which NOP does not. It must have all the pipes in production and in need to add more pipes it must allow the user to input more pipe data. The program should allow the user to add the pressure breaker or the pump information to the optimization. The coding should prepare easily not only the hydraulics table, which is the most important table for the high pressure network, but also cost and piezometric level tables. After deciding these standards, a flowchart (Algorithm) for the coding is created (Figure 3).
The code includes four worksheets which are named as: parameters, pipes, pressure breaker (Or pump), and network. Firstly, the user should enter the necessary information on the parameters worksheet. Then, if there is a need to make changes on the pipes worksheet it should be done next. The main duty of the user is on the network worksheet. “Clear” button makes the network worksheet ready to start a new project. The user should enter the network information from upstream to downstream. He should enter the main channel on the first column and to the next column he should input if there is a hydrant with “H” or if there is a branch with “Y”. And for the same line the other inputs are: distance in kilome-ters, ground elevation in meters and the area in hectare if there is a hydrant in order. There is a sample network page on the excel file to help the user enter the data correctly. If there is a pressure breaker or pump it should be entered to the Pressure Breaker worksheet with the same format in the network page.
Users will be mainly work on the parameters and the network worksheets which are the most important pages of the code (Their samples can be seen in Figure 5). After the user enter parameters and network data correctly, he should click “Prepare Input Data” button. This process makes corections automatically and warn the user if there is any typo or mis-sing data. Also, it assigns nodes to all hydrants and branches so the code will understand where nodal points are. Then by clicking the “Solve” button, flow calculation collabora-tes with Clement’s method (Flexibility) and calculates flow for each nodal points. After this process, the code is ready to choose pipe diameter with the limits of velocity that are produced by the pipe manufacturers. While selecting the pipe diameter the program also calculates the static pressure. Because the pipe diameters are differing with the pipe pres-sure class. Finally, dynamic pressure calculation is done and the EPNO solves the whole pressurized irrigation system. Additionaly, user also able to get related tables as a summary of the calculations.
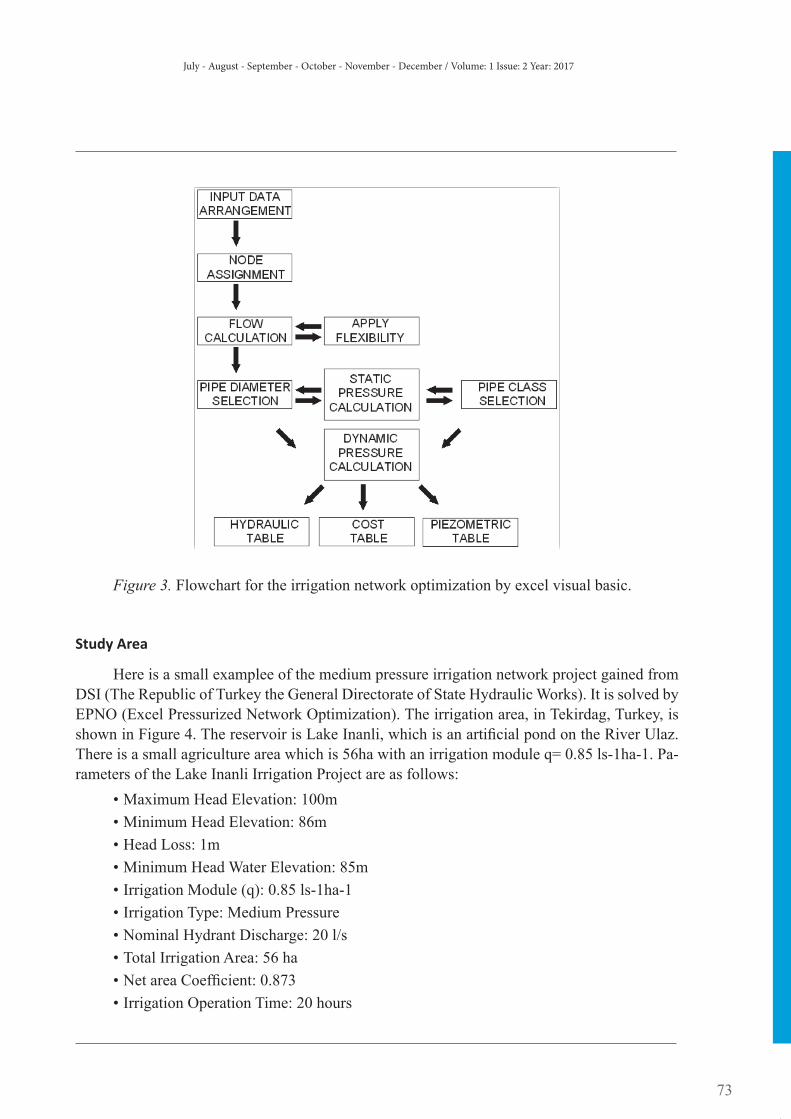
July - August - September - October - November - December / Volume: 1 Issue: 2 Year: 2017
73
Figure 3. Flowchart for the irrigation network optimization by excel visual basic.
Study Area
Here is a small examplee of the medium pressure irrigation network project gained from DSI (The Republic of Turkey the General Directorate of State Hydraulic Works). It is solved by EPNO (Excel Pressurized Network Optimization). The irrigation area, in Tekirdag, Turkey, is shown in Figure 4. The reservoir is Lake Inanli, which is an artificial pond on the River Ulaz. There is a small agriculture area which is 56ha with an irrigation module q= 0.85 ls-1ha-1. Pa-rameters of the Lake Inanli Irrigation Project are as follows:
• Maximum Head Elevation: 100m• Minimum Head Elevation: 86m • Head Loss: 1m • Minimum Head Water Elevation: 85m • Irrigation Module (q): 0.85 ls-1ha-1 • Irrigation Type: Medium Pressure• Nominal Hydrant Discharge: 20 l/s • Total Irrigation Area: 56 ha • Net area Coefficient: 0.873 • Irrigation Operation Time: 20 hours

TURKISH JOURNAL OF WATER SCIENCE & MANAGEMENT
74
Figure 4. Location of the study area and Lake Inanlı irrigation project plan (DSI, 2009)
Figure 5. Parameters and network worksheets for the lake Inanli irrigation project.

July - August - September - October - November - December / Volume: 1 Issue: 2 Year: 2017
75
Results and DiscussionA good irrigation network should be safe, affordable and ergonomic. Main purpose of
the optimization process is to create a balanced pressurized irrigation network and a fair distri-bution. Therefore, high pressure at the upstream hydrant and low pressure at the downstream hydrant is not a good solution. All of the irrigation network’s hydrants should have a balanced pressure. The pipe selection process is very important to make an affordable irrigation project since the pipe cost is the main cost in an irrigation project.
The Lake Inanlı Irrigation project is solved by the code. The output data from the NOP is also gained. Thus, the results from the EPNO and NOP are compared. Hydraulic table includes the computed irrigation hydraulics such as: flow, velocity, hydraulic gradient, static pressure, pipe’s diameter, pipe’s pressure class, dynamic pressure. The piezometric level comparison is in the Table 2 and in the Figure 6. The comparison of hydraulic tables is in the Table 3.
According to the results, EPNO gives output which is very close to the NOP’s. Hydraulic table comparison shows very similar results however specially at the end of the lines, where the first method of Clément is not applied, EPNO calculates more discharge than the NOP. For instance, at the Hydraulic Table of Lake Inanli Irrigation, at the end of the lines the discharge from EPNO is 23 l/s although the discharge from the NOP is 20 l/s because EPNO chooses the higher value from the Clément’s method and linear method at the end of the lines.
According to Figure 6, it is clear that the EPNO generates a pressurized irrigation network with a better balanced dynamic pressure distribution which is well for the irrigation systems. At the downstream hydrants there is higher dynamic pressure.
These differences are mainly because of the more detailed input of the pipe diameters. While modelling with the NO, user is not able to input inner and outer pipe diameter or thick-ness related with the pressure class. After the NO solves a system user changes the pipe diam-eter to the closest inner diameter in that pressure class. But this change doesnot have any effect on the velocity and so on the flow and pressure. However, some researchers say this effect is negligible, EPNO shows that, in big scale pressurized irrigation distrubiton systems, especially at the end of the lines there is a huge effect on the pressure that can result the pipe burst.

TURKISH JOURNAL OF WATER SCIENCE & MANAGEMENT
76
Table 2: Comparison of the piezometric level for the Lake Inanli irrigation project
LAKE INANLI PIEZOMETRIC LEVEL TABLE
MAIN CHANNEL
BRANCHING CHANNEL KM
PIEZOMETRIC LEVEL (m)
EPNO NOP
MaincHannel - 0+000 85.00 85.00
Y1 0+450 81.36 81.97
H1 0+640 80.18 80.99
H2 0+820 79.03 79.24
H3 1+000 77.36 76.21
H4 1+165 76.10 74.80
Y1 - 0+000 81.36 81.97
H1 0+210 80.02 79.93
H2 0+370 78.53 77.67
H3 0+540 77.23 75.71
*EPNO: Excel Pressurized Network Optimization *NOP: Network Optimization Program
Figure 6. The Lake Inanli irrigation project, piezometric table comparison.

July - August - September - October - November - December / Volume: 1 Issue: 2 Year: 2017
77
Lak
e In
anli
Hyd
rau
lic
Tab
le F
rom
EP
NO
(Ir
riga
tion
Net
wor
k O
pti
miz
atio
n C
oded
by
Exc
el V
isu
al B
asic
) q
=0.
85 ls
-1h
a-1 a
nd
n=
0.00
9
CHANNEL
BR
UT
A
RE
A
(ha)
FL
OW
Q
(l
t/s)
VE
LO
CIT
Y
V
(m/s
)
HY
DR
AU
LIC
G
RA
DIE
NT
J
(m/m
)
PIP
E D
IAM
ET
ER
(m
m)
PIP
E L
INE
HY
DR
AN
T
NOTES
INN
ER
OU
TE
R
MA
XIM
UM
S
TA
TIC
P
RE
SS
UR
E
(m)
PR
ES
SU
RE
C
LA
SS
(a
tm)
TY
PE
AR
EA
(h
a)F
LO
W
(lt/
s)
NU
MB
ER
O
F
OU
TL
ET
TY
PE
MIN
IMU
M
DY
NA
MIC
P
RE
SS
UR
E
(m)
M.
Ch.
56.0
921.
640.
0081
026
628
027
.04
PE
100
Y
1
32
.080
1.44
0.00
618
266
280
30.7
4P
E10
08.
020
.02
D10
.88
H1
24
.060
1.35
0.00
637
238
250
32.0
4P
E10
08.
020
.02
D11
.03
H2
16
.040
1.41
0.00
932
190
200
32.6
4P
E10
08.
020
.02
D9.
96H
3
8.
023
1.26
0.01
001
152
160
33.0
4P
E10
08.
020
.02
D8.
71H
4
Y1
24.0
601.
350.
0063
723
825
030
.54
PE
100
8.0
20.0
2D
10.5
2H
1
16
.040
1.41
0.00
932
190
200
32.0
4P
E10
08.
020
.02
D10
.53
H2
8.
023
1.26
0.01
001
152
160
33.2
4P
E10
08.
020
.02
D10
.02
H3
Lak
e In
anli
Hyd
rau
lic
Tab
le F
rom
Th
e N
etw
ork
Irr
igat
ion
Pro
gram
by
DS
I q
=0.
85 ls
-1h
a-1 a
nd
n=
0.00
9
M.
Ch.
56.0
921.
300.
0067
430
031
5 2
7.0
4P
E10
0-
--
--
Y1
32
.080
1.13
0.00
513
300
315
30.7
4“
8.0
20.0
2D
11.7
0H
1
24
.060
1.35
0.00
970
238
250
32.0
4“
8.0
20.0
2D
11.2
0H
2
16
.040
1.41
0.01
411
190
200
32.6
4“
8.0
20.0
2D
9.30
H3
8.
020
1.10
0.01
154
152
160
33.0
4“
8.0
20.0
2D
7.80
H4
Y1
24.0
601.
350.
0097
023
825
030
.54
“8.
020
.02
D10
.40
H1
16
.040
1.41
0.01
411
190
200
32.0
4“
8.0
20.0
2D
9.70
H2
8.
020
1.10
0.01
154
152
160
33.2
4“
8.0
20.0
2D
8.90
H3
Table 3: Comparison of results from the code and the network optimization program

TURKISH JOURNAL OF WATER SCIENCE & MANAGEMENT
78
Conclusions
Many researchers have been working on the water conservation because of the threat by the global warming on the existence of the water in the world. The agriculture, which is biggest consumer of the water, takes the biggest share on these studies. Many irrigation methods are developed to conserve the water depending on the agricultural area’s properties. Among the irrigation methods, the best water saving technique is known as dripping and sprinkler systems that need to contact to a pressurized irrigation system.
Optimization and modeling of the pressurized irrigation system attracted many scientists. As a result, many irrigation optimization techniques are developed. The most used method is the first formula of Clément which use a probability technique. This method needs to be automated by computer programs since it is generally used for large scale irrigation projects. It can take many hours and days of calculations for large scale irrigation, however it looks an easy met-hod. The existing computer program (NOP) is not very convenient due to limitation of the pipe size selection. In order to create a suitable computer program a coding is written on the Excel VBA. Results show that the first formula of Clément is a great method for pressurized irrigation network with an optimum discharge distribution and a balanced dynamic pressure.
The pressurized irrigation methods that are projected with the first formula of Clément should be monitored. The necessary confirmation should be studied if there is any. Since it is based on a probabilistic approach there could be some mistakes between the operation and the calculation. There are different irrigation routines in different cultures. So expectation of error is logical. So, these errors should also be monitored and they should be limited with some configurations.
The efficiency of the irrigation systems depends on not only the technological development but also educated farmers. However, there are many water saving irrigation techniques, the states should educate the farmers, especially in the developing countries. Traditional irrigation metho-ds such as surface irrigation should be revised to pressurized irrigation methods.
Automation of the pressurized irrigation network is also possible. Development of the GPS (Global Positioning System) and wireless system allow the remote control, observing and main-tenance of the irrigation network. There are many types of equipment that measure the amount of water in the soil. By using these equipments irrigation networks can be automated. Therefo-re, when the plant needs water the hydrant opens automatically, and the hydrant can be closed when the amount of water in the soil reaches a level.

July - August - September - October - November - December / Volume: 1 Issue: 2 Year: 2017
79
References
Bruinsma, J. (2009). How to Feed The World in 2050? Paper presented at the FAO Expert Meeting, 24-26 June 2009, Rome.
Clément, R. (1966). Calcul des débits dans les réseaux d'irrigation fonctionnant àla demande. La Houille Blanche (5), 553-576.
The General Directorate of State Hydraulic Works . (2009). General information for Irrigation Network Project (pp. 53-75, 163-169). Antalya,: Turkey.
Feni, M., Khadra, R. & LaMaddalena, N. (2014). Hydraulic and agronomic constraints of on demand pressurized irrigation networks optimization. Geophysical Research Abstracts , Vol.16-6741. EGU General Assembly 2014, Vienna, Austria.
Labye, Y., Galand, A., Olson, M. & Tsiourtis, N. (1988). Design and Optimization of Irrigation Distribution Networks. FAO Irrigation and Drainage Papers, Vol. 44, Rome.
Onda, K., LoBuglio, J. & Bartram, J. (2012). Global Access to Safe Water: Accountig for Water Quality and the Resulting Impact on MDG Progress. International Journal of Environmental Research and Public Health 9 (3), 880-894.
LaMaddalena, N. (1997). Integrated Simulation Modeling for Design and Performance Analysis of On-Demand Pressure Irrigation Systems. Ph Instituto Superior de Agronomia.D. Dissertation, Lisboa: Universidade Technica de Lisboa. .
LaMaddalena, N. & Sagardoy, J. A. (2000). Performance analysis of on-demand pressurized irrigation systems. FAO Irrigation and Drainage Paper (59).
Shiklomanov, I. (1998). World Water Resources: A New Appraisal and Assessment for the 21st Century. (UNESCO, Ed.), Paris.:.
U.S. Bureau of Reclamation (1967). Canals and Related Structures. : United States Department of the Interior,
Bureau of Reclamation Publication, Denver.
TURKISH JOURNAL OF WATER SCIENCE & MANAGEMENT
80
Extended Turkish Abstract(Genişletilmiş Uzun Türkçe Özet)
Basınçlı Sulama Ağlarının Modellemesi ve Optimizasyonu
Tarımsal sulamanın başladığı zamanlardan günümüze kadar süregelen uygun ve verimli tarımsal sulama yöntemine ilişkin araştırmalar, birçok farklı sulama şebekesi yöntemi ve bu yöntemlere uygulanabilecek optimi-zasyon tekniklerinin ortaya çıkmasını sağlamıştır. Küresel ısınma ile birlikte birçok araştırmacı su tasarrufu üze-rinde araştırmalar yapmaya başlamış, suyun korunumunu teşvik etmek için devletlerin destek vermesi üzerine özel sektör bu konulardaki çalışmalarına hız vermiştir. Tarım sektörü suyun en büyük tüketicisi olduğundan çalışma-ların çoğu bu sektör üzerine yoğunlaşmıştır. 1970'li yıllarda ucuz ve etkin kullanılabilen plastik boruların keşfiyle birlikte su tasarrufu sağlayabilecek yöntemlerin geliştirilmesi hız kazanmıştır. İlerleyen yıllarda basınçlı tarımsal sulama yöntemlerinin geliştirilmesiyle yağmurlama sulama sistemleri tarım sektöründe kullanılmaya başlanmıştır. Suyu verimli ve tasarruflu bir şekilde kullanarak da sulama yapılabileceği görüldükten sonra birçok tarımsal sula-ma yöntemi ve buna bağlı olarak farklı optimizasyon teknikleri geliştirilmiştir.
Günümüzde optimizasyon teknikleri genellikle üç kategoriye ayrılır: Deneysel metodlar (US Bureau of Reclamation, 1967), istatistiksel metodlar (Clément, 1966) ve rastgele hidrant operasyonuna bağlı metodlar (La-maddalena, 1997). En çok kullanılan optimizasyon yöntemlerinden biri olasılık hesaplarına dayanarak en uygun şebeke karakteristiklerini ortaya çıkaran Clément’in birinci yöntemidir. Bu yöntem büyük ölçekli sulama projeleri için uygulandığında genellikle daha iyi sonuç vermektedir.
Devlet Su İşleri’nin kullandığı “Network Optimizasyon Programı (NOP)” çok eskiden kodlanmış bir prog-ram olduğundan günümüzde ihtiyaçlara kısmen cevap vermekte fakat yetersiz kalmaktadır. Bu çalışmada, EXCEL VBA kodlama dili kullanılarak ve Excel tablolarından faydalanılarak bir yazılım programı üretilmiştir. Bu prog-ram ile 1. Clément yöntemi kullanılarak basınçlı sulama sistemlerinde su ihtiyacına göre akış dağılımı optimize edilebilmekte, boru içi akış hızı limitlerine göre boru çapları belirlenebilmekte ve düğüm noktalarındaki statik ve dinamik basınçlar hesaplanabilmektedir. Ayrıca piezometrik kotlar ve boru maliyet tablosuda kolayca oluşturula-bilmektedir. Network Optimizasyon Programı ile bu çalışmanın çıktıları karşılaştırılmıştır. Böylece, girdi olarak kullanılan boru iç çapları gibi ufak detayların aslında sonuçlarda büyük farklar oluşturabileceği ortaya konulmuş-tur. Ayrıca, programın basınç ve debi açısından daha dengeli bir dağıtım yaptığı açıkça görülmektedir. Özellikle hat sonlarında daha yüksek basınç sağlayarak çifçilere daha eşit bir su iletimi sağlanabilmektedir.
Clément’in birinci methodu Olasılık yaklaşımı ile hesaplama yaptığı için model sonuçları ile uygulama sonuçları arasında belirli bir orana kadar uyumsuzluk olması muhtemeldir. Bu hataları en aza indirgemek için alışılagelmiş tarımsal geleneklerin bölgesel incelenerek gerekli parametrelerin doğru bir şekilde belirlenmesi çok önemlidir.
Basınçlı sulama şebekelerinin otomasyonu ve uzaktan kontrolü gelişmiş CBS (Coğrafi Bilgi Sistemi) dona-nımları, kablosuz iletişim araçları, uzaktan kontrol sistemleri ile mümkün olmaktadır. Toprak nemini ölçen cihaz-lardan faydalanarak bitkiye ihtiyacı olduğu kadar su otomatik vanaların kontrolü aracılığı ile verilebilir. Kısaca, bitki kök bölgelerindeki nemölçer ile su ihtiyacı olduğunda vanaya iletilen komut ile su iletilebilir ve su doygun-luğuna ulaştığında vana kapatılarak ihtiyaç fazlası suyun drenaja gitmesi engellenebilir.

July - August - September - October - November - December / Volume: 1 Issue: 2 Year: 2017
81

TURKISH JOURNAL OF WATER SCIENCE & MANAGEMENT
82

July - August - September - October - November - December / Volume: 1 Issue: 2 Year: 2017
83

TURKISH JOURNAL OF WATER SCIENCE & MANAGEMENT
84
http://waterjournal.ormansu.gov.tr
Beştepe District Alparslan Türkeş Street No: 71 Yenimahalle/ANKARA+90 (312) 207 50 00 • Fax: +90 (312) 207 51 87

![Bachpan'e Mustafa Wa Meelad'e Mustafa (Alehe Salat-O-Salam) [Urdu]](https://static.fdocuments.us/doc/165x107/577cb0ae1a28aba7118b45c4/bachpane-mustafa-wa-meelade-mustafa-alehe-salat-o-salam-urdu.jpg)