
01 ID1a4 #W16W M t T/ 0- oi-18 a 4 53e/ of Earth … · Orville R. Rusell, David A. Nichols ....
72
01 4 1a4 #W16W M §m§ 4 t T/ 0- oi -18 a 4 ID the- interest of nQrly ndWI~ t: 53e/ sminat ion of Earth Resources S vy I Piognrm information and without liability fcc ay 4se made thereof. APPLICATION OF LANDSAT-2 DATA TO THE IMPLEMENTATION AND ENFORCEMENT OF THE PENNSYLVANIA SURFACE MINING CONSERVATION AND RECLAMATION ACT Orville R. Russell Earth Satellite Corporation 7222 47th Street __Washinnton._D._C.-20015. {E77-10184) -APPLICATION OF LANDSAT-2 DATA N77-28551 TO .T-HE IIPLEMHXTATION AND ENEORCEIENT OF THE 4 '4 FI PENNSYLVANIA SURFACE. MINING CO0NSERVATION AND RECLA'HATI&N, ACT Final Report, M~ar. 1975 -luncias ?Ia\y 1977 (Earth Satellite Corp.) 77 p G3/43100184 May 1977 Type III (Final) Report, March 1975 - May 1977 FINAL REPORT Prepared for: GODDARD SPACE FLIGHT CENTER Greenbelt, Maryland 20771 RECEIVED JUL14 1977 SIS/1902.6 https://ntrs.nasa.gov/search.jsp?R=19770021607 2018-08-30T17:53:50+00:00Z
Transcript of 01 ID1a4 #W16W M t T/ 0- oi-18 a 4 53e/ of Earth … · Orville R. Rusell, David A. Nichols ....

01 4 1a4 #W16W M §m§ 4t T/ 0-oi-18a 4IDthe- interest of nQrly ndWI~ t: 53e/smination of Earth Resources S vy I Piognrm information and without liability
fccay 4se made thereof.
APPLICATION OF LANDSAT-2 DATA TO THE IMPLEMENTATION AND ENFORCEMENT OF THE PENNSYLVANIA SURFACE MINING CONSERVATION AND RECLAMATION ACT
Orville R. Russell Earth Satellite Corporation
7222 47th Street __Washinnton._D._C.-20015.
{E77-10184) -APPLICATION OF LANDSAT-2 DATA N77-28551 TO .T-HE IIPLEMHXTATION AND ENEORCEIENT OF THE 4 '4FI PENNSYLVANIA SURFACE. MINING CO0NSERVATION AND RECLA'HATI&N, ACT Final Report, M~ar. 1975 -luncias
?Ia\y 1977 (Earth Satellite Corp.) 77 p G3/43100184 May 1977 Type III (Final) Report, March 1975 - May 1977
FINAL REPORT
Prepared for:
GODDARD SPACE FLIGHT CENTER Greenbelt, Maryland 20771
RECEIVED
JUL14 1977
SIS/1902.6
https://ntrs.nasa.gov/search.jsp?R=19770021607 2018-08-30T17:53:50+00:00Z

TECHNICAL REPORT STANDARD TITLE PAGE
1TReport Ho. 2. Goernment Accession No. 3. Recipient's Catalog No.
4, Title ond Subtitle 5. Report Date Application of Landsat-2 Data to the Imple- May 1977mentation and Enforcement of the Pennsylvania 6.Performing Organization Code
Surface Mining Conservation and Reclamation Ac7.Author(s) Orville R. Rusell, David A. Nichols 8.Performing Orgonixo o Report No.
and Richard W. Anderson9. Performing Orgonization Name and Address 10. Work Unit No.
Earth Satellite Corporation .to .
D C. (Chevy Chase) 11.Contact or Grant No.7222-47th StreetWash ngto ,2 015NAS5-21998 Washington, D.C. 20015 13. Type of Report .and Period Covered
12. Spon.oring Agency Nme. "4Address Type III (Final), Harold Oseroff, Technical Monitor Re (FaNational Aeronautics & Space Administration meporItI -Ma 1977
14- r ?ngency 1977Goddard Space Flight Center
1
Grppnhplt, Maryland 20771 15. Supplementary Notes
16. Abstract
The objectives of this investigation were to develop Landsat andaerial photographic interpretation products which will aid theCommonwealth of Pennsylvania in the implementation of their surfacemining laws. Computer processing of Landsat data by linear stretchingand by 4x computer enlarging resulted in quality imagery of 1:24,000scale. This imagery was manually interpreted. The areal extent ofmines as mapped with Landsat imagery showed an accuracy of about 95%,and general classification on status-of-reclamation into four cate- -,gories. Imagery and interpretation products from both Landsat imageryand aerial photography were prepared and presented to the appropriatebureaus within the Pennsylvania Department of Environmental Protection.After evaluation, they judged the products as being of no utility inimplementing their mining laws.
Origina photography may be purchased trami EROS Data Center
Sioux Falls, SD -57-198.
17. Key WorA, (S,toled by Author(s)) 18. Distribution Statement
Remote sensing, strip mining, ORIGINAL CONTAINS coal mining, Landsat imagery,aerial photography, computer COLOR ILLiSTRATIQUS enhancement, Pennsylvania
19, Security Clossif. (of 1his report) 20. Security Classif. (of this page) 21. Ho. of Page, 22. Prlce*
Unclassified 69
-For sale by the Clearinghouse for Federal Scientific and Technical Informadon, Springfield, Virginia 22151.

PREFACE
The central objective of this investigation was, through the use of
Landsat imagery and aerial photography, to provide information products
which would aid the State of Pennsylvania in the implementation of the
surface mining laws. A complete mine land information package and
instructional material were to be prepared and a system of distribution
of these information products was to be established.
Computer enhancement of Landsat imagery was determined to be neces
sary to produce the quality and scale imagery which had potential of
accomplishing the above objectives. Several computer processing techniques
were tested and useful Landsat images at a scale of 1:24,000 were produced
and interpreted. Area determinations of total mined lands proved to be
about 95% accurate and considerable information about status or reclamation
was discernible from this imagery. Both the Landsat products and the
photo interpretation results were presented to the appropriate bureaus
within the State and were judged by them to be of no utility in their
activities.
The information requirements of the State are largely at the field
inspector level. Information which will aid in his activities must be
detailed and timely, factors which are not obtainable with the current
basis data distribution system. The information must be in a form that
can be readily understood by the inspector. This requires an intermediate
interpretation phase which further affects the timeliness of the informa
tion.
ii

It is concluded that although useful information can be derived
from appropriately processed Landsat imagery and aerial photography,
resolution limitations, cost, and timeliness of data severely impact the
potential of effectively integrating remote sensing technology into the
routine mine land monitoring activities.
iii

TABLE OF CONTENTS
Page
1.0 INTRODUCTION .............. .............. .... 1
2.0 OBJECTIVES ............. .................... 3
3.0 BACKGROUND..................... . 4
3.1 Description of the Bituminous Coal Area ofPennsylvania............ ................ 7
3.2 Surface Coal Mining ........... ........... 9
4.0 SURFACE MINING LEGISLATION ......... .......... 15...
4.1 Pennsylvania Strip Mining Laws....... ........ 154.2 Field Inspector Function.... ................ 164.3 Federal Surface Coal Mining Laws. .... ....... ... 17
5.0 IMAGERY ACQUISITION, PROCESSING, AND ANALYSIS........... 21
5.1 Remote Sensor Program Support .... ............. 215.2 Aerial Photography....... ........... ....... 225.3 Landsat Imagery ......... .......... ....... 225.4 Computer Processing ... ............ .... .. 23
5.4.1 Scan Line Suppression......... ....... 265.4.2 Geometric Rectification ......... ..... 275.4.3 Data Analysis by Computer............ 275.4.4 Data Enhancement ................ 33.. 5.4.5 Pseudo-Ratios..................... 335.4.6 Maximum Likelihood ........... ..... 365.4.7 Computer Enlargement ................. 39
5.5 Imagery Interpretation and Analysis ......... 42
6.0 RESULTS .............. ........................ 57
7.0 COSTS AND BENEFITS ........ .......... ........ 59
8.0 CONCLUSIONS AND RECOMMENDATIONS........ ......... 64
9.0 NEW TECHNOLOGY .............. .............. 68
10.0 BIBLIOGRAPHY ........ ..................... 69
iv

LIST OF ILLUSTRATIONS
Page
1. Map showing the coal fields of Pennsylvania and theproject test site ...... ..................... 5
2. Organizational chart showing Bureaus within the Pennsylvania Department of Environmental Resources whichregulates surface mining activities .. .............. 6
3. Aerial oblique view of surface mining operations forcoal........ ... ................. .... . 11
4. Ground view of poorly reclaimed mined land.. ..... .. 13
5. Example of severe erosion inmined land .... .......... 14
6. Different color combinations of Landsat imagery (1:125,000scale) produced from 70mm negatives provided by the EROSData Center ....... ... ............. .... .. 24
7. Histogram showing image quality (cloud cover) of Landsatimagery in western Pennsylvania for a two-year period . . . 25
8. Computer shade-print of MSS band 5 (frame #2169-15242) showing tonal variations within mined lands. .. . . .. 29
9. Numeric printout of pixel values for MSS band 5 of a portion of the area shown in Figure 8..... ........... 30
10. Histogram of pixel values for MSS band 5 of the testarea....... .. ..................... ... 31
11. Assignment map from an unsupervised cluster analysisclassification of surface mined lands in the projectarea.......... .... ................... 34
12. Color composite of MSS bands 5 and 7 (frame #2169-15242);the data has been computer processed to emphasize minedland detail ..... ... ................ .... 35
13. A two-band (MSS-5/MSS-6) histogram used to produce a lookup matrix table ....... ..... .............. 37
V

Page
14. Histogram of spectral classes identified in cluster pro... gram......... .. ... ................ 38
15. Two-space (MSS bands 5 and 7) distribution plot of surfacemined reflectance data derived using class statistics by the maximum likelihood algorithm........ ............ 40
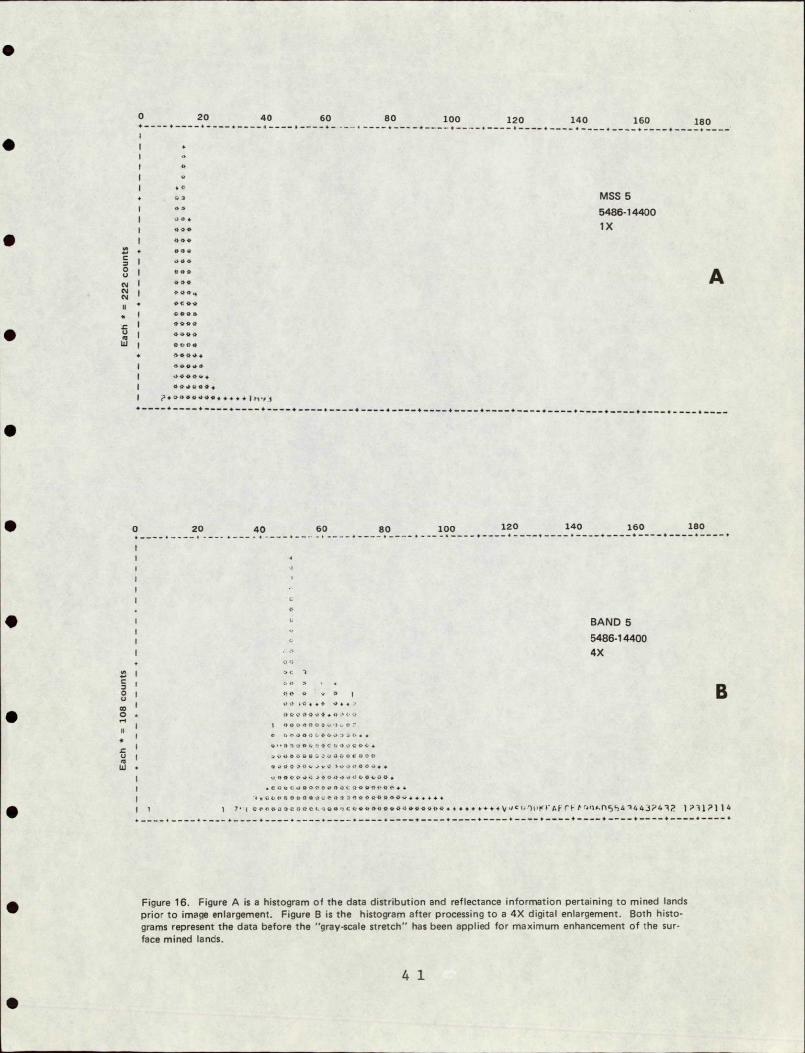
16. Histogram showing the distribution of the mined lands reflectance data prior to (Figure A) and after (Figure B)the 4x digital enlargement..... ................ 41
17. Total mined land disturbance map of southern ClarionCounty prepared from the interpretation of small scaleaerial photography....... ........ ...... .. 43
18. 1:24,000 scale photographic enlargement (23x) of computerprocessed Landsat imagery ........ ............. 45
19. Combined computer enlargement (2x) and photo enlargement(12.5x) was used to produce this version of the scenein Figure 18......... .. .............. .. 46
20. 4x computer enlargement and 6x photographic enlargement wasconsidered the optimum combination for quality 1:24,000scale imagery. Overlays A, B, and C illustrate the interpretation and evaluation........ ........... . 47
21. Color infrared photography was used as "ground-truth" forthe evaluation of the Landsat interpretation. Overlays Aand B permit a direct comparison of the interpretation ofaerial photography and Landsat imagery...... ......... 48
22. Comparison of ratioed images of MSS bands 5/6, Image A,and MSS bands 5/7, Image B.... ................ . 56
vi

LIST OF TABLES
Page
1. Manual evaluation of the reflectance of surface coal minesusing numeric prints....... ............... . 28
2. Cluster class characteristics of each MSS band..........32
3. Results of the correlation - regression analysis........51
4. Results of statistical analysis of area delineation . ... 52
5. Cost estimates of conducting a surface mined land inventorywith Landsat imagery or aerial photography............. 63
yii

1-0 INTRODUCTION
The Federal Energy Administration has established that even with
conservation measures the nation's total energy needs by 1990 will be
53% greater than in 1974., 'Unless a major breakthrough occurs in the
harnessing of solar energy or in the development of fusion reactors,
coal must provide well over half of these energy needs. In his energy
message of April 20, President Carter estimated that by 1985 this coun
try will have to be producing one billion tons of coal a year. Both the
Energy Supply and Environmental Coordination Act of 1974, and the Energy
Policy and Conservation Act of 1975 mandated that where possible elec
tric power plants must convert to coal. To accomplish this, the quan
tity of coal mined would need to be doubled, and a major portion would
be from surface mines.
While the increase of coal production is essential, consideration
for protection of the environment is equally important. Federal legis
lation to enact standards of reclamation for surface mine lands is now
being considered with this objective, and is expected to become law.
Pennsylvania's surface mining laws are generally recognized as
being some of the better legislation of the Appalachian region for water
quality control and surface mine land reclamation. The enforcement of
these laws, however, requires nearly 100 administrative and field
personnel, and an annual expenditure of over $2 million. Investigation
of methods or techniques which improve law enforcement efficiency
should thus be of high priority. Work performed by EarthSat, as well as
by others in the ERTS-l experiments (Wier, 1974, 1976; and Rogers,
et al., 1973; Sweet, et al., 1973), indicate considerable potential for
using Landsat imagery and small scale aerial photography in monitoring

the progress and status of surface coal mining in certain parts of the
country. The results of these studies prompted the investigation described
here.
A test area in the bituminous coal area of western Pennsylvania was
selected for evaluating the utility to the State of Landsat imagery and
aerial photography inenforcing surface mining laws. Although much
potentially useful information can be derived from both the photography
and the Landsat imagery, they were found to be of limited value to the
State for law enforcement purposes.
2

2.0 OBJECTIVES
To determine the utility of Landsat data for implementing mining
regulations in Pennsylvania, this investigation had the following cen
tral objectives:
• To prepare information products for the analysis of Landsat
and aircraft imagery to rapidly and effectively implement the
regulatory provisions of Pennsylvania's Surface Mining Con
servation and Reclamation Act and anticipated Federal Surface
Mining Legislation.
o To develop and operationally implement a monitoring system
within one or more detailed study sites, which would include
surface mine disturbance change detection, reclamation status
monitoring, and mined lands inventory updating.
* To provide usable regulatory information products to line
agencies within the Pennsylvania Department of Environmental
Resources.
Initial emphasis was to be placed on manual analysis by experienced
image interpreters. The utility of large scale digital image recon
structions, selected multispectral signature programs, and classifi
cation algorithms were then to be evaluated as an aid to manual image
interpretation.
3

3.0 BACKGROUND
Pennsylvania has long been a leading coal producing state. The
U.S. Bureau of Mines reports that since 1760 the State has produced over
nine billion tons of bituminous coal, and until 1927 was the nation's
leading coal producer. The bituminous coal fields, which occur mostly
in western Pennsylvania (see Figure 1), cover over 14,000 square miles
(36,244 square kilometers), predominately within the watersheds of the
Allegheny and West Branch Susquehanna Rivers. A cursory examination of
Landsat imagery indicates that the drainage system of approximately one
fourth of this area or about 3,500 square miles (9,061 square kilo
meters), could currently be adversely affected by improper mining and
reclamation procedures.
Mining practices over the last century have left many areas severely
affected by excessive sedimentation and acid water producing conditions.
However, since the enactment of the Bituminous Coal Pit Mining Conservation
Act in 1963, Pennsylvania has made great strides in controlling old
problem areas, and their current mining and reclamation laws are considered
to be among the more comprehensive.
The laws are administered within the Pennsylvania Department of
Environmental Resources, by the Bureau of Water Quality Management and
Bureau of Surface Mine Reclamation, as shown on the organizational chart
in Figure 2. For administrative purposes, the Bureau of Surface Mine
Reclamation has divided the Commonwealth into the Eastern Anthracite and
the Western Bituminous Regions. The latter region is extensive and is
divided into 18 districts which are monitored by one or more Field
Inspectors under the supervision of two Inspectors-at-Large.
4

DTRIBUTIONSOF PENNS.VANIA C1ALS 0 COM/AIINWEALTH OIPENNSYLVANSDEPARTMENT OF ENVIRONMENTAL RESOURCES
TOPOGRAPHIC & GEOLOGIC SURVEY Arthur A. Socolow, State Go*Inh
Scale
0 25 50 75 100 miles
ERIE 0
NEW YORK WARREN ( McKE POTTER
TIOGA
NEW YORK
BRADFORD SUSQUEHANNA
WAYNE
VE
WA
0 LYTOMING £A
SULLIVAN WOMN
A
•.
BEAVWFOR0 MERG 00
BUTLER
CLLLUZER F_
01 'ZSFW COLUMBI
OMIN
AB
ORTA6TO
BITUMINOUS FIELDS ANTHRACITE FIELDS
E High Volatile Bituminous Coal m Anthracite
Medium Volatile Bituminous Coal Semi Anthracite- Low Volatile Bituminous Coal
Figure 1. Map showing the investigation site and the distribution of Pennsylvania coal.

The Bureau of Surface Mine Reclamation employs 95 personnel and had
an operations budget in 1975 of over $1.6 million. The budget for 1977
is about $2 million, of which over $600,000 will be expended in the
Western Bituminous Region.
As of February 1977, there were 1,146 current permits issued,
and 972 active surface coal mining operations in western Pennsylvania.
The State employs 46 inspectors to monitor these operations. Permits
range in size from 25 to 2,000 acres, with the average nearer the lower
figure. Depending upon the size of the company, an operator may mine
from 60 to 1,000 acres per year. In 1976, nearly 5-3/4 million tons of
bituminous coal were produced.
3.1 Description of the Bituminous Coal Area of Pennsylvania
The bituminous coal fields in Pennsylvania lie in the western
portion of the Commonwealth (see Figure 1) in an area generally
referred to physiographically as the Appalachian Plateau. This
area lies immediately west and north of the more rugged Valley and
Ridge Province of the Appalachian Mountains. The Plateau is inthe
temperate climatic zone, where August temperatures average about
680F and February temperatures 250 F. The area has considerable
cloud cover and an average rainfall of 40 inches per year, supple
mented by 20-50 inches of snowfall. The result of this abundant
moisture is a dense forest cover wherever land has not been dis
turbed by human activities.
Elevations range between extremes of about 2,500 feet in
north-central Pennsylvania to about 1,400 feet on the Ohio River at
the Ohio-Pennsylvania state line. The area is maturely dissected,
7

characterized by moderate relief and rolling topography, with local
elevation differences ranging between 200 and 500 feet. It has
been classified by Hammond (1964) as predominately open high hills
and low mountains.
Geologically, the area is characterized by highly dissected
nearly horizontal to moderately folded strata of shales, sandstones,
limestones, and coals, ranging in age from Upper Mississippian
(about 325 million years ago) to Lower Permian (about 275 million
years ago). Geologic conditions were unique in this time period in
that there were repeated minor fluctuations in the land level which
caused alternate marine transgressions and regressions to occur in
the shallow interior basins, producing a cyclic character to the
sedimentation in the basins. A regular sequence of rock types was
deposited over and over. Thus, in western Pennsylvania there are
several coal beds that are of commercial interest separated by a
predictable sequence of other rocks. Although all units of this
sequence are not always present, the ideal sequence, beginning at
the bottom, consists of:
1. Fine grain micaceous sandstone, locally unconformable on
underlying beds;
2. Sandy shale;
3. Freshwater, usually non-fossiliferous limestone;
4. Under clay;
5. Coal;
6. Gray marine shale with pyritic nodules;
7. Impure lenticular fine grained marine limestone;
8. Black laminated shale with limestone concretions or
layers;
B

9. Clean marine limestone;
10. Marine shale with limestone concretions.
The lower part of this sequence is normally freshwater sedimen
tation, and the upper part was deposited in marine anerobic con
ditions. A supply of oxygen was lacking in this environment, and
the carbon from the organic material was thus preserved. When the
concentration of organic material was adequate, coals were formed.
Elsewhere, the carbon imparts a black coloration to most of the
rock sequence. Such a chemically reducing environment was also
ideal for the precipitation of iron sulfide as pyrite or marcasite,
which when exposed at the surface during the process of mining for
coal, decomposes and contributes to producing acid soil and water
conditions.
3.2 Surface Coal Mining
Strip mining for coal is more economical than underground
mining when the coal bed(s) lie near the surface. Several factors
influence to what depth it is practical to strip; however, the
production cost and selling price of coal usually determine what is
economical to mine by stripping methods. For many years, a general
rule-of-thumb in the Midwest was that six meters (20 feet) of
overburden could be removed for every foot of coal seam. Today's
technology permits stripping to depths greater than 30 meters (100
feet) if the quantity of coal justifies it.
Much of the coal in the United States lies in relatively
undeformed strata and the coal seams are roughly parallel to the
general land surface. If the terrain is relatively flat and poorly
9

dissected, surface mines can extend continuously over large areas.
In such environments, as ismuch of the Midwest, the stripping is
referred to as "area mining." Inthe highly dissected environment
of much of the Appalachian Plateau where slopes are commonly greater
than 150, the stripping operations normally follow the coal seam
around the contour of the land. Such mines are narrow and sinuous,
and are referred to as "contour mines."
Originally, nearly all the surface mining in western Pennsylvania
was contour mining, but with the development of larger and more
efficient equipment, current operations may be considered as a com
bination of contour and area mining.
In normal mining operations, after the vegetative cover has
been removed and the overburden has been "shot" or blasted ade
quately to fracture the strata, a drag line removes the loosened
material to expose the coal, as shown in Figure 3. A drag line
differs from a shovel in that a drag line has the earth-moving
bucket on a cable rather than on a solid beam. The drag line,
equipped with a large boom which may be as much as 90 meters (300
feet) long, remains on the original ground surface and opens a
trench down to the coal seam wide enough to permit shovels and
large trucks to operate in the bottom to dig and remove the coal.
Once the overburden, often referred to as "spoil," has been
removed, it is piled in a ridge on the side of the trench opposite
the drag line. As the trench is widened to expose more coal, the
mined-out portion is filled-in with the removed overburden.
Environmental problems, other than aesthetics, arise from
erosion of the loosened rock material and decomposition products of
10
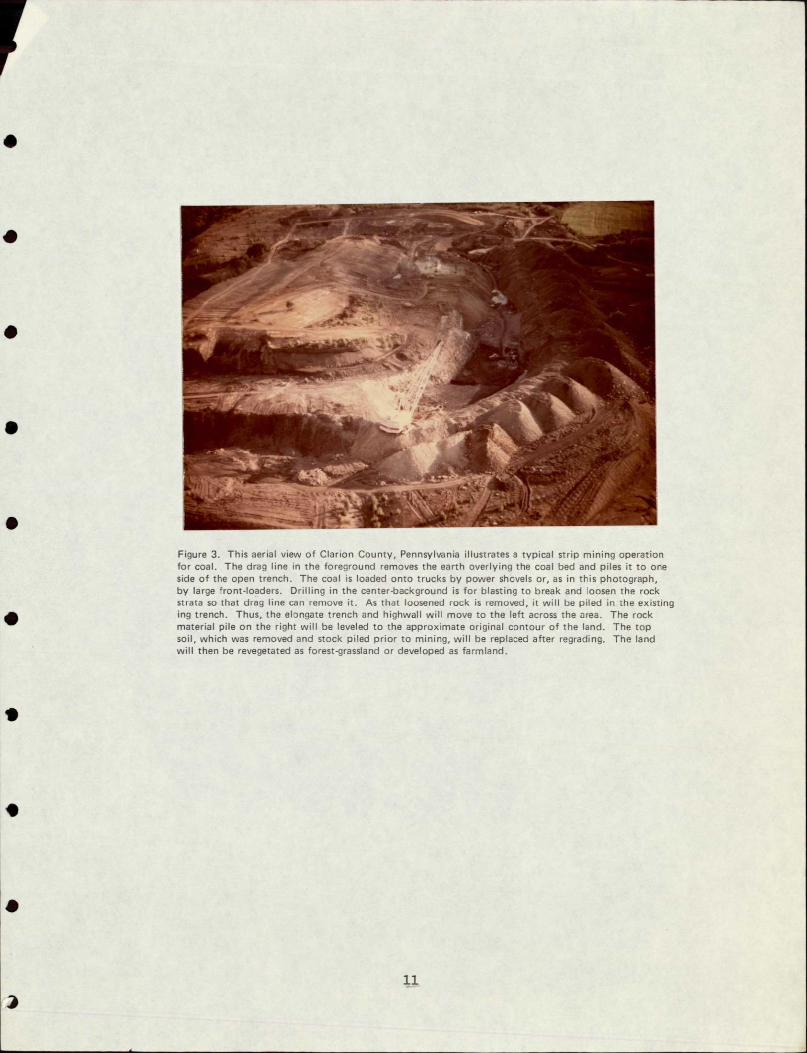
Figure 3. This aerial view of Clarion County, Pennsylvania illustrates a typical strip mining operation for coal. The drag line in the foreground removes the earth overlying the coal bed and piles it to one side of the open trench. The coal is loaded onto trucks by power shovels or, as in this photograph, by large front-loaders. Drilling in the center-background is for blasting to break and loosen the rock strata so that drag line can remove it. As that loosened rock is removed, it will be piled in the existing ing trench, Thus, the elongate trench and highwall will move to the left across the area. The rock material pile on the right will be leveled to the approximate original contour of the land. The top soil, which was removed and stock piled prior to mining, will be replaced after regrading. The land will then be revegetated as forest-grassland or developed as farmland.

minerals exposed at the surface (see Figures 4 and 5). Most of the
strip mining legislation enacted by states and the federal govern
ment are directed at minimizing or eliminating these problems.
12

Figure 4, Past reclamation practices were not always successful, In this arem, which was mined at least 15 years previously, the reestablishment of a suitable ground cover was only partially successful. The barren areas are continually being eroded, severely in some places as can be seen in Figure S. The responsibility of the mine operator for proper reclamation has no doubt lapsed and the problem of rehabilitation of the land now lies with the state or federal government.
13

in Figure 4. Portions Figure 5. This gully eroding into old mine spoil lies just to the left of the ares
However, the drainageon the adjacent farmland.are being depositedof the sediment from this area as shown above soon enter the Clarion and Allegheny Rivers.'
from the major tributaries sch
DUGI aI PAGE IS POOR
14

minimize erosion and the threat of siltation. The top soil must be
preserved and re-used as much as possible. A detailed timetable
and cost estimate must be included.
The operator must post a bond for the land affected as surety
that provisions of the "Clean Streams Law" will be met and that the
reclamation will be performed. The size of the bond, which has
recently been raised from $500 to $1,000 per acre, is held during
the period of mining operations and for five years thereafter,
unless released sooner.
The enforcement of the laws is the responsibility of field
inspectors assigned to Mined Land and Water Conservation Districts.
4.2 Field Inspector Function
The duties of the field inspectors are varied. They are
responsible for enforcing proper safety equipment and procedures
which are used on the mine sites. They must monitor the operator
mining and reclamation procedures for adherence to the plan approved
at the issuance of the mining permit. They inspect for stream
pollution and determine if the sediment ponds and water treatment
facilities are adequate. They monitor backfill procedures and
graded lands for proper contour. They inspect topsoil stock piles
to insure that they are properly protected from erosion. Finally,
they determine if reclamation has been adequate for release of
bond.
The inspectors advise mine operators on proper procedures and
encourage them to conduct their mining activities within the frame
work of the current regulations. Citations may be written and an
16

examiner may assess large fines; however, the inspectors attempt to
assist the operator in correcting infractions promptly without
resorting to legal procedures.
4.3 Federal Surface Coal Mining Laws
Existing federal laws are similar in scope and nature to those
of the State of Pennsylvania, but apply only to mining on federally
owned lands.
New mining legislation presently being considered by Congress
shows much similarity to the Pennsylvania regulations, but is more
comprehensive and is designed with flexibility so it can be applied
in all areas of the country.
The House Bill, H.R.2, and the Senate Bill, S.7., are similar.
The bills establish a program of federal and state cooperation to
regulate coal strip mining and reclamation. They recognize the
state's primary responsibility to regulate surface mining, but set
federal standards for state programs and provide a strong federal
back-up for enforcement. Under the bills, the Interior Department
will be responsible for approval of state regulatory programs which
must meet or exceed the federal standards, provide grants to the
states for development of their programs, administer a federal
program for the reclamation of abandoned mines, and take primary
responsibility for regulating strip mining on federal lands.
The bills outline in considerable detail the standards for
strip mining operations designed to reduce environmental damage.
They provide for the protection of the rights of surface owners as
well as farmers and ranchers whose interests, such as water rights,
17

may be affected by the mining operations. They allow for public
input through hearings on prospective mining and reclamation oper
ations. The bills also allow the states or the federal government
to designate lands that are unsuitable for strip mining.
A review of the House Bill, H.R.2, reveals several areas where
remote sensing, either with satellite data and/or aerial photo
graphy, can be of utility. Only those portions of the bill are
summarized (Mikva, 1977).
Title IV of the House Bill establishes an Abandoned MineReclamation Fund to finance the reclamation of abandoned strip minelands. Money for the fund would be derived primarily from fees setat the rate of 35¢ per ton for the surface mine coal and 15* perton of deep mine coal. A special fee of 5% of the value of thecoal or 35t per ton, whichever is less, is set for lignite or browncoal.
Section 404 of Title IV dictates that each state may submit anabandoned mine reclamation program to the Secretary, showing aschedule of projects to be undertaken and criteria for ranking themin priority. Once a state program has been approved, projects maybe submitted on an annual basis for funding. The federal share ofeach project cost cannot exceed 90%.
Under Section 406, the Secretary of Interior is required tomake a thorough study of potential reclamation sites, select landsfor purchase according to certain priorities, and prepare a costbenefit analysis for each project.
Section 507 states that mine operators must submit the followinginformation as part-of the required mining and reclamation plans:
* Identification of all corporations and officials in
volved;
* Historical information regarding the applicant;
A demonstration of compliance with public notice requirements;
* Maps of the proposed mining area;
* Description of the mining methods;
° Listing of past mining permits;
1R

° Schedules and methods for compliance with environmentalstandards;
* Full description of the hydrologic consequences of miningand reclamation;
* Results of test boring;
" A soil survey if the mine will be located on "primeagricultural land;"
" Complete reclamation schedule;
o A complete blasting schedule.
Under Section 510 of the law, specified findings are required demonstrating that the operation will not interrupt, discontinue,or prevent farming on alluvial valley floors where land is naturallysub-irrigated by groundwater, nor damage the water systems thatsupply the floors.
Section 515 contains the specific performance standards required for surface coal mine operations. The major performancestandards in which remote sensing can be of utility are as follows:
* The operator is required to return the site to its approximate original contour; highwalls are to be eliminated.Regraded slope must be shaped to assure stability andminimize erosion.
The operator must preserve and re-use the top soil takenfrom the mine site, protecting it from erosion and contamination. In areas of prime agricultural land, theoperator must provide in the final regraded surface, asoil root zone of comparable depth and quality to thatwhich existed in the natural soil.
* The operator must revegetate with a cover native to thearea, and must assume responsibility for revegetation forfive years after the last seeding or planting. -An exception is provided for areas of annual precipitation ofless than 26 inches; in these cases, an operator's periodof responsibility is ten years.
* The operator is required to minimize disturbance to thehydrologic balance, and to the quality and quantity ofsurface underground water systems by avoiding acid andtoxic mine drainage, preventing suspended solids fromentering the stream flow, cleaning out and removingtemporary settling and siltation ponds, and preservinghydrologic functions of alluvial valley floors in aridareas of the country.
* Water impoundments are allowed as a part of reclamationif they meet set standards including government safety
19

standards, and if the embankments are graded so as toprovide safe access for water users.
* The operator may mine the top of a mountain without beingrequired to regrade it to its original contour, andmayleave a plateau or rolling slope with no high walls.
* Mining on steep slopes (any slope above 20%) is subjectto strict standards including the prohibition againstplacing spoil (even from the first cut) on the down slopebelow the bench, and a requirement that any high walls beback-filled.
Section 517 establishes that inspections on each surface mining operation are to be carried out no less than once a monthand must be done without notice to the operator. This section alsoplaces tight restrictions on the financial interests any regulatoryauthority the employee may have in coal operations.
Under Section 522, states are required to establish plans todesignate lands where reclamation is not economically or physicallyfeasible as unsuitable for strip mining. Other areas may be sodesignated if:
1. Strip mining would be incompatible with government objectives;
2. The lands are fragile or historic;
3. The site is a natural hazard area where development couldendanger life or property;
4. The area contains renewable resources where'developmentwould result in a loss of long-range productive capacity.
In addition, no strip mining operation will be permitted inthe National Park System, the National Wilderness System, the Wildand Scenic River System, or Custer National Forest. Strip mining
operations will also be prohibited if they will damage lands andwater used by the public, or are within 400 feet of a public roador within 300 feet of an occupied building.
Title VI establishes that federal lands may be declared unsuitable for mining of minerals other than coal if the lands are:
1. Predominantly urban or suburban;
2. Used for residential purposes;
3. Located where mining would damage cultural, scientific,or esthetic values or endanger human life or property.
No land may be so designated if mining operations exist at the timeof enactment of this bill.
20

5.0 IMAGERY ACQUISITION, PROCESSING, AND ANALYSIS
Although three test sites were tentatively selected for investi
gation, southern Clarion County, an area of intensive surface coal
mining activity, was selected as the prime site for this study (see
Figure 1).
5.1 Remote Sensor Program Support
Remote sensor data support to the program was provided by NASA
in the form of Landsat film and computer compatible tapes and small
scale aerial color and color infrared photography.
Aerial photographic support was provided by Ames Research
Center, Moffett Field, California. 1:120,000 scale color photo
graphy and 1:60,000 scale color infrared photography was acquired
from the U-2 platform on 11 April 1975, 23 October 1975, and
19 July 1976. The quality of this photography ranged from fair to
good, and was an invaluable aid to the project.
Landsat-l (formerly known as ERTS, or the Earth Resources
Technology Satellite) launched in July of 1972 was joined by a
second satellite, Landsat-2, in January of 1975. Both satellites
operated at an altitude of approximately 960 kilometers and acquire
four simultaneous images of the Earth's surface with a multispectral
scanner system (MSS). Each of the satellites passes over a par
ticular point on the Earth's surface every 18 days. The orbits
were established such that Landsat-2 passed over a particular point
nine days after Landsat:1. Thus, the two satellites provide repe
titive coverage of a given point about six times every two months.
Each frame of imagery is 100 nm wide and 97 nm long, with a reso
21

lution of approximately 80 meters depending upon the contrast of an
object and its surroundings. A mirror oscillating perpendicular to
the spacecraft's orbital path scans the Earth and the image is
formed six scan lines at a time. Data is acquired in four spectral
bands; two in the infrared and two in the visible image. These
bands are designated by numbers 4, 5, 6, and 7, and scan the approxi
mate spectral ranges of 0.5-0.6, 0.6-0.7, 0.7-0.8, and 0.8-1.1 in.
5.2 Aerial Photography
Photographic coverage of portions of western Pennsylvania were
acquired with the NASA U-2 aircraft in support of this program.
Three flights were made as follows:
Flight No. 75-037B on II April 1975
Flight No. 75-183 on 23 October 1975
Flight No. 76-108 on 19 July 1976
Color and color infrared photography acquired at approximate
scales of 1:125,000 and 1:60,000 respectively, were used as supple
mental "ground truth" in conjunction with field investigations.
The color infrared photography was particularly useful as compared
to color film, not only from the point-of-view of larger scale and
better resolution, but from better scene contrast and vegetational
enhancement.
5.3 Landsat Imagery
The initial evaluation of the Landsat imagery was made on
black-and-white enlargements and color composites of bands 5 (0.6
0.7pm) and 7 (0.8-1.lpm) prepared from 70mm film products. A
22
number of color combinations were tested for interpretability, and
imagery which portrayed surface mine lands in shades of red and
tan, and vegetation in green was deemed the most interpretable
(Figures 6A and 6B). Inequalities in Landsat system response
degrades the quality of much of the imagery to the extent that
scales larger than 1:125,000 are impractical. At a scale of 1:125,000
most mines were visible, but were too small for the manual extraction
of data which could be used by the field inspectors.
Although the potential exists for available Landsat imagery
every nine days, atmospheric conditions adversely affect the quality
of imagery produced. Western Pennsylvania receives about 40 inches
of rainfall per year. This weather is accompanied by extensive
cloudy and hazy periods, resulting in much poor quality or unusable
imagery. Figure 7 is a graph showing the percentage of cloud cover
for imagery of the Clarion County, Pennsylvania area over a two
year period. Only five frames were cloud-free. Although weather
conditions vary from year-to-year, the probability is small for
acquiring adequate Landsat imagery for a monitoring program based
on an update interval of less than one year.
5.4 Computer Processing
The objective for computer processing the Landsat data was to
increase the usable scale and improve the interpretability of the
imagery. Processing Landsat digital data directly from computer
compatible tapes (CCT's) provides two major advantages in eval
uating surface mines which cannot be realized by photographic
processes. First, the digital data provides a means for direct
23

0
0
A
0
B
0
Figure6. Two-band color composite imagesof Landsat frame no. 5072-10571 (30 June 1975)prepared from 7Omm film negatives furnished by the EROS Data Center. Different color combinations were tested to determine which was best for manual interpretation of surface mined lands. The decision of the analysts was that mines portrayed in reddish tones on the green vegetational background, Figure B, was superior to other combinations tested.
24

quantification of surface mines using computer technology. Addi
tionally, digital data can be manipulated by the computer to pro
vide enhanced data to produce photographically processed images for
refined interpretations of the surface mined areas.
Although automatic classification of Landsat data is attrac
tive because of the potential time and cost saving, and some effort
was expended with this objective, the major direction of this
investigation toward production of imagery which would improve the
results of a manual interpretation of surface coal mines. The
processing steps performed for the surface mine investigations
were:
1. Scan line removal;
2. Geometric rectification;
3. Analysis;
4. Enhancement processes;
5. Enlargements.
5.4.1 Scan Line Suppression
A major source of recurring noise seen in much Landsat
imagery consists of a noise effect seen as a sixth line
banding, which results from a difference in sensor gain and
offset voltage. This is evident in Figures 6A and 6B. Since
the Landsat scanner simultaneously acquires six lines of data
from six detectors in each scan, the imbalance is seen as a
six-line phenomena; This effect produces a striped image
which is difficult to interpret, particularly when the area to
be analyzed is spatially small. This effect also "confuses"
26

classification techniques. Computer processing to remove the
majority of this effect vas performed by the computer program
SCANLINE*.
5.4.2 Geometric Rectification
Landsat digital imagery contains several inherent
geometric distortions. The two major distortions affecting
interpretation are: skew introduced by Earth rotation, and
spot size difference between the along-scan direction (57 meters)
and the across-scan direction (79 meters).
Correction of these geometric distortions is performed
by the computer program GEONTRY. GEOMTRY utilizes the LANDSAT
heading and altitude information to calculate a line-dependent
correction for skew and scale. Correction of skew is accom
plished by a calculated line offset and correction of scale by
insertion of averaged lines when necessary. After this pro
cess, images produced from the resulting data are a close
approximation of ancillary data sources, such as quadrangle
maps or rectified aerial photography. The scanline-free
geometrically corrected image provided the base image for the
interpretive analysis.
5.4.3 Data Analysis By Computer
Delineations of the surface mines produced by the
applications scientists, supported with the appropriate ground
truth, were the basis for computer data analysis. The digital
* A proprietary program developed by Earth Satellite Corporation.
27

data were initially displayed as "shade prints" (Figure 8) or
as actual numeric reflectance values (Figure 9). Examination
of these displays over a small area (test site) provides
insight into the digital data character of the surface mines.
Histograms (Figure 10) of the reflectance values of the areas
disturbed by mining allow an examination of the mines to be
made within the context of the scene from which the data is
displayed.
The primary test site was shade printed in band 5 and
count values displayed for the four MSS bands. The histograms
of typical surface mines were produced and examined, and their
reflectance response evaluated manually. Results of the
manual examination showed the surface mines exhibit a high
intensity response inbands 4, 5, and 6, and tended to be of
relatively low intensity in band 7 (Table 1).
Table 1 - Manual Evaluation of the Reflectance of SurfaceCoal Mines Using Numeric Prints (Landsat Frame 2169-15242)
MSS Bands 4 5 6 7
Minimum Gray Value -22 17 43 0 Maximum Gray Value 127 127 127 26
An unsupervised cluster analysis (CLUSTER program) was
used to produce a multi-classed classification not influenced
by interpretive bias. Two broad classes designated 4 and 6
(Table 2) were produced which were readily identifiable as
surface mines and which exhibited spectral signatures similar
to those previously selected from the multi-band analysis.
28

AAAAA
. S-si-3AA
S no=. .. .. . 4
*~.. t~.. . .=AA.~~
...4
.
-A
=A
.......
AAAAM. .4.9.-AA
. t.
FiueB rouin omuesae rnt s apdiagn mtodfr rlmiay
MSSbad o Lndatfrmeno.219-522,th srfcemies n heprmay es stear
feeneswihite ind rmreul fomdife ettes*s#A#of~miig rdnan-eeeai
* $#$$ 1t~~t#~t.z#1129
sesmnto
readily dt.Intissad
~idniibe.Tnldf
__
rito

*"05.233.4.608263Z4 £00202 CLARION CO., PENNSYL0VANIA 524217 3 SC Z961 2960q 259 2950 I9s5 2952 2953 2934 C95 0 22 395 2 999 .. v 6. 3962 964 2565 2966 2962 0965 259a..... 2960 296
811o AI 4 A 3 3 40 3 3 3 1 533 4 3 3 033 24itt It 0*32 33Uj3 It At'6 I t 3 Ai 3I
583 5 4 S 4 55 1 140 3 S 3 '
f4 A 4 11 16. 131. : I 1 ji A ,~
4.I A 1A At 20 34 1t 3i 1065 18512 4 4 4 436 46 3 35s 4
s 4 45 43 34 5 5 4 4 2
5 5A A
63 2
*1 853 3 A A 1±4 U 'A 1 u ti ± 4
A 45 A05 23333 * 8.21 A4 *A 60 64 . 36~ a 3 56 4 2 ta7 1 61 653 6734 6 2 3 1 17 0 4 89A t 11 5 67 25 35 3 32 7 32 7 30 0 6 2 3 3 6
AAA 3 1 3 e* , * , ~ M * 3 3 40 439 3 3 I
32 2 34634 2 2 356 A. 0 !'g o A, 34 is 2 A~ A 9AN5 A 35 43 63 40 4 3 5 30
1164 2 4 35 33 33 3 3 33 33 35 38 33 3+5 3 3 3I6 2 5 08. 2 * 5 314 35 .3 ' 20 29 36 4 40 32S 3 53 4
869 40 39 39 40 33 3 34 l 36 3 3 9 367 *0 46 37 39 39 399 39 30 33 33 3 5 33 30 30 I
40 40 39 39 39 34 9 9 3 9 9 4 6 3 8 33 3A3.3 .. 6 39 '4 9 2 130 4 50 6 S8 2S 20 20 2 8 *3 0 4
A3 344 3 6 3A 3 4 0 6.876 6 0 1 23A0 4a 65 3 3 4. 6. 45 50 68 6
'A 3. 00 331 4' 3 4H 4a4
Z I ~ a 1123 2 4 9,
0s 20 63 33 53 4 a 240 36i 89 1 1 18 9436 31 IS 66 .6 03 364 2 31 9 36 16 38 *2 4 6 3
aI a 32S 4 36 36 34 36 A629 0633 22 30A0 3. 42 39 360.O9I 3 1 3N 6 3.6
332 2P363313028 223 3N0t 4 36 2 '0 A 06 It 31 2 3 3 0 29
35 77 70 6 IN41 372132' 3j :~'S51!30 301 3 5 33 36 . 36 2, 3 3900.1 '1 0 3.423 2 31 9 2 3 3 29 A 29 38 2' 6a 6 3 22 20
a6 0 a9 A 38 28 26 3 2 3 4 398 35
4 ~ 3 82 0 3 1 . 20 3 2 39 33 3
12 20 5 Is 29 36 25 39 1!5 2o S' 0 30 20 0P 06 0I 30 22 3 12 A2 30 30 22I ~
293 Z. z3 A0 219 3 s20 5 23 2 2l 093 313 2 9 33 26 26 35 itA 4 3 0 2 3 2
294 :a 3 14 26 20 3 4 0 26 J. 5Z 6. 1- 5. 2 A 3a 20 A 30 30 2o 04 36 6 0 34 3 26o1 23 3
As A 330 is to
03 9 32 34 36 02 32 3a6 0 0 0 0 3 2 2 1 00 t 1. at38 26 34a9 4 2 36 3 3 34 3 a 3 04 8 46 0 40 291 4
.4 14 34 9 3 0 1000 o4 .9 '12 ± ! " a6 a 66 A 25 39 36 26 3 a Q6
6s Z! 33 24 1 6. 2 0 2 6 4 4 3 2 37 32. 24 79 Sf 1! 2 4:: 63 3I
34, 2. 3. 30 09 A1 6 5 6. 8A0 202 0 IS 9 .a 3 io
O 2 3 76 4 A3 Z. t 0o 26A2 2 20 26 8 9 38 2121 76 28e I S 3 26A, 9 2 8 2 5 I, 24a 3896 30 4 6 A! 26 21 2 2 25 0 12 224 206 8 2 1 300962 40* 3 6 6 28 2 11 Iz 2 0 6 26 2 T2 0
395 7o .. a A 06 6, 06 3 21? 1 i 1 3i.63C 1. El 02 3 2 202 20It t11 i
358 P2 0 o f 1i 'S a. I 31 08U 0t6:1 A961 I21 a o~ 31 3z *3294
A,~Z ~ ~9 9a 3~ Z 2.6 1 9.1 06's 2 1 i 2935 72 20a 22 '5 1!4 22~03 3 2 6 32 20 39s$ 0 8 0 4 2 0 7 7 t5 4 ~ I ~ I
1?2 20 6 0 5 4 4 0 6 59 I r 2 4 044 4 4 20 0a 1 9 252119 I.1; i 1zo 1 H 2
062. ; 2: 25 20 4 266A97 31 24 03 33 A a3 04 61 6 20 3m a0 at 11033099 0. 05 0. 2 0 is 018 2 0 21, 2 al 9460 55 04 06 20 0 2 292 0
roue.Ae o hs uei prin of pie alusfo MS bon 5 o I Ida fae no 216-124 was chsnfrmna vlaio fsraemndln rfetne.Tefub
evauaio isshow inTabe1
6 30i1

i
STRIP MINE AND VICINITY
MSS-' UNPROCESSED DATA HISTOGRAM FRAME NO. 2169-15242
HISTOGRAM (SCALE FACTOR IS 47A33 PIXELSIASTERISK)
4.
.+ >HISTOGRAM TABLE
.f
*
• ,.G( .7
-*,
=' "
*53= *44
~ 2
-i
8qi 444.c
6--1
rl, 21=
MJG(G( 4
1=
I*,,a)=
I 9f( )=
G if
G( 2) G( 163=
Ci14=
G(4 bl
I 7)= G14 19t I=
I4 ?0 =
tC 1= G( 73)=
26
Gt 8I ;( 4i 1th
G
0 G( 3P)=
0 G 1 341=
G{ 3 1=00 GI 391=
21 G( 3 3)= 0 G 1 4)=
I 127J351
2 0 GI 54) =
43=
605 G( 45)= 1 2 f,( 51=
57OCt4.=5bG
3Z.0 G13? 4f) 4C, G1 4A) =~
0 li 41 211 Wi 51) = 344I5 )=4
0SJ i 531 0 G( 351)
13l GP0 I 'b) 0lI 1 4Z3G 3)
7C Gh0 1 ) = 447 0~ .i2)=21 GI .3)1
407 G( 641=
5b1 r( 6 1-
Zb3 A 6701=350 G1 711=
213 G( 70)I 27 G(I L1=
G( 745 2)=
1,1 GI 731=
9 H
S-2 Gil 791= ICJ ,-G17 )
Ct 643i79= 31 01 G0 0 271 G( 311= 243 G 1 87) =
3 q =
21~ G1( 81 21 ;;I 70)=
3o9 1t 91)=
2743 1 721=)13 739) == 153 GI 91z95 1z~
z
16
O
0
"i I
tl
s 1
431 --------- -- C------- --- ---t -7- -3
whichare asscite with the reletac
4*4*31
chrctrstc of coal stimns

TABLE 2 - MEANS AND STANDARD DEVIATIONS FOR EACH CLASS AND SPECTRAL
BAND AS DETERMINED BY THE CLUSTER PROGRAM
MEANS
Band 4 Band 5 Band 6 Band 7
Class 1 17.849 15.554 55.751" 30.772
Class 2 23.328 24.256 54.545 26.616
Class 3 19.469 18.132 43.864 21.807
Class 4 37.119 52.348 62.468 24.323
Class 5 20.456 18.552 64.041 34.612
Class 6 28.825 34.689 44.284 17.029
STANDARD DEVIATIONS
Band 4 Band 5 Band 6 Band 7
Class 1 1.427 .1.984 3.029 2.369
Class 2 1.957 3.788 3.436 2.467
Class 3 2.544 3.717 6.080 4.336
Class 4 3.407 7.898 6.834 3.143
Class 5 2.128 2.783 3.451 2.488
Class 6 2.643 4.801 5.394 3.169
32

The total area affected by surface mining is well portrayed as
shown in Figure 11, but detail within the disturbed area is
not accurately portrayed by the two classes. Compare Figure Il
with Figures 20, 21, and 22. However, the selection by
CLUSTER of these two classes was encouraging evidence that
enhancement through automated techniques is possible.
5.4.4 Data Enhancement
The above data analysis guided the processing of the
Landsat digital data to enhance the detail within the surface
mined areas, with resultant relatively low contrast inthe
remainder of the scene. Three primary computer techniques
were selected: multi-band supervised linear stretch, ratioed
images, and maximum likelihood images.
Figure 12 shows the imaged results of computer pro
cessing with supervised linear stretch on two bands of data
(5 and 7) which were photographically combined to produce a
false color composite. This technique maximizes the gray
levels available for surface mines in each MSS band before
display on the film recorder. These data are combined photo
graphically into a false color composite, then interpreted by
the imagery analysts.
5.4.5 Pseudo-Ratios
Two-band combinations of these data were displayed in a
single image with the program RATIO. This program does not
produce a true ratio, but a result which is obtained from
33

A*4444*44444 444444 5445% b55555 55555S5 b St55555 5 5555555555557777788PsRRsq49999;4%Q$9O0n00000DO0 1111112P2??p 2 3333333333,,4,.s44555555555566b64567n901345&70I?34e6a;135b7 l367h9123&57901345,674Q134%67nQo1234%7b9134
41R4 1111155,IIISI55l5221112255 15 3313111113133133111333?2??2222211133311 133IP 5,31111655551115r355I1555231S52?225555533311111111 2111111111333222'222155111333111111331R46 311123333333111155115555221515222111553331111111 1151111111222522555111333111111331a47 11?2233333??2l I1S%1555s522155522111555133111111 151111111132?222255511333331133333148 222222fl??1l157255s 255556111115515331111111 111111111111111515221113313333311111S49 52255555522115555555555 2 5111]155533311111 1511111115511 55121111111111113331-SO 55555555522211111$55155555955111111555333111111 .11111 11111 5121111111111113331861 62225525?2?11515s552555S555551155115533111111 122 11 S55551111555511531952 222222255%5955S1555552115111111115553 231112 225555511111315111331P53 32P21112?225 5551111152-581551111111115151l3333121 1 255111111333315133185I4 32111112 21q5s511115221115551511111511133333 555111111131111131)55 3155115215555 511111 11511111515111111513333 55511115112322222I 56 1111111215 1 11111llI211115 11111111115133333 1857 12333112215555555522221155S5555 III1533333 1111115111111 2 35111555 552512211 31185$ 332222522222955522232231S1111111113333333 211115S55555552251111859 22222222221655S22?1111111111133333333331 I 1122111115515S55555225S11115160 255 115555255111115511111333333333333111 15 511 121555555211522221861 2255561115I11111111551513333111113111112 11255113?? 2225552231115111862 55111551111111111115133333311111111311; 315511221551111863 555551555111111113333333111111151111 "A51864 1155559551111111133311311111 2211515 5 22221533255551A65 111155511111333111131111; ills22222213222211R66 1111555111113333111111311 1222522U232222211867 111111111333333111115551 12 22225552222225512221868 111113333331311111122251 15122222111215551221869 133333333111111111 's 2 5 51133222333311155555170 33331111111111111;1871 555513222333312222 5§55?21111]111 22221133151113325551
1872 115551515511111111873 II15555555511111111 313322222151325555132123331132552221874 1111311555111585151 .213122?2211
1875 333333331555I55S1qS 15 2125211876 3333333331555155151155 "252325225521877 233333233333 551111111 5 5555552878 233325332 1151521555525551879 555555222 551155515231880 5555555552 255251222331 PO1555555 S1I
13315I1A86 5555552 3351883 5555233210845511I2322 2511885 222222223 11 222211886 2233333222 123 1122221887 22 233322211311 32 3 111 25521221888 Z222222212??? 2227222 5552- ?Sri3121889 22222222111112 22 5 1151 331111890 222222225115111 222 152 1111 2333 5-1891 222722255555111 22?2 55511 112255551551892259555552255P22 222222 2512 111112221511221893 125555555222222 32222159515 11551111 1 123251111511894 22222222222? 22222559511 23311113 255515552221A95 2222221 226 - 222P2221551111 13333131111 33323 IP96 222?225552P2 2332?2222,221511] 1333311 2222222222P? 1897 222?225522?222222222222555111j 111111131 2222552222318-8 222 222222225222 22111 311111133 1 22222222211899 3 !25556552 S111311113 5 1122222?221119002 2111311 125525555 101 22 2222551 2111 15555551123 211Q222522 255255' 5555 111151Q03 55555555522955 - 2222 1Q04 22225555152255 ?22311Il 3115221905 22 ?5S555S5Sll513 113 It 2115111907 ?27?555511155132? 222221906 2222225111115522 21112 55132 1S2262225222332
1908 5S5S1l11155p 11 12225523f1909 55555115555 55112 22 5523 33 ?7 22112122221Q10 51555115565 ;5511112332 55122 IF L 25551? 1 2622232 1911 555515555 s;S52155236 555 51 32325555 15 2222191? 21111111551 ?32255551115132?2 11 513 32S5S M 2222
Figure 11. This assignment map represents an unsupervised cluster analysis clasification of the surface mined lands and tet area of southern Clarion County. Classes 4 and 6 effectively outline the majority of the lands affected bysurface mining. Compare this illustration with Figure. 20 and 21.
34

itraQDUCIBllAfl OF TME POOR* tnbl&LPAGE W8
Figure 12. Color composites of computer enhanced Landsat date (MSS bands 5 and 7 of frame Darker red ares are newly
no. 2169-15242) has maximized the tonal detail within the mined are.
mined. The lighter areas have been fertilized and reseeded. The greenish arees indicate degrees of The general background of
revegetation; the darker the green color, the more dense the vegetation.
dark green indicates undisturbed land or completely revegetated mined lands.
35

processing the two-dimensional data matrix (Figure 13) and
constructing a look-up matrix which is data dependent. This
technique transforms the ratio data into an output range of 0
255 counts for display on a film recorder.
5.4.6 Maximum Likelihood
Although the emphasis in this investigation was on
manual interpretation, a maximum likelihood subroutine of
EarthSat's ratio program was tested on the mined land data.
This subroutine was designed to calculate output gray values
as a function of:
1. Input gray values Gi and G2 from two MSS bands; and
2. Class statistics from CLUSTER analysis.
The success of this procedure was limited and no thorough
investigation was made of alternate means of calculation or
of possible adjustments to the probability algorithm. The
principal problems encountered on the final photographic
products generated by the maximum likelihQod (MLH) ratio
routine involve upper class confusion, errors of commission,
and an overall salt-and-pepper image quality which did not
highlight satisfactorily the active surface mined areas.
In its present configuration, the MLH algorithm is
dependent on the statistical inputs generated by the CLUSTER
program. Spectral classes delimited during the clustering
procedure (Figure 14) and their associated means standard
deviations, variances, and co-variances were used in the
calculation of parameters for probability functions in the MLH
36

7 LANDSAT FRAME NO, 2169-15242
BAND 6 BAND 6•'
*1 I
=L •"1 I
I I
lul - II11 I II 1| 1 1tI ]| l
. . . . . . . . . . . . . . . . . . . . . . .
Figure 13. Two-band (MSS-5/MSS-6) histograms were processed to produce a look-up matrix table, Subse. quent processing with maximum likelihood identified a subset WFigure IS) of this matrix which has the highest probability of representing strip mines.
37

00
0 0.
I
I I I I
t0I
10 20 30 40 ASSJ(MiENT PPOJECTI0N
s0 0 70 VD 90
I
S
%Ss S
S 55
SS
00
40!
SSS
1 SA22 2 2
1 1 P?2 22 ;2
liI ;pp 7 2,
11* 7 P; 2 : .
01 3 1 3
3 1 31 33
eo0+ 33 A+ 3 3
70* 3
338
33

'C 11l111liIll''', I I' l ITT T'l l i l]!l. l1''4rt <I. ll ll It ill TlliT
A- ........ if 11
.~. .. Ii. i. , ' .i .i. . . 1 I I £' 1 1 t 1 I I
l'll l~l ll~~l!! l ll ll itll~ l~~ i l ll l ]llll ll l
MSS BAND 5
Figure 15. Two-space (MSS bands 5 and 6) surface mine reflectance distribution plot derived using class statistics extracted by CLUSTER and produced by a maximum likelihood algorithm. Each "non-i" data point represents a band combination which is displayed in the resulting image.
40
0 20 40 60 80 100 120 140 160 ISO
¢-9
* MSS 5I 5486-14400
.. ix
a.00 I 1
f9 o.
0 20 4060 0 20 10 16 S
I0406080 4 44X 10 2014 10.8
0I A
pro to img nagmn.Fgr stehsormatrprcsigt Xdgtlelreet ohhso
* BAND 5
~4 1
*41

5.5 Imagery Interpretation and Analysis
The initial analysis of the surface mined land in the test
area was from 1:125,000 scale CIR aerial photography. A map
showing the aerial extent and distribution of mined land was pre
pared at a scale of 1:62,500 and submitted to the Pennsylvania
Department of Environmental Resources for evaluation. Figure 17 is
a reduced scale version of this map. After evaluation, the State
judged the map to be of no utility in the implementation of their
mining legislation.
Emphasis was then given to larger scale, more detailed mapping
from both aerial photography and Landsat imagery. Tests were
initially conducted on 1975 Landsat scenes; but with the acquisi
tion of good quality aerial photography on July 19, 1976 and cloud
free Landsat imagery only one month later on August 17, 1976 (frame
#5486-14400) computer data processing was shifted to this scene. A
series of processing techniques, as described in Section 5.4, were
tested to produce useful imagery at a scale of 1:24,000.
The Landsat numeric data were manually evaluated to identify
the spectral range within each band that was associated with strip
mine areas. Once the spectral range was identified, these Landsat
data were linearly stretched across the 255 gray values of the
output device (OPTRONICS) to provide maximum tonal discrimination
within the mined lands. Although black-and-white prints were made
and interpreted, two color composites from MSS bands 5 and 7 pro
vided substantially more information.
A problem in producing extreme enlargements of Landsat data is
the deterioration of the photographic image quality. Figure 18 is
42

71p45' 71P 30, 7V I5'
41'I' - - -0 'MSis E.LI.ON ,
LEGEN4D O ON - -....... -i- L
A
I ( SURFACE MINING DISTURBANCEUNDISTURBED AREA WITHIN A
SURFACE MINING DISTURBANCE I
&MINING DISTURBANCES INTIMATELY0 MIXED WITH UNDISTURBED AREAS %
DISTURBED AREAASSOCIATED WITH Mi COAL PROCESSINGACTIVITY
CLARIONU S.G.S 7%WOUADRANGLE C71 4
Q e I
00,dn -'PRIMM,-4, Itqn.['T5-v 7 -If
I rx
2,4~~f 74.
SCALE1'125,000
Figure 17. Surface mined land disturbance Inventory of southern Clarion County, Pennsylvania prepared from the interpretation of 1:125,000scale aerial photography flown by NASA-Ames Research Center on 22 Februa ry and 11 Apr1, 1975. The original scale of the map was 1:62,500.
0

an example of such an image enlarged to 1:24,000 scale. Each pixel
was originally reproduced on a film recorder with a lO0m spot size
for a negative scale of approximately 1:550,000. This image re
quired a 23x photographic enlargement to attain the desired scale.
Although useful information is present, the blurred image intro
duces uncertainty in delineation of tonal boundaries. To improve
image quality by reducing the photographic enlargement requirement,
the computer enlargement algorithm discussed in Section 5.4.7 was
used to produce a 2x computer enlargement. This reduced the photo
graphic enlarging requirement to about 12.5x. The resulting image
is shown in Figure 19 at a scale of approximately 1:31,000. Although
a substantial improvement over Figure 18, this image is neither
sharp nor esthetically pleasing.
The computer processing was incremented a step further to make
a 4x digital enlargement, thus producing 16 pixel units for each
original Landsat pixel. To produce a 1:24,000 scale image from
this Landsat data, only a 6x photographic enlargement was required.
The results were both valid and pictorially crisp as is illustrated
in Figure 20.
The image interpretation and analysis of the Landsat imagery
was "validated" by ground truth obtained by visits to the test site
and by interpretation and analysis of the aerial photography.
Figure 21 is an example of the 1:60,000 scale color infrared photo
graphy enlarged to 1:24,000.
To insure accuracyin measurements both area delineations and
land classification, high-altitude (1:125,000 scale) color stereo
scopic photography acquired by NASA on July 19, 1976, was used to
44

Figure 18. To produce this Landsat image (no. 548614400) at 1:24,00 scale, required a 23X photographic enlargement of the computer generated film image. Although considerable mined land detail is discernible, the image is generally unsatisfactory.
45

pixels for each original pixel has reduced Computer enlargement by generating four new AlthoughFigure 19. 1:24,000 scale image.
the photographic enlargement requirement to 125X to produce a
the image provides much information concerning mined lands, attempts were made to improve
image quality.
p 0G T13 ?46

OF lTow'~pgRODUCIBILITY uORJNAJL PAGE 3B M

0
J1)UwolibWjjfy OF TER
ORIGNAL PAGE IS POOR
0 MMUM ..... ..... .................. ............
. .. .. .. ... .. ...
. . ........

anomalous color tones occurred in some portions of the mined area
shown on Landsat that were later identified as active mining
operations, haul roads, and reclamation practices. These acti
vities were not uniform reflectances throughout the study area, so
consequently could not be reliably categorized.
The color composite images were subdivided into five separate
areas conforming to the subdivisions of the mined area on the
aerial photograph and planimetered - separately and then as a total
configuration. These measurements were compared to those taken
from the aerial photograph and the differences were considered
"Landsat error." The ratioed images were only planimetered as
total mined area due to the lack of internal detail.
A regression and correlation analysis was performed on the
results to determine whether the size of the disturbed area in
fluenced the amount of error that occurred inthe Landsat/aerial
photograph comparison, and whether the amount of error was pre
dictable. Inthis analysis, the size of the mined land (inhec
tares) was plotted on the X axis as the independent variable; the
"Landsat error" (inhectares) was plotted on the Y axis as the
dependent variable. Itwas supposed that the amount of error would
decrease as the size of the mined area increased, yielding a re
verse or negative correlation. Itwas also hoped that one method
of computer enhancement would prove to yield superior accuracy.
However, the results of this analysis (Table 3)were.incon
clusive. The five subdivisions ranged insize from 141.7 hectares
to 610.9 hectares. The regression coefficients were (-.03), (
.03), and (-.01) for the Ix,2x, and 4x enlargements, respectively.
The average percent errors for the three enlargements were 5.9%,50

6.8%, and 5.6% for the lx, 2x, and 4x enlargements.
TABLE 3
Results of Correlation - Regression Analysis
LANDSATEnlargement Regression Standard Average
Process Coefficient Error (ha) Error
lx (-.03) 2.3 5.9%2x (-.03) 14.3 6.8%4x (-.01) 9.4 5.6%
The results of the total disturbed area measurements yielded
more positive results (Table 4). The lx enlargement showed a 3.3%
error; 2x showed .6%, 4x showed .2%and the 5/6 and 5/7 ratios
showed .6%and 1.5% errors, respectively.
The lx and 2x digital enlargements proved to be unsatisfactory
for internal classification except for large homogeneous areas with
uniform spectral reflectances. The 4x enlargement, however, was
satisfactory for internal classification. Mined land detail that
was not apparent on the other enlargements was easily discernible
with the 4x enlargement.
Precise boundary line placement and interpretation from
Landsat is not possible due to the resolution capabilities of the
Landsat MSS which has an instantaneous field-of-view (IFOV) of an
area 57 meters by 79 meters (about .5ha). Individual pixel values
will be an average of all the separate reflectances from the ground
within the IFOV. Therefore, detailed and absolute line placement
will rarely correspond exactly with what is seen from an aerial
51

TABLE 4 - RESULTS-OF STATISTICAL ANALYSIS OF AREA DELINEATION
Mine #1 Mine h2 Mine #3
Image Type
Area (ha)
Error (ha)
Percent Error
Area (ha)
Error (ha)
Percent Error
Area (ha)
Error (ha)
Percent Error
Aerial Photo
lx Enlargement 2x Enlargement 4x Enlargement
141.7
160.6 144.6 167.7
19 3
.26
13.4 2
18.3
506
509.4 466.2 503.8
3.4 89.8
2.2
.7 7.9
.5
610.9
615 611.2
594.1
4.8 .3
16.5
.7
.1
2.7
Mine #4 Mine #5 Total Mined Land
rype Image Area
(ha) Error (ha)
Percent Error
Area (ha)
Error (ha)
Percent Error
Area (ha)
Error (ha)
Percent Error
Aerial Photo 173.3 Ix Enlargement 190 16.8 2x Enlargement 161.4 12 4x Enlargement 169.2 4.1 5/6 Ratio** 5/7 Ratio**
+ Hectare * Area of mines 1-4 only
** Measured only for total mined land
9.6 7.0 2.3
229.4 240.9 268.4
11.5 39
(Not Measured)
5 17.1
1661.2 1715.8 1651.9 1431.9* 1651.5 1686.1
54.6 9.3
, 3.8 9.7
24.9
3.3 .6 .2 .6 1.5

photograph. In spite of these limitations, however, it is possible
to place boundaries that indicate the extent of differences within
the mines, if not their exact shape and area. A comparison between
the mined land overlays from Landsat imagery and the color infrared
photography will demonstrate that generally the classification of
the Landsat image follows the pattern of classification of the
aerial photograph. There are actually very few omissions of detail
on the x Landsat enlargement when compared to the U-2 photograph.
Most of these (see Figure 20, overlay-omissions) are areas of
partial vegetation (B)and are smaller than five hectares each.
There are several cases of misidentification that can be found when
comparing the dominant designators of the two images. These in
correctly designated areas range in size from about 21 ha to about
3 ha. However, since strictly manual interpretation was employed,
most of these errors can be traced to the interpreter's subjec
tivity in identifying dominant tonal characteristics, and should
easily be minimized with experience with the local mining practices
and landscape.
To test the accuracy of the internal classification, overlays
of the study area from Landsat and the aerial photography were
compared for similarities in classification. This is illustrated
on Figure 21 with overlays A and By/. Due to the aforementioned
differences in the two remote sensing systems, exact boundary
matches were not sought out. Instead, trends and overall config-
This is not a rectified photograph and the Landsat interpretation overlaymay require slight shifting for the best fit.
53

urations that approximated one another and were comparable were the
goals of the study.
Areas on the 4x enlargement that generally matched similar
areas on the aerial photography were considered as accurate delineations
even though their outlines did not necessarily match exactly. When
the two overlays were compared, dominant categories that did not
match their counterparts were indicated on the Landsat overlay (B)
as an error. In numerous instances, the corresponding category was
a secondary one in a combination. When this occurred, the error
was considered as an "explained error" - meaning that the desired
category was imaged on Landsat, but other factors caused it to be
listed as a secondary category rather than a primary one. If the
desired category had not been interpreted at all, the error was
considered an "unexplained error."
Using this approach, a study of the vegetated categories (A
and B) within the mined area was conducted. A "total error" (determined
by combining explained and unexplained errors) of 5.8% of this
total could be explained by subjective reasons, because the vegetation
categories were imaged on Landsat as subordinate to some non
vegetated category., The "unexplained error" or totally incorrect
Landsat interpretation was only 3% of the total mined area studied
for this phase.
The same procedure was then applied to the dark spoil category
(D)with similar results. The total error was 12.2% of the area
but the unexplained error was only 5.5%.
54

Anderson and others (1975) in conducting automated imagery
analysis of surface mined lands in Maryland, found that the best
delineation of total mined lands was obtained with a MSS 5/MSS 6
ratio. To test this observation on mined lands in Pennsylvania,
MSS 5/MSS 6 and MSS 5/MSS 7 ratios (Section 5.4.5) were made. The
resulting images shown in Figure 22 confirm Anderson's observa
tions. The MSS 5/MSS 6 ratio portrays total disturbed lands in
sharp contrast to the background area. It is apparent, however,
that any farmland not densely vegetated would also be portrayed as
mined lands. The MSS 5/MSS 7 ratio shows some tonal detail within
the disturbed areas which can be correlated with stages of reclamation.
The boundary between mined lands and non-mined lands, however, is
in places indistinct creating areas of arbitrary decision in boun
dary placement.
55

0i i iiiii iiiiiiii~~~~~!ii =,,ii
Figure 22. The ratloing of MSS bonds 5/6, Image A, renders the strip mined areas in sharp contrast to the surrounding* vegetated a. Image B is a ratloed image of MSS bands 517. In this scene, there is more detail and tonal variation
within the mined areas, but also more contusion as to the mined land boundaries. For identifying total disturbed lands, the 5/6 ratio is superior.
56

2. Older, probably graded and reseeded land.
3. Partially revegetated.
As the vegetational growth covers the mine lands and as plant cover
increases, the mined lands blend with the undisturbed lands and become
unrecognizable.
No meaningful judgments are possible from the Landsat imagery as to
existing water quality or potential water quality problem areas.
A statistical evaluation of the significance of the area size to
the reliability of interpretation indicates that, although the regression
coefficients derived are not significant, the error in using Landsat to
determine the size of the mine tends to decrease as the size of the
mine increases. Furthermore, the relative accuracies in measurements of
the total mined areas tends to support this contention. It was not
determined, however, if there is or is not a particular size for the
mined area that will yield optimum results.
There does not seem to be any superior computer enhancement for
accurate area measurements based on this study. Although the 4x com
puter enlargement reflects the lowest percent error for the total dis
turbed area (2%) and the lowest mean percent error for the five sub
divisions (5.6%), the sample size is statistically too small to draw
valid conclusions.
The close similarity between the Landsat and CIR air photointer
pretation (as shown in Figure 21) demonstrates that there is potentially
useful information about surface mining obtainable from Landsat imagery.
However, meetings with Pennsylvania Department of Environmental Resources
during and near the end of this project failed to identify any appli
cation which would aid the state in implementing mining laws.
58

7.0 COSTS AND BENEFITS
Portions of four Landsat frames will provide complete coverage of
the bituminous coal area. Computer compatible tapes (CCT) can be ac
quired at the nominal cost of $1,000. Reliable costs for the production
of 1:24,000 imagery similar to that shown in Figure 20 are more diffi
cult to determine. It is, in part, dependent upon whether the State or
organization has, or prefers to develop, the in-house capability for the
appropriate computer processing, image print-out, and color photographic
laboratory facilities necessary to produce the enhanced, two-color,
Landsat image enlargements.
Initial capital costs could range from $50,000 to $500,000. A
staff of two to four technical personnel qualified in computer and
photographic processing would be required. If a regional inventory of
mined lands using Landsat imagery is performed on an annual basis, this
staff would be fully dedicated to his effort for only two to six weeks.
Commercial facilities for the necessary computer processing and photo
graphic image production are limited, and rates may differ substantially.
Earth Satellite Corporation's rates for the processing of imagery with
the algorithms used to produce Figure 20 are probably representative.
They are based on materials, labor, and CPU time. Assuming portions 'of
four Landsat frames must be processed, the cost to produce computer
enlarged, black-and-white negatives of MSS bands 5 and 7 would be
approximately $20,000.
Two-band color photographic processing of Landsat data of the
bituminous coal field area of Pennsylvania at a scale of 1:24,000, not
area-matched to 7-1/2 minute quadrangle sheets, would be approximately
$15,000.
59

Once the imagery is processed, a staff of qualified image inter
preters is required to extract the desired information from the imagery.
The analysts should be knowledgeable in surface mining and reclamation
procedures and have access to current "spot" photography for verifi
cation purposes or be permitted to make "field checks" periodically.
The number of analysts required will be dependent upon the State's
requirements on timeliness of the data. Annually updating a mine land
inventory in western Pennsylvania would require, at a minimum, the full
time services of two image analysts. If State requirements dictate the
inventory be completed in shorter time periods, the interpretation staff
must be increased appropriately. Salaries for two analysts are estimated
at $25,000 to $35,000 per year, and associated costs for field trips are
estimated at $3,000.S
The imagery interpretation by consulting firms would require com
parable time intervals at costs approximately double to triple these
above-labor costs.
The acquisition costs of aerial photography are reasonably well
established and reliable budgetary estimates can be developed. The
square mile costs of aerial photography, however, are influenced by
image scale (a function of flying height and camera-lens system) and
general weather conditions which normally prevail within the area of
interest.
Two options are open to a state if there is no state-owned aerial
photographing capability. These are commercial firms and NASA. Al
though commercial prices will vary somewhat, costs for 1:60,000 scale
color infrared (CIR) / stereoscopic photography will range from about
For small scale aerial photography, color infrared film is recommended..
60

$5.00 to $6.00 per square mile. NASA currently quotes U-2 flying ser
vices at $2,900 per hour. If the U-2 aircraft is on site, 1:60,000
scale photographic coverage of large areas can be acquired for about
$3.50 per square mile.A/ If the aircraft must mobilize to the East
Coast from California (the home base), and all mob-demob costs are
applied to a single project, an additional $15,000 must be pro-rated to
total costs. For the 14,000 square miles of the Pennsylvania bituminous
coal area, this would increase costs by at least $1.00 per square mile.
Thus, 1:60,000 CIR photographic coverage of the area acquired with the
U-2 aircraft may cost as much as $65,000. Unless large areas are flown,
commercial firms may be more economical.
If the surface mined land inventory and assessment is made using
1:60,000 scale, stereoscopic, aerial photography, such as represented in
Figure 21, imagery acquisition costs will be nearly twice that of using
Landsat imagery. However, the resolution of the photography will be on
the order of 3 meters (iofeet) as compared to 80 meters (262 feet) for
Landsat. Consequently, the information derived from the aerial photo
graphy will be more detailed and reliable. Analysis time for the photo
graphy will be higher than for the satellite imagery unless the detail
of mapping is held to a comparable level. The production of a large
quantity of photographic enlargements is not essential, as the inter
pretation can be plotted directly onto quadrangle maps with appropriate
optical-mechanical plotting equipment. Depending upon the sophisti
cation of the equipment acquired, costs can range from $10,000 to $50,000
each.
2/ If the required level of detail of the photographic analysis is nothigh, 1:120,000 scale photography may be adequate and acquisitioncosts may be reduced by half. 61

Table 5 summarizes the costs estimated for making a mined land
inventory of western Pennsylvania.
These costs must be evaluated with the benefits derived. The maps
produced will identify the areal extent and geographic distribution of
surface mines, plus estimates of the status of reclamation of the dis
turbed lands. No water quality information can be derived from the
Landsat data, and only gross water pollution problems can be observed on
the small aerial photography. Comparisons of the imagery on an annual
basis will reveal changes in the concentration of mining activities and
the progress, or lack thereof, of successful reclamation.
In the final analysis, it is the potential user that must evaluate
the utility of the data for his activities. Without consideration to
the cost of systematically mapping the bituminous coal region of the
Commonwealth, the Pennsylvania Department of Environmental Resources
could find little benefit or use for the type of information obtainable
from either aerial photography or Landsat imagery.
62

TABLE 5 - COST ESTIMATES OF CONDUCTING A SURFACE MINED LAND INVENTORYWITH LANDSAT IMAGERY OR AERIAL PHOTOGRAPHY
LANDSAT Aerial Photography
In-Housel/ Commercial Firm In-House!i Commercial Firm
Imagery Acquired $ 1,000 $20,000-$40,000?/ $70,000-$84,000
Processing $ 25/000/ $ 35,000
Technicians (Photographicand Computer) $5,000-$8,000
Capital Equipment Costs $50,000-$500,000 - $1,000-$50,000
Photointerpreters Draftsmen
$30,000 $25,000
$150,000 -
$45,000$25,000
$200,000
Misc. Costs $ 5,000 $ 5,000
1/ Facility costs are not included.
2/ This figure isonly an estimate. Actual costs depend upon how the State accountsfor operational expenses.
3/ Itcan be assumed that due to the limited requirement for this staff, they will beused on other programs and the salary costs distributed accordingly.

8.0 CONCLUSIONS AND RECOMMENDATIONS
The use of Landsat data by field inspectors in the routine im
plementation of Pennsylvania's mining laws is not practical due to the
poor resolution of the imagery and the delays in data delivery and in
terpretation. However, such imagery can provide a record of the status
of disturbance of surface lands at an instant in time; a record which
may be valuable at the state or federal level.
The monitoring required for enforcement of surface mining regu
lations may be considered to occur at two levels: detailed observations
of the mining procedures by field inspectors in their daily activities,
and the regional overview at the headquarters level.
The potential utility of remote sensing to aid in the operations at
these two levels is varied. The field inspector cannot be eliminated;
therefore, remote sensor data can only be used to make his efforts more
efficient and effective. Many of the observations made by the inspec
tors are detailed, and could only be complimented by high resolution
imagery (+ 1 foot). The conditions within an area disturbed by mining
are continuously changing; thus, current information is necessary for
most monitoring requirements. It is only in those areas where the
observations are less time dependent that remote sensing will be of
the most value. From the standpoint of the field inspector, the use
fulness of remote sensing is largely limited to assuring that mining is
confined within the permitted area, that grading is done to the appro
priate contour, and that revegetation is progressing suitably.
The resolution of Landsat imagery limits the judgments that can be
made relating to any of these above-mentioned phases of mining. Aerial
photography, even at a relatively small scale (e.g., 1:60,000), can be
64

of considerable utility in these functions, but the cost of acquiring
and interpreting the imagery precludes most states from using it to
supporting their field inspectors.
At the Bureau level, where the regional aspects of the status of
surface mining lend themselves to the use of remote sensing techniques,
both Landsat and aerial photography have greater potential application.
Landsat imagery can provideestimates for total disturbed lands to
approximately 95% accuracy in areas such as western Pennsylvania.
General assessments can be made as to the amount of vegetation cover,
and when the interpretations made are compared on a periodic basis, the
lack of reclamation progress can be detected. The use of Landsat data
for such evaluations in western Pennsylvania is not practical on less
than a yearly basis because of the limited quantity of cloud-free imagery
that would be available. Also, data processing and analysis by manual
interpretation methods do not appear economically favorable.
The quantity and level of detail of information available from
small scale aerial photography is substantially greater than from Landsat
imagery, but the cost for acquisition and interpretation are also
greater.
If the federal strip mining legislation is passed, there are several
instances in which a mined land inventory with aerial photography will
be valuable. It is easy to identify "orphan" or old, unreclaimed mined
areas, with small scale to medium scale photography. Title IVof the
House Bill establishes that some lands may be declared unsuitable for
mining for several reasons, but only if mining does not exist in those
areas at the time of the enactment of the bill. Stereoscopic aerial
photography acquired onor about the date would document mining status.
65

An interpretation and evaluation made from this photography would pro
vide the most practical means to determine those areas that should be
declared unsuitable for mining. Also, aerial photography can be of
great value in the assessment of potential hydrological impacts re
sulting from mining.
The major conclusions of this study are:
-Cost of processing Landsat data to a scale usable for manualinterpretation is comparatively high.
o Landsat imagery can be used to periodically update mined land
inventory maps if accuracies of areal measurements of about95% are acceptable.
* The resolution of Landsat imagery makes it marginally usefulfor monitoring the status of surface mine lands and areaswhere mines are of small areal extent and where intricateboundaries exist.
Weather conditions in western Pennsylvania are such thatusable Landsat data is normally obtained only in summer andfall seasons.
Timeliness of Landsat data is critical to its utility. Information only a few days old is greatly diminished in value formany applications.
Aerial photography provides higher resolution imagery thanLandsat but acquisition and interpretation costs are higher.
Aerial photography can be of particular utility in implementing several phases of the federal legislation now underconsideration.
The results of this investigation indicate that although useful
information about surface mining activities can be derived from Landsat
imagery, the utility is diminished by the extended time interval between
imagery acquisition and delivery of interpretation results to the final
user. Efforts should be made to reduce both the time period of delivery
66

of CCT's and the interpretation. The latter should be most readily
accomplished by automated or semi-automated data interpretation systems
equipped with a interactive video display. Improvements in the reso
lution of satellite systems will improve the potential utility of data;
however, it is doubtful that the planned 30-meter resolution of Landsat-
D will greatly improve the usefulness of the resulting imagery to the
field inspectors.
The assessment of this investigator is that the combination of
image resolution, timeliness of the information, and data acquisition
and interpretation costs largely preclude the use of current remote
sensor technology from routine implementation of mining laws in Pennsylvania
or other states: However, the inventory and evaluation of surface mine
lands can be done effectively on an annual basis if the utility of the
information will be of economic benefit to the State.
67

9.0 NEW TECHNOLOGY
No new technology reportable items were made during the perfor
mance of work under this contract.
68

10.0 REFERENCES
Anderson, A., Schultz, D., and Buchman, N., 1975, Landsat inventory ofsurface-mined areas using extendible digital techniques: Proc.NASA Earth Resources Survey Sym., v. I-A. Houston, Texas.
Hammond, E.H., 1964, Classes of land surface form. Sheet No. 62 inNati. Atlas of the U.S. of A.: U.S. Geological Surv. 1970.
Mikva, Hon. A.J., 1977, Fact sheet no. 95-6, Democratic Study Group:U.S. House of Representatives, Washington, D.C.
Rogers, R.H., and others, 1973, Automated strip-mine and reclamationmapping from ERTS: Third Earth Resources Technology Satellite-iSymposium, V.1, sec. B, Washington, D.C., p. 1519-1531.
Sweet, D.C., and others, 1973, Significant applications of ERTS-l datato resource management activities'at the state level in Ohio:Third Earth Resources Technology of Satellite-I Symposium, V.1,,sec. B, Washington, D.C., p. 1533-1557.
Wier, C.E., and others, 1974, Application of ERTS-I imagery to fracturerelated'mine safety hazards in the coal mining industry: Finalreport for NASA contract NAS5-21795, ERTS Program Office, GoddardSpace Flight Center, Greenbelt, Maryland.
, 1975, Application of EREP imagery to fracture-related minesafety hazards in coal mining and mining environmental problems inIndiana: Final report for NASA Contract NAS9-13358, Skylab PrincipalInvestigations Management Office, Lyndon B. Johnson Space Center,
niicnn Tvync
69