0 copertina
318
Transcript of 0 copertina

LIGURIA
PIEMONTE
30 4 721
TRENTINO
22
LOMBARDIA
36 1746FRIULI VENEZIA
GIULIA
52
VENETO
12 1123
EMILIA ROMAGNA
19 814
TOSCANA
3 151217
UMBRIA
1 41
3 66
MOLISE
2
PUGLIA
9 1622
BASILICATA
12
CALABRIA
916
SICILIA
38 945
7 226CAMPANIA
11
32 1621
68
1
31
BANCA CARIGE
LIGURIA
203 42
PIEDMONT
31 4 621
VAL D’AOSTA
1TRENTINO
22
LOMBARDY
36 2241FRIULI VENEZIA
GIULIA
52
VENETO
12 1222
EMILIA ROMAGNA
19 914
TUSCANY
3 52219
UMBRIA
1 41
MARCHES
2 66
MOLISE
2
APULIA
9 1226
BASILICATA
12
CALABRIA
1016
SICILY
38 945
SARDINIA
7 325CAMPANIA
10LATIUM
32 1621
ABRUZZI
68
1
31
CASSA di RISPARMIO di SAVONA
BANCA del MONTE di LUCCA
CASSA di RISPARMIO di CARRARA
ASSURBANCA (*)
CARIGE ASSICURAZIONI & CARIGE VITA NUOVA
46
19
299
131
33
393
BRANCHES AND AGENTS
2 14
(*) Insurance offices qualified for the sale of banking products. In the cities where insurance offices are alsopresent, the symbol comprises Assurbanca and insurances.
1
ANNUAL REPORT2003
This document has been translated from that issued in Italy from the Italianinto the English language solely for the convenience of international readers.
BANCA CARIGE GROUP

2
DIRECTORS, STATUTORY AUDITORS,MANAGEMENT AND AUDIT FIRM
BOARD OF BOARD OF GENERAL MANAGEMENT STAFFDIRECTORS STATUTORY
AUDITORSMANAGEMENT STRUCTURES
CommercialCHAIRMAN CHAIRMAN GENERAL Luigi Gardelli Public
MANAGER RelationsGiovanni Berneschi * Fulvio Rosina District of Liguria E. P. Molinari
Alfredo Sanguinetto Armando RemuzziDEPUTY CHAIRMAN AUDITORS Internal Auditing
DEPUTY GENERAL Other Districts Armando BottoAlessandro Scajola* Antonio Semeria MANAGER Mario Cavanna
Andrea Traverso (Resources) Planning &DIRECTORS Finance Research and
DEPUTY AUDITORS Carlo Arzani Giacomo Burro ManagementAdalberto Alberici * ControlPiergiorgio Alberti ** Adriano Lunardi DEPUTY GENERAL Loans Department Ennio La MonicaAndrea Baldini* Massimo Scotton MANAGER Riccio Da PassanoGiorgio Binda (Administration)Jean-Jacques Bonnaud Credit collection AUDITLuca Bonsignore Giovanni Poggio and litigation FIRMMario Capelli * Giuseppe PuntaRemo Angelo Checconi DEPUTY GENERAL Deloitte &Maurizio Fazzari MANAGER Information- Touche SpAPietro Isnardi (Commercial) CommunicationFerdinando Menconi TechnologyPaolo Cesare Odone * Achille Tori Giorgio SeronelloVincenzo RoppoEnrico Maria Scerni* OrganisationFrancesco Taranto Benedetto FrixioneOliviero Tarolli
Human ResourcesSergio Donegà
Accounting & ServicesMario Venturino
Accounting* Member of Executive Committe Mario De Negri** Senior Director
General & LegalSupportGiacomo Ottonello
Technical and BursaryLorenzo La Terra
The Board of Directors was appointed by the Ordinary Shareholders Meeting of 31st March 2003 for the businessyears 2003, 2004 and 2005.The Executive Committee was appointed by the Board of Directors on 14th April 2003 until 31st October 2004.The Bank's structural and organizational order was approved by the Board of Directors on 14th January 2000 andwas subsequently modified by the General Manager, within the delegation to the same one conferred on 9th
December 2003.The Board of Statutory Auditors was appointed by the Ordinary Shareholders Meeting of 29th April 2002 for thebusiness years 2002, 2003 and 2004.The external auditors were appointed by the Ordinary Shareholders Meeting of 31st March 2003 for the businessyears 2003, 2004 and 2005.

3
POWERS OF THE ADMINISTRATIVE BODIESAND THEIR DELEGATED AUTHORITY
As required by directive no. 97001574 of CONSOB dated 20th February 1997 shown below are the powers anddelegated authority belonging to the Directors and Management.
Chairman of the Board of Directors
According to article 24 of the By-laws the Chairman of the Board of Directors is the legal representative of the Bankvis-à-vis third parties and in court proceedings.He presides at shareholders’ meetings, convenes and presides at meetings of the Board of Directors of which he isan ex officio member.In a case of compelling urgency not admitting of delay, the Chairman himself may, on a proposal of the GeneralManager, take decisions falling within the competence of the Board of Directors or the Executive Committee whereit is impossible for their members to meet. Decisions so made are to be brought to the notice of the relevant body atits next meeting.The Chairman has not specific proxy powers. He has proposal and decisional powers in the following areas:a) intra-Group relations;b) human resources, in the best interests of the Banca Carige Group.He may also appoint another person to take part on his behalf in subsidiaries’ shareholders meetings.
Executive Committee
Article 25 of the By-laws provides for the appointment of the Executive Committee by the members of the Board ofDirectors, which is to fix the number of members, their term of office and their functions.The Executive Committee is made up of the Chairman and Vice Chairman, who are ex officio members, andbetween three and five other members.The five members of the Executive Committee now in office were appointed by the Board of Directors on 14th April2003 and will hold office until 31st October 2004.The Board of Directors in conformity with article 21 of the By-laws has delegated to the Executive Committee withindefined limits its powers in regard to:a) the grant, renewal, increase, reduction, confirmation, cancellation and suspension of advances and facilities
and general credit operations of every description in all branches, as well as the Group and the treasury andtax-collection payment functions, independently from the amounts and the categories of risk, remaining theexclusive competence of the Board to establish the credit politics addresses that the Bank must follow;
b) general decision making powers in matters relating to expenditure (or loss, or, however, lacked proceeds for theBank), or in matter of returns, without amount limit, but respecting the general budget deliberated by the Board,in all the matters having nature of running management and, therefore, not strategic, remaining the exclusivecompetence of the Board on the points specified by article 20 of the By-laws;
c) power to determine a range of matters including the management of human resources (excluded thecompetence of the Board by article 20 of the By-laws, and initiatives in accordance with articles 2118 and 2119Civil Code), management of the treasury and of the Bank’s investment portfolio, the use of derivatives andforeign exchange operations, the management of equity investments including decisions relating to the exercise(or not) of pre-emption or option rights on shares or shareholdings in subsidiaries; as well as in matters of day-to-day management not involving strategic issues, without a precise quantification, including the faculty toaccept inheritance, legacies and donations; decisions relating to the entering into litigation affecting the Bank,without limits as to the costs estimated or undetermined, decisions regarding the opening, closing, transfer orreorganisation of the Bank’s branches consistent with the Bank’s branch policy document deliberated by theBoard of Directors, remaining the exclusive competence of the Board on the points specified by article 20 of theBy-laws.

4
Managing Director - General Manager
In accordance with article 27 of the By-laws, a Managing Director or General Manager is appointed by the Boardof Directors. The former, if appointed, will also perform the duties of General Manager. Either will exercise thosepowers belonging to him within the scope of the By-laws and the powers granted to him by the Board of Directors.The General Manager is the head of the Bank’s staff and is responsible for the management and coordination ofhuman resources.The General Manager in office was appointed on 14th April 2003 and has the following decision-making powersdelegated to him:a) with respect to the grant, renewal, increase, reduction, confirmation, cancellation and suspension of advances
and facilities and general credit operations of every description in all branches as well as treasury and tax-collection, and payment functions; he can also give guidelines on the above to the banking subsidiaries of theBanca Carige Group as foreseen by current legislation;
b) generally with respect to matters relating to expenditure (or loss, or, however, lacked proceeds for the Bank), orin matter of returns;
c) in regard to the management of the Bank’s financial policy;d) with the Chairman’s consent, he has the right to represent the Bank at general meetings of subsidiary and
associated companies and to decide the Bank’s policy as he may think fit;e) matters of day-to-day management not involving strategic issues;f) faculty to represent the Company in judgement, remaining the competence of the Board of Directors' Chairman
and, in case of absence, of the Vice Chairman;g) faculty to delegate and to sign for all the matters of day-to-day management.

5
BANCA CARIGE SPABALANCE SHEET AT 31st DECEMBER 2003
CONTENTS
BANCA CARIGE Banca Carige ownership structure 9OWNERSHIP STRUCTURE
FINANCIAL HIGHLIGHTS Financial highlights 11
NOTICE OF MEETING Notice of meeting 12
BOARD OF DIRECTORS’ The year in Italy and abroad 14REPORT Strategy 16
Borrowing and lending activities 20Services, marketing and customer protection 40Public relations and the promotion of cultural, scientific and socialactivities 43Distribution channels and resource management 44The adoption of the International Accounting Standards (IAS) 47Investments 48Share ownership structure and relations with theCassa di Risparmio di Genova e Imperia Foundation 51Carige shares 52Income statement and net income 54Shareholders’ equity 58Risk management 61Corporate governance 66Significant events after 31st December 2003 66Prospects and conclusions 66
FINANCIAL STATEMENTS Balance sheet 70Assets 70Liabilities and Stockholders’ Equity 71
Income statement 72Financial statements comparison with 2002 73Explanatory notes 77
Introduction 77Part A – Accounting principles 79Part B – Balance sheet 84Part C – Income statement 142Part D – Other information 152
PROPOSED RESOLUTION Adoption of annual report and allocation of net profit 160
REPORT OF THE BOARD Report of the Board of Statutory Auditors 161
OF STATUTORY AUDITORS
REPORT OF THE Report of the Independent Auditors 168INDEPENDENT AUDITORS

6
ATTACHMENTS Statement of changes in stockholders’ equity 171Statement of cash flow 173Statement in accordance with art.7, c.2 of Law 218/90 (abstract) 174Properties (excluding leased fixed assets) 175Leased fixed assets revalued in accordance with Law 413/91 183Convertible bonds 184List of non significant investments 186Information on subsidiaries and other significant company interests 188Information on open pension fund “Fondo Pensione Aperto Carige” 192List of exchange rates used in converting currency into Euro 193

7
BANCA CARIGE GROUPBALANCE SHEET AT 31st DECEMBER 2003
CONTENTS
CONSOLIDATED Consolidated financial highlights 195FINANCIALHIGHLIGHTS
BASIS OF Basis of consolidation 196CONSOLIDATION
CONSOLIDATED Introduction 198BOARD OF DIRECTORS’ The year in Italy and abroad 198REPORT Key events for the Banca Carige Group in 2003 199
Intermediation activities 202Group personnel and operating structure 216Adoption of the International Accounting Standards (IAS) 218Income statement 219Shareholders’ equity 221The Group Companies and equity investments 224Significant events after 31st December 2003 231
CONSOLIDATEDFINANCIAL STATEMENTS Consolidated Balance sheet 233
Assets 233Liabilities and Stockholders’ Equity 234
Consolidated Income statement 235Consolidated Explanatory notes 236
Introduction 239Part A – Accounting principles 239Part B – Consolidated Balance sheet 242Part C – Consolidated Income statement 298Part D – Other information 308
REPORT OF THE BOARD Report of the Board of Statutory Auditors 309OF STATUTORY AUDITORS
REPORT OF THEINDEPENDENT AUDITORS Report of the Independent Auditors 312
ATTACHMENTS Statement of changes in consolidated stockholders’ equity 315

8
BALANCE SHEET2003
BANCA CARIGECassa di Risparmio di Genova e Imperia
BANCA CARIGE SpA - Cassa di Risparmio di Genova e ImperiaHead Office in Genoa, Via Cassa di Risparmio, 15
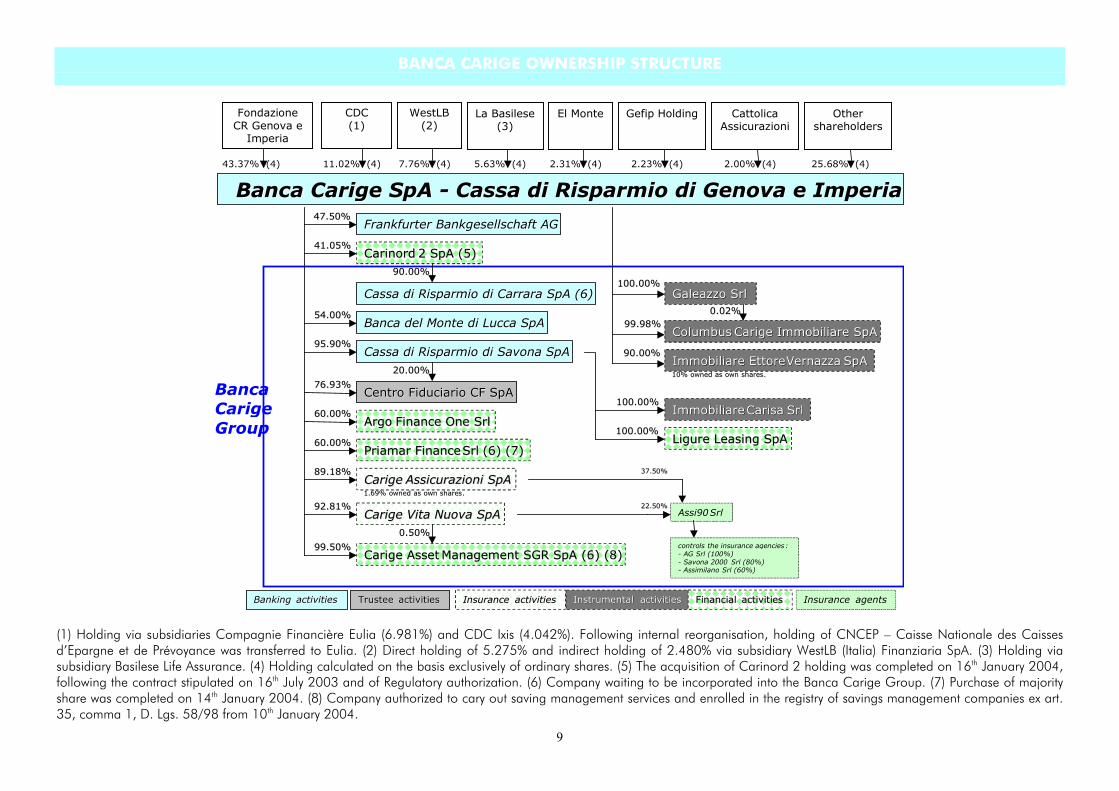
BANCA CARIGE OWNERSHIP STRUCTURE
9
Banca Carige SpA - Cassa di Risparmio di Genova e ImperiaBanca Carige SpA - Cassa di Risparmio di Genova e Imperia
CarigeCarige Assicurazioni SpAAssicurazioni SpA
Carige Vita Nuova SpACarige Vita Nuova SpA
89.18%89.18%
92.81%92.81%
Immobiliare EttoreImmobiliare EttoreVernazzaVernazza SpASpA
ColumbusColumbus Carige Immobiliare SpACarige Immobiliare SpA99.98%99.98%
90.00%90.00%
Cassa di Risparmio di Carrara SpA (2)Cassa di Risparmio di Carrara SpA (6)
Cassa di Risparmio di Savona SpACassa di Risparmio di Savona SpA
Centro Fiduciario CF SpACentro Fiduciario CF SpA
Frankfurter Bankgesellschaft AGFrankfurter Bankgesellschaft AG47.50%47.50%
76.93%76.93%
95.90%95.90%
Galeazzo SrlGaleazzo Srl100.00%100.00%
100.00%100.00%
100.00%100.00%
Ligure Leasing SpALigure Leasing SpA
ImmobiliareImmobiliare CarisaCarisa SrlSrl
InstrumentalInstrumental activitiesactivitiesTrusteeTrustee activitiesactivities InsuranceInsurance activitiesactivitiesBankingBanking activitiesactivities FinancialFinancial activitiesactivities
20.00%20.00%
BancaCarigeGroup
0.02%0.02%
10%10% ownedowned asas ownown sharesshares..
60.00%60.00%ArgoArgo Finance One SrlFinance One Srl
1.69%1.69% ownedowned asas ownown sharesshares..
Carige AssetCarige Asset Management SGR SpA (2) (4)Management SGR SpA (6) (8)99.50%99.50%
0.50%0.50%
Assi90Srl
37.50%37.50%
22.50%22.50%
Banca del Monte di Lucca SpABanca del Monte di Lucca SpA54.00%54.00%
60.00%60.00%Priamar FinancePriamar FinanceSrlSrl (2) (3)(6) (7)
CarinordCarinord 2 SpA (1)2 SpA (5)41.05%41.05%
90.00%90.00%
Insurance agents
controls the insurance agencies:- AG Srl (100%)- Savona 2000 Srl (80%)- Assimilano Srl (60%)
FondazioneCR Genova e
Imperia
43.37% (4)
CDC(1)
11.02% (4)
WestLB(2)
7.76% (4)
La Basilese(3)
5.63% (4)
El Monte
2.31% (4)
Gefip Holding
2.23% (4)
CattolicaAssicurazioni
2.00% (4)
Othershareholders
25.68% (4)
(1) Holding via subsidiaries Compagnie Financière Eulia (6.981%) and CDC Ixis (4.042%). Following internal reorganisation, holding of CNCEP – Caisse Nationale des Caissesd’Epargne et de Prévoyance was transferred to Eulia. (2) Direct holding of 5.275% and indirect holding of 2.480% via subsidiary WestLB (Italia) Finanziaria SpA. (3) Holding viasubsidiary Basilese Life Assurance. (4) Holding calculated on the basis exclusively of ordinary shares. (5) The acquisition of Carinord 2 holding was completed on 16th January 2004,following the contract stipulated on 16th July 2003 and of Regulatory authorization. (6) Company waiting to be incorporated into the Banca Carige Group. (7) Purchase of majorityshare was completed on 14th January 2004. (8) Company authorized to cary out saving management services and enrolled in the registry of savings management companies ex art.35, comma 1, D. Lgs. 58/98 from 10th January 2004.

10
FINANCIAL HIGHLIGHTS

11
FINANCIAL HIGHLIGHTS
31/12/03 30/9/03 31/12/02 31/12/01 2003 2002
BALANCE SHEET (1)
Total assets 14,653.1 14,757.9 14,393.8 12,835.5 1.8 12.1
Funding 11,667.5 11,867.9 11,433.8 10,151.6 2.0 12.6– Customer Deposits (a) 10,025.4 9,736.0 9,236.2 8,099.3 8.5 14.0
– Amounts owed to customers 5,957.9 5,809.2 5,912.3 4,863.1 0.8 21.6– Debts evidenced by certificates 4,067.5 3,926.8 3,323.9 3,236.2 22.4 2.7
– Deposits from Banks 1,139.6 1,731.5 1,797.3 1,652.0 - 36.6 8.8– Funds managed on behalf of third parties 0.4 0.4 0.3 0.3 33.3 -– Subordinated loans 502.1 400.0 400.0 400.0 25.5 -
Other Financial Intermediation Activities (OFIA) (b) 12,767.1 12,842.2 12,386.8 11,348.9 3.1 9.1– Assets Under Management 6,585.5 6,516.6 6,075.4 5,671.8 8.4 7.1– Assets in Custody 6,181.6 6,325.6 6,311.4 5,677.1 - 2.1 11.2Total Financial Intermediation Activities (TFIA) (a+b) 22,792.5 22,578.2 21,623.0 19,448.2 5.4 11.2
Lending (2) (3) 12,316.5 12,538.5 12,080.9 11,026.8 2.0 9.6– Loans to Customers (2) (3) 9,247.1 8,830.4 8,634.9 7,471.2 7.1 15.6– Loans to Banks (2) 942.7 1,386.8 1,363.6 1,122.3 - 30.9 21.5– Securities 2,126.7 2,321.3 2,082.4 2,433.3 2.1 - 14.4
– Investment securities 173.7 232.7 232.7 441.3 - 25.4 - 47.3– Trading securities 1,953.0 2,088.6 1,849.7 1,992.0 5.6 - 7.1
Shareholders’ Equity (4) 1,606.0 1,405.3 1,369.7 1,332.8 17.3 2.8
INCOME STATEMENT (1)
Operating Income 224.5 172.0 237.7 219.1 - 5.5 8.5Income from Ordinary Activities 145.0 125.0 171.8 171.6 - 15.6 0.1Income before Taxation 168.0 137.9 183.7 184.5 - 8.5 - 0.4Net Income 106.2 79.4 104.8 103.5 1.3 1.2
RESOURCES (5)
Number of branches 393 392 391 345 0.5 13.3Number of employees 3,759 3,788 3,512 3,506 7.0 0.2
FINANCIAL RATIOS
Non interest income/ Gross operating income 54.55% 55.19% 53.38% 48.59%
Operating costs/ Gross operating income 68.58% 67.99% 63.47% 63.53%
Income before Taxation/ Shareholders’ Equity (4) 10.46% 9.81% 13.41% 13.84%
ROE 6.61% 5.65% 7.65% 7.77%
ROAE (6) 7.64% 5.72% 7.76% 7.86%
SOLVENCY RATIOS
Risk-Weighted Assets (RWA) (1) 10,573.1 10,452.1 9,709.8 8,780.0 8.9 10.6Tier 1 % of RWA 10.85% 9.02% 9.27% 11.11%Total Capital % of RWA 13.89% 11.29% 11.58% 15.45%(1) Millions of Euros.(2) Gross of allowance for credit risks.(3) Including leased fixed assets.(4) Including reserves for general banking risks.(5) Statistics at the end of period.(6) Net income on average shareholders’ equity (Return On Average Equity).
Change %

12
NOTICE OF MEETING
The shareholders of Banca Carige SpA are called to an ordinary general meeting to be held at the Bank’sheadquarters in Genoa (Via David Chiossone, 3) on 28th April 2004 at 10.30 am and, if necessary, byadjournment at the same place on 29th April 2004 at 10.30 am to discuss and to resolve the following:
AGENDA
1. Examination of the financial statements as at 31st December 2003, together with the reports of the Board ofDirectors and Statutory Auditors;
2. Examination of the consolidated financial statements of the Banca Carige Group as at 31st December 2003;
3. Deliberation regarding the acquisition of own shares pursuant to article 2357 of the Italian Civil Code.
Shareholders will be entitled to attend the meeting on production of the appropriate certificates prescribed by article34 of the CONSOB ruling no. 11768 of 23rd December 1998 relating to shares held centrally at Monte Titoli SpAand not represented by share certificates. Shareholders are reminded that, in the light of article 51 of the CONSOBruling, after 1st January 1999 the rights attaching to securities that are not held at Monte Titoli SpA can only beexercised after the securities have been delivered to an intermediary with a view to their introduction into the systemof centralised registration involved in the regime for the abolition of share certificates.
Documentation relating to the above agenda, as required by current legislation, will be deposited not less than 15days before the date of the meeting at the Bank’s head office (in Genoa at 15 Via Cassa di Risparmio, InvestorRelations Office) and at the body that runs the stock market, Borsa Italiana SpA in Milan (6 Piazza degli Affari), forinspection by shareholders who will have an opportunity to make copies for their own use.
Genoa, 22nd March 2004
The Chairman of the Board of Directors Mr. Giovanni Berneschi
Notice of meeting published in the Official Gazette of the Italian republic- sheet number 72 of 20 March 2004.

13
BOARD OF DIRECTORS’REPORT

14
THE YEAR IN ITALY AND ABROAD
The world’s economy showed some signs ofrecovery during 2003 after the difficulties of theprevious year. Gross Domestic Product (GDP) rose3.2% in comparison to 2.6% recorded in 2002.This growth was principally due to expansion indomestic demand in the United States and Asia.The contribution of the G7 countries with theexception of the US, although up over 2002, waslower than the overall average. Minimal growthwas recorded in Latin American economies. Theimprovement during 2003 was in part due to anexpansionary approach both at monetary and fiscalpolicy levels. Financial markets also clawed backsome of the loses suffered during 2002.International trade benefited from reduced tensionon the international political scene, albeittemporary. The US dollar lost considerable groundagainst the euro, with redistribution effects at worldlevel on purchasing power.The United States’ economy rose at higher ratethan in 2002: 3% in comparison to 2.2%. Growthwas particularly evident in the second half of theyear thanks to an upturn in domestic consumption,especially in household durables. This area, inparticular, felt the positive effects of anexpansionary economic policy which encouragedinvestment in machinery and software. In foreigntrade, import levels were generally stable, butexports rose as a result of the weak dollar andstrong demand from Asian markets. Inflation roseat an annual rate of 2.3%, whilst unemploymentwas similar to levels recorded in 2002: 6%.There were some improvements in the economiccondition of the 12 member countries of theEuropean Monetary Union (EMU) during thesecond half of the year but not enough to offset thenegative results of the first half of the year. Theannual growth in GDP for euroland was around0.5% (2002: +0.8%). In particular, weak domesticdemand (private consumption rose by 1.2% andpublic sector consumption by 1.6%) and falls ininvestments (-1.6%) was accompanied by increasesin exports to Asia and central Europe despite thestronger euro. Inflation for the area rose at 2%(2002:+2.2%). Unemployment was slightly upfrom 8.4% to 8.8% following an overall worseningof conditions on the labour market. The euro/dollarexchange rate ended the year at 1.25, an increase
of 19.2% over December 2002. Results relating tovarious demand segments varied from country tocountry.In particular, the German economy recordednegative growth (-0.1%) as a result of both weakdomestic demand and a negative balance of trade.Investments fell, particularly in machinery andequipment. The weakness of the German economyis mirrored by extremely low inflation (+0.9%) andan unemployment rate that rose from 8.6% in 2002to 9.3%.In France GDP rose by 0.2% as a result of growthin domestic demand (0.9%), in particular in privateconsumption, that compensates the contraction ofnet exports (-0.6%); however, industrial activityslowed down, like investments dynamics. Inflationwas at 2.2%. Tensions on the labour market arereflected by an unemployment rate which rose to9.4% (8.8% in 2002).The Spanish economy was the area’s mostvibrant: GDP rose by 2.4%, 2% higher than in2002. There was steady growth in domesticdemand (+3.1%) accompanied by a negative resultfor exports (-0.7%). In particular, there wasincreased investment in the building andmanufacturing sectors. Private consumption(families and families) was, however, flat.Consumer prices rose at around 3% annually,whilst unemployment remains high at 11.3%.Outside EMU, the United Kingdom’s economyhad a good year. Growth in domestic consumptionboth on the part of the families and the publicsector pushed GDP up by 2%. There was a sharpdrop in exports, ending the year with a negativeresult of -0.5%. Fixed investments slowed especiallyin the property sector. Inflation was at 2.1%,unemployment at 5%.There were signs of improvement for theJapanese economy: GDP rose by 2.2%, thanksprincipally to rises in investments and exports.Domestic demand remains, however, critical andthere are no signs as yet of a turnaround in thesituation that over recent years has seen a fall inreal salaries. Prospects for expansion in this areaare uncertain. Inflation, consequently, remains at anegative value of -0.3%; unemployment alsoremained unchanged at 5.4%.

15
Within the Asian economies, China was the drivingforce during 2003. Increases in GDP for Chinaand India were of 8.3% (2002: +7.1%) thanks toconsiderable growth in internal demand. The otherAsian countries of the Pacific recordedexpansion of 3.5% in GDP and continued to benefitfrom the considerable contribution of exports totheir economies. Turning to Latin America, afterthe crises that hit Argentina, Venezuela and to alesser extent Brazil during 2002, there were tenuoussigns of recovery: GDP rose by 0.8%. Emergingeconomies such as central Europe, Russia andcentral and southern Africa overall recorded betterresults than the in the previous year.In Italy, the economy experienced negative growthduring the first half of the year to be followed by arecovery in the second; a scenario alreadyrecorded in the previous year. Consequently theannual rise in GDP for 2003 was 0.3%. Whatgrowth there was came from rises in familyspending and an overall stability in exports thanksto rising demand from Asia and the United States.These two factors compensated for the significanterosion of competitiveness that stemmed from therise in the euro against the US dollar. Investmentlevels continued to recorded negative results: inparticular, there were falls in investments destinedto manufacturing (-7.1%). The building sector,however, recorded an increase of 2.1%.Inflation levels in the country continued to becomparatively high with regards to other countriesin the EU. The average consumer price index for2003 was 2.5% (2002: 2.4%). Rising pricesaccompanied the changeover to the euro andcontinued with increases in certain food prices,particularly fruit and vegetables. During the summerthere was an apparent truce, but pressure returnedin the last quarter.Italy’s labour market on the basis of figuressupplied by the Italian national statistics institute(ISTAT) recorded a 0.9% increase in employmentin comparison to 1.2% in the previous year.Expansion in sales-related jobs was of 1.5%.Unemployment was down from 8.9% to 8.5%. The‘two nations’ division however remains withconsiderable differences in unemployment levelsbetween the north and the south of the country.Italian government PSBR at 31st December 2003was around 45 billion euros. Growth ingovernment revenues continued to be low, but weresupported by capital account takings especiallyfrom the sale of public sector properties. Initialestimates for the country’s deficit/GDP ratio is
around 3%; debt/GDP was down slightly from106.7% to 106.6%.In Liguria, the economy reflected the difficultiesexperienced at international and national levels.There was a worsening in some of the region’sstructural problem areas especially during the firsthalf of the year, with a slight improvement in thesecond half in investments after the significant fallsin 2002, and in exports.The region’s GDP rose by 0.3% ( no growthrecorded in 2002) generated by a recovery inconsumption, exclusively relating to spending onfood, and in foreign trade. There were negativeinvestment levels in the area of machinery andequipment, whilst increases were recorded for thebuilding and construction sector. Port-relatedactivities continued to rise, but the region’s touristindustry had a difficult year. Employment levelscontinued to improve.On the business front, the number of firmsclassified as going concerns rose by 0.5% incomparison to the national average of 0.9% to136,463.The slow down in the growth rate in manufacturingas a result of falls in orders from abroad waspartially offset by overall stability in sales nationally.The crisis in the region’s consumption levels wasonly less serious in the food segment.Liguria’s ports recorded positive results: overallgoods and container traffic rose by 4.4% and4.2%, respectively. There were increases in thevolume of goods handled in all the region’s portswith La Spezia in the eastern extreme of Liguriaachieving an 8.7% increase; Genoa, the region’smain port, recorded a rise of 3.5%, and Savona, inthe west, an increase of 2%. In particular withregards to container traffic, Genoa and La Speziareached record levels in terms of TEUs (twentyextension units) handled of 1.6 million and 1million, respectively. There was further growth in thepassenger business both in Genoa and Savona.With regards to the latter, a new passenger terminalwas opened during the year.On the basis of ISTAT figures for the first ninemonths of the year, there was considerable growthin imports (up 13.9% over twelve months) incomparison to moderate growth for the north-westof the country (+1.2%) and an actual fall nationally(-0.9%). On the export front, generalised falls wereless acute in Liguria (-1%) in comparison both tothe north-west ( -2.9%) and the national average (-4.6%).

16
Difficulties persist in the crucially important tourismand hospitality industry: the number of visitors toLiguria fell, particularly in the western provinces ofSavona and Imperia.An increase in the number of those in work – upfrom 612,000 to 621,000 – was matched by a fallin the number of those out of work ( from 43,00 in2002 to 36,000). The official unemployment ratefor the region dropped from 6.5% to 5.5%.The annual inflation rate for Liguria was 2.4%,slightly lower than the national average.During 2003 monetary policy on both sides of theAtlantic was substantially expansionary with anexpected tightening of policy on the part of the Fedand the ECB not occurring. The latter cut its FedFund rate just the once during the year (a reductionof 25 basis points) to 1%. The European CentralBank cut its base rate twice, to bring it down from2.75% at the end of 2002 to 2% at the end of2003.On exchange markets, the euro rose considerablyagainst the dollar, rising by 19.2% in twelvemonths. The US dollar/euro rate at 31/12/03 was$1.25.Money market rates fell during the first half of theyear (around 70 b.p.) with little change thereafter.Italian government stock tracked this first half trendbut recorded slight increases during the second halfof the year. Yields on treasury bills (BOT) during2003 were down around 50 b.p., whilst those ontreasury bonds (BTP) slipped by around 15 b.p.Total customer deposits for the Italian bankingindustry amounted to 905,000 million euros, anincrease of 6% over December 2002. Bonds roseby around 5.8% and customer deposits by 6.5%.There was an 11% increase in savings managementafter the problems experienced in 2002. Thisgrowth was evident in all components: mutualfunds (+9%); asset management (+8%); insurancefunds (+18%).Expansion in lending continued in 2003, inparticular to families and firms, as well as inmedium/long-term credits. Overall, the annual risewas of 6.3% corresponding to a total of 1,011,000million euros. The rise in bad loans was similar tothat recorded by lending in general.Bank rates responded to falls in official rates. Theaverage rate paid on deposits is 1% (2002: 1.4%) ,whilst lending rates fell from 5.8% to 5%.Consequently there was narrowing in the averagespread from 4.4% in 2002 to 4%.
STRATEGY
Banca Carige’s strategy in recent years has beendeveloped to protect our autonomy and influencein the Italian banking industry.In order to achieve this aim, Banca Carige hasbecome the parent company of a group – theBanca Carige Group – that is equipped to offer awide range of innovative banking, finance, savingsand pension solutions. (In this Report, BancaCarige will also be referred to variously as ‘Carige’and ‘the Bank’; Banca Carige Group will bereferred to also as ‘the Group’).Banca Carige is:
- national, working from its traditionalstronghold of Liguria, the Group willcontinue to expand into new market areashighlighting the need to recognise theimportance of creating strong ties with thelocal community via an emphasis on amulti-local approach;
- retail, focusing on the family, small andmedium-sized businesses, and localauthorities;
- universal, in terms of the range ofborrowing and lending products, andservices offered by the Group;
- multi-channel, exploiting theopportunities offered by various integrateddistribution solutions (real, remote, mobile);
- aggregation point for other small andmedium-sized banks with particularlocation, structural and managementcharacteristics whose inclusion in the Groupis compatible with the Group’s strategicobjectives.
During 2003, Carige continued with strategicmeasures designed to create long-term value forour shareholders via consolidated channels ofdevelopment: increases in operational capacity,profitability, and efficiency. These objectives will berealised via well-established profiles: market(distribution and production structure); finance;organisation and human resources; informationand communication technology; capitalmanagement; relations with our internationalpartners; merger and acquisition. Significantprogress was made in the realisation of theseobjectives during 2003.

17
The most significant measures taken within themarket profile continue to focus on thedevelopment both at Bank and Group levels of anintegrated multi-channel distribution model. The 42branches purchased from the Capitalia Group atthe end of 2002 are now fully integrated into thenetwork of traditional distribution. This networkcontinued to grow internally (branch openings byBanca Carige or its banking subsidiaries) with theopening of two branches (in Monza near Milan andin Genoa). With these new openings the totalnumber of branches reaches 393, distributed over12 Italian regions. Distribution is crucially linked tocustomer segmentation, a process that began in1999 with the creation of specific commercial andorganisational solutions for private and corporateclients. During 2003, 14 more districts offeringfinancial consultancy to high net worth clients wereopened (Veneto 1; Turin, Vercelli, Alessandria andCuneo in Piedmont; Perugia, Latina, Sora, AscoliPiceno and Ancona in the central regions ofUmbria, Latium and Marches; Sicily 2; Parma,Modena and Piacenza in Emilia Romagna). Thetotal of consultancy districts is now 36 with 93financial advisors. Corporate consultancy, alreadypresent in Liguria, Tuscany and Lombardy, wasexpanded into Piedmont, Emilia, Veneto, andMarches. The service is now operational in 36districts with 75 advisors.A key feature in the expansion and consolidation ofthe Banca Carige Group is the integration betweenthe banking and insurance networks. In order toheighten the effectiveness of this feature, a neworganisational model has been developed (‘Insiemedi più’) that structures relations between insuranceagents and bank branches and at the same timeoffers specific insurance products. The model isdependant on continuous and systematic flows ofinformation between the banking and insurancenetworks so as to achieve the development ofbancassurance both in terms of bank-in-insurance(‘assurbanca’) and insurance-in-bank(‘bancassicurazione’); the former with thedistribution of financial solutions at the counters ofour insurance subsidiaries, the latter in the form ofinsurance advice for banking customers.External growth via branch acquisitions wasboosted with the signing of a contract along withCassa di Risparmio di Firenze for the purchase ofthe entire share capital of Carinord 2 SpA, aholding that controls Cassa di Risparmio di Carraraand Cassa di Riaprmio della Spezia. Banca Carigeand Cassa di Risparmio di Firenze have defined the
full purchase of Carinord 2's share capital fromBanca Intesa, and the Cassa di Risparmio diCarrara and Cassa di Risparmio di SpeziaFoundations. The transaction received Bank of Italyauthorisation in December 2003 and wascompleted in January 2004. The transaction aims,via the successive breaking up of Carinord 2, atgiving Banca Carige direct control over Cassa diRisparmio di Carrara (with a holding of 90%). Thesame transaction will give Cassa di Risparmio diFirenze direct control over Cassa di Risparmio diSpezia (68.09% holding). The objective of thisacquisition is to extend Carige’s presence in thestrategically important region of Tuscany. TheCarige Group has at present in the regionbranches of Banca Carige in addition to branchesof the banking subsidiary Banca del Monte diLucca.C.R. Carrara satisfies those strategic objectivesoutlined in Carige’s three-year strategy plan for theyears 2001-2004: it is a medium/small retail bank,situated in the centre-north of Italy with strong localpresence, outsourced IT&C systems, and significantpotential for product expansion.The Carrara bank has 33 branches, 25 of which inthe north Tuscan province of Massa-Carrara, 6 inthe province of Lucca, and 2 in the neighbouringeastern Ligurian province of La Spezia.As a result of the territorial distribution of CarigeGroup branches, particularly good in the provincesof La Spezia and Lucca, the investment hassignificant strategic importance given the strongeconomic and social ties that exist between this partof Tuscany and eastern Liguria.The transaction described above not onlystrengthens the Carige Group’s position on thenational market, but it is also part of the Group’smerger & acquisition activity that aims atconfirming our role as an aggregation point forother small and medium-sized banks.Increased operational capacities are in factnecessary for a lowering in the cut off pointbetween costs and profits and a more effectiveexploitation of diversification economies present inthe universal banking model.Banca Carige’s expansion has been realisedthrough a coherent application of capitalmanagement namely, the strengthening of ourcapital base in order to support development, whilstat the same time maintaining financial stability.With this in mind, the Board of Directors of BancaCarige, in part carrying out the resolutions of theExtraordinary Shareholders' meeting held on 10th

18
September 2003, deliberated a paid up sharecapital increase via the offer in option to ordinaryshares of savings shares, and subordinated bondsconvertible from 2006 onwards into ordinaryshares on a one share-one bond basis. The issuewas fully subscribed with a counter value of morethan 306 million euros.Banca Carige has been for several years active inimproving product and distribution relating tosavings management, an objective positionedwithin the Carige’s finance profile. Initiativesduring the period concerned the full range ofsavings management products – mutual funds,asset management, bancassurance, pension funds– in order to broaden revenue sources andheighten efficiency. In order to achieve cost savingsvia a simplification of distribution, Carige decidedto form its own manager trust (Società di Gestionedel Risparmio – SGR) as a vehicle for the:
• integration of Carige Group savingsmanagement solutions;
• realisation in full autonomy of savingsmanagement solutions;
• recovery of profitability and costcontainments for our customers.
In July 2003 Carige Asset Management SGR SpA("Carige AM SGR SpA") was constituted with ashare capital of 5,200,000. Banca Carige owns99.5%, Carige Vita Nuova, 0.5%.Carige AM SGR, utilising the services of theGroup's financial advisors and Net bankingsolutions, will be responsible for the offer of a wide-range of savings management products. With thisin mind, the company will not only constitute itsown open mutual funds but also be responsible fortheir management, administration and distribution.Carige AM SGR will also handle Carige’s securityand mutual funds management business along withpension funds. It will also manage a quota of theCarige Group’s portfolio. Future activity will be inthe creation of fund funds as well as thedevelopment of securities fund management forinstitutional investors, in particular Italian bankingfoundations. Banca Carige will act as depositary forthe funds.During 2003, measures continued to be taken inorder to achieve a leaner, more decentralisedorganisation and a more effective use ofhuman resources with the aim of improving theBank's market activities.The considerable expansion of the Carige Group atnational level over the last few years means that
staff training has become crucial in order to provideour employees with the skills required; essentialalso is the development of a corporate identityamongst staff that at the same time respectsindividual and local characteristics. It is crucialalso, in this period of difficulty for the bankingindustry, to maintain and in cases regain the trustof customers. The adoption in full by the Bank ofthe Italian Banking Association’s ‘Code of Ethics’ isjust one step in this direction. Carige fully sharesthe contents of the Code as it does the most recentdevelopments in the area of corporate governance.Expansion of the Group has been accompanied bya thorough review of the Bank's seniormanagement and organisational framework. Atexecutive level, Mr Alfredo Sanguinetto as GeneralManager replaces the previous Managing Director.Three new Deputy Managers were appointed toreplace the previous two positions (administrationand market): Mr Giovanni Poggio (Administration),Mr Carlo Arzani (Resources), and Mr Achille Tori(Market).In the light of continual external growth,reorganisation of territorial government structureswas required in the form of two new organisational-management units (‘territorial poles’) in addition tothe overhaul of two existing Territorial Areas.Banca Carige’s Information &Communication Technology profile isconstantly subject to three main developmentmeasures: maintenance (in terms of both correctionand implementation); sectoral review and update ofrelated IT systems; full review of the Bank’s ITsystems to take advantage of new operationalmodels.The profile – Relations with InternationalPartners – saw collaboration aimed at improvingCarige’s market position via support for expansionand reorganisation carried out by the Bank. Withthis in mind, in collaboration with our partnersCDC and Gefip Holding, particular attention waspaid to project financing bearing in mind theimportance of infrastructure within investmentprogrammes both at local and national levels. In2002 the company ILI ('Infrastutture Lavori ItaliaSpA’) was set up, whose work should allow theCarige Group to develop new business segmentsand thereby increase profit opportunities in the areaof project financing. The Board of Directorsdeliberated during their meeting of 30th June 2003that Banca Carige assume the role of co-promotertogether with other partners including GefipHolding SA and ILI SpA in the presentation of a

19
project financing proposal for motorway links in thenorth east (Orte-Venice), and in Sicily (Catania-Siracusa), in addition to a proposal for theconstruction of a motorway link between the A12and A7 motorways around Genoa.
Carige’s strategy of growth was evaluated positivelyby the principal rating agencies Fitch, Standard &Poor’s, and Moody’s, which all confirmed theirprevious ratings.
BANCA CARIGE RATING
short-term long-term BFSR (1) (2) Individual (2) Support (3)Fitch F1 A - C 3 (4)Moody's P-1 A2 C+ - -Standard & Poor's A2 A- - - -
(1) Bank Financial Strength Ratings.(2) Rating of financial solidity on a scale from A to E.(3) Rating of likelihood of state intervention in case of crisis on a scale from 1 to 5.(4) The rating assigned from Fitch has improved from 4 to 3 during 2003.

20
5
BORROWING AND LENDINGACTIVITIES
Total Financial Intermediation Activities(TFIA) made up by direct and indirect depositsrecorded an increase of 5.4% to 22,792.5million in comparison to the end of 2002. Inparticular, direct deposits or ‘customer deposits’rose 8.5% to 10,025.4 million, accounting for
44% of TFIA (2002: 9,236.2 million). Indirectdeposits or ‘other financial intermediationactivities’ increased by 3.1% from 12,386.8million at 31/12/02 to 12,767.1 million. Thisaggregate now accounts for 56% of TFIA.
TOTAL FINANCIAL INTERMEDIATION ACTIVITIES (millions of Euros)
Change %31/12/03 30/9/03 31/12/02 31/12/01 2003 2002
Total (A+B) 22,792.5 22,578.2 21,623.0 19,448.2 5.4 11.2
Direct deposits (A) 10,025.4 9,736.0 9,236.2 8,099.3 8.5 14.0 % Total 44.0% 43.1% 42.7% 41.6%Indirect deposits (B) 12,767.1 12,842.2 12,386.8 11,348.9 3.1 9.1 % Total 56.0% 56.9% 57.3% 58.4% - Assets under management 6,585.5 6,516.6 6,075.4 5,671.8 8.4 7.1 % Total 28.9% 28.9% 28.1% 29.2% % OFIA 51.6% 50.7% 49.0% 50.0% - Assets in custody 6,181.6 6,325.6 6,311.4 5,677.1 - 2.1 11.2 % Total 27.1% 28.0% 29.2% 29.2% % OFIA 48.4% 49.3% 51.0% 50.0%
0
5,000
10,000
15,000
20,000
2001 2002 2003
TOTAL FINANCIAL INTERMEDIATION ACTIVITIES (millions of Euros)
Assets under management
Assets in custody
Direct deposits
19,448 21,623 22,792

21
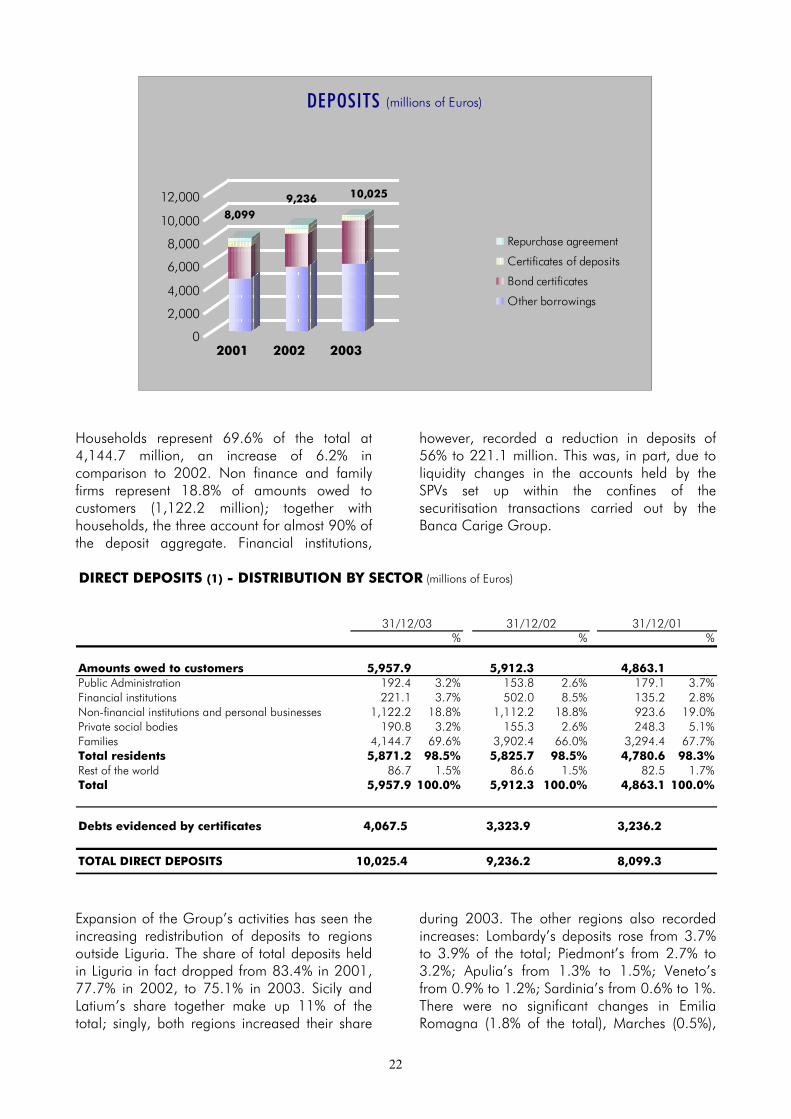
Total funds at 31/12/03, which includecustomer deposits (10,025.4 million), interbankdeposits (1,139.6 million), funds managed onbehalf of third parties (0.4 million) andsubordinated loans (502.1 million), amountedto 11,667.5 million, up 2% in comparison to theend of 2002 (11,433.8 million).In particular, customer deposits recorded a8.5% increase over December 2002. Thisincrease stems almost fully from strong growth inbonds of 22.4% (4,067.5 million). Amountsowed to customers (5,957.9 million) remains atlevels recorded in 2002 (+0.8%).During the year the trend towards a polarisationbetween, on one hand, liquid products (currentaccounts, savings and deposit accounts) and, onthe other, bonds continued. In greater detail,current accounts rose by 5.6%, whilst savingsdeposits remained basically unchanged (472million; +0.9%). Sales and repurchaseagreements, after a period of considerableexpansion, recorded a sharp fall of 62%, downto 149.5 million; certificates of depositcontinued their downward trend, dropping17.8% to 326.8 million. There was a marked
increase in bonds (3,653.9 million; +28%)generated exclusively by the placement at theBank’s counters of 40 new issues, of which 19 atfixed rate and 21 at floating for a total of morethan 1 billion. Seventeen of the lines issued havematurities beyond 5 years.The Euro Medium Term Note programme(EMTN) recorded little change in comparison to2002. With regards to this programme, aimedat giving the Bank medium/long-term depositinstruments equipped to match increases inlending, other products include 125 million ininterbank borrowing and 400 million in the formof a subordinated loan.On the basis of maturities, after a temporaryshift in favour of short-term deposits followingthe purchase of the ex-Capitalia branches in2002, during the year there was a return togrowth in medium/long-term deposits. Thisaggregate, almost entirely in the form of bonds,rose by 26.8% to 3,677.7 million in comparisonto short-term deposits, which remainedstationary at 3,653.9 million (+0.2%).At 31/12/03, derivatives provided 1,071.7million in cover on bonds issued by the Bank.
FUNDING (millions of Euros)Change %
31/12/03 30/9/03 31/12/02 31/12/01 2003 2002
Total (a+b+c) 11,667.5 11,867.9 11,433.8 10,151.6 2.0 12.6
Direct deposits (a) 10,025.4 9,736.0 9,236.2 8,099.3 8.5 14.0Amounts owed to customers 5,957.9 5,809.2 5,912.3 4,863.1 0.8 21.6 current accounts 5,331.4 5,128.8 5,047.4 4,119.1 5.6 22.5 repurchase agreements 149.5 219.9 393.7 349.1 - 62.0 12.8 saving deposits 472 457.1 467.8 384.5 0.9 21.7 loans from international organizations - - 0.8 3.4 - 100.0 - 76.5 other borrowings 5.0 3.4 2.6 7.0 92.3 - 62.9Debts evidenced by certificates 4,067.5 3,926.8 3,323.9 3,236.2 22.4 2.7 bond certificates 3,653.9 3,507.5 2,853.9 2,691.7 28.0 6.0 certificates of deposits 326.8 344.8 397.3 474.4 - 17.7 - 16.3 outstanding cheques 86.8 74.5 72.7 70.1 19.4 3.7
short term deposits 6,347.7 6,203.0 6,335.3 5,304.1 0.2 19.4 % Total 63.3 63.7 68.6 65.5long term deposits 3,677.7 3,533.0 2,900.9 2,795.2 26.8 3.8 % Total 36.7 36.3 31.4 34.5
Amounts owed to credit institutions (b) 1,139.6 1,731.5 1,797.3 1,652.0 - 36.6 8.8Deposits 617.3 1,216.9 1,307.8 1,156.4 - 52.8 13.1Financing 373.4 330.7 273.2 288.4 36.7 - 5.3Current accounts 88.8 36.9 53.9 29.8 64.7 80.9Repurchase agreements 60.1 147.0 162.4 177.4 - 63.0 - 8.5Due to central banks - - - - … …
0.4 0.4 0.3 0.3 33.3 -
502.1 400.0 400.0 400.0 25.5 -
Funds managed on behalf of third parties (c)
Subordinated loans (d)
22
0
2,000
4,000
6,000
8,000
10,000
12,000
2001 2002 2003
DEPOSITS (millions of Euros)
Repurchase agreement
Certificates of deposits
Bond certificates
Other borrowings
8,0999,236 10,025
Households represent 69.6% of the total at4,144.7 million, an increase of 6.2% incomparison to 2002. Non finance and familyfirms represent 18.8% of amounts owed tocustomers (1,122.2 million); together withhouseholds, the three account for almost 90% ofthe deposit aggregate. Financial institutions,
however, recorded a reduction in deposits of56% to 221.1 million. This was, in part, due toliquidity changes in the accounts held by theSPVs set up within the confines of thesecuritisation transactions carried out by theBanca Carige Group.
DIRECT DEPOSITS (1) - DISTRIBUTION BY SECTOR (millions of Euros)
% % %
Amounts owed to customers 5,957.9 5,912.3 4,863.1Public Administration 192.4 3.2% 153.8 2.6% 179.1 3.7%Financial institutions 221.1 3.7% 502.0 8.5% 135.2 2.8%Non-financial institutions and personal businesses 1,122.2 18.8% 1,112.2 18.8% 923.6 19.0%Private social bodies 190.8 3.2% 155.3 2.6% 248.3 5.1%Families 4,144.7 69.6% 3,902.4 66.0% 3,294.4 67.7%Total residents 5,871.2 98.5% 5,825.7 98.5% 4,780.6 98.3%Rest of the world 86.7 1.5% 86.6 1.5% 82.5 1.7%Total 5,957.9 100.0% 5,912.3 100.0% 4,863.1 100.0%
Debts evidenced by certificates 4,067.5 3,323.9 3,236.2
TOTAL DIRECT DEPOSITS 10,025.4 9,236.2 8,099.3
31/12/03 31/12/02 31/12/01
Expansion of the Group’s activities has seen theincreasing redistribution of deposits to regionsoutside Liguria. The share of total deposits heldin Liguria in fact dropped from 83.4% in 2001,77.7% in 2002, to 75.1% in 2003. Sicily andLatium’s share together make up 11% of thetotal; singly, both regions increased their share
during 2003. The other regions also recordedincreases: Lombardy’s deposits rose from 3.7%to 3.9% of the total; Piedmont’s from 2.7% to3.2%; Apulia’s from 1.3% to 1.5%; Veneto’sfrom 0.9% to 1.2%; Sardinia’s from 0.6% to 1%.There were no significant changes in EmiliaRomagna (1.8% of the total), Marches (0.5%),

23
and Tuscany and Umbria (both 0.2%). TheBank’s sole foreign branch in Nice, Francerepresents 0.3% of the total deposits aggregate.Amounts owed to banks amounted to1,139.6 million, down 36.6% in comparison to31st December 2002. The fall relates, inparticular, to interbank deposits (617.3 million; -52.8%) and sale and repurchase agreements(60.1 million; -63%). There were rises, however,in current accounts (88.8 million; 64.7 %) andother predominantly medium/long-term depositforms (373.4 million; 36.7%).
Funds managed on behalf of thirdparties remained at marginal levels, risingfrom 0.3 to 0.4 million.Subordinated loans are of two types: thefirst is in the form of a subordinated loan of 400million issued in September 2001 within theEuro Medium Term Note Programme; thesecond is a hybrid subordinated loan issueconvertible into ordinary shares issued as part ofthe Bank’s financial strengthening policy, whichraised in December 2003 102.1 million.Full details are given in sections 6, 8 and 11,part B of the explanatory notes.
DIRECT DEPOSITS (1) - GEOGRAPHICAL DISTRIBUTION (millions of Euros)
31/12/03 31/12/02 31/12/01% % %
Liguria 7,513.5 75.1% 7,165.3 77.7% 6,758.6 83.4%Latium 635.0 6.3% 490.4 5.3% 144.9 1.8%Sicily 485.0 4.8% 436.8 4.7% 363.3 4.5%Lombardy 391.4 3.9% 345.7 3.7% 271.9 3.4%Piedmont 322.6 3.2% 251.8 2.7% 212.5 2.6%Emilia Romagna 185.2 1.8% 176.8 1.9% 145.1 1.8%Apulia 152.3 1.5% 118.3 1.3% 85.9 1.0%Veneto 117.1 1.2% 87.2 0.9% 46.3 0.6%Sardinia 95.1 1.0% 52.7 0.6% 30.2 0.4%Marches 52.7 0.5% 47.9 0.5% - - Tuscany 21.9 0.2% 18.3 0.2% 16.2 0.2%Umbria 19.9 0.2% 18.4 0.2% - - Total Italy 9,991.7 99.7% 9,209.6 99.7% 8,074.9 99.7%Abroad 33.7 0.3% 26.6 0.3% 24.4 0.3%Total direct deposits 10,025.4 100.0% 9,236.2 100.0% 8,099.3 100.0%
(1) Balance Sheet (Liabilities) captions 20 and 30.
INDIRECT DEPOSITS (millions of Euros)
31/12/03 30/9/03 31/12/02 31/12/01 2003 2002
Total (A+B) 12,767.1 12,842.2 12,386.8 11,348.9 3.1 9.1
Assets under management (A) 6,585.5 6,516.6 6,075.4 5,671.8 8.4 7.1 Mutual funds and unit trusts 3,780.5 3,771.2 3,361.3 2,985.0 12.5 12.6 Private banking 2,102.5 2,076.0 2,112.0 2,170.8 - 0.4 - 2.7 including: Security management (1) 1,126.7 1,067.1 972.4 917.4 15.9 6.0 Mutual funds management 975.8 1,008.9 1,139.6 1,253.4 - 14.4 - 9.1 Bancassurance products 702.5 669.4 602.1 516.0 16.7 16.7
Assets in custody (B) 6,181.6 6,325.6 6,311.4 5,677.1 - 2.1 11.2 Government securities 3,114.3 3,348.5 3,645.0 3,325.2 - 14.6 9.6 Others 3,067.3 2,977.1 2,666.4 2,351.9 15.0 13.4(1) The figure includes the entire securities portfolio of the insurance subsidiaries.
Change %
24
Indirect deposits recorded a 3.1% increase incomparison to the end of 2002 to reach12,767.1 million. Within this aggregate, savingsmanagement rose, whilst assets in custodyslipped.In particular, savings management increased by8.4% to 6,585.5 million. In particular, therewere rises in mutual funds (3,780.5 million;+12.5%) and bancassurance products (702.5million; +16.7%). Assets under management (2,102.5 million) recorded little variation incomparison to 2002: growth in securitiesmanagement (1,126.7 million; +15.9%) wasoffset by a 14.4% fall in fund management(975.8 million).
Assets in custody totalled 6,181.6 million, down2.1% following a 14.6% fall in the governmentstock segment (3,114.3) as yields on thesesecurities continued to fall. In contrast, theresidual segments of the aggregate – bonds andshares – progressively increased their volume,up 15% to 3,067.3 million.Indirect deposits are concentrated amongsthouseholds (10,433.4 million, 81.7% of thetotal), an increase of 2.5% over 2002. Financialinstitutions make up 11.6% of the total (1,485.7million), here, too, an increase over the previousyear (+4.1%). Non financial institutions andfamily businesses maintained their share at4.3%, as did the public administration at 1.4%.
INDIRECT DEPOSITS - DISTRIBUTION BY SECTOR (millions of Euros)
% % %
Public Administration 173.7 1.4% 145.8 1.2% 178.6 1.6%Financial institutions 1,485.7 11.6% 1,427.7 11.5% 785.5 6.9%Non-financial and personal businesses 542.9 4.3% 504.1 4.1% 793.6 7.0%Private social bodies 95.6 0.7% 109.7 0.9% 68.4 0.6%Families 10,433.4 81.7% 10,178.2 82.2% 9,508.7 83.8%Total residents 12,731.3 99.7% 12,365.6 99.9% 11,334.8 99.9%Rest of the world 35.8 0.3% 21.2 0.1% 14.1 0.1%Total 12,767.1 100.0% 12,386.8 100.0% 11,348.9 100.0%
31/12/03 31/12/02 31/12/01
Liguria continues to represent the lion’s sharesas far as indirect deposits are concerned: 82%.This figure is an increase after the fall of theprevious year following the acquisition of 42branches outside Liguria from the CapitaliaGroup. The regions in which there were the mostnoticeable falls in indirect deposits were in
Lombardy (from 4.7% to 3.2%) and Latium (from4.8% to 4.3%). There were few changes inCarige’s other operating regions: Piedmont(3.2%); Sicicly (2.9%); Emilia Romagna (1.4%).Marches, Veneto Apulia, Umbria, Sardinia andTuscany maintain shares of below 1 percent.

25
INDIRECT DEPOSITS - GEOGRAPHICAL DISTRIBUTION (millions of Euros)
% % %
Liguria 10,451.9 81.9% 9,883.8 79.8% 9,516.0 83.8%Latium 554.7 4.3% 589.9 4.8% 136.7 1.2%Piedmont 407.7 3.2% 382.8 3.1% 377.6 3.3%Lombardy 407.3 3.2% 580.3 4.7% 652.6 5.8%Sicily 370.2 2.9% 365.6 3.0% 249.3 2.2%Emilia Romagna 180.9 1.4% 166.3 1.3% 173.9 1.5%Marches 107.1 0.8% 121.4 1.0% - - Veneto 106.7 0.8% 115.0 0.9% 108.0 1.0%Apulia 94.7 0.7% 97.6 0.8% 97.0 0.9%Umbria 32.4 0.3% 40.0 0.3% - - Sardinia 30.4 0.2% 21.3 0.2% 11.4 0.1%Tuscany 15.9 0.1% 15.2 0.1% 15.5 0.1%Total Italy 12,759.9 99.9% 12,379.2 99.9% 11,338.0 99.9%Abroad 7.2 0.1% 7.6 0.1% 10.9 0.1%Total indirect deposits 12,767.1 100.0% 12,386.8 100.0% 11,348.9 100.0%
31/12/03 31/12/0131/12/02
Total lending at 30th June 2003 reached12,050 million, an increase of 0.8% over year-end 2002 and one of 11.3% over twelvemonths. The annual rise was regardless of thecontribution of the ex-Capitalia branches(+6.7%).Lending to customers amounted to 8,762.7million, an increase of 1.8% over 31st
December 2002. Before value adjustments,lending to customers amounted to 9,247.1million, up 7.1% in comparison to the end of2002. After adjustments for expected losses, thetotal drops to 9,103.2 million (+6.9% in annualterms).With regards to maturities, there was return tomedium/long-term solutions: at the end of2003, this segment represented 62.4% of thetotal, up 9.9% to 5,771.2 million. Short-termlending, in contrast, (34.3% of the total)remained stable at 3,173.4 million (+0.8%).On the basis of an analysis by lending product,significant growth was recorded by the Bank’sReal Estate, Public Works and Mortgages, andParabanking Divisions. The Commercial CreditDivision, however, ended the year with a fall inits short-term lending; the Industrial andAgricultural Credit Division recorded a slightincreased in its lending solutions.The Commercial Credit Division, offeringshort-term lending solutions also in currency,recorded a 4.7% fall to 3,603.8 million. Thisresult stems from a drop in current accountlending (1,318.1 million; -4.4%), discountingbills (271.6 million; -16%) and other lending
forms (1,988.4 million; -3.3%). The Divisionaccounted for 39% of total credits granted at31st December 2003.The Real Estate, Public Works andMortgages Division, operating in the field ofmortgages and funding for public bodies,recorded a 20.5% increase to 3,326.3 million.In particular, mortgages to households playedan important part spurred by the present all-timelow in mortgage rates. With regards to this,Carige has vigorously promoted its mortgagepackage (so-called ’mortgage with a ceiling’),which offers customers protection againstdifficulties associated with interest rate rises byfixing a maximum mortgage instalment ceiling.The Division accounts for 36% of the Bank’stotal lending.The Industrial and Agricultural CreditDivision handles medium to long-termfinancing to firms. Its year-end result was1,080.2 million, 11.7% of total lending. TheDivision’s result represented a decrease annuallyof 2.1%.The Parabanking Division, offering financelease, factoring and consumer credit solutions,recorded a yearly increase of 8.4%. TheDivision’s total amounted to 777.7 million,8.4% of total lending. This increase was spurredin particular by finance lease activity that roseduring the year by 9.7% to 674.3 million.Factoring rose by 3.1% to 99.2 million, whilstconsumer credit remained unchanged at 4.2million.

26
With regards to activity in the field of financeleases, despite the rise recorded for the year, theresult represents a downturn after several yearsof positive results. In comparison to 2002, boththe number of transactions and volumes handledfell. Overall, during 2003, 903 contracts weresigned (-26.8% in comparison to 2002) for atotal related amount of 155.2 million (-35.2% incomparison to 2002), of which 8.9 and 8.1million refer to contracts originally stipulated byBanca del Monte di Lucca and Cassa diRisparmio di Savona, respectfully. Thecontraction can be put down to extraordinaryincreases recorded in 2002 following theincentives contained in the Tremonti Law.System-wide results confirm a general fall in allareas of finance leases with a reduction in newinvestments in terms of around 16% incomparison to 2002, especially in the propertysector.Factoring also recorded a contraction inbusiness despite an overall increase in relatedamounts. In particular, there was a decrease in
both the number of contracts stipulated (-26.4%)and related amounts (-22.9% to 87 million).Outstanding amounts on invoices held by theBank at 31/12/03 totalled 307.6 million. Totalturnover (total invoice amounts for the year) wasdown 17.9% to 335.3 million.There was a fall in the number of consumercredit contracts granted during the year. Thetotal for 2003 was 598 in comparison to 779 in2002. There was, however, an increase in theamounts granted of 42.5%, bringing the total to3.1 million. Agreements with dealers operatingin new market segments in addition to enablingthe penetration of new markets, generated anincrease in the average amount of creditrequested along with a diversification incustomer type. Cross selling opportunities in thisare being studied.Other lending forms rose significantly(81.9%) to 156.6 million determined byinvestments made in interest-bearing postalcoupons, which rose from 37 to 112 million.

27
LENDING (millions of Euros)
31/12/03 30/9/03 31/12/02 31/12/01 2003 2002
Total (a+b+c) 12,168.7 12,386.6 11,953.4 10,910.7 1.8 9.6
Loans to customers (a) 9,103.2 8,687.4 8,515.3 7,362.5 6.9 15.7-Gross value (1) 9,247.1 8,830.4 8,634.9 7,471.2 7.1 15.6 . Commercial Credit 3,603.8 3,506.2 3,780.4 3,140.6 - 4.7 20.4 . Real estate and Public Works mortgages 3,326.3 3,114.6 2,759.8 2,020.4 20.5 36.6 . Industrial and Agricultural credits 1,080.2 1,016.3 1,057.7 1,018.6 2.1 3.8 . Parabanking (2) 777.7 754.3 715.2 520.6 8.7 37.4 . Others 156.6 152.7 86.1 570.6 81.9 -84.9
-short term loans 3,173.4 3,027.4 3,149.4 3,298.4 0.8 -4.5 % Gross value 34.3 34.3 36.5 44.1 -long term loans 5,771.2 5,516.7 5,249.8 3,972.4 9.9 32.2 % Gross value 62.4 62.5 60.8 53.2
. Bad loans 302.5 286.3 235.7 200.4 28.3 17.6 % Gross value 3.3 3.2 2.7 2.7
-Specific allowances for loan losses (-) 143.9 143.0 119.6 108.7 20.3 10.0
Loans to banks (b) 938.8 1,377.9 1,355.7 1,114.9 - 30.8 21.6-Gross value 942.7 1,386.8 1,363.6 1,122.3 - 30.9 21.5 . Compulsory reserves 102.4 56.9 143.8 97.2 - 28.8 47.9 . Deposits 730.0 1,018.9 1,024.3 785.7 - 28.7 30.4 . Overdraft facilities 71.5 35.7 82.6 94.0 - 13.4 -12.1 . Repurchase agreements - 21.8 19.5 - - 100.0 … . Other loans 21.3 231 71.7 145.4 - 70.3 -50.7
. Bad loans 17.5 22.5 21.7 - - 19.4 … % Gross value 1.9 1.6 1.6 -
-Specific allowances for loan losses (-) 3.9 8.9 7.9 7.4 - 50.6 6.8
Securities (c) 2,126.7 2,321.3 2,082.4 2,433.3 2.1 -14.4-Government securities 1,061.3 1,489.4 1,230.2 1,325.3 - 13.7 -7.2-Other securities 887.5 655.1 679.3 1,014.8 30.6 -33.1-Shares and equity securities 177.9 176.8 172.9 93.2 2.9 85.5
(1) Including bad loans.
(2) Amount includes lease assets stated at Balance Sheet caption 100.
Change %
28
0
1,000
2,000
3,000
4,000
5,000
6,000
7,000
8,000
9,000
10,000
2001 2002 2003
LOANS TO CUSTOMERS (millions of Euros)
Parabanking
Industrial and Agricultural credit
Real estate and Public Worksmortages
Other loans
7,471
8,635
9,247
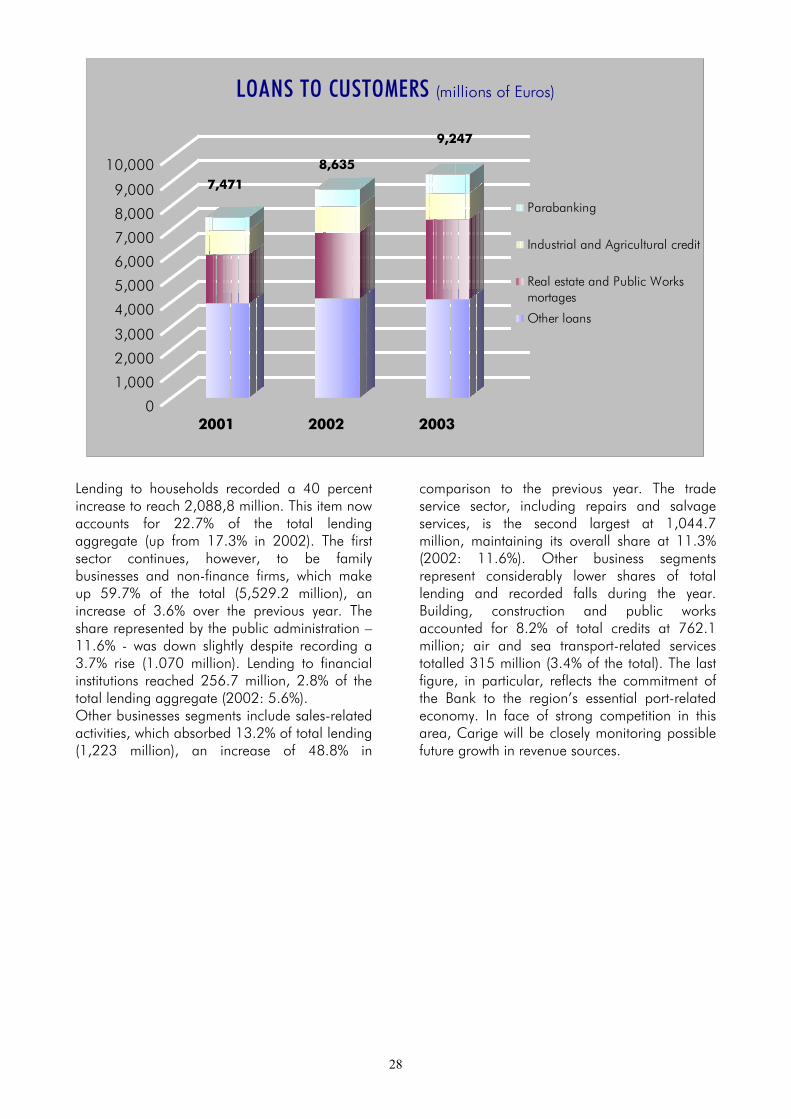
Lending to households recorded a 40 percentincrease to reach 2,088,8 million. This item nowaccounts for 22.7% of the total lendingaggregate (up from 17.3% in 2002). The firstsector continues, however, to be familybusinesses and non-finance firms, which makeup 59.7% of the total (5,529.2 million), anincrease of 3.6% over the previous year. Theshare represented by the public administration –11.6% - was down slightly despite recording a3.7% rise (1.070 million). Lending to financialinstitutions reached 256.7 million, 2.8% of thetotal lending aggregate (2002: 5.6%).Other businesses segments include sales-relatedactivities, which absorbed 13.2% of total lending(1,223 million), an increase of 48.8% in
comparison to the previous year. The tradeservice sector, including repairs and salvageservices, is the second largest at 1,044.7million, maintaining its overall share at 11.3%(2002: 11.6%). Other business segmentsrepresent considerably lower shares of totallending and recorded falls during the year.Building, construction and public worksaccounted for 8.2% of total credits at 762.1million; air and sea transport-related servicestotalled 315 million (3.4% of the total). The lastfigure, in particular, reflects the commitment ofthe Bank to the region’s essential port-relatedeconomy. In face of strong competition in thisarea, Carige will be closely monitoring possiblefuture growth in revenue sources.

29
LOANS TO CUSTOMERS (1) - DISTRIBUTION BY SECTOR (millions of Euros)
% % %
Public Administration 1,070.0 11.6% 1,032.2 12.0% 892.8 11.9%Financial institutions 256.7 2.8% 485.1 5.6% 856.7 11.6%Non-financial and personal businesses 5,529.2 59.7% 5,335.2 61.8% 4,471.7 59.8%
Agriculture, farming and fishing 77.7 0.8% 87.6 1.0% 78.1 1.0%Energy products 201.6 2.2% 224.3 2.6% 164.2 2.2%Mineral and ferrous metals and non ferrous 99.0 1.1% 120.9 1.4% 98.2 1.3%Mineral and non metallic products 88.8 1.0% 87.0 1.0% 88.4 1.2%Chemical products 56.7 0.6% 58.0 0.7% 49.3 0.7%Metal products 184.0 2.0% 149.4 1.7% 124.7 1.7%Agricultural and industrial machinery 133.0 1.4% 149.2 1.7% 149.5 2.0%Office equipment 27.6 0.3% 29.1 0.3% 27.3 0.4%Electrical supplies 89.3 1.0% 104.0 1.2% 108.2 1.4%Means of transport 66.6 0.7% 85.7 1.0% 86.9 1.2%Food, drink, tobacco 198.5 2.1% 167.7 1.9% 132.5 1.8%Textiles, leather goods, clothing 88.2 1.0% 77.0 0.9% 64.6 0.9%Paper, printing and publishing 69.1 0.7% 69.0 0.8% 59.4 0.8%Rubber and plastic goods 51.5 0.6% 60.4 0.7% 50.4 0.7%Other industrial products 97.0 1.0% 95.2 1.1% 84.2 1.1%Building and public works 762.1 8.2% 895.5 10.4% 801.2 10.7%Wholesale & retail trade, salvage and repairs 1,044.7 11.3% 998.4 11.6% 877.7 11.7%Hotel and catering services 255.7 2.8% 255.3 3.0% 188.5 2.5%Transport services 129.1 1.4% 120.9 1.4% 106.9 1.4%Air and sea transport-related services 315.0 3.4% 378.9 4.4% 309.5 4.1%Transport-related services 258.3 2.8% 240.0 2.8% 173.2 2.3%Communications-related services 12.7 0.1% 60.0 0.7% 7.2 0.1%Sales-related services 1,223.0 13.2% 821.7 9.5% 641.6 8.6%
Private social bodies 30.2 0.3% 28.5 0.3% 21.7 0.3%Families 2,088.8 22.7% 1,492.1 17.3% 1,099.5 14.7%Total residents 8,974.9 97.1% 8,373.1 97.0% 7,342.4 98.3%Rest of the world 272.2 2.9% 261.8 3.0% 128.8 1.7%Total 9,247.1 100.0% 8,634.9 100.0% 7,471.2 100.0%
(1) Balance Sheet (Assets) caption 40 inclusive of expected losses and financial lease.
31/12/03 31/12/02 31/12/01
Liguria absorbs 62.8% of total credits, areduction on the percentages recorded in 2001(70.7%) and 2002 (63.7%). The year sawsignificant increases in the lending share ofLombardy (+13.4% ) and Latium (4.1%), withless significant expansion in Sardinia (+0.8%).
The share of Emilia Romagna (6%), Veneto(1.6%) and Marches (1.3%) actually fell. Otherregions recorded little or no change in theirshare: Piedmont (5.2%), Sicily (1.8%), Umbria(0.9%), Apulia (0.8%), and Tuscany (0.4%).

30
LOANS TO CUSTOMERS (1) - GEOGRAPHIC DISTRIBUTION (millions of Euros)
31/12/02% % %
Liguria 5,788.2 62.8% 5,505.5 63.7% 5,279.4 70.7%Lombardy 1,242.0 13.4% 1,049.6 12.1% 803.4 10.8%Emilia Romagna 556.4 6.0% 542.7 6.3% 522.9 7.0%Piedmont 484.0 5.2% 454.7 5.3% 427.4 5.7%Latium 379.2 4.1% 315.7 3.7% 74.1 1.0%Sicily 166.1 1.8% 155.0 1.8% 96.3 1.3%Veneto 146.6 1.6% 165.3 1.9% 102.1 1.4%Marches 122.1 1.3% 134.8 1.6% - - Umbria 82.4 0.9% 94.9 1.1% - - Apulia 78.5 0.8% 61.5 0.7% 46.9 0.6%Sardinia 74.7 0.8% 41.7 0.5% 15.3 0.2%Tuscany 40.0 0.4% 40.3 0.5% 41.1 0.6%Total Italy 9,160.2 99.1% 8,561.7 99.2% 7,408.9 99.2%Abroad 86.9 0.9% 73.2 0.8% 62.3 0.8%Total loans to customers 9,247.1 100.0% 8,634.9 100.0% 7,471.2 100.0%
(1) Balance Sheet (Assets) caption 40 inclusive of expected losses and leasing.
31/12/03 31/12/01
At the end of 2003, Banca Carige had onesubstantial loan exposure totalling 150 million.The proportion of loans concentrated amongstthe first 50 lending exposures was 22.9%considered singly (down on 2002) and 25.9%when group connections are taken into account.At the end of the year lending to customersamounting to 669.1 million was covered byswap and option contracts.Lending to banks after value adjustmentsamounted to 942.7 million, down 30.9% incomparison to the figure recorded at the end of2002. These falls were related to nearly allcomponents. Deposits represents the largestcomponent at 730 million (-28.7%). Within thelending to banks item bad loans for 17.5 millionare included, with related writedowns of 3.4million. Other credits at risk amounted to 0.8million, written down by 0.5 million.The difference between interbank lending anddeposits at 31/12/03 showed a balance infavour of the latter of 196.9 million, a sharpdrop on the previous year’s figure of 433.7million. This result is due to greater growth indeposits in comparison to customer lending aswell as the result of the share capital increasecarried out during the year.Further details are given in part B (sections 1and 11) of the explanatory notes sectionsThe Bank’s securities portfolio at 31st December2003 totalled 2,126.7 million, an increase of2.1% in comparison to the end of 2002.
At 30/12/03, bonds, the principal instrument inportfolio, totalled 1,948.8 million, an increaseof 2.1% in comparison to the end of 2002. Theshare component (shares, equity investmentsand funds) totalled 177.9 million, an increase of2.9%.The trading portfolio totalled 1,953 million, ofwhich 544.5 million is covered by derivatives.The investment portfolio is regulated byConsob’s communication of 15/2/95 and theBank of Italy’s letter of 1/3/95 in addition to theBoard of Directors’ deliberation of 27/3/95,later modified on 6/12/99. The portfolio’s totaldropped to 173.7 million (-25.4%) following theExecutive Committee’s decision of 28th October2003 to utilise certain securities in order to offsetthe impact on liquidity stemming fromexpansionary measures carried out by the Bankduring the year.Losses on the securities portfolio totalled 6.4million, of which 3.6 million are related to debtsecurities and 2.8 million to capital securitiesand funds. This figure is considerably lower thanthat recorded in 2002 (18.2 million). Thesefigures are recorded at income statementcaption 60 “gains and losses on financialtransactions”. Related writebacks amounting to0.8 million are stated at the same caption.The securities portfolio also presents potentialcapital gains of 53.3 million, of which 45.1million refers to hedging derivatives contracts;potential losses of 0.3 million are related to theinvestment securities portfolio.

31
The notional value of outstanding derivativescontracts amounted to 6,200.9 million, up27.5% in comparison to December 2002.Derivatives usage is principally in the form ofswaps (73.3%) and index and rate options(17.6%). Other contract forms represent theremainder: securities options (3%), creditderivatives (3.5%), currency options (1.8%), andfutures (0.3%). Of the total, 11.6% is in the formof exchange contracts, the rest to contracts withno capital exchange amounting to 5,483.9million. Hedging contracts amount to 3,132.5million, an increase of 35.7% over 2002. Thesecontracts represent 50.5% of the total (2002:47.4%). Balanced contracts with risk exposurefor the Bank in terms of exchange and interest
rate totalled 893.5 million, 18.6% down on2002.Swaps amounted to 4,543.9 million (+24%)and represent around 75.% of the aggregatetotal; index and rate options come next, at1,091.5 million, an increase of 48% incomparison to the year before. Residualamounts are principally in the form of securitiesoptions which almost doubled to 219.5 millionfollowing the inclusion of hybrid convertiblesubordinate bonds totalling 102.1 million issuedin relation to the share capital increase carriedout during the year; the remaining contract type- derivatives on credits – fell 25.5% to 215million.
DERIVATIVES CONTRACTS (millions of Euros)
Principal (1) 31/12/03 30/9/03 31/12/02 31/12/01 2003 2002
- Forwards (2) - - - 45.0 - - 100.0 - Swaps (3) 4,543.9 4,691.2 3,665.7 2,388.7 24.0 53.5 - Futures 21.4 6.7 - 323.5 … - 100.0 - Securities options 219.5 104.5 113.0 475.8 94.2 - 76.3 - Interest-rate and index options (4) 1,091.5 1,216.0 737.6 121.0 48.0 509.6 - Exchange rate options 109.6 234.0 58.9 388.3 86.1 - 84.8 - Credit default products 215.0 227.7 288.5 139.6 - 25.5 106.7Total 6,200.9 6,480.1 4,863.7 3,881.9 27.5 25.3 - with exchange of principal 717.0 728.2 617.7 805.8 16.1 - 23.3 - without exchange of principal 5,483.9 5,751.9 4,246.0 3,076.1 29.2 38.0
- hedging 3,132.5 3,224.2 2,307.7 1,670.6 35.7 38.1 - trading 3,068.4 3,255.9 2,556.0 2,211.3 20.0 15.6 * balanced contracts (5) 2,174.9 2,351.0 1,458.1 1,515.9 49.2 - 3.8 * open-ended contracts (6) 893.5 904.9 1,097.9 695.4 - 18.6 57.9(1) Principal relative to basis swaps is stated once.(2) Includes forward rate agreements.(3) Includes basis swaps, interest rate swaps, overnight indexed swaps and cross currency swaps.(4) Includes interest rate caps.(5) Contracts matched by contracts of same characteristics so giving the Bank full cover against interest and exchange-rate risk.(6) Contracts entailing exposure to interest and exchange-rate risk.
Change %

32
DERIVATIVES CONTRACTS AT 31/12/2003 ( millions of Euro )
Hedging Trading Total"balanced "open-ended Total
Principal (1) contracts" (5) contracts" (6)
- Forwards (2) - - - - - - Swaps (3) 2,386.8 1,641.6 515.5 2,157.1 4,543.9 - Futures - - 21.4 21.4 21.4 - Securities options 117.0 - 102.5 102.5 219.5 - Interest-rate and index options (4) 618.7 423.7 49.1 472.8 1,091.5 - Exchange-rate options - 109.6 - 109.6 109.6 - Credit default products 10.0 - 205.0 205.0 215.0Total 3,132.5 2,174.9 893.5 3,068.4 6,200.9 - with exchange of principal 284.2 109.6 323.2 432.8 717.0 - without exchange of principal 2,848.3 2,065.3 570.3 2,635.6 5,483.9
(1) Principal relative to basis swaps is stated once.(2) Includes forward rate agreements.(3) Includes basis swaps, interest rate swaps, overnight indexed swaps and cross currency swaps.(4) Includes interest rate caps.(5) Contracts matched by contracts of same characteristics so giving the Bank full cover against interest and exchange-rate risk.(6) Contracts entailing exposure to interest and exchange-rate risk.
Derivatives-related losses and gains of,respectively, 0.8 and 2.5 million were recorded.Non-recorded gains amounted to 76.4 million,of which 0.9 million relates to hedging contractson the trading securities portfolio; non-recordedcapital losses totalled 125.6 million, of which43.4 million stemming from hedging derivativesrelating to the trading securities portfolio and46.6 million from other hedging contracts.
Counterparties for the derivatives contracts areexclusively primary banks or finance companies.Specific provisions for counterparty risk weretherefore not made. No derivatives-generatedlosses on credits were recorded during the yearas in past years.Further details are given in the explanatory notessection 10, part B and section 3, part C.
DERIVATIVES CONTRACTS: WRITEDOWNS AND REVALUATIONS(millions of Euros)
Writedowns Revaluations
1. Trading contracts 0.3 2.21.1 Non-quoted trading contracts 0.1 2.2 - Forward - - - Swaps - 2.1 - Options - - - Credit default products 0.1 0.11.2 Quoted trading contracts 0.2 - - Futures 0.2 - - Options - - 2. Non-quoted hedging contracts 0.5 0.3 - Swaps 0.5 0.2 - Options - 0.1 - Credit default products - - Total 0.8 2.5
Total risk aggregates (cash credits andguarantees) amounted to 558.2 million afterwritedowns of 56.9 million (2002: 48.9 million),
an increase of 17.2%. In the face of this rise,there were increased writedowns on capital andinterest of 89.5 million, which, excluding

33
writebacks of 4.1 million and expected losses of69.3 million led to an increase in total expectedlosses from 130.5 to 152.3 million (+16.7%).
Expected losses represent 27.5% of the total riskaggregate.
CREDITS AT RISK AND TOTAL ALLOWANCES ( thousands of Euros )
31/12/03 30/9/03Cash Guarantees and Leased Total Cash Guarantees and Leased Total
credits commitments assets credits commitments assets
Bad loans 319,942 8,849 - 328,791 308,802 9,249 - 318,051Watchlists 185,617 9,607 - 195,224 184,043 8,056 - 192,099Country risk 12,340 5 - 12,345 12,397 617 - 13,014Rescheduled loans 14,123 - - 14,123 10,778 - - 10,778Bad leased assets - - 7,732 7,732 - - 6,170 6,170Total credits at risk 532,023 18,461 7,732 558,216 516,020 17,922 6,170 540,112
Specific allowances 147,752 2,787 2,898 153,437 152,003 2,380 ### 155,800
- Total allowances 165,752 2,787 2,898 171,437 165,003 2,380 1,417 168,800 - Specific allowances for loan losses 147,752 - - 147,752 152,003 - - 152,003 - Specific allowances for guarantees and commitments - 2,787 - 2,787 - 2,380 - 2,380 - Specific allowances for leased assets - - 2,898 2,898 - - 1,417 1,417 - General allowances for loan losses 18,000 - - 18,000 13,000 - - 13,000
31/12/02 31/12/01Cash Guarantees and Leased Total Cash Guarantees and Leased Total
credits commitments assets credits commitments assets
Bad loans 257,449 12,153 - 269,602 200,452 5,402 - 205,854Watchlists 162,974 9,581 - 172,555 158,453 11,808 - 170,261Country risk 19,390 687 - 20,077 35,086 1,575 - 36,661Rescheduled loans 9,315 - - 9,315 7,902 - - 7,902Bad leased assets - - 4,698 4,698 - - 1,867 1,867Total credits at risk 449,128 22,421 4,698 476,247 401,893 18,785 1,867 422,545
Specific allowances 127,555 2,516 459 130,530 116,134 2,782 430 119,346
Total allowances 140,555 2,516 459 143,530 121,299 2,782 430 124,511 - Specific allowances for loan losses 127,555 - - 127,555 116,134 - - 116,134 - Specific allowances for guarantees and commitments - 2,516 - 2,516 - 2,782 - 2,782 - Specific allowances for leased assets - - 459 459 - - 430 430 - General allowances for loan losses 13,000 - - 13,000 5,165 - - 5,165
Total cash credits at risk amounted to 532million, an increase of 18.5% over the previousDecember’s figure of 449.1 million. The rise isdue to increases in bad loans (+62.5 million;+24.3%), of which 32.3 million refers to threepositions, one previously categorised as aperforming credit, the other two as watchlists.Guarantees and commitments totalled overall
18.5 million (-17.7%); the decrease was due toa fall in minor bad loan positions from 12.2 to8.8 million relating to improvements in oneexposure.Bad lease contracts rose from 4.7 million in2002 to 7.7 million.

34
CASH CREDITS AT RISK (thousands of Euros)
31/12/03 30/9/03Gross Specific Net book % Gross Specific Net book %value allowances value value allowances value(a) (b) (b/a) (a) (b) (b/a)
Bad loans - customers 302,487 125,123 177,364 41.4 286,258 124,154 162,104 43.4 - banks 17,455 3,383 14,072 19.4 22,544 8,472 14,072 37.6Watchlists - customers 184,825 16,501 168,324 8.9 183,188 16,783 166,405 9.2 - banks 792 513 279 64.8 855 513 342 60.0Country risk - customers 11,306 - 11,306 - 11,920 - 11,920 - - banks 1,034 - 1,034 - 477 - 477 - Rescheduled loans - customers 14,123 2,232 11,891 15.8 10,778 2,081 8,697 19.3Total cash credits at risk 532,023 147,752 384,271 27.8 516,020 152,003 364,017 29.5 - customers 512,741 143,856 368,885 28.1 492,144 143,018 349,126 29.1 - banks 19,281 3,896 15,385 20.2 23,876 8,985 14,891 37.6Performing loans 9,657,808 - 9,657,808 - 9,701,198 - 9,701,198 - - customers 8,734,357 - 8,734,357 - 8,338,238 - 8,338,238 - - banks 923,451 - 923,451 - 1,362,960 - 1,362,960 -Total loans 10,189,830 147,752 10,042,078 1.4 10,217,218 152,003 10,065,215 1.5 - customers 9,247,098 143,856 9,103,242 1.6 8,830,382 143,018 8,687,364 1.6 - banks 942,732 3,896 938,836 0.4 1,386,836 8,985 1,377,851 0.6
31/12/02 31/12/01Gross Specific Net book % Gross Specific Net book %value allowances value value allowances value(a) (b) (b/a) (a) (b) (b/a)
Bad loans - customers 235,729 101,650 134,079 43.1 200,452 89,930 110,522 44,9 - banks 21,720 7,648 14,072 35.2 - - - - Watchlists - customers 162,529 15,825 146,704 9.7 158,453 16,940 141,513 10.7 - banks 445 267 178 60.0 - - - 0.0Country risk - customers 18,423 - 18,423 - 12,495 344 12,151 2.8 - banks 967 - 967 - 22,591 7,426 15,165 32.9 Rescheduled loans - customers 9,315 2,165 7,150 23.2 7,902 1,494 6,408 18.9Total cash credits at risk 449,128 127,555 321,573 28.4 401,893 116,134 285,759 28.9 - customers 425,996 119,640 306,356 28.1 379,302 108,708 270,594 28.7 - banks 23,132 7,915 15,217 34.2 22,591 7,426 15,165 32.9Performing loans 9,549,353 - 9,549,353 - 8,191,559 - 8,191,559 - - customers 8,208,903 - 8,208,903 - 7,091,849 - 7,091,849 - - banks 1,340,450 - 1,340,450 - 1,099,710 - 1,099,710 -Total loans 9,998,481 127,555 9,870,926 1.3 8,593,452 116,134 8,477,318 1.4 - customers 8,634,899 119,640 8,515,259 1.4 7,471,151 108,708 7,362,443 1.5 - banks 1,363,582 7,915 1,355,667 0.6 1,122,301 7,426 1,114,875 0.7
Expected losses derive from an analyticalvaluation of bad loans, restructured credits,credits implicit in lease contracts, and significantwatchlist positions. Remaining watchlists areevaluated according to the lump-sum analysisapplied to expected losses.During the year, total provisions of 62.7 millionwere made inclusive of related writebacks.The single risk-type categories are analysed indetail below:
- bad loans rose to 328.8 million, of which302.5 million refers to cash credits to customers,17.5 million relating to cash credits granted tobanks, and 8.8 million relative to commitments.The aggregate rose 22% over December 2002following expansion in the cash creditscomponent. Parmalat Group bad loans accountfor 22.7 million, of which 13.3 million are in theform of unsecured credits and 9.4 million are inthe form of self-liquidating credits. Cash creditswere written down by 40.2%, whilst 31.5% of
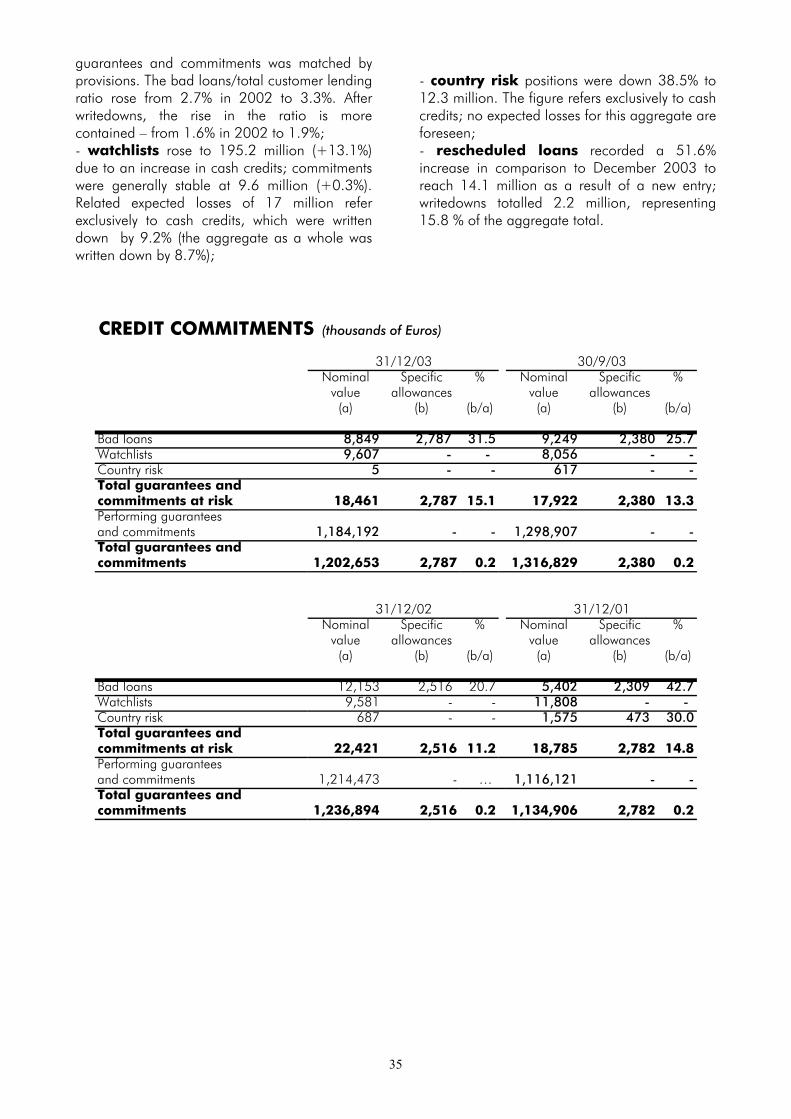
35
guarantees and commitments was matched byprovisions. The bad loans/total customer lendingratio rose from 2.7% in 2002 to 3.3%. Afterwritedowns, the rise in the ratio is morecontained – from 1.6% in 2002 to 1.9%;- watchlists rose to 195.2 million (+13.1%)due to an increase in cash credits; commitmentswere generally stable at 9.6 million (+0.3%).Related expected losses of 17 million referexclusively to cash credits, which were writtendown by 9.2% (the aggregate as a whole waswritten down by 8.7%);
- country risk positions were down 38.5% to12.3 million. The figure refers exclusively to cashcredits; no expected losses for this aggregate areforeseen;- rescheduled loans recorded a 51.6%increase in comparison to December 2003 toreach 14.1 million as a result of a new entry;writedowns totalled 2.2 million, representing15.8 % of the aggregate total.
CREDIT COMMITMENTS (thousands of Euros)
31/12/03 30/9/03Nominal Specific % Nominal Specific %
value allowances value allowances(a) (b) (b/a) (a) (b) (b/a)
Bad loans 8,849 2,787 31.5 9,249 2,380 25.7Watchlists 9,607 - - 8,056 - - Country risk 5 - - 617 - - Total guarantees andcommitments at risk 18,461 2,787 15.1 17,922 2,380 13.3Performing guaranteesand commitments 1,184,192 - - 1,298,907 - - Total guarantees andcommitments 1,202,653 2,787 0.2 1,316,829 2,380 0.2
31/12/02 31/12/01Nominal Specific % Nominal Specific %
value allowances value allowances(a) (b) (b/a) (a) (b) (b/a)
Bad loans 12,153 2,516 20.7 5,402 2,309 42.7Watchlists 9,581 - - 11,808 - - Country risk 687 - - 1,575 473 30.0Total guarantees andcommitments at risk 22,421 2,516 11.2 18,785 2,782 14.8Performing guaranteesand commitments 1,214,473 - … 1,116,121 - - Total guarantees andcommitments 1,236,894 2,516 0.2 1,134,906 2,782 0.2

36
ALLOWANCES AND WRITE OFFS AGAINST LENDING RISKS(thousands of Euros)
31/12/03 31/12/02 31/12/01PATRIMONIAL AND ECONOMIC ASSETSTotal credits at risk Closing balances 558,216 476,247 422,545 Year's net change 81,969 53,702 71,801 Write offs 69,308 (3) 61,338 (3) 50,560 (3) Year's gross change 151,277 115,040 122,361Reserves for loan losses - Caption 90 Opening balances 13,000 5,165 5,165 - provisions (+) 18,000 13,000 2,433 - utilizations (-) 13,000 5,165 2,433 - other changes (-) - - - Closing balances 18,000 13,000 5,165Allowances and write offs Allowances (a) 153,437 130,530 119,346 Write offs 69,308 (3) 61,338 (3) 50,560 (3) Total allowances and write offs (b) 222,745 191,868 169,906Allowances and write offs of the year 92,215 72,522 57,755 ((b) - (a) of the previous year)COVERING OF ALLOWANCES AND WRITE OFFS OF THE YEARIncome statement 65,039 55,253 45,124 Caption 100 - Provisions for risk and charges (leasing) (+) 2,440 29 - Caption 120 - Provisions (+) (1) 66,699 (3) 59,578 (3) 48,178 (3) Caption 130 - Recoveries (-) (2) 4,100 4,354 3,054Withdrawals from income statement 14,176 12,103 9,676 Irrecoverable interest on overdue loans (+) 14,176 12,103 9,676Income statement of the previous years 13,000 5,165 2,955 Utilization of general allowances for loan losses - caption 90 (+) 13,000 5,165 2,433 Other changes (-) - - - 522 (4)Total 92,215 72,521 57,755(1) Caption 120 for 31/12/03, 31/12/02 and 31/12/01 includes exchange-translation differences, respectively, of 82,000, 91,000 and 24,000 Euros
stemming from write-downs relative to Nice branch.
(2) Caption 130 for 31/12/03, 31/12/02 and 31/12/01 excludes, respectively, 5,095,000, 5,510,000 and 2,555,000 Euros related to the ex- Tax
Collection Service and to written off credit collection.
(3) Inclusive of 12,455,000 Euros related to the securitisation of bad loans.
(4) Including 561,000 Euros in increased provisions relating to the branches acquired from IntesaBci.
Lending risk at 31st December 2003 wascalculated at 91.1 million (December 2002:72.5 million), of which 14.2 million in the formof written off interest arrears. The remainingamount can be broken down as follows:- 66.7 million refers to writedowns recorded
at income statement caption 120, of which12.1 million relates to the Parmalat Group,which, in turn, accounts for 53% of this totalafter a 75% write down on unsecured credits
and a 25% writedown on self-liquidatingpositions;
- 4.1 million refers to writebacks on creditspreviously written down or written off,recorded at income statement caption 130;
- 2.4 million refers to provisions for risks andcharges recorded at income statement 100;
- 13 million refers to utilisation of the creditrisk fund, recorded at income statement 90.

37
BAD LOANS (1) - DISTRIBUTION BY SECTOR (thousands of Euros)
% % %
Public Administration 23 0.0% 21 0.0% 18 0.0%Financial institutions 13,720 4.5% 11,497 4.9% 9,472 4.7%Non-financial and personal businesses 224,088 74.1% 172,687 73.3% 145,176 72.5%
Agriculture, farming and fishing 2,735 0.9% 3,053 1.3% 3,295 1.6%Energy products - 0.0% 173 0.1% 275 0.1%Mineral and ferrous metals and non ferrous 1,550 0.5% 243 0.1% 294 0.1%Mineral and non metallic products 4,605 1.5% 3,831 1.6% 3,211 1.6%Chemical products 817 0.3% 964 0.4% 527 0.3%Metal products 8,416 2.8% 6,233 2.6% 6,070 3.0%Agricultural and industrial machinery 4,779 1.6% 6,620 2.8% 12,808 6.4%Office equipment 709 0.2% 1,346 0.6% 676 0.3%Electrical supplies 1,780 0.6% 2,660 1.1% 3,346 1.7%Means of transport 1,931 0.6% 1,036 0.4% 920 0.5%Food, drink, tobacco 30,204 10.0% 6,273 2.7% 5,621 2.8%Textiles, leather goods, clothing 5,150 1.7% 3,868 1.6% 4,065 2.0%Paper, printing and publishing 1,760 0.6% 1,011 0.4% 1,337 0.7%Rubber and plastic goods 1,676 0.6% 1,519 0.6% 1,576 0.8%Other industrial products 3,094 1.0% 2,949 1.3% 2,727 1.4%Building and public works 68,468 22.6% 64,474 27.5% 39,431 19.8%Wholesale & retail trade, salvage and repairs 47,398 15.7% 39,420 16.7% 34,147 17.0%Hotel and catering services 8,529 2.8% 7,017 3.0% 6,004 3.0%Transport services 4,239 1.4% 4,779 2.0% 4,493 2.2%Air and sea transport-related services 131 0.0% 79 0.0% 134 0.1%Transport-related services 1,983 0.7% 1,629 0.7% 843 0.4%Communications-related services 67 0.0% 219 0.1% 211 0.1%Sales-related services 24,067 8.0% 13,291 5.6% 13,165 6.6%
Private social bodies 1,809 0.6% 1,178 0.5% 1,652 0.8%Families 50,223 16.6% 38,758 16.4% 33,047 16.5%Total residents 289,863 95.8% 224,141 95.1% 189,365 94.5%Rest of the world 12,624 4.2% 11,588 4.9% 11,087 5.5%Total 302,487 100.0% 235,729 100.0% 200,452 100.0%
(1) Inclusive of expected losses.
31/12/03 31/12/02 31/12/01
Bad loans are concentrated amongst non-finance, and family businesses: 74.1% of thetotal at 224.1 million; households come nextaccounting for 16.6% of the total bad riskportfolio of the Bank at 50.2 million. Thebuilding and construction industry continues tohave the highest risk rating, representing 22.6%of the total (68.5 million). Services to trade,
salvage and repairs account for 15.7% (47.4million). In comparison to December 2002,there was little change in the share representedby single sectors. However, within the non-finance/family business sector, there was a sharpincrease in non-performing credits in the food,drink and tobacco segment, in the wake of theParmalat crisis.

38
BAD LOANS/LENDING RATIO (1) - DISTRIBUTION BY SECTOR
31/12/03 31/12/02 31/12/01
Public AdministrationFinancial institutionsNon-financial and personal businesses
- including (2):Wholesale & retail trade, salvage and repairsSales-related servicesBuilding and public worksAir and sea transport-related servicesHotel and catering services
Private social bodiesFamiliesTotal residentsRest of the worldTotal
(1) Inclusive of expected losses.(2) Principal branches of the economy in terms of overall credit exposure.
- - - 5.3% 2.4% 1.1%4.1% 3.2% 3.2%
3.9%
0.0% 0.0%
4.5%1.6%
3.9%
2.7%2.4% 2.6%
2.7%4.6% 4.4% 8.6%
2.7%
4.9%2.0% 2.1%
3.3%
3.2%
0.0%
6.0% 4.1%3.3%
9.0% 7.2%
2.7% 3.2%7.6%3.0%2.6%
The risk index of Banca Carige’s lendingportfolio measured in terms of the badloans/total lending ratio recorded an increasefrom 2.7% two years ago to 3.3%. In particular,the non-finance and family business sector wasmost at risk at 4.4%. Although private socialinstitutions, finance institutions and non-residentshave respectively higher risk ratios (6%, 5.3%,4.6%), the total bad loans for these sectorsrepresents only 0.6%, 4.5% and 4.2% of the
Bank’s total bad loans aggregate. Householdshave a risk ratio of 2.4%, whilst that of thepublic administration is practically inexistent. Thebuilding and construction industry has thehighest risk rating within the non-finance andfamily business sector at 9%, followed byservices to trade, salvage and repairs (4.5%),hotels, bars, restaurants (3.3%) and other sales-related services (2%).
BAD LOANS (1) - GEOGRAPHIC DISTRIBUTION (thousands of Euros)
31/12/02% % %
Liguria 176,249 58.3% 151,710 64.5% 117,101 58.5%Emilia Romagna 43,089 14.2% 19,911 8.4% 23,133 11.5%Piedmont 27,914 9.2% 25,642 10.9% 26,521 13.2%Lombardy 25,057 8.3% 15,621 6.6% 13,794 6.9%Sicily 6,704 2.2% 5,675 2.4% 4,447 2.2%Veneto 3,886 1.3% 852 0.4% 895 0.4%Tuscany 2,912 1.0% 2,917 1.2% 3,416 1.7%Apulia 2,362 0.8% 986 0.4% - - Latium 2,099 0.7% 809 0.3% 19 - Marches 286 0.1% - - - - Umbria 133 0.0% - - - - Sardinia 90 0.0% 60 - - - Total Italy 290,781 96.1% 224,183 95.1% 189,326 94.4%Abroad 11,706 3.9% 11,546 4.9% 11,126 5.6%Total 302,487 100.0% 235,729 100.0% 200,452 100.0%
(1) Inclusive of expected losses.
31/12/03 31/12/01

39
The collapse of the Parmalat Group had seriousconsequences on the level of bad loans in theParma area. Consequently, there was a risefrom 8.4% to 14.2% in the share of bad loans inEmilia Romagna, whilst Liguria’s share droppedfrom 64.5% to 58.3%. There were falls also inPiedmont (from 10.9% to 9.2%) and Sicily (from
2.4% to 2.2%). There were increases in badloans in Lombardy and Veneto to, respectively,8.3% and 1.3%. Credit risk in Carige’s otheroperating regions remained marginal: Tuscany1%, Apulia 0.8%, Latium 0.7%, Marches 0.1%.Risk levels were almost inexistent in Umbria andSardinia.
BAD LOANS / LENDING RATIO (1) - GEOGRAPHIC DISTRIBUTION
31/12/03 31/12/02 31/12/01
Emilia Romagna 7.7% 3.7% 4.4%Tuscany 7.3% 7.2% 8.3%Piedmont 5.8% 5.6% 6.2%Sicily 4.0% 3.7% 4.6%Liguria 3.0% 2.8% 2.2%Apulia 3.0% 1.6% - Veneto 2.7% 0.5% 0.9%Lombardy 2.0% 1.5% 1.7%Latium 0.6% 0.3% - Marches 0.2% - - Umbria 0.2% - - Sardinia 0.1% 0.1% - Total Italy 3.2% 2.6% 2.6%Abroad 13.5% 15.8% 17.9%Total 3.3% 2.7% 2.7%
(1) Inclusive of expected losses.
The sharp rise in risk levels in Emilia Romagnafollowing the Parmalat collapse is evidenced bythe bad loans/lending ratio recorded by EmiliaRomagna at the end of 2003: 7.7% incomparison to 3.7% in December 2002, thehighest risk level of any region in the Carige
network. There follows Tuscany at 7.3%,Piedmont at 5.8%, and Sicily at 4%. The otherregions are below the average ratio for the Bank(3.3%): Liguria and Apulia 3%, Veneto 2.7%,Lombardy 2%, Latium 0.6%, Marches andUmbria 0.2%, Sardinia 0.1%.

40
SERVICES, MARKETINGAND CUSTOMER PROTECTION
Banca Carige’s customer services portfolio wasdeveloped further during the year, especially in thefield of payment systems, following continuingintegration of distribution channels available to ourcustomers and corporate clients. In the FinanceArea (commissions on savings intermediation andmanagement), despite a difficult year, there wasgrowth, albeit contained.The Bank expanded its service-generated/netinterest income ratio from 53.4% to 54.3%.The number of customers, calculated on the basisof private individuals and other customers with full-legal identity, institutions, etc. with at least onecontractual relation with the Bank numbered morethan 785,000 at 31st December 2003; 93% of thistotal was made up by private individuals.The number of customer contracts amounted tomore than 600, of which 521,000 (86% of thetotal) in the form of varying types of depositaccounts (current accounts, deposit accounts, cashbonds, certificates of deposit). The remaining84,000 (14% of the total) was in the form oflending agreements.Within savings management (mutual funds,securities management, fund management andbancassurance products) the main event of the yearwas marked by the launch of Carige’s ownmanager trust, Carige Asset Management SGR,into which progressively all asset managementactivities of Carige, Cassa di Risparmio di Savona,Banca del Monte di Lucca and Cassa di Risparmiodi Carrara will be directed, in addition to thesecurities portfolio management of the Group’sbanking and insurance subsidiaries.Savings products offered to our customers reflectthe need for high levels of capital protection, whilstat the same time offering the possibility of attractiveearnings at the moment of an upturn in the market.Within assets under management, new lines weremade available: ‘Traguardo Sicuro’, offeringguaranteed capital at maturity or, in the event offavourable market performance, 80% of themaximum value reached during the life of theproduct; the new fund line ‘Easy’, which offers fourinvestment lines ranging from low to medium levelsof risk. The line offers high accessibility to retailcustomers, in particular, thanks to flexible initial
payments. With regards to mutual funds, placementbegan of a new capital protected fund managed byEptafund SpA, ‘Epta Protezione 95’ .Bancassurance premiums were down 1.7% to137.1 million in comparison to the previous year.The principal source of premiums continues to belife assurance (133.2 million; 97.1% of the total),within which index-linked premiums doubled incomparison to 2002 to reach 68.8 million. Withregards to this product, during 2003 two newindex-linked policies were distributed to ourcustomers: ‘Carige Index Reddito e Garanzia’ and‘Carige Index Euro/Dollar 095’. There was a drop,however, in other life assurance products such as‘Risparmio Assicurato’ (27 million; -15.5%),‘Gestilink’ (26 million; -9.6%), and ‘Carige Unit3G’ (8.5 million; -76.7%).Turning to accident insurance, despite an increaseof 29.8% over 2002, total premiums amount to3.9 million, still marginal at 2.9% of the total.During the year a new mortgage insurance product– ‘Mutuo 100%’ – was launched, generatingrevenues of 0.6 million. The most significant growthamongst the other products was achieved by‘Famiglia Assicurata’, which more than doubled itspremiums to 0.5 million. The car insurance product‘Auto Assicurata’ also recorded positive growthduring 2003, up 8.3% to 1.2 million.In order to improve integration between thebanking and insurance distribution networks, BancaCarige is developing its “Assurbanca Project”. Theproject aims to put in place a network made up bythe insurance subsidiaries for the distribution of theGroup’s banking/insurance products. In the lastquarter of 2003, measures were taken to increasecommercial synergies in terms of increases in thenumber of products sold to existing customers aswell as attracting new customers. Insurance agentswill have the responsibility not only to identify newmarkets, but also to promote intensely the final saleof the product and offer consultancy. Greatercollaboration between bank branches andinsurance offices will be generated thanks to state-of-the-art Internet applications, so eliminatingproblems relating to distances between insuranceoffices and bank branches.

BANCASSURANCE (thousands of Euros)
31/12/2003 31/12/2002 31/12/2001 2003 2002
Total life assurance volumes 681,178 590,942 483,174 15.3 22.3
Total premiums collected 137,122 139,562 96,538 -1.7 44.6
Life 133,176 136,522 93,290 -2.5 46.3- Carige Unit 8,513 36,610 - -76.7 …- Gestilink 26,015 28,789 58,138 -9.6 -50.5- Gestilink Plus 250 2,473 - -89.9 …- Risparmio assicurato 26,960 31,902 32,331 -15.5 -1.3- Carige Index 68,756 34,375 - 100.0 …- Vita assicurata 1,351 1,540 1,723 -12.3 -10.6- Previdenza attiva 611 701 832 -12.8 -15.7- Mutuo assicurato 720 132 266 445.5 -50.4
Accident 3,946 3,040 3,248 29.8 -6.4- Correntista sicuro 1,080 1,082 1,142 -0.2 -5.3- Auto assicurata 1,218 1,125 1,113 8.3 1.1- Casa assicurata 386 407 763 -5.2 -46.7- C/c assicurato 167 179 195 -6.7 -8.2- Famiglia Assicurata 510 247 35 106.5 605.7- Mutuo 100% 585 - - … …
Change %
With regards to marketing, a centralised bankbranch was set up to carry out all the stages thatlead to the signing of a policy in addition to thecomplete management of clients of those insuranceoffices that are not near a Carige banking branch.At December 31st 2003, there were 290 insuranceagents working in collaboration with Carige, 12%of which are also financial advisors (‘promotori’).In the field of supplementary pensions, theBank’s ‘Carige Open Pension Fund’, constituted inaccordance with Legislative decree 124/93 andfurther modifications and additions, had a total of15,533 fund members in comparison to 10,792 atthe end of 2002 (+43.9%). The fund’s assetsamounted to 45.5 million (26.3 million at the endof 2002). The fund is divided into three investmentlines. The encouraging result was achieved thanksto increased staff training in the area of pensionsand the marketing of related products.With regards to payment systems, BancaCarige has always been a leader in the field ofinnovation regarding payment instruments. Itparticipates in the Italian Banking Association’s“Progetto Microcircuito” launched in October1998, the aim of which was to adopt new anti-cloning microchip technology for debit and credit
cards and its harmonisation to EMV internationalstandards. Together with three other banks, in thefirst half of 2003 Carige was involved in the pilotphase of the project that will be later extended toall Italian banks. The project will be concluded in2007.During the first quarter, the BankPassWeb service,developed and promoted by the Italian BankingAssociation (ABI), became operational. Theobjective of the service is to increase paymentsecurity on the Internet thanks to a virtual wallet inwhich customers put their credit cards and at themoment of purchase tap in a one-off code soavoiding the use of their credit card number online.In December 2003, Carige’s EasyPay card becameavailable; this rechargeable pre-paid card can beused for cash point withdrawals in Italy and abroad,as well as for POS payments, cell phone rechargesand Internet purchases.There was a 15.1% increase in the number ofCarige ‘Bancomat’ cards, now more than 270,000in number. The number of withdrawals carried outby these cards at cash points of Carige and otherbanks rose from 10 to 11.2 million (+12.5%) for arelated amount of almost 1.6 billion. The average

42
number of withdrawals per card was 42. Thenumber of payment transactions carried out onCarige POS terminals reached around 7 million fora corresponding amount of 764 million. Creditcards belonging to the ‘CartaSì’ network rose at31/12/03 by 18.3% in number to 96,000. Thenumber of transactions performed at POS terminalsinstalled in shops and other outlets also increased,rising from 9,440 to 11,211 (+18.8%).Treasury and payment services managed bythe Bank on behalf of public bodies and companiesnumbered more than 600 at 31st December 2003.Total funds handled reached 17.4 bn with anaverage exposure of 45.4 million and an averageamount of funds deposited of 211.7 million.There was a rise both in the number (+6.7%) andvolume of financing granted againstpledged goods (+9.6%). At the end of 2002,31,000 contracts were outstanding. The year wasmarked by relative stability during the first half,followed by strong growth in the third quarterduring which the number of contracts reached32,500 in number with total amounts granted ofaround 10.9 million. The last quarter of the yearsaw a slight downturn.Carige’s foreign business (correspondentbanking, etc.) recorded 171,000 handlingtransactions with regards to sales and relatedcommissions for amounts totalling 11 billion.During the year, decentralisation towards singleterritorial areas, and some branches in the field ofguarantees and commitments, was started. Theprocess will be completed during 2004.Corporate Finance activities can be summarisedin 29 transactions, of which 4 in the form of privateequity, 11 in the form of advanced financialconsultancy, 11 project finance operations(certifications foreseen by the so-called ‘Merloni ter’law), 4 structured finance operations (finance foracquisitions, consultancy regarding significantinvestments, securitisation, restructuring), and 2traditional credit solutions.The Bank’s marketing activities concentrated onmeasures aimed at improving the supply of newproducts, services and channels.In particular, support was provided for the newmortgage lines targeted at families. Customerreaction was particularly encouraging with regardsto the 100% mortgage package ‘MutuoCentopercento’, and ‘Mutuo con il tetto’, amortgage that offers an instalment ceiling soprotecting customers against future rises in interestrates. In order to extend our customer base in this
field, especially outside Liguria, the Bankcollaborates with the mortgage portalwww.telemutuo.it.Two marketing campaigns were carried out duringthe year: one aimed at generating new customers(‘Sviluppo clienti’), the other at increasing customerfidelity via cross selling opportunities (‘Cross sellingdi sportello’). The first concentrated outside Liguriawith the offer of new products and particularlyattractive conditions above all in the field ofsavings. The objective is to increase awareness ofthe Carige brand in new or recently penetratedmarkets. The second cross selling campaign waslaunched firstly in Liguria and then in other regions.The objective is to increase the average number ofproducts owned by each customer. Specificproducts matched to customer profiles arepresented directly to customers over the counter.The distribution of two products – ‘Carige Casa’and ‘Carige Mix’ – was given particular emphasisduring the year. The first consists in a mortgagewith advantageous conditions for the purchase of ahouse along with a current account with overdraftfacilities. The second, specifically designed forareas of the country where Carige has recentlyopened branches, is a current account packagethat includes another Carige product. Bothinitiatives were supported by specific advertisingcampaigns.During 2003, a new on line service was launchedaimed specifically at our business segment; the aimof the service – Online Business – is to promoteawareness of Carige’s phone banking services.Communication with the Bank’s sales network wasimproved thanks to the creation of a specificmarketing section in Carige’s intranet site. Thesection contains the first quarter business plan,description of marketing campaigns in progressalong with details of products, their characteristicsand sales strategy.In order to provide support to the Bank’s privatebanking consultants, new groups of market makerswere set up to assist the gradual introduction ofnew private banking districts. In addition, newinitiatives are being planned to exploit legislativeincentives for the return of capital to Italy previouslyexported in the period of capital controls. Amarketing campaign aimed at executives,administrators and other bodies (also existingclients of the Bank) was also developed. Inaddition, meetings and conferences for the trainingand qualification of our staff continued during theyear in various centres of the Bank’s network

43
outside Genoa. Corporate consultants wereprovided with sales support in the area ofderivatives products.Turning to marketing activities carried out byCarige’s call centre, principally in the form ofoutbound calls, 65,000 customers were contacted.The centre’s activities focused particularly on ournew branches as well as promoting on line services.Attention was given to specific products targeted topotential customers outside Liguria.The handling of inbound calls was mainly in theform of assistance for new online customers. Inparticular, during the second half of the yearsupport for the ‘Online Business’ service recordedan average of 40 calls per day, often byappointment.Customer protection is handled by a specificcomplaints office of the Bank, which operates inclose collaboration with our legal and internalauditing offices in order to update computerrecords required by Consob. The complaints officealso manages relations with the banking industryOmbudsman and the Bank of Italy; these relationsconsist principally in responding to observationsmade by either body following a complaint madeby a customer dissatisfied by a previous reply onour part.This office was given the responsibility to managerelations with the Group’s banking customers withregards to the requirements contained in article 13of Law 675/96 (“Privacy Law”) and carry out thenecessary formalities relating to customer rightsforeseen by the above-mentioned article. Duringthe year, the policy document on data security wasupdated as required by Legislative decree196/2003.In relation to the high-profile financial difficulties ofthe Parmalat and Cirio groups, Banca Carigebehaved at all times in a correct and transparentmanner and on no occasion took part in anyconsortia organised to sell the groups’ securities orat any time had access to information regarding thefinancial condition of either group. Carige intendsto provide assistance where possible to customersin order to recover amounts invested, adhering toand /or promoting Italian banking associationinitiatives in this matter.
Activity in the field of public relations continued tofocus attention on campaigns that sponsor andpromote our operational network, support specificproducts targeted at customer segments, and whichconsolidate relations with our customers. One ofour new products launched during the year was thepre-paid card ‘Carige Easy Pay’, which has aparticularly innovative design.Expansion of the Group in the form of branchacquisitions from Capitalia and from Cassa diRisparmio di Carrara along with the openings ofnew branches was given considerable exposure inthe media.A key activity in the management of Carige’scorporate identity is in the field of culture and thearts via our well-established presence in publishing,which includes our arts and culture magazine ‘LaCasana’. The review offers an insight into theartistic and cultural heritage present in Liguria aswell as the other 11 regions that make up ouroperating network.Carige is also involved in specialised publishing:during the year there were editions of the Bank’sreviews in law and economics “Prospettivedell’Economia” and “Economia del Terziario”, incollaboration with the University of Genoa.The prestigious book prize for women writers“Rapallo-Carige” in its 19th year continued toreceive considerable attention both in the press andon television nationally and locally, giving the Bankconsiderable visibility. Another successful initiativewas ‘Museo Carige’, which over nine days gavearound 6,000 visitors to the Bank’s headquarters inGenoa, the possibility of seeing Carige’sprestigious collection of paintings and objects ofart.Promotion abroad included collaboration with theItalian Foreign, and Culture ministries in theexhibition of baroque art held at the Museum ofModern Art in Antwerp, ‘Genoa and Antwerp’.
PUBLIC RELATIONS AND THEPROMOTION OF CULTURAL, SCIENTIFIC
AND SOCIAL ACTIVITIES

44
Another significant event during the first half of theyear was the creation of a data bank of the worksof art in Carige’s possession. Each object (paintingor sculpture) has been photographed andcatalogued along with a description of its artistic,historic and economic value. The data collected willbe then made available on line so enabling avirtual tour of Carige’s collection.Carige’s publication of art and history bookscontinued during the year. Critically-acclaimedtitles include ‘Genova e la Francia’, a volumededicated to the Genoese painter Domenico Piola,and ‘Mito del Moderno’, the latter published incollaboration with the Cassa di Risparmio diGenova e Imperia FoundationDuring the same period, the cataloguing of theBank’s archives continued and work was completedon cataloguing the Binelli photo collection, whichcan now be consulted. Research into the origins ofour Bank continued with the analysis of the minutesof Board of Directors’ meetings of the ‘Monte diPietà, the institute from which the Cassa diRisparmio di Genova e Imperia originated.
The distribution of Banca Carige’s products andservices is based on an integrated multi-channeldistribution system based on three legs: traditional;remote; mobile.The traditional distribution channel is madeup by our branch network which, during the year,continued to be the object of expansion andrationalisation, the latter in the form ofreorganisation and customer segmentation with theintroduction of further private and corporatebanking districts.Banca Carige’s branch network at the end of2003 was made up by 393 branches, 202 (51.4%)in Liguria. Two new branches were opened duringthe year, one in Genoa, the other in Monza, nearMilan. The network includes one branch in Nice,France and representative offices abroad. The Bankalso has a desk at the offices of the Regione Liguriain Brussels.
Banca Carige's retail vocation was reassertedduring the first half of the year by means of a reviewof its traditional distribution network. In particular,the Bank has established business andorganisational modules specific to particularcustomer segments. The project, launched at theend of 1999, consists in a network of financialconsultants for high net-worth customers, flankedsince 2001 by corporate banking advisors for largebusinesses.In particular, the private banking consultancyservice consists of 93 advisors, in 37 operationaldistricts. Each district has a district manager towhich the advisors refer. New districts that becameoperational during the year were situated inPiedmont, Umbria,, Latium, Marches, Sicily (districtno. 2) and Emilia Romagna. The district of Bresciain Lombardy resumed operations during the year.The Corporate Consultancy Service is offeredto medium and large businesses with the aim ofoffering opportunities for businesses to achievegreater operating efficiencies, whilst at the sametime closely monitoring credit quality. At 31st
December 2003, there were 75 consultantsoperating over 36 districts situated in Liguria,Tuscany, Lombardy and, from 2003, Piedmont,Emilia Romagna and Marches.With regards to remote channels, the number offully-automated branches of the “Bancacontinua”network remained at 13, whilst the number of ATM-Bancomat cash points rose by 6 in comparison tothe end of 2002. There was considerableexpansion in the number of POS terminals installedin retail outlets: up from 9,440 in December 2002to 11,211.The need to provide our customers with access tobanking services outside the normal business hoursof branches has led to the development ofalternative channels of distribution. Carige’s online service, which includes the Internet andcall centre, allows the customer to accesinformation and carry out transactions via computeror phone. Since its launch in July 2000, the servicehas been subject to constant review andimprovement in terms of product offer, availability,and safety.
DISTRIBUTION CHANNELS ANDRESOURCE MANAGEMENT

DISTRIBUTION NETWORK
A) TRADITIONAL number Q% number Q% number Q% number Q%NORTH-WEST ITALY 268 68.2 267 68.1 266 68.0 263 76.2Liguria 202 51.4 201 51.3 201 51.4 199 57.7 - Genoa 137 34.9 136 34.7 136 34.8 134 38.8 - Imperia 27 6.9 27 6.9 27 6.9 27 7.8 - La Spezia 19 4.8 19 4.8 19 4.9 19 5.5 - Savona 19 4.8 19 4.8 19 4.9 19 5.5Lombardy 36 9.2 36 9.2 35 9.0 34 9.9Piedmont 30 7.6 30 7.7 30 7.7 30 8.7NORTH-EAST ITALY 31 7.9 31 7.9 31 7.9 31 9.0Emilia Romagna 19 4.8 19 4.8 19 4.9 20 5.8Veneto 12 3.1 12 3.1 12 3.1 11 3.2CENTRAL ITALY 39 9.9 39 9.9 39 10.0 10 2.9Latium 32 8.1 32 8.1 32 8.2 7 2.0Marches 3 0.8 3 0.8 3 0.8 - -Tuscany 3 0.8 3 0.8 3 0.8 3 0.9Umbria 1 0.3 1 0.3 1 0.3 - -SOUTH ITALY AND ISLANDS 54 13.7 54 13.8 54 13.8 40 11.6Sicily 38 9.7 38 9.7 38 9.7 30 8.7Apulia 9 2.3 9 2.3 9 2.3 5 1.4Sardinia 7 1.8 7 1.8 7 1.8 5 1.4BRANCHES ABROAD: Nice (France) 1 0.3 1 0.3 1 0.3 1 0.3TOTAL 393 100.0 392 100.0 391 100.0 345 100.0
Private banking consultants 93 96 66 64Corporate consultants 75 60 44 38
B) REMOTEATM - Bancomat 461 457 455 391Bancacontinua (self service) 13 13 13 13POS (1) 11,211 11,207 9,440 8,101Service on line (2) 62,738 56,183 46,124 37,169(1) Figures at 31/12/02 do not include ex-Capitalia branches.(2) Internet banking and Call Center contracts.
C) MOBILEInsurance agents (3) 290 282 220 92Estate agents 1,425 1,339 1,269 769(3) Agents of the Group’s insurance subsidiaries distributing Banca Carige products.
31/12/03 30/9/03 31/12/02 31/12/01
31/12/01
31/12/01
30/9/03 31/12/02
31/12/02 31/12/01
31/12/0230/9/03
31/12/03
31/12/03 30/9/03
31/12/03
During 2003, the new Online Business product waslaunched, flanking the existing Online Familyservice. The former was developed specifically forbusinesses and the self-employed professional, andoffers payment and collection facilities, statementsand securities trading. The product is the naturaldevelopment of our home banking service andgives the customer all the advantages of netbanking.
There was considerable growth in net banking alsoduring 2003 in terms of the number of subscribersand transactions (money-movement transactions,involving the movement of money with asubsequent effect on the balance of the account,and information-related transactions, such asbalance enquires, which have no effect on thebalance of the account). At the end of 2003, therewere 45,000 contracts, an increase of 24.5% over

46
the previous year (2002: 36,000). The number ofactive customers, namely those subscribers whoeffected at least one transaction during the year,represented more than 80% of the total. More than60% of customers carried out at least one moneytransaction.The number of transactions amounted to 5.4million, an increase of 64% in comparison to2002. This rise was particularly high in traditionaltransaction forms (3.8 million transactions;+67.1%), which at December 2003 accounted for70.3% of all transactions. Trading rose by 57.1% to1.6 million transactions, but represents only 29.7%of the total.Money-movement transactions totalled overall590,000 in number (20% of the Bank’s totaltransactions and an annual increase of 71%), ofwhich 457,000 was in the form of various paymenttransactions, transfers, etc., amounting to 440.6million, and 133,000 in transactions in securitiesfor 114.5 million (2002: 20.8 million).Carige’s Call centre recorded overall satisfactoryresults: the number of transactions carried duringthe year rose by 58.3% to 150,000, of whichmoney-movement transactions doubled in numberto 16,000 for a related amount of 11.5 million(2002: 20.8 million).Carige’s mobile channels are made upprincipally by the Group’s insurance agents. Thanksto rulings made by both the Bank of Italy and theItalian insurance industry regulator ISVAP, BancaCarige stipulated with the Group’s two insurancecompanies – Carige Assicurazioni and Carige VitaNuova – agreements for the distribution of Carigebanking products at the offices of the insurancecompanies. A total of 290 insurance officeshave signed these agreements which aim not onlyto find new customers, but also to revitalisecontacts with existing customers in terms of fidelityand net worth to the Bank. Support to the offices isprovided by a group of 35 financialconsultants (‘promotori’) who promote apackage of products and related services.Estate agents working in agreement with theBank are also part of the mobile distributionnetwork. The objective here is to extend ourmortgage business. The number of estate agentscollaborating with Banca Carige rose 12.3% to1,425. Around a third proposed Carige mortgages
to their customers, and one fifth actually finalised atleast one mortgage contract between theircustomers and the Bank. The number of mortgagecontracts signed rose by 3% with a rise in amountslent of 15.6%. The average amount advanced rose12% in comparison to the previous year.The number of Banca Carige employees roseduring the year from 3,512 at 31st December 2002to 3,759 following the transfer to the Bank of 371employees of Capitalia. In detail, the total is madeup by 46 executives, 746 managers, and 2,967clerical and ancillary members of staff. There are2,144 male employees and 1,645 femaleemployees. The average age of employees isaround 43 with 18 years service.Around 28% of staff (1,054 employees) isemployed in Carige’s Genoa head offices; theremaining amount is involved in market activities.With regards to the valuation of human resourcesand our commitment to the philosophy of alearning organisation, Carige’s training centre inGenoa offered various training programmes withthe common objective of reinforcing customerrelations and courtesy.Following a review of training programmes offered,an e-learning platform was established enablingstaff to access courses directly from the work place.Attention continued to be placed on thoseemployees transferred to Carige after theacquisition of 41 branches from Capitalia; newoperating procedures and above all the acquisitionof a corporate awareness were stressed in trainingprogrammes that were supplied to each newemployee for a total of 995 days of training.In order to limit travelling costs and accelerate thetraining process, programmes were organised inour established decentralised training centres ofMilan, Rome, Palermo, Savona (at the offices ofCassa di Risparmio di Savona), and Lucca (at theoffices of Banca del Monte di Lucca).Other courses aimed at optimising humanresources included techniques in public andbusiness relations, preparation for the ABI-sponsored Banking and Financial Diploma, andestablished training and re-training programmes.Overall, 29,884 days of training were distributed to18,415 participants.

47
PERSONNEL
31/12/03 30/09/03 31/12/02 (1) 31/12/01
N. % N. % N. % N. %
Grade Executives 46 1.2 46 1.2 41 1.2 42 1.2 Managers 746 19.8 680 18.0 607 17.3 614 17.5 Other employees 2,967 78.9 3,062 80.8 2,864 81.5 2,850 81.3TOTAL 3,759 100.0 3,788 100.0 3,512 100.0 3,506 100.0Activities Head-offices 1,054 28.0 1,034 27.3 1,065 30.3 1,084 30.9 Branches 2,705 72.0 2,754 72.7 2,447 69.7 2,422 69.1(1) Exclusive of 371 members of staff of the 42 branches acquired by Banca Carige from Capitalia
Group employed by the Bank with effect 1/1/03.
THE ADOPTION OF INTERNATIONALACCOUNTING STANDARDS (IAS)
On 29th September 2003, the EuropeanCommission, in its adoption of Regulation no.1725, made it compulsory for all EU public limitedcompanies to adopt from 1st January 2005 newinternational accounting principles (IFRS) defined inRegulation no. 1606/2002 of the EuropeanParliament and Council.On the basis of a regulation that is in the course ofbeing finalised, differences between the newprinciples and those at present in force in Italyemerge. The major differences concern:
- the use of the principle of fair value ratherthan historic cost for the evaluation offinancial instruments and securitiesinvestments;
- the possibility of using, as an alternativeaccounting principle, fair value for theevaluation of intangible assets, premises,machinery, etc.
- the systematic revaluation of certain assets(loans) and liabilities (staff funds) by meansof financial and actuarial actualisation;
- regular application of impairment testing tomonitor the value of significant assets(loans, equity investments, goodwill);
- wider levels of disclosure.Application of the new principles will result indifferences in the evaluation of balance sheet items.On first time adoption, these effects, pursuant toIFRS 1, will be on net assets. Consequently, thereare likely to be differences in the value of the netassets of the banks belonging to the Carige Groupfrom those recorded at 31/12/04 and those at1/1/05.The introduction of the new principles will have animpact far beyond accounting and the preparationof financial statements; the effects will be felt oninformation systems (different organisation of dataand information), organisation (changes inaccounting processes with knock-on effects onorganisational structures), corporate culture (theneed to create new professional profiles andspecific training programmes). The coherentapplication of the principles requires an integratedapproach that takes into account the logicunderpinning the principles and their impact.Banca Carige as the leader of a universal financialservices group (banking, insurance, financialservices) began during the first half of 2003 toidentify, on one hand, the professional duties

48
required and, on the other, to define guidelines,programmes, models, methods and processes thatwill enable the effective introduction of the newadministrative/accounting system foreseen by theEuropean Commission’s Regulation.The process is part of a wide-ranging reengineeringof the Bank that started in 2002. The process oforganisational review involves every Carige Groupcompany, including the insurance subsidiaries. Itwas approved by an ad hoc steering committeeformed within the General Management of theBank. The Committee’s duties are to direct,coordinate and control all aspects of reengineering.The Committee has at its disposal:
- a government structure with duties to directand guide the reengineering process. Thestructure is made up by senior managersfrom accounting and services, ICT, andOrganisation departments;
- a Coordination Group, an inter-functionalstructure made up by staff members fromaccounting, business and risk management,ITC, and organisation. The Group’sresponsibilities include legal and regulatoryaspects of the process, the definition ofmeasures to be taken, the monitoring ofwork in progress as well as the contributionof external consultants. The Group carriesout its activities in teams of in-house expertsresponsible for the analysis of single sectorsand subsequent implementation;
- an organisational group carries outtechnical support, and is responsible for thecollection and distribution of relevantregulations. Later it will draw up, transmitand store information and operationalinstructions.
The launch of the IFRS project was preceded by apreparatory phase during which the CoordinationGroup in collaboration with a firm of externalconsultants:
- identified the maximum FTA-inducedchanges on information and valuation andits effects on organisation, ITC andaccounting;
- calculated the maximum FTA-inducedchanges on assets as at 1/1/05.
This preparatory phase was flanked by a series oftraining courses at first organised within the Banklater followed by external courses and ItalianBanking Association (ABI) work groups. Thepreparatory phase was concluded in October 2003with the definition of general technical and
organisational guidelines along with a formaldescription of the measures to be carried out. Theactual enactment of these measures (reengineeringin its truest sense) will take place during 2004. Atthe end of 2003, the project had effected preciseaccounting and organisational diagnostic tests inorder to verify the presence of data required and,where absent, the manner of retrieval. Softwaresuppliers to the Bank were brought actively into thisprocess.With regards to the effects on net assets followingfirst time adoption of the principles, it is reasonableto expect that the possible negative effects inducedby a change in the valuation criteria applied toloans (fair value instead of historic cost) will beoutweighed by positive variations on the value ofequity investments outside the group and of othertechnical fixed assets.
INVESTMENTS
Banca Carige’s total tangible assets amounted to at31st December 2003 920.5 million, an increase of6.4% over the previous year. This rise was due toan increase in lease assets, which rose from 605.4to 662.6 million (+57.2 million; +9.4%).There were falls in other tangibles, principally as aresult of depreciation carried out during the year. Inparticular, premises fell 0.4% to 238.9 million,following purchases amounting to 4.6 million. Thiswas, however, offset by sales (1 million) and valueadjustments (4.6 million). Furniture and fittingsamounted to 19.1 million, down 5.6% afterpurchases made during the year totalling 4.8million. Here, too, this was made up for by salesand value adjustments of 5.9 million.The results described above had an effect on theinternal composition of the aggregate. Financiallease assets increased their share of the totalaggregate from 70% to 72%, whilst premises weredown from 27.7% to 25.9%, and furniture andfittings dropped from 2.3% to 2.1%.Final amounts include advances for investments of48 million, almost exclusively referring to leaseassets. Tangible fixed assets include revaluationscarried out in accordance with the provisionscontained in Laws 576/75, 72/83, 413/91 and218/90 amounted to 186.7 million (2002: 187million).Depreciation charges totalled 409.4 million, ofwhich 226.6 million refers to financial lease assets.

49
Further information is given at section 4.1, part B ofthe explanatory notes.Intangible assets amounted to 473.5 million, down1.4% in comparison to December 2002. The fall isdue entirely to depreciation charges for the periodof 22.7 million, which neutralised rises related tosoftware purchases (10.7 million) capitalisation ofstart-up charges (3.6 million), and other increases(2.2 million).By type, 442.4 million refers to goodwill on branchacquisitions still to be amortised (56 million refersto the 21 branches purchased from Banco diSicilia, 262.1 million refers to the 61 branchespurchased from the Intesa Group, and 124.4million refers to 42 branches from Capitalia).Amortisation charges relating to the threeacquisitions, calculated from 2002 on a rising-charge basis in correlation with the increased futureprofitability of the branches, are as follows: 0.6million relating to the ex-Banco di Sicilia branches;5.5 million relating to the ex-Intesa branches; 2.5million relating to the ex-Capitalia branches.Details regarding the method of amortisationutilised are given in Part A, section 1 of theexplanatory notes.Other intangible assets include software products(20.4 million; +9.2%), start-up costs (3.3 million,more than tripled in comparison to 2002), andother intangibles (7.4 million; -22.1%), of which themost significant items are maintenance charges onthird-party premises ( 3.9 million) and investmentsmade for the purchase of treasury services (1.6million).Total depreciation charges on recorded intangibleassets amount to 66.3 million, of which 22.7million was recorded during 2003.Further information can be found at section 4.2,part B of the explanatory notes.The value of the Bank’s equity investments(excluding investment securities) rose slightly from638.5 million recorded at December to 2002 to648 million.Within this amount, 626.7 million refers tosignificant holdings, up 3% over 31/12/02. The netincrease of 18.1 million was the result of, on onehand, the subscription of equity bolstering sharecapital increases in the subsidiaries ColumbusCarige Immobiliare and Carige Assicurazioni, andthe setting up of Carige Asset Management SGRand, on the other, the sale of our holding inEptaconsors (investment recorded in the balancesheet at 19 million).
Other equity investments amounted to 31 million,down 40.3% in comparison to 31/12/02, followingthe sale of non-strategic holdings with a book valueof 15.8 million, which generated total capital gainsof 6.9 million. The most significant transactioninvolved the sale of our holdings in Intesa HoldingAsset Management (book value: 4.5 million;capital gain: 3.3 million) and Fincantieri (bookvalue: 11.3 million; capital gain: 3.6 million).Equity investments include revaluations (Law218/90) totalling 4.4 million, 3.2 million relatingto significant holdings.No writedowns were carried out during the year,whilst writebacks relating to our holding inColumbus Carige Immobiliare generated 0.1million.The book value of equity investments within theGroup increased by 5.2% over December 2002 to617 million.The following companies belong to the BancaCarige Group:
- Banca del Monte di Lucca SpA and Cassadi Risparmio di Savona SpA are banks;
- Carige Assicurazioni SpA and Carige VitaNuova SpA are insurance providers;
- Carige Asset Management SGR SpA is amanager trust company specialising in assetmanagement. The company is enrolled inthe Italian registry of savings managementcompanies (‘Società per il Gestione delRisparmio’) with effect from 10th January2004. Carige Asset Management SGR wasformed during 2003 with the aim ofintegrating the Group’s savingsmanagement activities, realising its ownsavings management products, recoveringearnings for the Group, and achieving costcontainments for customers;
- Centro Fiduciario SpA, is a trust company;- Galeazzo Srl, Columbus Carige
Immobiliare SpA and Ettore Vernazza SpAoffer property-related services;
- Argo Finance One Srl is the SPV establishedfor the securitisation of bad loans carriedout by Carige at the end of 2002.
Banca Carige has an indirect holding in thefollowing companies, the book value of whichis not included at ‘equity investments within theGroup’:- Ligure Leasing SpA and Immobiliare Carisa
Srl are owned directly by the Groupsubsidiary Cassa di Risparmio di Savona.
50
The former is a finance company, whilst thelatter offers property-related services;
- Assi90 Srl, offering insurance-relatedservices, is owned directly by the Groupsubsidiaries Carige Assicurazioni andCarige Vita Nuova;
- AG Srl, Savona 2000 Srl and AssimilanoSrl, offering insurance-related services, areowned directly by Assi90 Srl.
Two equity acquisitions completed in January 2004do not appear in this item. The first relates to Cassadi Risparmio di Carrara SpA, a bank, the purchaseof which was performed via the holding Carinord2. The purchase was completed on 16th January2004 following a preliminary contract of salesigned by Carige on 16th July 2003 andauthorisation on the part of regulators. Detailsregarding the accounting treatment of thetransaction are given in the explanatory notes, partB at sections 5 ‘other items’ and 10 ‘guaranteesand commitments’. The second equity acquisitioncompleted after the closing of the statements for2003 refers to Priamar Finance Srl. The company isthe special purpose vehicle set up during thesecuritisation of bad loans carried out by thebanking subsidiary Cassa di Risparmio di Savona atthe end of 2002. The purchase was completed on14th January 2004.With regards to inspections carried out by ISVAP,the Italian insurance regulator, at the insurancesubsidiaries Carige Assicurazioni and Carige VitaNuova, Banca Carige and the administrators of thetwo companies involved, in line with ISVAP’srecommendations, put into place wide-rangingmeasures that:
• overhauled corporate governance andorganisational models and redefined, viachanges to the companies’ by-laws,authority and decisional powers in order toachieve a clearer distinction ofresponsibilities;
• rationalised functional holdings via theconsolidation of the subsidiaries Euroipa Srland S.P.A. Srl into Carige Assicurazioni andthe restructuring of previously outsourcedactivities;
• rationalised in particular CarigeAssicurazioni’s commercial activities via areview of reinsurance policy (details are
given in the consolidated statements of theBanca Carige Group in the section ‘GroupCompanies and Equity Investments’), andstrengthened accident reserves, with thesystematic monitoring of their adequacy.
In line with measures carried out to achieverationalisation and innovation, as suggested byISVAP, a further strengthening of CarigeAssicurazioini’s share capital was carried out inorder to improve the company’s solvency ratio.The Extraordinary Shareholders’ Meeting of CarigeAssicurazioni held on 28th November 2003deliberated an increase in share capital from102,520,800 to 137,872,000 by means of anordinary share issue of 36,000 new shares with anominal value of 982 euros and an issue premiumof 193 euros for a total countervalue of 42.3million. Shareholders will be offered the right toexchange their existing shares on the basis of 10new shares for every 20 old shares. The option hasto be exercised no later than 31st March 2004.On 30th December 2003, Banca Carige exercisedits own option right relating to 17,022 new sharesfor an overall value of 20 million. Bearing in mindthe fact that a further 30 new shares weresubscribed on 31st December 2003, the company’sshare capital amounted to 140.9 million incomparison to 120.1 million at 31/12/02. Asstated above, the completion date for thetransaction is 31st March 2004.The book value of equity investments outside theGroup dropped sharply by 40.3% to 31 million incomparison to 2002.In line with CONSOB recommendation no.97001574 dated 20/2/97, all intra-subsidiary andassociated company relations are regulated bymarket conditions.In particular, at 31/12/03 with regards to relationsexisting between Banca Carige and thesecompanies, amounts owed to, and amountspayable by Banca Carige amounted, respectively,to 441.7 million and 297.2 million; guaranteesand commitments totalled 87.2 million.Details are given in the table below. Further detailsconcerning the Bank’s relations with its subsidiariesand associated companies and changes recordedduring the year are given at section 3, part B of theexplanatory notes.

51
EQUITY INVESTMENTS (thousands of Euros)
31/12/03Assets (1) Liabilities (1) Guarantees & Revenue Expenses Dividends
CommitmentsSUBSIDIARIES 101,439 254,017 4,985 15,363 12,784 36,032 Galeazzo Srl - 2,849 - 8 112 1,242Columbus Carige Immobiliare SpA 10,668 - - 685 1,673 - Immobiliare Ettore Vernazza SpA 1,008 1 - 110 - 846Argo Finance One Srl 7 11 - 10 - - Centro Fiduciario SpA 413 645 - 436 294 171Cassa di Risparmio di Savona SpA 8,925 179,415 3 3,446 6,970 27,144Banca del Monte di Lucca SpA 34,537 13,850 1,551 2,520 820 1,215Carige Asset Management SGR SpA 15 4,154 - - 43 - Carige Vita Nuova SpA 265 11,329 - 1,036 140 3,180Carige Assicurazioni SpA 44,707 37,170 3,431 3,620 573 2,234Assi 90 Srl 676 2,529 - 3,435 1,999 - AG Srl 90 484 - 1 4 - Assimilano Srl - 1,312 - 1 11 - Savona 2000 Srl - 117 - - 1 - Ligure Leasing SpA 128 151 - 55 144 -
SIGNIFICANT HOLDINGS 147,707 143 2,694 6,289 6 - Frankfurter Bankgesellschaft AG 147,707 143 2,694 6,289 6 -
TOTAL 249,146 254,160 7,679 21,652 12,790 36,032
(1) Unlike table 3.2 in the explanatory notes, this table includes items “other assets”, “accrued income and prepaidexpenses”, “other liabilities”, “accrued expenses and defferred income”.
SHARE OWNERSHIP STRUCTURE ANDRELATIONS WITH THE CASSA DI
RISPARMIO DI GENOVA E IMPERIAFOUNDATION
At 31st December 2003, Banca Carige’s sharecapital amounted to 1,113,326,839 euros, in theform of 959,897,518 ordinary shares and153,429,321 convertible savings shares. Theincrease in share capital in comparison to 31st
December 2002 (1,020,549,614 euros) is theresult of a fully-subscribed share capital increasecarried out during the year. The increase consistedin the issue of 79,991,450 ordinary shares and12,785,775 convertible savings shares. At the
same time a subordinated hybrid bond issue of40,821,979 bonds was fully subscribed.Both the ordinary and convertible shares, valid from1st January 2003, have the same respectivecharacteristics as those already in circulation.Shareholders were offered the option to exchangeexisting shares in their possession on the basis of 1new share for every 11 shares of the same type at aunitary price of euros 2.20 inclusive of issuepremium. The subordinated convertible bonds havea nominal value of euros 2.50, a maturity of 10years with an annual coupon of 1.50% gross.Premium on reimbursement is a 16% increase onnominal value. These bonds were offered toshareholders in option to shares already inpossession prior to the share capital increase on anexchange basis of 1 bond for every 25 ordinary orsavings shares.

52
The transaction is part of measures aimed atreinforcing Banca Carige’s equity base, whilst atthe same time providing resources for expansion asdeliberated by the Extraordinary Shareholders’Meeting of 10th September 2003. The samemeeting attributed the Board of Directors the rightto raise paid-up share capital by a maximumnominal amount of 250 million.After the transaction described above there waslittle change in the share ownership structure of theBank. The present ownership structure of the Bankis as follows: Cassa di Risparmio di Genova eImperia Foundation: 43.37%; CDC-CNCEP:11.02%; WestLB: 7.76%; Basilese InsuranceGroup: 5.63%; El Monte de Piedad y Caja deAhorros de Huelva y Sevilla: 2.31%; GefipHolding: 2.23%; Cattolica Assicurazioni: 2%.With regards to business relations existing betweenthe Foundation and Banca Carige, the Bank hasliabilities of 59.8 million (of which 52 million in theform of convertible subordinated bonds issuedduring the share capital increase performed byBanca Carige during 2003) which generatedinterest charges of 2.7 million. Assets amount to0.6 million. Revenues for the Bank relating totransferred personnel, and administrative,accounting and tax-consultancy service contractsamounted to 1.3 million.
CARIGE SHARES
The second half of 2003 saw an upturn in financialmarkets. Signs of recovery, in particular, from theUnited States had a positive effect on markets afterthe negative trend of the previous two and a halfyears.In Italy, the Mibtel general share index rose intwelve months by 14.5%, achieving positive resultsboth in the first (+5.5%) and second half (+8.6%)of the year. During the last quarter, in particular,
growth was constant despite the dramatic eventssurrounding the Parmalat and Cirio groups.Banking shares outperformed the general index: theMIB banking index rose 30.3% over the year, withexpansion of 18% in the first half and 10.5% in thesecond.Banca Carige’s share price increased at an evenhigher rate than the banking index average: duringits ninth year of listing, the share at 31/12/03 wasquoted at Euros 2.792, an increase of 35.8% incomparison to the same period of the previousyear. Growth was particularly strong during the firstsix months of the year (+23.6%), but maintained asignificant increase also during the second half ofthe year (+9.9%). The average share price for theyear was Euros 2.491 in comparison to Euros1.947 in 2002.Carige’s savings share price, listed from 4th
December 2002, recorded a 47.4% increase fromEuros 2.210 at the end of 2002 to Euros 3.258 at31/12/03. This rise was concentrated in the firsthalf of the year with the share steadying around itsmaximum level from July onwards. The averageprice for the year was Euros 3.064.Dividends for the ordinary and savings shares were,respectively, Euros 0.0723 and Euros 0.0823.Although the dividend distributed to savingsshareholders was equivalent to a price 2% greaterthan the book price of ordinary shares, paymentwas limited to the second half of the year.Carige ordinary shares were the object of 39,275trades (2002: 32,261) relating to a total of89,742,508 shares (2002: 117,134,371 shares)for a total counter value of 223.7 million (2002:227 million). With regards to savings shares, therewas a total of 1,440 trades relating to 2,768,282shares for a value of 8 million.The share capital increase performed at the end ofthe year did not have an effect on the prices ofCarige shares, so confirming the solidity of theinvestment and the trust investors have in our Bank.

53
CARIGE SHARE PERFORMANCE
Change %
31/12/03 30/9/03 30/6/03 31/12/02 year 1st half 2nd half
CARIGE 2.792 2.705 2.541 2.056 35.80 23.59 9.88CARIGE saving shares 3.258 3.201 3.183 2.210 47.42 44.03 2.36Milan general share index 19,980 18,438 18,402 17,443 14.54 5.50 8.58Milan banking index 2,251 2,053 2,037 1,727 30.34 17.95 10.51
The table below provides information requested bythe Italian Securities Market Regulator, CONSOB,in its deliberation no. 11971 of 1475/99 and latermodifications, in addition to the regulation enactingLegislative decree 58/98 regarding the disclosure
of shareholdings in a company or its subsidiarieson the part of its directors, statutory auditors, seniorexecutives or, either directly or on their behalf, bytheir spouses or children under the age of 18.
SHAREHOLDINGS OF BOARD MEMBERS, STATUTORY AUDITORS AND GENERALMANAGER (1)
Name and Surname
Company represented
Number of shares in
possession 31/12/02
Number of
shares bought
Number of shares sold
Number of shares in
possession 31/12/03
Dott. Giovanni BERNESCHI Banca Carige S.p.A. 93,240 22,930 (*) - 116,170Dott. Alessandro SCAJOLA Banca Carige S.p.A. - 2,200 - 2,200Prof. Adalberto ALBERICI Banca Carige S.p.A. - 5,454 (*) - 5,454Sig.ra Annamaria GALLI in ALBERICI Banca Carige S.p.A. - 10 - 10Prof. Avv. Piergiorgio ALBERTI Banca Carige S.p.A. - 5,454 (*) - 5,454P.I. Mario CAPELLI Banca Carige S.p.A. 31,080 22,920 (*) 49,500 4,500Rag. Remo Angelo CHECCONI Banca Carige S.p.A. - 3,100 - 3,100Comm. Pietro ISNARDI Banca Carige S.p.A. 10,360 1,000 (*) - 11,360Prof. Avv. Vincenzo ROPPO Banca Carige S.p.A. - 5,000 5,000 - Dott. Fulvio ROSINA Banca Carige S.p.A. - - - - Sig.ra Maria Franca GUALCO in ROSINA (*) Banca Carige S.p.A. 325,045 29,549 (*) - 354,594Rag. Alfredo SANGUINETTO Banca Carige S.p.A. 64,750 10,886 (*) 5,000 70,636Sig.ra Silvana FERRERO in SANGUINETTO Banca Carige S.p.A. 46,620 4,238 (*) 10,000 40,858Prof. Avv. Piero Guido ALPA Banca Carige S.p.A. 181,795 16,525 (*) - 198,320Prof. Avv. Fausto CUOCOLO Banca Carige S.p.A. 85,470 7,770 (*) - 93,240(1) Share owenership is direct, unless otherwise stated.(2) Indirect ownership.(*) Comprehensive of those undersigned with the capital increase.

54
INCOME STATEMENT AND NET INCOME
Net profit rose 1.3% over 2002 to 106.2million. The result is an encouraging one whenconsidered against the backdrop of anoperating environment influenced negatively by:- continuing economic difficulties;- a sharp downturn on financial marketsrecorded during the first half of the year;- financial crises of certain Italian industrialgroups (particularly the Parmalat and Ciriogroups) with the damaging effects these havehad not only on the level of confidencecustomers have in their banks, but also on theprofitability of the banking system as a whole;- low interest rates in place for several years thathave narrowed margins in traditional bankingactivities.A rise in net profit in comparison to 2002 wasdue also to the contribution of certainextraordinary items.It should also be borne in mind that comparisonbetween the years 2002 and 2003 wasinfluenced by the inclusion into the Carige banknetwork of 42 branches purchased fromCapitalia.Net interest income amounted to 324.7million, an increase of 7% over 2002. The rise isthe result of an 11% increase in amountshandled, also thanks to the contribution of theex-Capitalia branches.In detail, interest income dropped 3.6% from2002’s result to 546.5 million. Within thisaggregate, lending interest income rose from431.5 to 439.7 million (+1.9%), whilst intereston securities fell 24.9% from 110.2 to 82.8million.Interest charges decreased 15.9% to 221.8million. Interest payable on customer depositswas down 20.8% from 62.7 to 49.7 million,whilst interest payable on bonds andsubordinated liabilities fell 9.6% from 137.1 to124 million.Non-interest income rose 12.2% to 389.7million. The contribution to this aggregate(excluding dividends, which suffered fromchanges in the accounting of tax credits) of theex-Capitalia branches was significant.Net commission income totalled 163.5 million,a rise of 10.6% in comparison to 2002. Indetail, there were increases in savings
management commissions, +5.8% to 52.5million, current account expenses recovered,+21.1% to 51.8 million, and net payment andcollection commissions, +11.4% to 28 million.Net gains from financial transactions amountedto 9.2 million as a result of a positive tradingresult of 13,4 million and a realignment tomarket value of securities in portfolio andderivatives.The securities portfolio at the end of 2003recorded a net loss of 6.1 million, of which 2.5million refers to shares and mutual funds, and3.6 million to bonds. Net gains on derivativestotalled 1.9 million.Dividends were down 26.7% over the previousyear to 64 million. Comparison with 2002 isaffected by a change in the accountingtreatment applied to dividends received fromsubsidiaries. Although distribution will be madeduring 2004, the dividends are recorded in theyear in which the related profit was made(2003). Under new IRES rules, tax credits onthese dividends are eliminated. This is offset,however, by a analogous reduction in incometax. After excluding certain extraordinary items inaddition to neutralising the effects of accountingchanges, ordinary dividends for 2003 fell 17%in comparison to 2002. This reduction is dueprincipally to the sale of Carige’s holdings inEptaconsors and Intesa Asset Management (4.3million in lost dividends).Other operating income reached 160.8 million,up 29.8% over 2002’s result of 123.9 million.This strong growth is attributable to financelease revenues, which rose 41.2% over theprevious year. Finance lease activity certainlybenefited in comparison with 2002 from thepurchase with effect 31/12/02 of leasecontracts worth 49.1 million from the subsidiaryLigure Leasing. The acquisition was part ofrationalisation measures in this area aimed attransferring all management and productionactivities to the Group leader. Contracts with aresidual life of less than two years will continueto be handled by Ligure Leasing. Lease-relateddepreciation is recorded at income statementcaption 90 ‘Depreciation and amortisation oftangible and intangible fixed assets’ under theitem ‘lease assets’.
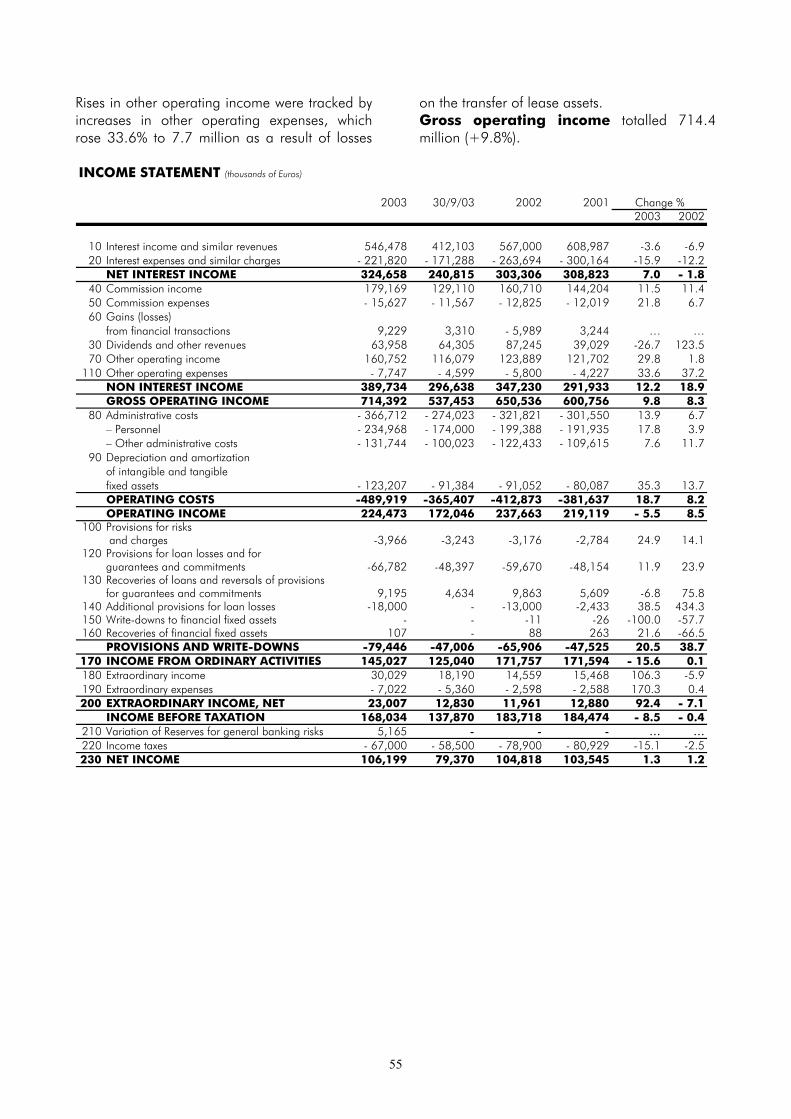
55
Rises in other operating income were tracked byincreases in other operating expenses, whichrose 33.6% to 7.7 million as a result of losses
on the transfer of lease assets.Gross operating income totalled 714.4million (+9.8%).
INCOME STATEMENT (thousands of Euros)
2003 30/9/03 2002 20012003 2002
10 Interest income and similar revenues 546,478 412,103 567,000 608,987 -3.6 -6.920 Interest expenses and similar charges - 221,820 - 171,288 - 263,694 - 300,164 -15.9 -12.2
NET INTEREST INCOME 324,658 240,815 303,306 308,823 7.0 - 1.840 Commission income 179,169 129,110 160,710 144,204 11.5 11.450 Commission expenses - 15,627 - 11,567 - 12,825 - 12,019 21.8 6.760 Gains (losses)
from financial transactions 9,229 3,310 - 5,989 3,244 … …30 Dividends and other revenues 63,958 64,305 87,245 39,029 -26.7 123.570 Other operating income 160,752 116,079 123,889 121,702 29.8 1.8
110 Other operating expenses - 7,747 - 4,599 - 5,800 - 4,227 33.6 37.2NON INTEREST INCOME 389,734 296,638 347,230 291,933 12.2 18.9GROSS OPERATING INCOME 714,392 537,453 650,536 600,756 9.8 8.3
80 Administrative costs - 366,712 - 274,023 - 321,821 - 301,550 13.9 6.7– Personnel - 234,968 - 174,000 - 199,388 - 191,935 17.8 3.9– Other administrative costs - 131,744 - 100,023 - 122,433 - 109,615 7.6 11.7
90 Depreciation and amortization of intangible and tangible fixed assets - 123,207 - 91,384 - 91,052 - 80,087 35.3 13.7OPERATING COSTS -489,919 -365,407 -412,873 -381,637 18.7 8.2OPERATING INCOME 224,473 172,046 237,663 219,119 - 5.5 8.5
100 Provisions for risks and charges -3,966 -3,243 -3,176 -2,784 24.9 14.1
120 Provisions for loan losses and for guarantees and commitments -66,782 -48,397 -59,670 -48,154 11.9 23.9
130 Recoveries of loans and reversals of provisionsfor guarantees and commitments 9,195 4,634 9,863 5,609 -6.8 75.8
140 Additional provisions for loan losses -18,000 - -13,000 -2,433 38.5 434.3150 Write-downs to financial fixed assets - - -11 -26 -100.0 -57.7160 Recoveries of financial fixed assets 107 - 88 263 21.6 -66.5
PROVISIONS AND WRITE-DOWNS -79,446 -47,006 -65,906 -47,525 20.5 38.7170 INCOME FROM ORDINARY ACTIVITIES 145,027 125,040 171,757 171,594 - 15.6 0.1180 Extraordinary income 30,029 18,190 14,559 15,468 106.3 -5.9190 Extraordinary expenses - 7,022 - 5,360 - 2,598 - 2,588 170.3 0.4200 EXTRAORDINARY INCOME, NET 23,007 12,830 11,961 12,880 92.4 - 7.1
INCOME BEFORE TAXATION 168,034 137,870 183,718 184,474 - 8.5 - 0.4210 Variation of Reserves for general banking risks 5,165 - - - … …220 Income taxes - 67,000 - 58,500 - 78,900 - 80,929 -15.1 -2.5230 NET INCOME 106,199 79,370 104,818 103,545 1.3 1.2
Change %

56
INCOME STATEMENT (thousands of Euros)
2003 2002
4th quarter 3rd quarter 2nd quarter 1st quarter 4th quarter 3rd quarter 2nd quarter 1st quarter
10 Interest income and similar revenues 134,375 133,190 137,043 141,870 150,848 140,936 136,833 138,38320 Interest expense and similar charges -50,532 -51,664 -55,538 -64,086 -74,053 -62,620 -63,829 -63,192
NET INTEREST INCOME 83,843 81,526 81,505 77,784 76,795 78,316 73,004 75,19140 Commission income 50,059 43,188 44,169 41,753 40,609 40,111 39,606 40,38450 Commission expenses -4,060 -4,095 -4,176 -3,296 -3,593 -3,686 -3,593 -1,95360 Gains (losses)
from financial transactions 5,919 6,020 -1,168 -1,542 7,237 -10,179 -4,703 1,65630 Dividends and other revenues -347 7,128 37,717 19,460 28,405 5,903 40,235 12,70270 Other operating income 44,673 39,347 38,968 37,764 30,999 35,880 29,526 27,484
110 Other operating expenses -3,148 -2,726 -1,231 -642 -2,240 1,499 -2,513 -2,546NON INTEREST INCOME 93,096 88,862 114,279 93,497 101,417 69,528 98,558 77,727GROSS OPERATING INCOME 176,939 170,388 195,784 171,281 178,212 147,844 171,562 152,918
80 Administrative costs -92,689 -92,971 -92,728 -88,324 -84,013 -78,839 -84,311 -74,658– Personnel -60,968 -57,453 -58,557 -57,990 -47,279 -51,085 -49,516 -51,508– Other administrative costs -31,721 -35,518 -34,171 -30,334 -36,734 -27,754 -34,795 -23,150
90 Depreciation and amortization of intangible and tangible fixed assets -31,823 -30,702 -31,210 -29,472 -16,302 -25,800 -24,918 -24,032OPERATING COSTS -124,512 -123,673 -123,938 -117,796 -100,315 -104,639 -109,229 -98,690OPERATING INCOME 52,427 46,715 71,846 53,485 77,897 43,205 62,333 54,228
100 Provisions for risks and charges -723 -580 -2,330 -333 -313 -513 -924 -1,426
120 Provisions for loan losses and for guarantees and commitments -18,385 -20,613 -11,792 -15,992 -14,000 -16,774 -16,569 -12,327
130 Recoveries of loans and reversals of provisionsfor guarantees and commitments 4,561 873 1,262 2,499 1,085 3,168 3,895 1,715
140 Additional provisions for loan losses -18,000 - - - -13,000 - - -150 Write-downs to financial fixed assets - - - - - - -11 -160 Recoveries of financial fixed assets 107 - - - - - 88 -
PROVISIONS AND WRITE-DOWNS -32,440 -20,320 -12,860 -13,826 -26,228 -14,119 -13,521 -12,038170 INCOME FROM ORDINARY ACTIVITIES 19,987 26,395 58,986 39,659 51,669 29,086 48,812 42,190180 Extraordinary income 11,839 3,720 11,097 3,373 9,529 1,288 2,092 1,650190 Extraordinary expenses -1,662 -1,452 -1,973 -1,935 -580 -470 -608 -940200 EXTRAORDINARY INCOME, NET 10,177 2,268 9,124 1,438 8,949 818 1,484 710
INCOME BEFORE TAXATION 30,164 28,663 68,110 41,097 60,618 29,904 50,296 42,900210 Variation of Reserves for general banking risks 5,165 - - - - - - -220 Income taxes -8,500 -12,250 -30,350 -15,900 -25,700 -14,900 -20,300 -18,000230 NET INCOME 26,829 16,413 37,760 25,197 34,918 15,004 29,996 24,900
Operating costs, similarly to revenues, wereinfluenced by growth in the Bank’s operatingcapacities following the acquisition of branchesfrom the Capitalia group. Total operating costsreached 489.9 million, an increase of 18.7% incomparison to the end of 2002. This rise wassubstantially evident in all cost items, albeit todiffering extents. The percentage rises are asfollows: personnel charges: +17.8%; otheradministrative costs +7.6%; writedowns tofinancial fixed assets +35.3%. The Bank’s costincome ratio rose from 63.5% in 2002 to68.6%. Excluding the positive effects previouslygenerated from tax credits on dividendsdistributed by subsidiaries (see above), the ratiofalls to 67.3%. A further reduction (-4.6%) wouldderive from the accounting of lease credits asother credits (i.e. considering the balancebetween related instalments and theamortisation of lease assets), which would bringthe cost income ratio to 62.5%.In particular, personnel expenses totalled 235million (+17.8%); the rise is in part due to thetransfer of staff to Carige from the branchesacquired in addition to contributions to the
supplementary staff pension fund of 13.8 million(2002: 1.7 million).Personnel expenses are principally made up bysalaries, which reached 153.7 million incomparison to 138.2 million in 2002 (+11.2%).Other administrative costs amounted to 131.7million, rising by 7.6% over the previous year.Within this aggregate, general expenses rose7% to 105.3 million; indirect taxes rose 10.1%to 26.4 million.Writedowns on financial fixed assets rose by35.3% to 123.2 million; essentially a result ofexpansion in finance lease activity, whichrequired increased writedowns totalling 28.6million in comparison to 2002. Other itemsrecorded less significant increases, deriving fromamortisation of goodwill stemming from thepurchase of branches from Capitalia (2.5million). Amortisation of goodwill relating tothese branches (8.7 million in 2003 incomparison to 6.1 million in 2002) is calculatedon a rising-charge basis until the integration ofthe branches is completed, after which, a fixedamortisation charge will be applied. Further

57
details are given in section 1, part A of theexplanatory notes.Operating income was consequently down,by 5.5%, to 224.5 million.Provisions include those made with regards tothe securitisation of non performing loanscarried out at the end of 2002 (12.4 million)and amount to 79.4 million, up 20.5% on2002.Within this aggregate, provisions for risks andcharges rose 24.9% to 4 million, writedowns oncredits totalled 57.6 million (+15.6%), andprovisions to credit risk reserves amounted to 18million (+38.5%).The lack of any substantial improvement in themacroeconomic climate meant a worsening ofcredit risk levels; the Parmalat crisis alone hadan negative effect on the P&L of 12 million.Income from ordinary activities dropped15.6% in comparison to the previous year to145 million (2002: 171.8 million).Extraordinary income totalled 23 million,almost double over 2002 (12 million). The mostsignificant contribution was gains of 16 millionstemming from the sale of holdings inEptaconsors (6.6 million), Fincantieri (3.6million) and Intesa Asset Management (3.3million).
Pre-tax profit reached 168 million, down8.5% over 2002.During 2003, 5.2 million of general bankingrisk reserves was utilised in order to strengthencredit risk management also in the light of IASchanges which do not foresee this particularreserve.Taxes for the period were down 15.1% to 67million. This sharp fall was the result of changesin tax rules which, with the introduction of IRES,eliminated tax credits on dividends accrued in2003 but distributed in 2004 (12.9 million).Excluding the effect of these changes, the taxcharge would have risen by 1.3% to 79.9million. The average tax rate dropped from42.9% to 39.9% (44.2% with the inclusion of taxcredits).Net income amounted to 106.2 million, anincrease of 1.3% in comparison to 2002.Despite this increase, the Bank’s ROE was downfrom 7.7% in 2002 to 6.6%, following equitystrengthening carried out at the end of the yearthat raised equity by 204.1 million. There wasalso a fall in ROAE, though considerably lesserthan in the case of ROE (from 7.8% in 2002 to7.6%).
NET INCOME (millions of Euros)
106,2104,8103.5
7.64%7.76%7.86%
0
20
40
60
80
100
120
2001 2002 20034.00%
5.00%
6.00%
7.00%
8.00%
9.00%
NET INCOME ROAE

58
The proposed distribution of net profit for theyear (106.2 million) is as follows:
DISTRIBUTION OF NET INCOME
31/12/03Net Income 106,199,426.63Reserve for dividends on own shares 140,297.41Total 106,339,724.04Legal reserve 10,619,942.66Reserve Decree 124/93 65,197.73Taxed extraordinary reserve 12,092,466.77Ordinary share dividend (0,0723 euro per share) 69,400,590.55Saving share dividend (0,0923 euro per share) 14,161,526.33
The proposed dividend to be distributed to theBank’s shareholders is 0.0723 Euros for each ofthe 959,897,518 ordinary shares and Euros0.0923 for each of the 153,429,321 savingsshares.Savings shares pay a dividend increased by anamount equivalent to 2% of the nominal valueof ordinary shares.
If approved, total dividends distributable wouldrise by 11.1% in comparison to 2000 with a payout of 78.6% (2001: 71.7%).It is proposed that dividends on own shares inportfolio at the moment of distribution bedestined to a specific reserve.
On the basis of the proposed distribution ofearnings for the year to be presented to the
AGM for approval, shareholders’ equityamounts to:
SHAREHOLDERS' EQUITY (thousands of Euros)
31/12/03 31/12/02 31/12/01
Capital Stock 1,113,327 1,020,550 1,017,510Additional paid-in capital 255,023 136,095 132,005Reserves 252,361 229,584 199,957 - legal 77,971 67,351 56,869 - taxed extraordinary 56,489 44,397 71,322 - decree 153/99 11,718 11,718 11,718 - decree 124/93 122 57 - - merger 12,341 12,341 12,341 - incorporation 16,589 16,589 16,589 - own shares - 11,619 21,837 - purchase of treasury stock 77,000 65,381 9,150 - art. 55, decree 917/86 131 131 131Revaluation reserves 7,956 7,956 7,956Total 1,628,667 1,394,185 1,357,428Reserve for general banking risks - 5,165 5,165Total 1,628,667 1,399,350 1,362,593
SHAREHOLDERS’EQUITY

59
1,363 1,3991,629
0200400600800
1,0001,2001,4001,600
2001 2002 2003
SHAREHOLDERS' EQUITY (millions of Euros)
Positive variations in shareholders’ equity derivenot only from the distribution of net income forthe year, but also from an increase in issuepremium following provisions to the issuepremium reserve of 7.6 million. Following thedestining to reserves, non-inclusive of the effectsof deferred taxation, of the fourth quota relativeto losses on credits sold within the confines ofthe securitisation of bad loans carried out by theBank, an equity-strengthening operation wasperformed that raised 306.2 million in freshfunds, 204.1 million in equity, 102.1 million viaa convertible subordinated bond issue.
As a result of this operation, Carige’s total sharecapital at 31/12/03 was made up by959,897,518 ordinary shares and153,429,321 savings shares with a nominalvalue of 1 euro each. Total share capital was1,113,326,839 euros.Turning to share market indicators, theearnings per share ratio was 0.095 euro incomparison to 0.103 at 31/12/03, following anincrease in the number of shares resulting froman increase in share capital. The share’s P/Eratio for 2003 rose from 18.96 to 26.11; therewas also an increase also in the price/bookvalue ratio from 1.45 to 1.72.
SHAREMARKET INDICATORS
31/12/03 30/9/03 31/12/02 31/12/01
Return on Equity (ROE) % 6.61 7.53 (3) 7.65 7.77
Return on Average Equity (ROAE %) 7.64 7.63 (3) 7.76 7.86
Earnings per share (EpS) 0.095 0.104 (3) 0.103 0.101 (4)
Price/Earnings ratio (P/E) (2) 26.11 23.22 (3) 18.96 18.05
Price/Book value (P/BV) (2) 1.73 1.75 1.45 1.40
Dividend yield (%) (2) 2.90 3.00 (3) 3.71 3.95
Net profit (in thousands of euros) 106,199 79,370 104,823 103,545Annual percentage variation 1.3 13.5 1.2 5.4
Equity (thousands of euros) (1) 1,606,029 1,405,259 1,369,723 1,332,832
Number of shares/1000 1,113,327 1,020,550 1,020,550 1,020,550 (4)
Average share price for the period (2) 2.491 2.408 1.947 1.831 (4)(1) Capital and reserves (including general banking risks fund) prior to profit allocation. (2) Ordinary shares only. (3) Valuesreferred to the entire year. (4) Pro forma values after share conversion into euros.

60
Core capital at 31st December 2003amounted to 1,469.1 million, an increase of30.7% in comparison to the end of 2002
(1,124.2 million). Full details are given in thetable below:
BREAKDOWN OF TOTAL CAPITAL (thousands of euros)
31/12/03 30/9/03 31/12/02 31/12/01
Tier 1 Capital: positive elements eligible for inclusion (a) 1,620,710 1,421,959 1,391,392 1,354,637Share capital 1,113,327 1,020,550 1,020,550 1,017,510Reserves 252,360 254,380 229,582 199,957Additional paid-in capital 255,023 141,864 136,095 132,005General banking risks fund - 5,165 5,165 5,165
Tier 1 Capital: negative elements (b) 473,530 479,297 491,752 379,136Goodwill 442,392 446,727 450,799 330,912Other negative elements 31,138 32,570 40,953 48,224
Total Tier 1 capital (c = a-b) 1,147,180 942,662 899,640 975,501
Supplementary capital (d) 512,498 406,374 405,708 404,106
Reductions (e) 190,582 (1) 168,721 (1) 181,120 (1) 22,723
Total core capital (c+d-e) 1,469,096 (1) 1,180,315 (1) 1,124,228 (1) 1,356,884(1) As requested by Regulators, this item includes deduction of equity investment in subsidiary Carige Assicurazioni SpA (134,093 thousand euros) and the same subsidiary's subordinated bond issue subscribed by Banca Carige (44,304 thousand euros). Excluding this deduction, total capital would amount to 1,647,494 thousand euros.
Tier 1 capital includes positive elements totalling1,620.7 million; negative elements to bededucted from this amount to 473.5 million.Supplementary capital is made up almostexclusively by a lower tier 2 subordinated loanissue (September 2001) for 398.9 million and aconvertible subordinated loan issued during the
share capital increase concluded in December2003. Negative elements are represented byholdings in Carige Assicurazioni, FrankfurterBankgesellschaft and Ligurcapital, in addition tothe subordinated loan issued by CarigeAssicurazioni.
CORE CAPITAL AND SOLVENCY RATIOS (thousands of Euros)
31/12/03 30/09/03 31/12/02 31/12/01
Core capital Tier 1 capital 1,147,180 942,662 899,640 975,501Tier 2 capital 512,498 406,374 405,708 404,106Deductions (1) -190,582 -168,721 -181,120 -22,723Total capital (1) 1,469,096 1,180,315 1,124,228 1,356,884
Weighted assetsCredit risk (1) 9,101,528 9,044,374 8,545,463 7,459,743Market risk 988,300 924,469 681,020 1,092,671Other prudential requirements 483,286 483,291 483,291 227,543Total weighted assets (1) 10,573,114 10,452,134 9,709,774 8,779,957
Solvency ratios %Tier 1/weighted assets for credit risk 12.60% 10.42% 10.53% 13.08%Total capital/weighted assets for credit risk (1) 16.14% 13.05% 13.16% 18.19%
Tier 1 capital / Total weighted assets (2) 10.85% 9.02% 9.27% 11.11%Total capital / Total weighted assets (1) (2) 13.89% 11.29% 11.58% 15.45%
(1) As requested by Regulators, amounts include deduction of holding in subsidiary Carige Assicurazioni SpA. Excluding this deduction, total capital would rise to 1,647,494 thousand euros with related rises in the total capital/weighted assets for credit risk from 16.14% to 18.10%, and total capital/total weighted assets ratios from 13.89% to 15.58%. (2) Total weighted assets include credit and market risks.

61
With regards to capital absorption andcapital adequacy levels, weighted assets forcredit risk totalled 9,101.5 million, substantiallygreater than the figure required: 637.1 million(2001: 598.1 million). Capital adequacyrequirements for market risks totalled 69.2million, whilst other amounts required in relationto the Bank’s securitisation operations totalled33.8 million. Overall, capital requirementstotalled 740.1 million which, deducted fromcore capital, leave a total of 729 million inexcess to capital requirements.
Solvency, calculated on the basis of the totalcapital/weighted assets for credit risk ratio wasat 31/12/03 16.14%; the total capital ratio,which includes also weighted assets for marketrisks, was 13.89%. The above coefficientsrelating to tier 1 capital were, respectively,12.60% and 10.85%. Both indicators werehigher than those recorded in 2002 as a resultof the equity strengthening operation whichgenerated an increase of 204.1 million in tier 1,and 102.1 million in tier 2 capital.
CORE CAPITAL AND SOLVENCY RATIO
1,469.1
1,147.2
1,356.9
1,124.2975.5
899.615.45%
11.58%
13.89%
11.11%
9.27%
10.85%
0
200
400
600
800
1,000
1,200
1,400
1,600
31/12/2001 31/12/2002 31/12/20035.00%
10.00%
15.00%
20.00%
25.00%
Core capital Tier 1 Total capital ratio Tier 1 ratio
Total capital levels and related solvency ratioshave been influenced over the last few years byexpansion in the Carige Group’s retail network.Expansion by the purchase of branches fromother banks or via new branch openings has
been financed by two share capital increasesand one subordinated bond loan issue. Bothchannels seek expansion that goes hand-in-hand with financial solidity, a characteristic ofBanca Carige’s operational strategy.
Expansion of Banca Carige’s activities alongwith those of the Carige Group subsidiaries hasmeant defining appropriate risk
management processes with organisationalbackup at each of the three levels foreseen bythe Internal Control Systems (ICS) of the Bankand the Group.First level controls are carried out within eachsingle productive and distributive unit (branches,area management, headquarter officesbelonging directly to risk management and
RISK MANAGEMENT

62
control departments). The activities of thoseresponsible for oversight at the first level areregulated by an internal code of practicedocument which is regularly reviewed so as tomeet changes in external regulation.Risk management (second level controls) isbased on the:• assignment of banking risk managementresponsibilities (market, rate, credit, liquidity,operational risks) to the Asset and LiabilityCommittee (ALCO), with the aim of keeping theBank and the Group in line with the risk appetiteof shareholders, whilst at the same timerespecting short term, and medium/long-termstrategic objectives;• development of risk evaluationmethodologies that are consistent with currentrelevant legislation, expected Basle 2 capitaladequacy recommendations, and best practicesat national level;• identification of the functions involved atthe three levels of control in order to guaranteea separation between operational and riskevaluation activities.The risk management unit, with delegatedresponsibilities for risk management control,guarantees in quantitative terms theidentification, collection, evaluation and controlof risk. At the same time, the unit matches on aconstant basis its findings to a raft of indicatorsranging from those used by the Bank, regulatorsand other relevant external benchmarks. Thisunit is linked to the Research, Planning andManagement Control office in order toguarantee a unitary view of governance-relatedactivities as well as a constant oversight of thevarious components that make up the planningprocess. Alongside Management Control,responsible for the calculation and fixing ofprofitability, the risk management unit identifies,measures and manages risk profiles. Risk andreturn are considered as mutually dependant in
the processes of strategic and operationalplanning, and capital allocation. The placementof management and risk management withinResearch and Planning is in response to theneed for a level-based analysis for the Bank andthe Group of individual business areas, product,distribution channels, and customer segments.Third level controls are carried out by theInternal Control Office’s internal auditing unit,which evaluates the feasibility of the ICS as awhole. This unit refers to general managementand is responsible for identifying process andoperational anomalies. It has specific first andthird level duties in addition to the possibility ofutilising second level instruments andprocedures.The Board of Directors, the Executive Committeeand General Management are responsible forthe definition of strategy and control policy, withspecific reference to risk.Within the Board of Directors, the InternalControl Committee operates in accordance withthose powers foreseen by the Code for Self-Regulation of Listed Companies stated at point10.2. The Committee reports to the Board onmatters concerning the overall effectiveness ofinternal control systems.Management processes relating to the FinanceArea utilise the data warehouse generated byCarige’s in-house trading floor activities (bonds,shares, currency, derivatives, money deposits).Market risk is measured by VAR (Value atRisk), which is calculated on a daily basis andprovides operational limits for those responsiblefor portfolio management.During 2003, overall average VAR referring toBanca Carige’s securities and derivativesportfolio overall was calculated at 5.9 million,with a downward trend recorded the year.Maximum VAR – 12.7 million - was recorded on3rd April 2003.

63
The rising trend recorded by VAR during the firstquarter was the result of considerable volatilityon financial markets that lasted until March; inthe second quarter VAR levels followed adownward trend. At the end of the June Value atRisk levels dropped further on the back ofchanges in the composition of the Bank’ssecurities portfolios. Levels reached halfway
during the year were to remain substantiallyunchanged for the remainder of the year.The share portfolio represented an averageweight of 51% of the total at risk; the averageweight of risk represented by bonds was 45%. Adetailed analysis of the different types of riskmaking up VAR is given in the table below. Thefigures are expressed in millions of euros:
31/12/2003 Average for 2003 Minimum for 2003 Maximum for 2003Share risk 3.0 5.9 2.7 13.9Exchange-rate risk 0.8 1.5 0.8 2.8Interest-rate risk 1.4 3.7 1.5 5.7Diversification effect -1.8 -5.2 -1.8 -9.7VAR Total 3.4 5.9 3.2 12.7
Interest-rate risk is analysed utilising:• gap analysis that evaluates earningsexposure by subtracting interest rate sensitiveliabilities in a time band from the correspondinginterest rate sensitive assets so producing arepricing gap for that time band. This gap canbe multiplied by an assumed change in interestrates to yield an approximation of the change innet interest income that would result from aninterest rate movement;• duration analysis that is based on aneconomic value approach and measures thesensitivity of the market value of assets toexternal variations in interest rates. The assetsduration indicator – the difference betweeninterest-rate sensitive assets and liabilities –provides an approximation of a percentage lossin the capital account resulting from an interest-rate movement;• sensitivity analysis that analyses themarket value of the Bank’s assets in response tochanges in interest rates. The analysis aims atevaluating the market value of assets in ascenario of interest-rate variations;• maximum probable loss analysis seeks toquantify the maximum probable value loss of the
Bank’s assets in a defined period of time. Inpractice this analysis represents the extension ofVAR techniques to the Bank as a whole.Gap analysis in particular measures on amonthly basis changes in interest rates on thebasis of risk exposure to a particular position ata particular date (a so-called static simulation).The analysis is carried out using threecomplementary methodologies which provide,as one moves from the first to the third, moresophisticated levels of management information:
• incremental gap evaluates the impact onnet interest income stemming from achange in interest rates (up or down)with a parallel movement in the Bank’sinterest rates at the moment of repricing;
• incremental beta gap analyses theresponse on the part of the Bank’sadministered interest rates on sightpositions to external variations in marketrates. The coefficients generated areregularly updated on the basis ofhistorical trends in administered andexternal rates;
• shifted beta gap analysis takes intoconsideration the fact that administered

64
rates are sticky and do not respondimmediately to variations in marketrates.
Data at 31st December 2003 reveal, on thebasis of a twelve-month time band, shifted gapanalysis, a loss in net interest income of 21.2million generated by a 1% fall in interest rates,
and a gain of 21.4 million with a 1% rise inrates. Average data during 2003 recorded aloss of 20.7 million accompanying a 1% drop inrates and a gain of 20.5 million stemming froma 1% rise.Average values recorded during 2003 aresummarised in the table below:
Shock: -1% Shock: +1%Off-balance Total Off-balance Total
sheet sheetSight Term Sight Term
a - Incremental gap 34.4 -21.1 -2.3 11.0 -39.9 19.9 2.3 -17.7
b - β Incremental gap 0.5 -21.1 -2.3 -23.0 -2.7 19.9 2.3 19.5
c - Shifted β gap 2.7 -21.1 -2.3 -20.7 -1.7 19.9 2.3 20.5
β : indicator of elasticity with regards to estimated variations in interest rates on sight positions
Balance- sheet Balance- sheet
The overall average impact of a one percent fallin interest rates (20.7 million) represents 6.4% oftotal net interest income for 2003 (324.7million).Liquidity risk is evaluated by analysing overallthe total of interest-rate sensitive assets andliabilities (excluding sight positions) and by afocused analysis of the medium/long-termcomponent. With regards to this medium/long-term component, the gap betweenmedium/long-term lending and borrowing isanalysed in terms of total stock and the flows ofmaturing positions. In this way, the Bank is in aposition to make informed funding policydecisions with regards to bond issues both athome and abroad.During 2003, the assignment of a credit riskrating to the Bank’s customer portfoliocontinued. The project was coordinated by theCredit Division and the Research, Planning andManagement Control office. The estimationphase for the small and medium-sized businesssegment was completed and the first probabilitydefault figures were produced. On the basis ofinitial tests applied to the model, probability ofdefault estimates are in line with the dynamics ofdefault expected over various risk classes withinthe small and medium-sized business segment.In parallel, The evaluation and application ofcredit risk models to other customer segmentscontinued during the year. Banca Carige’scorporate clients are assigned a rating resultingfrom internal data and an evaluation providedby the depositary of financial documentation“Centrale dei Bilanci” within the confines of the
Credit Risk Information Systems project (CRIS).Retail customers are rated according to ascoring procedure. The CRIS project includes therealisation of a credit data warehouse thatprovides data for rating. In addition toevaluating the probability of default, a project isunderway for the calculation of loss givendefault. Initial estimates generated according toproduct and security types are in line with recentstudies carried out by the Bank of Italy.In addition, the construction is underway of twodata banks, the first stores data relating to therecovery of past default positions, whilst thesecond contains data on guarantees. Finally, adata bank is being constructed to support aninternal model for the forecasting of exposure atdefault which is able to monitor the dynamics ofamounts granted and used, differentiated bycustomer class and product types. A portfoliomodel is also being developed that will providerisk and earnings-related information.During the next stages of the project, forecastedfor 2004, the probability of default of customersin all segments will be tested; during the samephase procedures relating to the data provisionof calculation engines will become operational.Other measures include the definition of LGDand EAD archives and the testing of the portfoliomodel designed for the calculation of capital atrisk stemming from unexpected credit-relatedlosses.At an organisational level, the Administrativebodies of the Bank establish guidelines relatingto credit and on the basis of these the CreditDivision is responsible for deciding and

65
coordinating operational policy. The variousaspects relating to lending (granting,management, control) are regulated by arecently updated, specific consolidateddocument, the aim of which is to increase theefficiency and effectiveness of the process, whilstat the same time seeking conformity withnational and international regulations.During 2003, credit policy continued to beconsistent with Carige’s retail vocation.Particular attention was placed on families,craftsmen, shopkeepers, and small andmedium-sized businesses. Ties with ourcorporate clients were strengthened thanks tothe network of corporate advisors assigned tomedium-sized businesses with a turnoverranging from 1.5 to 25 million euros. Anothersignificant example of innovation in Carige’slending policy and proof of the strategicimportance this activity has and will have for theBank is corporate finance; in this area BancaCarige intends to be a reference point forbusinesses in the supply of innovative services.The established policy of diversification wasfavoured during the year by continuedexpansion of the Group’s traditional distributionnetwork. Whilst maintaining its traditionalsupport for the Ligurian economy, Carigeextended its lending activities into new areaswith the aim of exploiting the businessopportunities on offer.The process of granting overdraft facilities isorganised on the basis of an informationplatform (‘Pratica Elettronica’) made up byintegrated sub-systems powered by variousoperational units and supported by variousinformation providers. This platform, equippedto process data generated by rating models, isexpected to be introduced into the operatingnetwork midway through 2004.Organisationally, lending is under the control ofthe Credit Division. A series of delegatedresponsibilities drawn up by the Board ofDirectors foresees limits to powers grantingoverdraft facilities or their extension in relation tostaff member seniority and level of risk. Thegranting of loans is divided into three categoriesaccording to the type of security provided andthe overall level of risk. The system of controlhas been put in place in order to guarantee thenecessary separation between operationalmanagement and risk control. Within the CreditDivision, a special credit recovery unit isresponsible for the profitable management of
bad loan positions as well as the collection ofamounts relating to those bad loans securitisedat the end of 2000. With regards to country-riskpositions, changes were made to classificationcriteria during the year. All positions are nowevaluated analytically: a risk exposure isrecorded within the appropriate risk category(bad loans, watchlists, restructured positions),determining the related, analytically calculatedwritedown.Policies aimed at managing and limiting creditrisk range from traditional approaches, such asthe demand for particular commitments, toinnovative forms such as securitisation and theuse of derivatives (credit default swaps). TheInternal Credit Rating project described abovewill have a significant effect also on theorganisation and management of credit in linewith Basle Committee recommendations.The present phase of expansion in the BancaCarige Group requires accurate organisationaland technological assessment that provideseffective strategic and management tools. Withthis in mind, a special work group has been setup to redesign the lending process and seekheightened efficiencies by exploiting flows ininformation, activities, instruments, roles. Thework group’s duties include defining thefunctional needs of the Bank’s IC&T capabilities.The subject of operational risks is underdiscussion both within the international bankingindustry itself and amongst internationalregulators. The objective of these discussions isto design a framework of credit risk mitigationtechniques and corresponding capital adequacyratios. New guidelines by the Basle Committee(Basle 2) to be introduced from 2006 havemeant banks having to put into place systematicdata collection processes regarding operationallosses also when adopting the standardapproach. In addition, processes for thecollection of such data are a pre-requisite of theItalian Operational Losses database (DIPO) setup by ABI - the Italian Banking Association.Banca Carige is participating in this scheme andbelieves that such processes are not only usefulfrom a regulatory perspective but also as ameans of evaluating more effectively theprofit/risk ratios for each line of activity foreseenby the Basle Committee.

66
In February 2001, the Board of Directors ofBanca Carige deliberated its adherence to theCode of Best Practice in the area of Self-Regulation for Listed Companies (“the Code”).Banca Carige’s governance system is fully in linewith the requirements stated by the Code. Itshould be pointed out that the present structureof Banca Carige, its functional organisation andcompany procedures were already establishedand therefore pre-empted the Code’srequirements.Full details regarding the governance aspects ofBanca Carige and its subsidiaries are containedin the annual corporate governance reportdeposited at Borsa Italiana SpA and availablefor shareholders’ consultation along with otherdocumentation required by the Shareholders’Meeting. The same documentation can also befound at www.carige.it.
On 12th January a new branch in Gavi,Piedmont became operational. On 14th Januarythe purchase of a further 55% in the sharecapital of Priamar Finace from Stitching Farowas completed for Euros 5,500. On completionof the acquisition, Carige has now a 60%holding in the company and the formalities forthe incorporation of Priamar into the CarigeGroup began. On 16th January in accordancewith the acquisition contract stipulated on 16th
July 2003, and following authorisation on thepart of regulators, the purchase of 41.05% ofthe share capital of the holding Carinord 2 wascompleted. Through this purchase, Carige hasan indirect holding of 90% in Cassa diRisparmio di Carrara SpA. Subsequently,through the break up of the holding, Carige willhave direct control over the Carrara bank. At thesame time, the shareholders’ meeting ofCarinord 2 appointed its board. Carige’srepresentatives in the company are: as boardmember, Mr A. Sanguinetto, as Chairman of theBoard of Statutory Auditors, Mr A. Traverso, orin his absence, Mr A. Semeria. On 29th January,
the Bank of Italy informed the subsidiary CarigeAsset Management SGR SpA of its authorisationdated 10th January to operate as a managertrust. The company is enrolled in the list ofcompanies offering savings managementservices foreseen by Legislative decree 58/98(article 35, section 1). Following thisauthorisation, the relevant procedure required toupdate the directory of Italian banking groupsfollowing incorporation into the Carige Groupof Carige Asset management SGR SPA wasstarted.During the first month of 2004 the total numberof Carige staff fell by 8 in comparison to thelevel recorded on 31st December to 3,751.
Banca Carige’s strategy is to defend itsautonomy in an ever-changing financial servicesmarket. The route to such autonomy is viaexpansion in our operational capacities as auniversal bank, equipped to offer a full range ofinnovative banking, financial and insuranceservices. Today Banca Carige has a nationalpresence on the Italian banking scene. Thetransition from the local savings bank of morethan ten years ago to the present Banca Carigehas always gone hand-in-hand with financialsolidity. The share capital increase deliberatedby the Board of Directors following theresolution of the Extraordinary Shareholders’Meeting of 10th September 2003 and carriedout in the last quarter of the year is in factdestined to finance the recent acquisition ofCassa di Risparmio di Carrara and to supportfurther development of the Carige Group.Another recent addition to the Group wasCarige Asset Management SGR SpA, specificallycreated to offer savings management services toCarige Group customers.Development strategy is focused on Liguria, ourtraditional operating territory, and on theregions that Carige has added to its operationalnetwork in recent years. With regards to the first,our aim is consolidate and defend an alreadystrong position; outside Liguria, the recentarrival of the Group in many areas requires adiversified strategy in comparison to the oneapplied to Liguria. Consequently specific
CORPORATE GOVERNANCE
PROSPECTS AND CONCLUSIONS
SIGNIFICANT EVENTS AFTER 31ST
DECEMBER 2003

67
projects have been designed to accelerate theprocess of achieving cost and income synergiesby optimising the use of the Group’sdistributional assets (particularly with referenceto integration between banking branches andinsurance offices) and by heightening marketpenetration through contributions from headoffice in terms of product, finance and supportsystems.The project designed is characterised by fiveguidelines:
- marked refocus of commercial activities bymeans of the review and overhaul of supportsystems, governance, and resources;
- synergic management of the Group’s banksand insurance companies;
- product and distribution improvements of theGroup’s integrated product portfolio(banking, finance, insurance, and pensions);
- thorough review of Group-wide organisation;- update of infrastructure and ICT capabilities.

68
To the Shareholders of Banca Carige,
Your Bank during 2003 achieved continuedgrowth in spite of the uncertain economic andfinancial climate. The positive results describedin this Report along with those of recent yearswill provide support for our future developmentas a national universal financial servicesprovider.The Board of Directors would like to thank allthose who have contributed to the developmentof Banca Carige and the Carige Group.In particular, thanks are owed to ourshareholders who continue to provide supportnot least during the recent share capitalincrease.We are proud to serve our customers. Ourcommitment is to strive to provide them with
service and courtesy and to maintain the strongties that exist between them and the Bank.Our thanks must go also to management andstaff for their contribution during the year as wellas to employees' trade union representatives.The assistance provided to us by the Board ofStatutory Auditors in their carrying out of theiroversight duties was invaluable. Many thanksclearly go to each member.Finally, we would like to express ourappreciation of the work of the Italian bankingindustry's three regulators, the Bank of Italy,Consob, and Borsa Italiana SpA. Here, too, theyprovided crucial support and advise, mostrecently during the equity raising operationcarried out at the end of the year. Relations witheach was at all times characterised by efficiencyand cordiality.
Genoa, 22nd March 2004 The Board of Directors

69
FINANCIAL STATEMENTS 2003

70
ASSETS (Euros) 31/12/03 31/12/02 10 CASH AND DEPOSITS WITH CENTRAL BANKS AND
POST OFFICES 168,108,987 173,442,144 20 TREASURY BILLS AND SIMILAR BILLS ELIGIBLE
FOR REFINANCING WITH CENTRAL BANKS 691,015,303 311,013,873 30 DUE FROM BANKS: 938,835,859 1,355,666,985
(a) repayable on demand 378,479,247 543,975,886(b) other deposits 560,356,612 811,691,099
40 LOANS TO CUSTOMERS 8,440,644,395 7,909,841,011of which:– loans using funds managed on behalf of third parties 255,085 188,271
50 BONDS AND OTHER DEBT SECURITIES: 1,257,740,066 1,598,436,717(a) issued by public bodies 637,804,472 929,013,187(b) issued by banks 347,559,993 386,495,503 including: – own securities 58,847,894 43,086,973(c) issued by financial institutions 187,991,247 189,257,588 including: – own securities - - (d) issued by others 84,384,354 93,670,439
60 SHARES, QUOTAS AND OTHER EQUITY 177,932,293 172,906,895 70 EQUITY INVESTMENTS 31,013,184 51,989,048 80 INVESTMENTS IN GROUP COMPANIES 617,016,378 586,521,902 90 INTANGIBLE FIXED ASSETS 473,529,817 480,133,095
including:– start-up costs 3,249,903 1,047,254– goodwill 442,391,686 450,799,263
100 TANGIBLE FIXED ASSETS 920,539,261 865,460,026including:– financial lease 662,598,015 605,418,004
120 OWN SHARES 426 11,618,829(nominal value: 228)
130 OTHER ASSETS 837,370,047 795,486,591140 ACCRUED INCOME AND PREPAID EXPENSES: 99,308,198 81,299,987
(a) accrued income 91,407,515 71,817,322(b) prepaid expenses 7,900,683 9,482,665 including: – discount on bonds issued 3,595,731 4,424,826
TOTAL ASSETS 14,653,054,214 14,393,817,103
BALANCE SHEET

71
LIABILITIES AND STOCKHOLDERS’ EQUITY (Euros) 31/12/03 31/12/0210 - AMOUNTS OWED TO CREDIT INSTITUTIONS: 1,139,631,489 1,797,348,171
(a) repayable on demand 89,045,616 70,008,790(b) with agreed maturity dates or periods of notice 1,050,585,873 1,727,339,381
20 AMOUNTS OWED TO CUSTOMERS: 5,957,888,132 5,912,248,247(a) repayable on demand 5,798,105,078 5,504,428,547(b) with agreed maturity dates or periods of notice 159,783,054 407,819,700
30 DEBTS EVIDENCED BY CERTIFICATES: 4,067,493,688 3,323,926,021(a) bonds 3,653,862,730 2,853,873,655(b) certificates of deposits 326,768,574 397,349,481(c) other 86,862,384 72,702,885
40 FUNDS MANAGED ON BEHALF OF THIRD PARTIES 368,148 309,958 50 OTHER LIABILITIES 579,839,081 813,613,790 60 ACCRUED EXPENSES AND DEFERRED INCOME: 163,572,023 144,443,634
(a) accrued expenses 95,528,365 80,732,500(b) deferred income 68,043,658 63,711,134
70 RESERVE FOR TERMINATION INDEMNITIES 78,302,511 84,941,214 80 RESERVES FOR RISKS AND CHARGES 433,675,763 429,445,625
(a) reserves for pensions and similar commitments 289,632,000 287,888,000(b) reserves for taxation 111,262,752 109,433,954(c) other reserves 32,781,011 32,123,671
90 RESERVES FOR LOAN LOSSES 18,000,000 13,000,000100 RESERVES FOR GENERAL BANKING RISKS - 5,164,569110 SUBORDINATED LOANS 502,054,948 400,000,000120 CAPITAL STOCK 1,113,326,839 1,020,549,614130 ADDITIONAL PAID-IN CAPITAL 255,023,120 136,095,340140 RESERVES 229,722,987 199,956,777
(a) legal reserve 67,351,094 56,869,285(b) reserve for purchase of treasury stock 426 11,618,829(c) statutory reserves - - (d) other reserves 162,371,467 131,468,663
150 REVALUATION RESERVES 7,956,058 7,956,058170 NET INCOME 106,199,427 104,818,085
TOTAL LIABILITIES AND STOCKHOLDERS’ EQUITY 14,653,054,214 14,393,817,103
GUARANTEES AND COMMITMENTS 10 GUARANTEES GIVEN 1,271,681,334 1,321,237,793 including:
– acceptances 2,610,263 4,209,416– other guarantees 1,269,071,071 1,317,028,377
20 COMMITMENTS 910,193,337 770,377,841 including:
– repurchase agreements - -

72
INCOME STATEMENT
(Euros) 31/12/03 31/12/02 10 - INTEREST INCOME AND SIMILAR REVENUES 546,477,707 566,999,876
including:– loans and advances to customers 439,720,446 431,518,135– fixed-income securities 82,753,323 110,237,444
20 - INTEREST EXPENSES AND SIMILAR CHARGES - 221,820,499 - 263,694,497including:– amounts owed to customers - 49,653,703 - 62,712,908– securities issued - 123,950,862 - 137,141,038
30 - DIVIDENDS AND OTHER REVENUES: 63,957,867 87,245,346(a) from shares, quotas and other equity securities 13,085,276 2,847,659(b) from equity investments 8,700,435 40,412,673(c) from equity investments in group companies 42,172,156 43,985,014
40 - COMMISSION INCOME 179,169,160 160,709,881 50 - COMMISSION EXPENSES - 15,626,680 - 12,824,712 60 - GAINS (LOSSES) FROM FINANCIAL
TRANSACTIONS, NET 9,229,491 - 5,989,028 70 - OTHER OPERATING INCOME 160,752,411 123,888,604 80 - ADMINISTRATIVE COSTS: - 366,712,276 - 321,821,106
(a) personnel - 234,968,218 - 199,388,445 including: – wages and salaries - 153,683,393 - 138,175,948 – social security costs - 42,895,611 - 38,266,823 – termination indemnities - 9,257,745 - 8,607,663 – pensions and similar commitments - 17,763,598 - 5,246,624(b) other administrative costs - 131,744,058 - 122,432,661
90 - DEPRECIATION AND AMORTIZATION OF INTANGIBLE AND TANGIBLE FIXED ASSETS - 123,207,101 - 91,052,099
100 - PROVISIONS FOR RISKS AND CHARGES - 3,966,097 - 3,175,799110 - OTHER OPERATING EXPENSES - 7,747,138 - 5,800,244120 - PROVISIONS FOR LOAN LOSSES AND FOR
GUARANTEES AND COMMITMENTS - 66,781,495 - 59,670,323130 - RECOVERIES OF LOANS AND REVERSALS OF
PROVISIONS FOR GUARANTEES AND COMMITMENTS 9,194,962 9,863,612
140 - ADDITIONAL PROVISIONS FOR LOAN LOSSES - 18,000,000 - 13,000,000150 - WRITE-DOWNS TO FINANCIAL FIXED ASSETS - - 11,075160 - RECOVERIES OF FINANCIAL FIXED ASSETS 107,094 88,451170 - INCOME FROM ORDINARY ACTIVITIES 145,027,406 171,756,887180 - EXTRAORDINARY INCOME 30,028,911 14,559,493190 - EXTRAORDINARY EXPENSES - 7,021,459 - 2,598,295200 - EXTRAORDINARY INCOME, NET 23,007,452 11,961,198210 - VARIATION OF RESERVES FOR GENERAL
BANKING RISKS 5,164,569 - 220 - INCOME TAXES - 67,000,000 - 78,900,000230 - NET INCOME 106,199,427 104,818,085

73
FINANCIAL STATEMENTS: COMPARISON WITH 2002

74
BALANCE SHEET
ASSETS Change %(Thousands of Euros) 31/12/03 31/12/02 2003 2002 10 CASH AND DEPOSITS WITH CENTRAL BANKS AND
POST OFFICES 168,109 173,442 - 3.1 5.3 20 TREASURY BILLS AND SIMILAR BILLS ELIGIBLE
FOR REFINANCING WITH CENTRAL BANKS 691,015 311,014 … - 25.7 30 DUE FROM BANKS: 938,836 1,355,667 - 30.7 21.6
(a) repayable on demand 378,479 543,976 - 30.4 …(b) other deposits 560,357 811,691 - 31.0 - 4.8
40 LOANS TO CUSTOMERS 8,440,644 7,909,841 6.7 13.3of which:– loans using funds managed on behalf of third parties 255 188 35.6 -
50 BONDS AND OTHER DEBT SECURITIES: 1,257,740 1,598,437 - 21.3 - 16.8(a) issued by public bodies 637,805 929,013 - 31.3 - 6.1(b) issued by banks 347,560 386,496 - 10.1 - 33.1 including: – own securities 58,848 43,087 36.6 - 18.8(c) issued by financial institutions 187,991 189,258 - 0.7 - 24.5 including: – own securities - - - (d) issued by others 84,384 93,670 - 9.9 - 10.2
60 SHARES, QUOTAS AND OTHER EQUITY 177,932 172,907 2.9 85.6 70 EQUITY INVESTMENTS 31,013 51,989 - 40.3 - 9.9 80 INVESTMENTS IN GROUP COMPANIES 617,016 586,522 5.2 4.5 90 INTANGIBLE FIXED ASSETS 473,530 480,133 - 1.4 34.4
including:– start-up costs 3,250 1,047 … - 66.6– goodwill 442,392 450,799 - 1.9 36.2
100 TANGIBLE FIXED ASSETS 920,539 865,460 6.4 37.9including:– financial lease 662,598 605,418 9.4 59.2
120 OWN SHARES - 11,619 - 100.0 - 46.8(nominal value: 2,313)
130 OTHER ASSETS 837,371 795,487 5.3 85.8140 ACCRUED INCOME AND PREPAID EXPENSES: 99,309 81,300 22.2 - 6.4
(a) accrued income 91,408 71,817 27.3 - 8.3(b) prepaid expenses 7,901 9,483 - 16.7 11.2 including: – discount on bonds issued 3,596 4,425 - 18.7 …
TOTAL ASSETS 14,653,054 14,393,818 1.8 12.1

75
LIABILITIES AND STOCKHOLDERS’ EQUITY Change %(Thousands of Euros) 31/12/03 31/12/02 2003 200210 - AMOUNTS OWED TO CREDIT INSTITUTIONS: 1,139,632 1,797,348 - 36.6 8.8
(a) repayable on demand 89,046 70,009 27.2 11.6(b) with agreed maturity dates or periods of notice 1,050,586 1,727,339 - 39.2 8.7
20 AMOUNTS OWED TO CUSTOMERS: 5,957,888 5,912,248 0.8 21.6(a) repayable on demand 5,798,105 5,504,428 5.3 22.4(b) with agreed maturity dates or periods of notice 159,783 407,820 - 60.8 11.0
30 DEBTS EVIDENCED BY CERTIFICATES: 4,067,494 3,323,926 22.4 2.7(a) bonds 3,653,863 2,853,874 28.0 6.0(b) certificates of deposits 326,769 397,349 - 17.8 - 16.2(c) other 86,862 72,703 19.5 3.7
40 FUNDS MANAGED ON BEHALF OF THIRD PARTIES 368 310 18.7 4.0 50 OTHER LIABILITIES 579,839 813,614 - 28.7 32.2 60 ACCRUED EXPENSES AND DEFERRED INCOME: 163,572 144,444 13.2 9.4
(a) accrued expenses 95,528 80,733 18.3 - 11.3(b) deferred income 68,044 63,711 6.8 55.3
70 RESERVE FOR TERMINATION INDEMNITIES 78,303 84,941 - 7.8 19.5 80 RESERVES FOR RISKS AND CHARGES 433,676 429,446 1.0 1.3
(a) reserves for pensions and similar commitments 289,632 287,888 0.6 - 3.3(b) reserves for taxation 111,263 109,434 1.7 11.6(c) other reserves 32,781 32,124 2.0 14.0
90 RESERVES FOR LOAN LOSSES 18,000 13,000 38.5 …100 RESERVES FOR GENERAL BANKING RISKS - 5,165 - 100.0 - 110 SUBORDINATED LOANS 502,055 400,000 25.5 - 120 CAPITAL STOCK 1,113,327 1,020,550 9.1 0.3130 ADDITIONAL PAID-IN CAPITAL 255,023 136,095 87.4 3.1140 RESERVES 229,722 199,957 14.9 17.5
(a) legal reserve 67,351 56,869 18.4 22.3(b) reserve for purchase of treasury stock - 11,619 - 100.0 - 46.8(c) statutory reserves - - - - (d) other reserves 162,371 131,469 23.5 29.1
150 REVALUATION RESERVES 7,956 7,956 - - 170 NET INCOME 106,199 104,818 1.3 1.2
TOTAL LIABILITIES AND STOCKHOLDERS’ EQUITY 14,653,054 14,393,818 1.8 12.1
GUARANTEES AND COMMITMENTS 10 GUARANTEES GIVEN 1,271,681 1,321,238 - 3.8 8.3 including:
– acceptances 2,610 4,210 - 38.0 - 55.7– other guarantees 1,269,071 1,317,028 - 3.6 8.8
20 COMMITMENTS 910,193 770,378 18.1 22.5 including:
– repurchase agreements - - - -

76
INCOME STATEMENT
Change %(thousands of Euros) 2003 2002 2003 2002 10 - INTEREST INCOME AND SIMILAR REVENUES 546,478 567,000 - 3.6 - 6.9
including: – loans and advances to customers 439,720 431,518 1.9 - 4.6– fixed-income securities 82,753 110,237 - 24.9 - 14.0
20 - INTEREST EXPENSES AND SIMILAR CHARGES - 221,820 - 263,694 - 15.9 - 12.2including:– amounts owed to customers - 49,654 - 62,713 - 20.8 - 3.5– securities issued - 123,951 - 137,141 - 9.6 1.0
30 - DIVIDENDS AND OTHER REVENUES: 63,957 87,245 - 26.7 …(a) from shares, quotas and other equity securities 13,085 2,847 … - 0.4(b) from equity investments 8,700 40,413 - 78.5 …(c) from equity investments in group companies 42,172 43,985 - 4.1 …
40 - COMMISSION INCOME 179,169 160,710 11.5 11.4 50 - COMMISSION EXPENSES - 15,627 - 12,825 21.8 6.7 60 - GAINS (LOSSES) FROM FINANCIAL
TRANSACTIONS, NET 9,229 - 5,989 … … 70 - OTHER OPERATING INCOME 160,752 123,889 29.8 1.8 80 - ADMINISTRATIVE COSTS: - 366,712 - 321,821 13.9 6.7
(a) personnel - 234,968 - 199,388 17.8 3.9 including: – wages and salaries - 153,683 - 138,176 11.2 18.1 – social security costs - 42,896 - 38,267 12.1 17.0 – termination indemnities - 9,258 - 8,608 7.6 - 4.4 – pensions and similar commitments - 17,764 - 5,247 … - 55.9(b) other administrative costs - 131,744 - 122,433 7.6 11.7
90 - DEPRECIATION AND AMORTIZATION OF INTANGIBLE AND TANGIBLE FIXED ASSETS - 123,207 - 91,052 35.3 13.7
100 - PROVISIONS FOR RISKS AND CHARGES - 3,966 - 3,176 24.9 14.1110 - OTHER OPERATING EXPENSES - 7,747 - 5,800 33.6 37.2120 - PROVISIONS FOR LOAN LOSSES AND FOR
GUARANTEES AND COMMITMENTS - 66,781 - 59,670 11.9 23.9130 - RECOVERIES OF LOANS AND REVERSALS OF
PROVISIONS FOR GUARANTEES AND COMMITMENTS 9,195 9,863 - 6.8 75.8
140 - ADDITIONAL PROVISIONS FOR LOAN LOSSES - 18,000 - 13,000 38.5 …150 - WRITE-DOWNS TO FINANCIAL FIXED ASSETS - - 11 … - 59.3160 - RECOVERIES OF FINANCIAL FIXED ASSETS 107 88 21.6 - 66.5170 - INCOME FROM ORDINARY ACTIVITIES 145,027 171,757 - 15.6 0.1180 - EXTRAORDINARY INCOME 30,028 14,559 … - 5.9190 - EXTRAORDINARY EXPENSES - 7,021 - 2,598 … 0.4200 - EXTRAORDINARY INCOME, NET 23,007 11,961 92.4 - 7.1210 - VARIATION OF RESERVES FOR GENERAL
BANKING RISKS 5,165 - … …220 - INCOME TAXES - 67,000 - 78,900 - 15.1 - 2.5230 - NET INCOME 106,199 104,818 1.3 1.2

77
INTRODUCTION
These financial statements have beenprepared in compliance with Legislativedecree 87/92 and the Bank of Italy provisiondated 30/7/92 and subsequentmodifications.The Balance Sheet and Income Statementshow amounts in Euro. Comparison is madeto the business year ending 31/12/02.Captions which show no amounts in thebalance sheets of the periods underexamination have not been entered.In the explanatory notes, amounts areexpressed in millions of Euros, unlessotherwise stated. Captions which show noamounts for the periods under examinationhave been omitted. Further information notforeseen by the above-mentioned regulationsand provisions has been supplied wherejudged appropriate.Section 11.8 - “Securitisation” containsinformation on the securitisation of creditscarried out in December 2000 and 2001(non performing loans in the first operation,performing mortgages in the second). Detailsare also given of the securitisation of badloans carried out at the end of 2002 byCassa di Risparmio di Savona, in whichBanca Carige is servicer.
The report is completed by the followingattached statements:- statement of changes in stockholders’
equity;- statement of cash flow;- statement in accordance with article 7,
Law 218/90 (abstract);- properties;- leased fixed assets re-valued in
accordance with Law 413/91;- convertible bonds;- list of non-significant investments;- information on subsidiaries and other
significant company interests;- key data relating to Carige Open
Pension Fund;
- list of exchange rates used in convertingcurrency into euro.
Consob request for information(Consob communication no. 1011405dated 15/2/2001)Below is presented the information Italianbanks are required to supply to Consobupdated for the years 2000/2003.
a) Tax relief foreseen by articles22 and 23 of Legislative decree153/99. The European Commission in itsdecision of 11th December 2001 judged thetax relief foreseen by Legislative decree153/99 as state aid incompatible with theprinciples of the common market.
The Italian Government lodged an appealagainst the decision with the Court ofEuropean Justice. The Italian BankingAssociation (ABI) also presented on 25th
February 2002 an appeal against thedecision in front of the Tribunal ofLuxembourg. Banca Carige actively supportsABI’s decision and will give the necessaryhelp required in preparing an effective line ofdefence.
On 15th June 2002 Law decree 63/2002was converted into Law 212/2002implementing the European Commission’sdecision and suspending the tax reliefcontained in articles 22 and 23 of Legislativedecree 153/99 from 2001 until the questionis resolved. From 2001 onwards awaitingjudgement on ABI’s appeal, the Banksuspended special reserve provisions. On24th December 2002 Law decree 282/02was enacted which, in carrying out theprovisions of the EU Commission, obligedthose banks which had benefited fromLegislative decree 153/99 to return the sumsowed plus interest charges within 31/12/02.The Bank repaid 1,557 thousand. Given thenature of the case (litigation with theEuropean Community) this amount wasrecorded at item "tax credits".
E X P L A N A T O R Y N O T E S

78
The total credit is matched by adequateprovisions to tax reserves in the event of anegative decision on the part of the Court.
b) Special rate mortgages (Law133/99 and article 145 of Lawaccompanying 2001 Budget). Article29 of Law 133/99 foresees the re-negotiation of mortgage interest rates at areference rate equal to the system-wideaverage (as defined by article 145 of the Lawaccompanying the 2001 budget), with thesubsequent charges, all or in part, to becovered by the State or public bodies.The renogotiation rate to be applied wasestablished by article 2 of the Economy andFinance Ministry's Decree dated 31/3/03.On renegotiation at the rate defined in theabove Decree, charges calculated by theBank for 2003 and previous years will bemet by the specific reserve constituted in2000.
c) Capitalisation of interest due(Constitutional Court Sentence 425 of9/10/00). The Constitutional Court’s rulingnumber 425 of 9/10/00 declaredillegitimate the contents of article 25,Legislative decree 344/99. The articleexcluded from liability to legal action thoseclauses between banks and customersrelating to capitalisation of interest duesigned after the coming into effect of theInter-ministerial Committee for Credit andSaving’s deliberation of 22/4/00, enactingLegislative decree 344/99.The Constitutional Court confined itsjudgement exclusively to a criticism of thegovernment in its enactment of the above-mentioned law. In the light of the fact that the
judges of the Constitutional Court did notenter into the merits of the question above,Banca Carige has declined the few requestsit has received from customers for the returnof interest paid as a result of the quarterlycapitalisation of bank interest income untilJune 2000.The number of actions started for the returnof interest charges paid has progressivelydecreased over time. Given that it isreasonable to expect that the actions will betime-barred after ten years, the exceptionableperiod of time as at 2003 is reduced from1994 to 30th June 2000.For the limited number of actions started, theBank strongly contests the grounds forreturning amounts previously paid also in thelight of differing positions regarding thematter on the part of judges. If anything, themajority of first instance and appeal courtjudges have so far upheld the validity ofusing different time periods for thecalculation of customers’ interest income andcharges.
Consolidated Financial Statements forthe Banca Carige Group have beenprepared.
These financial statements wereaudited by Deloitte & Touche SpA. Theselection of the Bank’s auditors for the period2003-2005 was approved by theShareholders’ Meeting of 31/3/03 pursuantto Legislative decree 58/98. The duties of theauditors for the period are the auditing of theBank’s financial statements, the consolidatedfinancial statements, and a limited review ofthe half yearly report at 30 June.
79
SECTION 1
The Accounting Policies are in compliancewith law decree 87/92 and the Bank ofItaly’s provisions of 30/7/92 and subsequentmodifications and are the same as thoseused in the previous year.
LOANS, GUARANTEES ANDCOMMITMENTSLoans are stated at their estimated realizablevalue and are determined according todebtors’ solvency and the debt-payingdifficulty of the debtors’ home country.The valuation of loans is made under theapplication of either an analytic or lump-summethod.The interest on overdue loans is adjusted bythe portion of loans considered to beirrecoverable.Reserves for loan losses, recorded under“Liabilities”, have been created only to offsetcontingent credit risks.Reserves for guarantees and commitments,recorded under “Liabilities” have beencreated to offset this particular kind of risk.
SECURITIES PORTFOLIO AND OFF-BALANCE SHEET TRANSACTIONSEXCLUDING THOSE IN CURRENCYInvestment securitiesInvestment securities are valued at cost,adjusted on an accruals basis for thedifference between cost and their redemptionat maturity and includes unamortized issuepremiums or discounts.In the event of long term deterioration of theissuer’s solvency, the securities are writtendown. In the case of those securities derivingfrom structured securitised debt transactions,writing down is carried out on the basis ofexpected proceeds stemming from theunderlying.The original value of investment securities isreinstated when the reasons for writing downcease to apply.
Trading securities.
– trading securities quoted on organisedmarkets are valued either at purchaseprice or the average market price for thelast month, whichever is lower;
– securities not quoted on organisedmarkets are valued at cost adjusted formarket trends and issuer solvency. In thecase of those securities deriving fromstructured securitised debt transactions,value adjustments are carried out on thebasis of expected proceeds stemmingfrom the underlying.
The purchase price, determined according tothe principle of daily weighted average,includes adjustments for the relevant quota ofissue premium or discount accumulatedduring the period the securities are held.Securities held at 1/12/91 and still inportfolio at 31/12/2003 are valued at costdefined as the value of transfer to BancaCarige at 1/12/91 and adjusted for issuepremium or discount pursuant to Legislativedecree 719/94 and subsequent changes.The original value of the securities is re-instated when the reasons for writing downcease to apply.Any securities to be transferred from theinvestment to trading portfolio will berecorded at the book value on the date oftransfer calculated on the basis of the criteriaapplied to investment securities foreseen inthe Bank of Italy’s communication of12/6/01, CONSOB’s communicationn.95001286 of 15/2/95, the latter modifiedby CONSOB’s letter dated 15/6/01.Securities transferred still present in portfolioat year end are valuated according to thecriteria applied to the portfolio to which theyare destined
Off balance sheet operations,excluding those in currencyUnsettled securities transactions areevaluated according to the criteria of theportfolio to which they are destined.
P A R T AACCOUNTING PRINCIPLES

80
Unsettled trading securities transactions areevaluated accordingly:
a) with regards to commitments to purchaseand commitments to sell which have thesame underlying securities with the samenominal value, any positive differencebetween the settlement price of thecommitment to purchase and thesettlement price of the commitment to sellis recorded in the income statement;
b) the residual commitments to purchaseare evaluated at either settlement priceor market price whichever is lower;
c) the residual commitments to sell areevaluated at either settlement price orbook value, whichever is lower.
Derivative contracts on securities, interestrate etc., are evaluated accordingly:
a) contracts related to underlying equityinvestments are evaluated at cost andwritten down in the event of long-termdeterioration of the issuer's solvency;
b) trading derivatives contracts areevaluated at either cost or market value,whichever is lower. Market value ofcontracts is that quoted at the last day ofthe business year. Those contracts whichare not quoted on organised markets butwhich can be evaluated according toofficial parameters, are evaluated atreplacement cost at the last day of theperiod;
c) economically-linked trading contracts,which are closely correlated bothtechnically and financially, are evaluatedin the same way. The losses whichexceed connected gains are recorded inthe income statement;
d) hedging contracts on trading securitiesare evaluated in the same way as theunderlying; market value is the averageof prices and parameters recorded in thelast month of the period. Losses whichexceed gains on securities or gains which
correspond to losses on securities arerecorded in the income statement;
e) hedging contracts on assets and liabilitieswhich are evaluated at cost are in turnevaluated at cost.
EQUITY INVESTMENTSThe Bank’s stock rights in relation to itssubsidiaries are included under holdings.These rights, in the form of securities or not,are held for investment.Holdings, both substantial and those inGroup subsidiaries, are valued at purchasecost or subscription. With regard toinvestments resulting from the transfer ofassets on 1/12/91, the cost was estimated bya group of experts. The cost is written downto reflect any permanent loss in value. Theoriginal value is reinstated when the reasonsfor writing down ceased to apply.The dividends of the subsidiaries arerecorded in the same accounting period inwhich the related profit accrued. As at31/12/03, pursuant to Legislative decree344/03 these dividends, previously recordedinclusive of related tax credit, are recordednet at distribution value.The dividends on other equity investments arerecorded in the accounting period in whichthey were deliberated, usually coinciding withthe period of collection.
FOREIGN CURRENCY ASSETS ANDLIABILITIES INCLUDING OFF-BALANCE SHEET TRANSACTIONSAssets, excluding equity investments, andliabilities expressed in foreign currencies arevalued applying the spot rate at31/12/2003.Equity investments expressed in foreigncurrencies are valued according to the rate inforce at the time of purchase.Off-balance sheet transactions expressed inforeign currencies are valued:
– at the spot rate as of the last businessday of the period in the case of unsettledspot contracts;

81
– at the forward exchange rate as of thelast business day of the period formaturities corresponding to those of thecontracts being valued, in the case offorward transactions.
In the case of on-balance sheet assets andliabilities linked to off-balance sheet assetsand liabilities, off-balance sheet items areaccounted for in a manner similar to theaccounting of on-balance sheet items.
TANGIBLE FIXED ASSETSTangible assets are recorded at purchaseprice plus related charges, and includeleased assets and those assets that are to beleased.The value of those assets transferred fromCassa di Risparmio di Genova e Imperia toBanca Carige on 1/12/91 was estimated bya group of experts.The value of tangible fixed assets includesrevaluation in accordance with Laws 575/75,72/83, 413/91 (only for some assetstransferred by merged companies) and withreference to revaluations, Law 218/90.Advances to supplies for the purpose oftangible fixed assets are included undertangible fixed assets.Depreciation is determined by using thestraight-line method over the useful life ofeach category. Objects of art, being assetswhich conserve if not increase their value,are not amortized.
Included in this category are leased assets, inline with the equity method, and areamortized as follows:
– assets leased from 1986 to 1987 aredepreciated to the maximum extentforeseen for each type of user aspermitted by tax law;
– assets leased from 1988 to 1994 aredepreciated on a fixed percentage basisin compliance with Presidential decree917/86;
– assets leased from 1995 onwards aredepreciated as established in the relevantfinancial amortization plan;
– assets to be leased and assets stolen ordestroyed are not amortized.
Tangible fixed assets, including assets leasedor to be leased, are depreciated on astraight-line basis.
INTANGIBLE FIXED ASSETSIntangible fixed assets are, in those casesforeseen by relevant legislation, recordedwith the consent of the Board of StatutoryAuditors and are amortized on a straight-linebasis. Start-up and improvement costs inaddition to research and development costsare amortised over a period not exceedingfive years.Amortisation of goodwill stemming from thepurchase of branches from Banco di Sicilia,Gruppo Banca Intesa and Gruppo Capitaliawill be carried out over twenty years; from 1st
January 2001, 1st October 2001 and 1st
January 2003.The period of amortisation chosencorresponds to the average period ofgoodwill intrinsic in the branch networkacquired.Amortisation rates on goodwill deriving fromthe purchase of branches stem from theapplication of an analytical model whichtakes into account the expected returns onthe branches acquired and the period of timerequired for their integration into the BancaCarige Group.The method utilises a rising-charge rate untilthe integration of the branches acquired iscompleted (2006 for the ex-Banco di Siciliabranches; 2007 for the ex-Gruppo BancaIntesa branches and 2008 for the ex-GruppoCapitalia branches). Post-integrationamortisation will be on a fixed-charge basis.A weighted average rate of 1.87% wasapplied for 2003.
PAYABLESPayables are recorded at face value with theexception of zero coupon and one coupon

82
debt securities, which are recorded at avalue corresponding to net proceeds plusaccrued interest.
TERMINATION INDEMNITYTermination indemnity is in accordance withcurrent legislation.
RESERVES FOR RISKS AND CHARGES– RESERVES FOR TAXATIONTax reserves stem from provisions for directtaxation, deferred tax liabilities, indirecttaxation and other unforeseen events such asrisk to liabilities after litigation.
OTHER TAX ASPECTS – DEFERREDTAX: POSITIVE AND NEGATIVEEFFECTSThe calculation of deferred tax is made onthe basis of the equity method with referenceto the timing differences existing between thevalue attributed to an asset or liability underaccounting criteria and the value attributedto the same for the calculation of tax.Tax advanced is recorded under assetssubject to the condition that, for prudentialreasons, there is a reasonable expectation ofrealising, over a period of five years, taxableincome sufficient for its recovery.The recording of liabilities for taxes payablein the future is subject to the condition thatthere is a possibility of the liability to taxoccurring.The treatment of deferred tax in thesefinancial statements is in accordance with theBank of Italy's instructions dated 3/8/99.
SUPPLEMENTARY PENSION FUNDProvisions have been made to guaranteesufficient funds as stipulated by theSupplementary Pension Agreement.
ACCRUALS AND DEFERRALSAccruals and deferrals are calculated inaccordance with the matching principle.

83
SECTION 2
TAX-RELATED ADJUSTMENTS ANDPROVISIONS
2.1 Tax Adjustments
Not carried out.
2.2 Tax provisions
No tax provisions were made during theyear.

84
SECTION 1
LOANS
The Bank’s loans portfolio, summarized in this section, amounts to 9,547,589 thousand euros and is analysed below:
31/12/03 31/12/02thousands of € % thousands of € %
– Cash and deposits with central banksand post offices (caption 10) 168,109 1.8 173,442 1.8
– Due from banks (caption 30) 938,836 9.8 1,355,667 14.4– Loans to customers (voce 40) 8,440,644 88.4 7,909,841 83.8Total 9,547,589 100.0 9,438,950 100.0
Change31/12/03 31/12/02 absolute %
CAPTION 10
168,109 173,442 -5,333 -3.1“CASH AND DEPOSITS WITH CENTRAL BANKS AND POST OFFICES”
Caption 10 detailed by technical form:31/12/03 31/12/02 absolute %
Cash 166,896 173,274 -6,378 -3.7Promissory notes of Bank of Italy and
postal orders and cheques 113 104 9 8.7Deposits with - central banks - - - - - post offices 1,100 64 1,036 …Total 168,109 173,442 -5,333 -3.1
- Euros 162,498 168,829 -6,331 -3.7- foreign currency 5,611 4,613 998 21.6
PART BBALANCE SHEET

85
Change31/12/03 31/12/02 absolute %
1.1 CAPTION 30 "DUE FROM BANKS" 938,836 1,355,667 -416,831 -30.7(a) deposits with central banks 102,385 143,794 -41,409 -28.8(b) bills elegible for refinancing by central banks - - - - (c) repurchase agreements - 19,454 19,454- -100.0(d) loan of securities - - - -
Caption 30 detailed by technical form and currency is the following:
Change31/12/03 31/12/02 absolute %
Nominal valueDeposits with central banks 102,385 143,794 -41,409 -28.8– Compulsory reserves 102,385 143,794 -41,409 -28.8Deposits with banks 840,347 1,219,788 -379,441 -31.1– Deposits 729,981 1,024,313 -294,332 -28.7– Repurchase agreements - 19,454 -19,454 -100.0– Discounted notes 1,029 2,795 -1,766 -63.2– Overdraft facilities 71,534 82,565 -11,031 -13.4– Loans (Financial backing) 11,098 61,645 -50,547 -82.0– Long term loans 1,364 211 1,153 …– Bad loans 17,455 21,720 -4,265 -19.6– Other 7,886 7,085 801 11.3
942,732 1,363,582 -420,850 -30.9(–) Total specific allowances 3,896 7,915 -4,019 -50.8– bad loans 3,383 7,648 -4,265 -55.8– other loans 513 267 246 92.1Total 938,836 1,355,667 -416,831 -30.7 of which:– resident Euros 557,033 993,728 -436,695 -43.9– resident foreign currency 21,461 31,505 -10,044 -31.9– non-resident Euros 303,578 262,954 40,624 15.4– non-resident foreign currency 56,764 67,480 -10,716 -15.9
At 31/12/03, all non-guaranteed credits to residents outside the OECD were valuated analytically; credit risk positions areclassified as either bad loans or watchlists.
1.2 CASH CREDITS BANKS 31/12/03 31/12/02
CATEGORIES/BALANCES Gross valueSpecific
allowancesNet value Gross value
Specific allowances
Net value
A. Credits at risks 19,281 3,896 15,385 23,132 7,915 15,217A.1 Bad loans 17,455 3,383 14,072 21,720 7,648 14,072A.2 Watchlists 792 513 279 445 267 178A.3 Credits undergoing restructuring - - - - - - A.4 Restructured loans - - - - - - A.5 Non-guaranteed credits towards countries at risk 1,034 - 1,034 967 - 967
B. Performing credits 923,451 - 923,451 1,340,450 - 1,340,450

86
At 31/12/03, items A.1 “Bad loans” and A.2 “Watchlists” refer entirely to country-risk positions.
1.3 DOUBTFUL LOANS BANKS
CATEGORIES/BALANCES Bad loans WatchlistsLoans subject
to rescheduling
Rescheduled loans
Country risk non-
guaranteed loans
A. Total opening exposure at 31/12/02 21,720 445 - - 967A.1 of which: interest on overdue loans 364 - - - -
B. Increases 1,101 502 - - 701B.1 ex-performing loans - - - - - B.2 interest on overdue loans 1,100 - - - - B.3 transfer from other doubtful loan categories - 484 - - - B.4 other increases 1 18 - - 701
C. Decreases 5,366 155 - - 634C.1 re-performing credits - - - - - C.2 write offs 5,366 - - - - C.3 payments received - - - - 1C.4 gains from ceding - - - - - C.5 transfer to other doubtful loan categories - - - - 484C.6 other decreases - 155 - - 149
D. Total closing exposure at 31/12/2003 17,455 792 - - 1,034D.1 of which: interest on overdue loans 1,100 - - - -
CATEGORIES/BALANCES Bad loans WatchlistsLoans subject
to rescheduling
Rescheduled loans
Country risk non-
guaranteed loans
A. Total opening exposure at 31/12/01 - - - - 22,592A.1 of which: interest on overdue loans - - - - -
B. Increases 21,720 21,885 - - 59B.1 ex-performing loans - - - - - B.2 interest on overdue loans 364 - - - - B.3 transfer from other doubtful loan categories 21,356 21,303 - - - B.4 other increases - 582 - - 59
C. Decreases - 21,440 - - 21,684C.1 re-performing credits - - - - - C.2 write offs - - - - - C.3 payments received - - - - - C.4 gains from ceding - - - - - C.5 transfer to other doubtful loan categories - 21,356 - - 21,303C.6 other decreases - 84 - - 381
D. Total closing exposure at 31/12/2002 21,720 445 - - 967D.1 of which: interest on overdue loans 364 - - - -
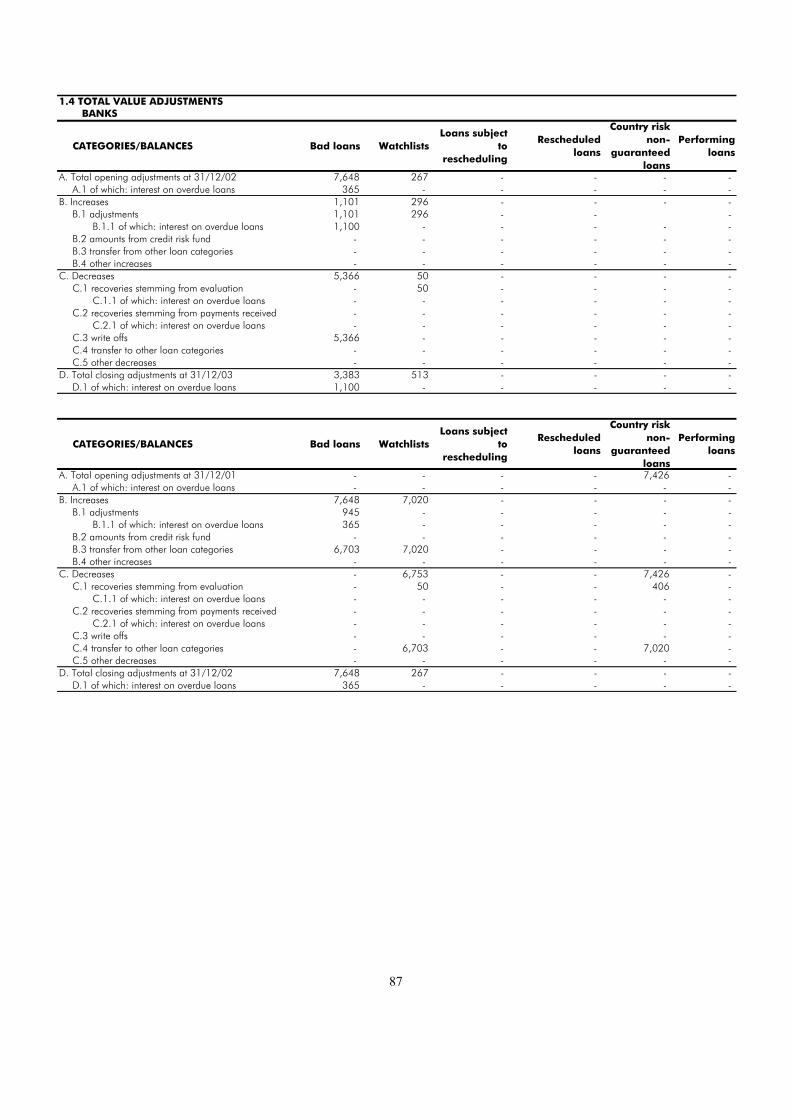
87
1.4 TOTAL VALUE ADJUSTMENTS BANKS
CATEGORIES/BALANCES Bad loans WatchlistsLoans subject
to rescheduling
Rescheduled loans
Country risk non-
guaranteed loans
Performing loans
A. Total opening adjustments at 31/12/02 7,648 267 - - - - A.1 of which: interest on overdue loans 365 - - - - -
B. Increases 1,101 296 - - - - B.1 adjustments 1,101 296 - - - B.1.1 of which: interest on overdue loans 1,100 - - - - - B.2 amounts from credit risk fund - - - - - - B.3 transfer from other loan categories - - - - - - B.4 other increases - - - - - -
C. Decreases 5,366 50 - - - - C.1 recoveries stemming from evaluation - 50 - - - - C.1.1 of which: interest on overdue loans - - - - - - C.2 recoveries stemming from payments received - - - - - - C.2.1 of which: interest on overdue loans - - - - - - C.3 write offs 5,366 - - - - - C.4 transfer to other loan categories - - - - - - C.5 other decreases - - - - - -
D. Total closing adjustments at 31/12/03 3,383 513 - - - - D.1 of which: interest on overdue loans 1,100 - - - - -
CATEGORIES/BALANCES Bad loans WatchlistsLoans subject
to rescheduling
Rescheduled loans
Country risk non-
guaranteed loans
Performing loans
A. Total opening adjustments at 31/12/01 - - - - 7,426 - A.1 of which: interest on overdue loans - - - - - -
B. Increases 7,648 7,020 - - - - B.1 adjustments 945 - - - - - B.1.1 of which: interest on overdue loans 365 - - - - - B.2 amounts from credit risk fund - - - - - - B.3 transfer from other loan categories 6,703 7,020 - - - - B.4 other increases - - - - - -
C. Decreases - 6,753 - - 7,426 - C.1 recoveries stemming from evaluation - 50 - - 406 - C.1.1 of which: interest on overdue loans - - - - - - C.2 recoveries stemming from payments received - - - - - - C.2.1 of which: interest on overdue loans - - - - - - C.3 write offs - - - - - - C.4 transfer to other loan categories - 6,703 - - 7,020 - C.5 other decreases - - - - - -
D. Total closing adjustments at 31/12/02 7,648 267 - - - - D.1 of which: interest on overdue loans 365 - - - - -

88
Change31/12/03 31/12/02 absolute %
1.5 CAPTION 40 "LOANS TO CUSTOMERS" 8,440,644 7,909,841 530,803 6.7(a) bills elegible for refinancing by central banks - - - - (b) repurchase agreements - - - - (c) loan of securities - - - -
Caption 40 detailed by technical form is the following:
Change31/12/03 31/12/02 absolute %
Nominal valueDiscounted notes 31,429 36,880 -5,451 -14.8Advances with recourse 240,146 286,322 -46,176 -16.1Overdrafts 1,318,099 1,379,134 -61,035 -4.4Other non-overdrafts loans 1,988,411 2,056,745 -68,334 -3.3Loans backed by pledge assets 10,575 9,709 866 8.9Loans 4,406,498 3,817,475 589,023 15.4Salary backed loans 15,173 11,593 3,580 30.9Consumer credit loans 4,242 4,338 -96 -2.2Factoring 99,141 96,174 2,967 3.1Loans for leased assets 11,685 9,242 2,443 26.4Bad loans 302,487 235,729 66,758 28.3Postal bonds 112,000 37,000 75,000 202.7Other 44,614 49,140 -4,526 -9.2
8,584,500 8,029,481 555,019 6.9(–) Total specific allowances 143,856 119,640 24,216 20.2 - Bad loans 125,123 101,650 23,473 23.1 - Other 18,733 17,990 743 4.1Total 8,440,644 7,909,841 530,803 6.7 of which:– resident Euros 7,962,194 7,362,469 599,725 8.1– resident foreign currency 217,698 295,799 -78,101 -26.4– non-resident Euros 154,745 129,867 24,878 19.2– non-resident foreign currency 106,007 121,706 -15,699 -12.9
The nominal value of credits was adjusted to take into account expected losses as follows:
31/12/03 31/12/02- analytic allowances 136,997 114,171 - lump-sum allowances 6,859 5,469
- country risks - - - other 6,859 5,469
Total 143,856 119,640
All bad loan positions are evaluated analytically as are significant watchlist and country-risk positions specified at 1.1.Other watchlists are evaluated on a lump-sum basis.
Rescheduled loans were evaluated analytically calculating future flows on the basis of the difference between renegotiatedinterest rates and the annual average yield for interbank company loans for 2003.

89
In the light of the Bank’s prudential valuation of its complete loan portfolio, provisions calculated by a lump-sum methodconcerning other “in bonis” loans were deemed unnecessary.
Change31/12/03 31/12/02 absolute %
1.6 SECURED LOANS TO CUSTOMERS 4,968,467 4,635,533 332,934 7.2(a) by mortgages 3,394,999 2,774,150 620,849 22.4(b) by pledges on: 134,508 130,064 4,444 3.4
1. Cash deposits 2,091 3,541 -1,450 -40.92. Securities 121,266 111,804 9,462 8.53. Other valuables 11,151 14,719 -3,568 -24.2
(c) by guarantees from: 1,438,960 1,731,319 -292,359 -16.91. Governments 50 86 -36 -41.92. Other public entities 7,874 5,217 2,657 50.93. Banks 11,980 11,062 918 8.34. Other operators 1,419,056 1,714,954 -295,898 -17.3
This detail does not include loans to Government and public bodies.
1.7 CASH CREDITS CUSTOMERS 31/12/03 31/12/02
CATEGORIES/BALANCES Gross valueSpecific
allowancesNet value Gross value
Specific allowances
Net value
A. Credits at risks 519,940 143,856 376,084 430,382 119,640 310,742A.1 Bad loans 309,686 125,123 184,563 240,115 101,650 138,465A.2 Watchlists 184,825 16,501 168,324 162,529 15,825 146,704A.3 Credits undergoing restructuring 2,406 - 2,406 - - - A.4 Restructured loans 11,717 2,232 9,485 9,315 2,165 7,150A.5 Non-guaranteed credits towards countries at risk 11,306 - 11,306 18,423 - 18,423
B. Performing credits 8,677,611 - 8,677,611 8,162,414 - 8,162,414
The credits presented in the table refer to balance sheet asset caption 40 "Loans and advances to customers" and to creditsrelated to finance lease transactions which totalled 613,051 thousand euros at 31/12/03. In particular, 7,199 thousandeuros is in the form of bad loans and is covered for 2,899 thousand euros by liabilities caption 80c "Reserves for loanlosses - other reserves".Finance lease transactions are included at assets caption 100 " Tangible assets" for a total of 662,598 thousand euros.Item A.1 “Bad loans” includes gross exposures and writedowns on country-risk positions of 874,000 and 37,000; itemA.2 “Watchlists” includes gross exposures and writedowns on country-risk positions totalling, respectively, 801,000 and3,000.

90
1.8 DOUBTFUL LOANS CUSTOMERS
CATEGORIES/BALANCES Bad loans WatchlistsLoans subject
to rescheduling
Rescheduled loans
Country risk non-
guaranteed loans
A. Total opening exposure at 31/12/02 240,115 162,529 9,315 18,423A.1 of which: interest on overdue loans 41,259 5,123 - - -
B. Increases 158,233 107,688 2,406 2,775 1,240B.1 ex-performing loans 86,287 99,626 2,406 2,775 - B.2 interest on overdue loans 13,077 1,742 - - - B.3 transfer from other doubtful loan categories 45,449 - - - - B.4 other increases 13,420 6,320 - 1,240
C. Decreases 88,662 85,392 - 373 8,357C.1 re-performing credits - 29,830 - 275 - C.2 write offs 49,462 159 - - - C.3 payments received 38,708 3,507 - 98 4,785C.4 gains from ceding - - - - - C.5 transfer to other doubtful loan categories - 45,449 - - C.6 other decreases 492 6,447 - - 3,572
D. Total closing exposure at 31/12/03 309,686 184,825 2,406 11,717 11,306D.1 of which: interest on overdue loans 42,219 4,755 - - -
CATEGORIES/BALANCES Bad loans WatchlistsLoans subject
to rescheduling
Rescheduled loans
Country risk non-
guaranteed loans
A. Total opening exposure at 31/12/01 202,265 158,453 - 7,902 12,495A.1 of which: interest on overdue loans 36,878 6,318 - - -
B. Increases 118,700 66,639 - 1,977 9,867B.1 ex-performing loans 57,697 57,619 - 1,977 - B.2 interest on overdue loans 11,538 1,887 - - - B.3 transfer from other doubtful loan categories 38,835 972 - - - B.4 other increases 10,630 6,161 - - 9,867
C. Decreases 80,850 62,563 - 564 3,939C.1 re-performing credits 1,706 9,932 - - - C.2 write offs 47,721 181 - 451 - C.3 payments received 31,332 3,018 - - 31C.4 gains from ceding - - - - - C.5 transfer to other doubtful loan categories - 38,835 - - 972C.6 other decreases 91 10,597 - 113 2,936
D. Total closing exposure at 31/12/02 240,115 162,529 - 9,315 18,423D.1 of which: interest on overdue loans 41,259 5,123 - - -

91
1.9 TOTAL VALUE ADJUSTMENTS CUSTOMERS
CATEGORIES/BALANCES Bad loans WatchlistsLoans subject
to rescheduling
Rescheduled loans
Country risk non-
guaranteed loans
Performing loans
A. Total opening adjustments at 31/12/02 101,650 15,825 - 2,165 - - A.1 of which: interest on overdue loans 41,259 1,282 - - - -
B. Increases 88,451 9,035 - 381 - - B.1 adjustments 68,009 9,035 - 381 - - B.1.1 of which: interest on overdue loans 13,077 - - - - - B.2 amounts from credit risk fund 13,000 - - - - - B.3 transfer from other loan categories 7,442 - - - - - B.4 other increases - - - - - -
C. Decreases 64,978 8,359 - 314 - - C.1 recoveries stemming from evaluation 799 109 - 290 - - C.1.1 of which: interest on overdue loans - 39 - - - - C.2 recoveries stemming from payments received 2,180 649 - 24 - - C.2.1 of which: interest on overdue loans 790 483 - - - - C.3 write offs 49,462 159 - - - - C.4 transfer to other loan categories - 7,442 - - - - C.5 other decreases 12,537 - - - - -
D. Total closing adjustments at 31/12/03 125,123 16,501 - 2,232 - - D.1 of which: interest on overdue loans 42,219 759 - - - -
At 31/12/2003 items B1 ‘Positive variations – writedowns’ and C5 ‘Negative variations – other variations’ include 12,455thousand euros corresponding to the amortisation charge for the year relating to losses stemming from the securitisation ofbad loans carried out at the end of 2000.
CATEGORIES/BALANCES Bad loans WatchlistsLoans subject
to rescheduling
Rescheduled loans
Country risk non-
guaranteed loans
Performing loans
A. Total opening adjustments at 31/12/01 89,930 16,940 - 1,494 344 - A.1 of which: interest on overdue loans 36,878 1,080 - - - -
B. Increases 75,036 8,178 - 1,122 - 530B.1 adjustments 61,317 7,860 - 1,122 - 530 B.1.1 of which: interest on overdue loans 11,538 202 - - - - B.2 amounts from credit risk fund 5,165 - - - - - B.3 transfer from other loan categories 8,554 318 - - - - B.4 other increases - - - - - -
C. Decreases 63,316 9,293 - 451 344 530C.1 recoveries stemming from evaluation 1,244 510 - - 26 - C.1.1 of which: interest on overdue loans - - - - - - C.2 recoveries stemming from payments received 1,805 48 - - - - C.2.1 of which: interest on overdue loans 585 - - - - - C.3 write offs 47,721 181 - 451 - 530C.4 transfer to other loan categories - 8,554 - - 318 - C.5 other decreases 12,546 - - - - -
D. Total closing adjustments at 31/12/02 101,650 15,825 - 2,165 - - D.1 of which: interest on overdue loans 41,259 1,282 - - - -

92
SECTION 2
SECURITIES
The securities held by the Bank amount to 2,126,687 thousand euros and are analysed below:
31/12/03 31/12/02thousands of € % thousands of € %
– Treasury bills and other bills eligible forrefinancing with central banks (caption 20) 691,015 32.5 311,014 14.9
– Bonds and other debt securities (caption 50) 1,257,740 59.1 1,598,437 76.8– Shares, quotas and other equity securities (caption 60) 177,932 8.4 172,907 8.3Total 2,126,687 100.0 2,082,358 100.0
of which:– Investment securities 173,737 8.2 232,733 11.2– Trading securities 1,952,950 91.8 1,849,625 88.8
Change31/12/03 31/12/02 absolute %
2.1 INVESTMENT SECURITIES 173,737 232,733 -58,996 -25.3
31/12/03 31/12/02Book Market Book Marketvalue value value value
1. Certificates of indebtedness 173,737 173,439 232,733 231,1801.1 Government securities 69,745 70,097 85,471 85,949– listed 69,745 70,097 85,471 85,949– unlisted - - - - 1.2 Other securities 103,992 103,342 147,262 145,231– listed 32,243 31,961 75,523 73,719– unlisted 71,749 71,381 71,739 71,5122. Shares and equity securities - - - - – listed - - - - – unlisted - - - - Total 173,737 173,439 232,733 231,180
Book value of investment securities comprises the difference, on the basis of “pro rata temporis” criteria, between cost andredemption value, including issue premium or discount. Market value is the average price recorded during the first sixmonths of the year.The difference between market and book value (298 thousand euros) represents the potential losses for the portfolio.The positive and negative differences between book value and re-payment value at maturity total 387 thousand euros and366 thousand euros, respectively. These differences were calculated separately for each category.

93
Book Redemption Positive Negativevalue value differences differences
1. Listed certificates of indebtedness 101,988 101,910 387 309Public bodies 69,745 69,500 303 58Banks 25,072 25,022 84 34Other 7,171 7,388 - 217
2. Unlisted certificates of indebtedness 71,749 71,806 - 57Public bodies - - - - Banks 6,059 6,116 - 57Other 65,690 65,690 - -
Total 173,737 173,716 387 366
2.2 CHANGES IN INVESTMENT SECURITIES
2003 2002A. Opening balances 232,733 441,259B. Increases 2,593 160,074
B1. Purchases - 57,609B2. Writebacks - - B3. Transfers from trading portfolio - 100,116B4. Other changes 2,593 2,349
C. Decreases 61,589 368,600C1. Sales 61,391 149,577C2. Redemptions 25 218,288C3. Adjustments including - - - permanent writedowns - - C4. Transfers to trading portfolio - - C5. Other changes 173 735
D. Closing balances 173,737 232,733
Transfers to and/or from the investment securities portfolio were carried out in accordance with the Bank of Italy’scommunication of 12/6/01, CONSOB’s communication no.95001286 of 15/2/95, subsequently modified byCONSOB’s letter of 15/6/01, and the policy document approved by the Board of Directors of Banca Carige on 27/3/95,subsequently modified on 6/12/99.
During 2003, in accordance with the provisions of the above-mentioned Board of Directors’ document, a part of theinvestment securities portfolio was sold to provide liquidity for expansion in operational capacities via branch acquisitions(external growth).The sale of securities for 61,391 thousand produced a capital gain of 2,494 thousand recorded at caption 180‘extraordinary revenues’.
Captions “Other changes” are analysed below:
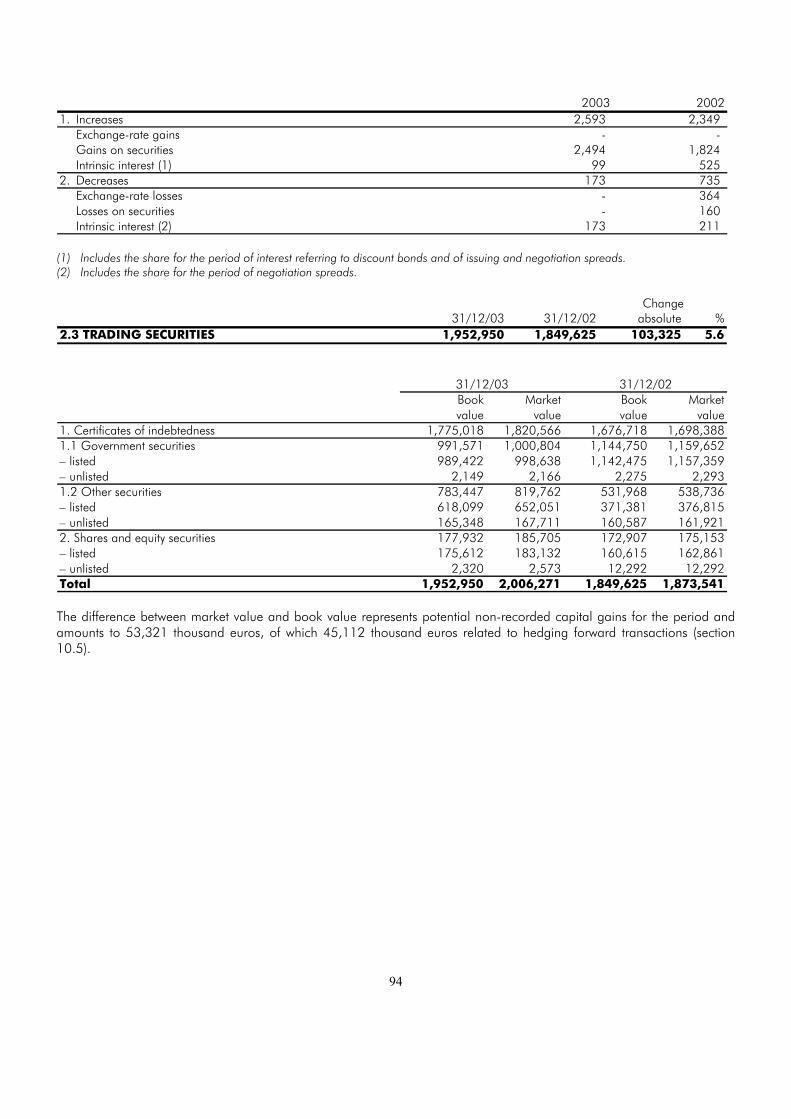
94
2003 20021. Increases 2,593 2,349
Exchange-rate gains - - Gains on securities 2,494 1,824 Intrinsic interest (1) 99 525
2. Decreases 173 735 Exchange-rate losses - 364 Losses on securities - 160 Intrinsic interest (2) 173 211
(1) Includes the share for the period of interest referring to discount bonds and of issuing and negotiation spreads.(2) Includes the share for the period of negotiation spreads.
Change31/12/03 31/12/02 absolute %
2.3 TRADING SECURITIES 1,952,950 1,849,625 103,325 5.6
31/12/03 31/12/02Book Market Book Marketvalue value value value
1. Certificates of indebtedness 1,775,018 1,820,566 1,676,718 1,698,3881.1 Government securities 991,571 1,000,804 1,144,750 1,159,652– listed 989,422 998,638 1,142,475 1,157,359– unlisted 2,149 2,166 2,275 2,2931.2 Other securities 783,447 819,762 531,968 538,736– listed 618,099 652,051 371,381 376,815– unlisted 165,348 167,711 160,587 161,9212. Shares and equity securities 177,932 185,705 172,907 175,153– listed 175,612 183,132 160,615 162,861– unlisted 2,320 2,573 12,292 12,292Total 1,952,950 2,006,271 1,849,625 1,873,541
The difference between market value and book value represents potential non-recorded capital gains for the period andamounts to 53,321 thousand euros, of which 45,112 thousand euros related to hedging forward transactions (section10.5).

95
2.4 CHANGES IN TRADING SECURITIES
2003 2002A. Opening balances 1,849,625 1,992,095B. Increases 7,841,239 7,649,811
B1. Purchases 7,798,048 7,585,621 - Certificates of indebtedness 6,714,448 7,052,317 . Government securities 4,880,186 5,984,568 . other securities 1,834,262 1,067,749 - Shares and other equity securities 1,083,600 533,304B2. Writebacks 751 370B3. Transfers from investment portfolio - - B4. Other changes 42,440 63,820
C. Decreases 7,737,914 7,792,281C1. Sales 7,709,939 7,647,438 - Certificates of indebtedness 6,639,619 7,211,121 . Government securities 5,056,312 5,748,601 . other securities 1,583,307 1,462,520 - Shares and other equity securities 1,070,320 436,317C2. Adjustments 6,660 18,865C3. Transfers to investment portfolio - 100,116C4. Other changes 21,315 25,862
D. Closing balances 1,952,950 1,849,625
Details of recognized losses are as follows:
2003 20021. Certificates of indebtedness 3,905 3,6281.1 Government securities 580 4021.2 Other securities 3,325 3,2262. Shares and equity securities 2,755 15,237Total 6,660 18,865
Captions “Other changes” are analysed below:
2003 20021. Increases 42,440 63,820
Exchange-rate gains - 1,496 Gains on securities 24,765 30,528 Intrinsic interest (1) 17,675 31,796
2. Decreases 21,315 25,862 Exchange-rate losses 7,917 18,553 Losses on securities 13,398 7,309
(1) Includes the share for the period of interest referring to discount bonds and of issuing spreads.
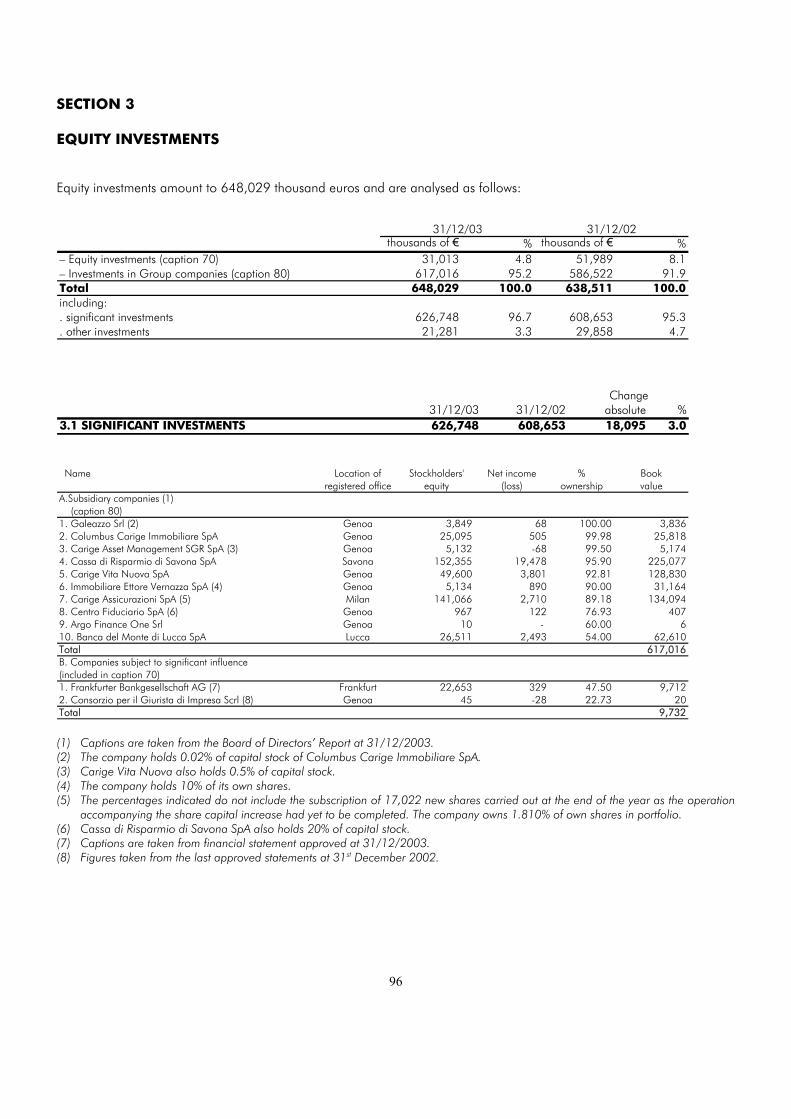
96
SECTION 3
EQUITY INVESTMENTS
Equity investments amount to 648,029 thousand euros and are analysed as follows:
31/12/03 31/12/02thousands of € % thousands of € %
– Equity investments (caption 70) 31,013 4.8 51,989 8.1– Investments in Group companies (caption 80) 617,016 95.2 586,522 91.9Total 648,029 100.0 638,511 100.0including:. significant investments 626,748 96.7 608,653 95.3. other investments 21,281 3.3 29,858 4.7
Change31/12/03 31/12/02 absolute %
3.1 SIGNIFICANT INVESTMENTS 626,748 608,653 18,095 3.0
Name Location of Stockholders' Net income % Bookregistered office equity (loss) ownership value
A.Subsidiary companies (1) (caption 80)1. Galeazzo Srl (2) Genoa 3,849 68 100.00 3,8362. Columbus Carige Immobiliare SpA Genoa 25,095 505 99.98 25,8183. Carige Asset Management SGR SpA (3) Genoa 5,132 -68 99.50 5,1744. Cassa di Risparmio di Savona SpA Savona 152,355 19,478 95.90 225,0775. Carige Vita Nuova SpA Genoa 49,600 3,801 92.81 128,8306. Immobiliare Ettore Vernazza SpA (4) Genoa 5,134 890 90.00 31,1647. Carige Assicurazioni SpA (5) Milan 141,066 2,710 89.18 134,0948. Centro Fiduciario SpA (6) Genoa 967 122 76.93 4079. Argo Finance One Srl Genoa 10 - 60.00 610. Banca del Monte di Lucca SpA Lucca 26,511 2,493 54.00 62,610Total 617,016B. Companies subject to significant influence(included in caption 70)1. Frankfurter Bankgesellschaft AG (7) Frankfurt 22,653 329 47.50 9,7122. Consorzio per il Giurista di Impresa Scrl (8) Genoa 45 -28 22.73 20Total 9,732
(1) Captions are taken from the Board of Directors’ Report at 31/12/2003.(2) The company holds 0.02% of capital stock of Columbus Carige Immobiliare SpA.(3) Carige Vita Nuova also holds 0.5% of capital stock.(4) The company holds 10% of its own shares.(5) The percentages indicated do not include the subscription of 17,022 new shares carried out at the end of the year as the operation
accompanying the share capital increase had yet to be completed. The company owns 1.810% of own shares in portfolio.(6) Cassa di Risparmio di Savona SpA also holds 20% of capital stock.(7) Captions are taken from financial statement approved at 31/12/2003.(8) Figures taken from the last approved statements at 31st December 2002.
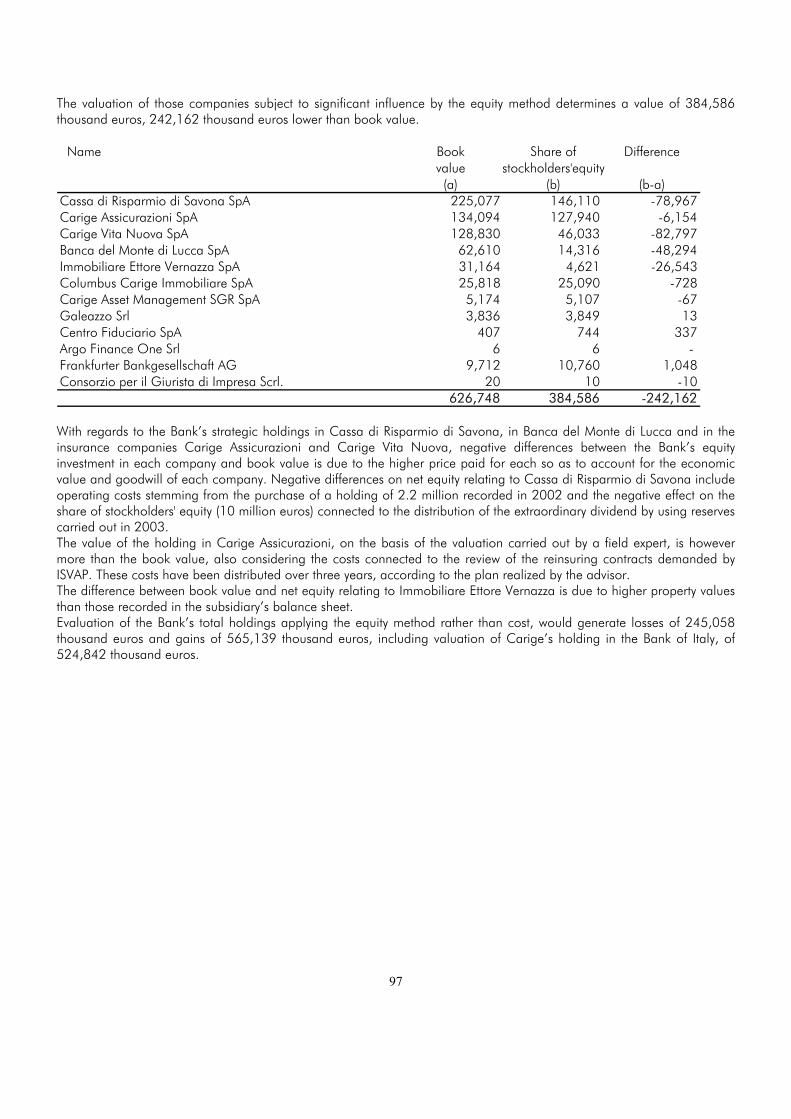
97
The valuation of those companies subject to significant influence by the equity method determines a value of 384,586thousand euros, 242,162 thousand euros lower than book value.
Name Book Share of Differencevalue stockholders'equity(a) (b) (b-a)
Cassa di Risparmio di Savona SpA 225,077 146,110 -78,967Carige Assicurazioni SpA 134,094 127,940 -6,154Carige Vita Nuova SpA 128,830 46,033 -82,797Banca del Monte di Lucca SpA 62,610 14,316 -48,294Immobiliare Ettore Vernazza SpA 31,164 4,621 -26,543Columbus Carige Immobiliare SpA 25,818 25,090 -728Carige Asset Management SGR SpA 5,174 5,107 -67Galeazzo Srl 3,836 3,849 13Centro Fiduciario SpA 407 744 337Argo Finance One Srl 6 6 - Frankfurter Bankgesellschaft AG 9,712 10,760 1,048Consorzio per il Giurista di Impresa Scrl. 20 10 -10
626,748 384,586 -242,162
With regards to the Bank’s strategic holdings in Cassa di Risparmio di Savona, in Banca del Monte di Lucca and in theinsurance companies Carige Assicurazioni and Carige Vita Nuova, negative differences between the Bank’s equityinvestment in each company and book value is due to the higher price paid for each so as to account for the economicvalue and goodwill of each company. Negative differences on net equity relating to Cassa di Risparmio di Savona includeoperating costs stemming from the purchase of a holding of 2.2 million recorded in 2002 and the negative effect on theshare of stockholders' equity (10 million euros) connected to the distribution of the extraordinary dividend by using reservescarried out in 2003.The value of the holding in Carige Assicurazioni, on the basis of the valuation carried out by a field expert, is howevermore than the book value, also considering the costs connected to the review of the reinsuring contracts demanded byISVAP. These costs have been distributed over three years, according to the plan realized by the advisor.The difference between book value and net equity relating to Immobiliare Ettore Vernazza is due to higher property valuesthan those recorded in the subsidiary’s balance sheet.Evaluation of the Bank’s total holdings applying the equity method rather than cost, would generate losses of 245,058thousand euros and gains of 565,139 thousand euros, including valuation of Carige’s holding in the Bank of Italy, of524,842 thousand euros.
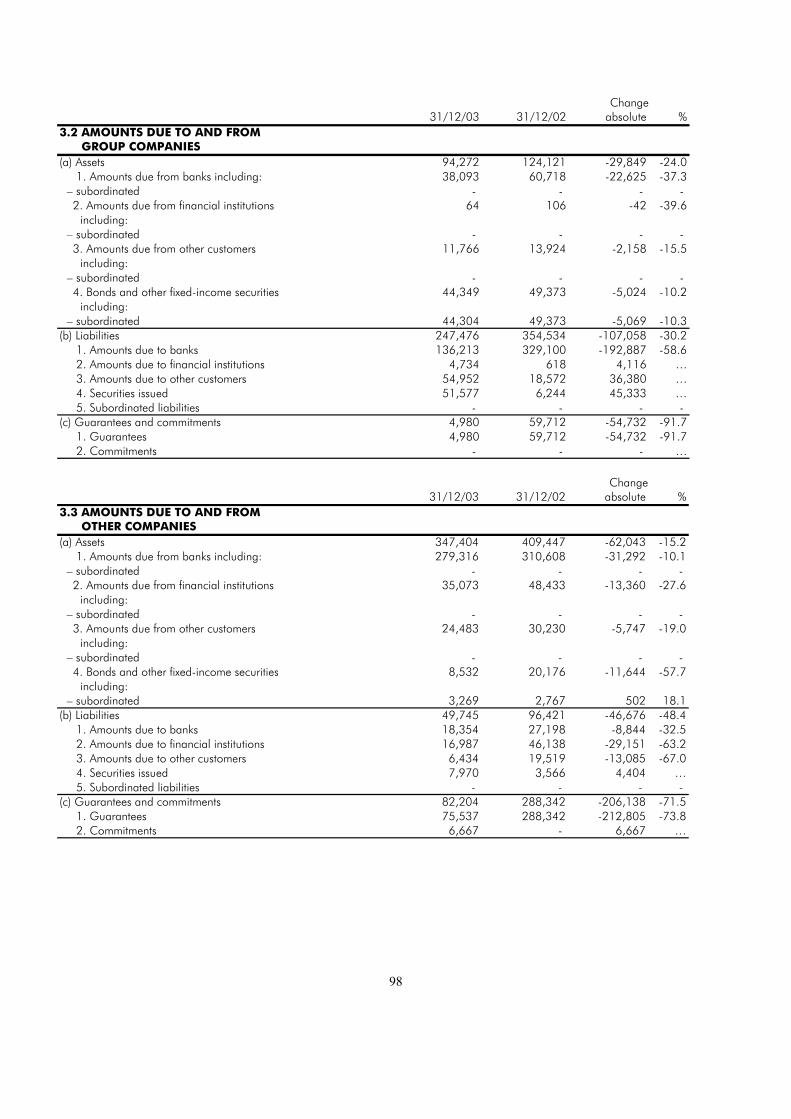
98
Change31/12/03 31/12/02 absolute %
3.2 AMOUNTS DUE TO AND FROM GROUP COMPANIES(a) Assets 94,272 124,121 -29,849 -24.0 1. Amounts due from banks including: 38,093 60,718 -22,625 -37.3
– subordinated - - - - 2. Amounts due from financial institutions 64 106 -42 -39.6
including:– subordinated - - - -
3. Amounts due from other customers 11,766 13,924 -2,158 -15.5 including:– subordinated - - - -
4. Bonds and other fixed-income securities 44,349 49,373 -5,024 -10.2 including:– subordinated 44,304 49,373 -5,069 -10.3
(b) Liabilities 247,476 354,534 -107,058 -30.2 1. Amounts due to banks 136,213 329,100 -192,887 -58.6 2. Amounts due to financial institutions 4,734 618 4,116 … 3. Amounts due to other customers 54,952 18,572 36,380 … 4. Securities issued 51,577 6,244 45,333 … 5. Subordinated liabilities - - - - (c) Guarantees and commitments 4,980 59,712 -54,732 -91.7 1. Guarantees 4,980 59,712 -54,732 -91.7 2. Commitments - - - …
Change31/12/03 31/12/02 absolute %
3.3 AMOUNTS DUE TO AND FROM OTHER COMPANIES(a) Assets 347,404 409,447 -62,043 -15.2 1. Amounts due from banks including: 279,316 310,608 -31,292 -10.1
– subordinated - - - - 2. Amounts due from financial institutions 35,073 48,433 -13,360 -27.6
including:– subordinated - - - -
3. Amounts due from other customers 24,483 30,230 -5,747 -19.0 including:– subordinated - - - -
4. Bonds and other fixed-income securities 8,532 20,176 -11,644 -57.7 including:– subordinated 3,269 2,767 502 18.1
(b) Liabilities 49,745 96,421 -46,676 -48.4 1. Amounts due to banks 18,354 27,198 -8,844 -32.5 2. Amounts due to financial institutions 16,987 46,138 -29,151 -63.2 3. Amounts due to other customers 6,434 19,519 -13,085 -67.0 4. Securities issued 7,970 3,566 4,404 … 5. Subordinated liabilities - - - - (c) Guarantees and commitments 82,204 288,342 -206,138 -71.5 1. Guarantees 75,537 288,342 -212,805 -73.8 2. Commitments 6,667 - 6,667 …

99
Amounts due from banks include 101,673 thousand euros with the Bank of Italy.
Change31/12/03 31/12/02 absolute %
3.4 CAPTION 70 "EQUITY INVESTMENTS" 31,013 51,989 -20,976 -40.3(a) in banks 15,073 15,073 - - 1. listed 4,871 4,871 - - 2. unlisted 10,202 10,202 - - (b) in financial institutions 5,891 19,175 -13,284 -69.3 1. listed - - - - 2. unlisted 5,891 19,175 -13,284 -69.3(c) others 10,049 17,741 -7,692 -43.4 1. listed 723 723 - - 2. unlisted 9,326 17,018 -7,692 -45.2
The item includes significant holdings in companies outside the Banca Carige Group as listed at 3.1/B, in addition toother equity investments.The caption includes tax-deferred gains pursuant to Law 218/90 of 1,125 thousand euros.
Revaluations Law 218/90Significant investments 523
- Frankfurter Bankgesellschaft 523 Other partecipating interests 602
- Banca d'Italia 484 - CartaSì SpA 100 - SWIFT 9 - Centrale dei Bilanci Srl 6 - Ligurcapital SpA 1 - SIA SpA 1 - Sviluppo Italia Liguria ScpA (1) 1
Total 1,125
(1) The company changed its trading name from Bic Liguria SpA.
Change31/12/03 31/12/02 absolute %
3.5 CAPTION 80 "INVESTMENTS IN GROUP COMPANIES" 617,016 586,522 30,494 5.2(a) in banks 287,687 287,687 - - 1. listed - - - - 2. unlisted 287,687 287,687 - - (b) in financial institutions 413 365 48 13.2 1. listed - - - - 2. unlisted 413 365 48 13.2(c) others 328,916 298,470 30,446 10.2 1. listed - - - - 2. unlisted 328,916 298,470 30,446 10.2
The book value tax-deferred gains in accordance with Law 218/90 for 3,243 thousand euros, detailed as follows:

100
Recoveries revaluations Law 218/90- Galeazzo Srl 3,206 - Centro Fiduciario SpA 37
Total 3,243
3.6 CHANGES IN PARTICIPATING INTERESTS
3.6.1 INVESTMENTS IN GROUP COMPANIES2003 2002
A. Opening balances 586,522 561,085B. Increases 30,494 25,437
B1. Purchases 30,387 23,231B2. Recoveries 107 - B3. Revaluations - - B4. Other changes - 2,206
C. Decreases - - C1. Sales - - C2. Write-downs - - including: - permanent write-downs - - C3. Other changes - -
D. Closing balances 617,016 586,522E. Total revaluations - - F. Total write-downs - 107
Details of purchases and all variations are given below:
PURCHASES
CARIGE ASSET MANAGEMENT SGR SPASubscription, at the moment of constitution, of 5,174,000 ordinary shares, nominal unit value 1 euro.(Our share holding 99.5%) 5,174
COLUMBUS CARIGE IMMOBILIARE SPASubscription of 10,000 new ordinary shares, nominal unit value 516.45 euroswithin the increase of capital stock from 20,658,000 to 25,822,500 euros.(Variation in our share holding from 99.975% to 99.980%) 5,164
CENTRO FIDUCIARIO SPAPurchase of 25,000 ordinary shares, nominal unit value 1 euro to the total price of 48,032 euros.(Variation in our share holding from 71.930% to 76.930%) 48
CARIGE ASSICURAZIONI SPASubscription of 17,022 new ordinary shares, nominal unit value 982 euros and additional paid-in of 193 euros.(Considering the increase of capital stock our share holdingvaries from 89.178% to 90.695%)
20,001
Total purchases 30,387

101
RECOVERIES
COLUMBUS CARIGE IMMOBILIARE SPA 107
Total recoveries 107
3.6.2 OTHER PARTICIPATING INTERESTS2003 2002
A. Opening balances 51,989 57,720B. Increases 13,897 4,256
B1. Purchases 310 1,435B2. Recoveries - 88B3. Revaluations - - B4. Other changes 13,587 2,733
C. Decreases 34,873 9,987C1. Sales 34,852 9,829C2. Write-downs - 11 including: - permanent write-downs - 11C3. Other changes 21 147
D. Closing balances 31,013 51,989E. Total revaluations - - F. Total write-downs 4,798 4,865
Detail of variations are given below:
PURCHASES
AREA 24 SPAPayment of residual 7/10 related to the subscription of 700 shares, nominal unit value 100 euros,made past year(Our holding: 14%) 49
SOCIETA' REGIONALE PER L'INTERNAZIONALIZZAZIONE SOC. CONSORTILE PER AZIONIPayment of residual 7/10 related to the subscription of 150 shares, nominal unit value 1 euro,made past year(Our holding: 3%) 10
FILSE SPAPayment of 3/10 referred to the subscription of 1,609,652 new shares of a unitary nominal valueof 0.52 euros following the increase in share capital.(Our holding from 8.810% to 10.102%) 251
Total purchases 310

102
OTHER CHANGES
INTESA HOLDING ASSET MANAGEMENT SPAProfit made after the withdrawal from the Company 3,334
SOCIETA' DI COOPERAZIONE AGRICOLA SPAProfit made following the liquidation of company assets 21
EPTACONSORS SPAProfit made following sale of 25,097,073 shares 6,641
FINCANTIERI SPAProfit made following sale of 14,999,994 shares 3,586
SWIFTProfit made following liquidation of 5 quotas 5
Total other changes 13,587
SALES
INTESA HOLDING ASSET MANAGEMENT SPAThe Bank exercised the right of withdrawal following thechange of the company's business purpose
4,470
EPTACONSORS SPASale of 25,097,073 shares for a total price of 19,040,400 euros.(Dismissal of entire holding) 19,040
FINCANTIERI SPASale of 14,999,994 shares for a total price of 11,332,421.91 euros.(Dismissal of entire holding) 11,332
SWIFTReimbursement of 5 quotas.(Our holding from 0.024% to 0.018%) 10
Total sales 34,852
OTHER CHANGES
SOCIETA' DI COOPERAZIONE AGRICOLA SPAAmount received following distribution of assets sold inliquidation
21
Total other changes 21

103
SECTION 4
TANGIBLE AND INTANGIBLE FIXED ASSETS
Tangible and intangible fixed assets (caption 100 and 90) amount to 1,394,069 thousand euros and are analysed asfollows:
Gross Total Net Sharevalue depreciations value %
- Tangible fixed assets (caption 100) 1,329,902 409,363 920,539 66.0- Intangible fixed assets (caption 90) 539,860 66,330 473,530 34.0Total 1,869,762 475,693 1,394,069 100.0
4.1 CHANGES IN TANGIBLE FIXED ASSETS31/12/03
Properties Furniture Leased Totaland fittings assets
A. Opening balances 239,845 20,197 605,418 865,460B. Increases 4,580 4,778 168,335 177,693
B1. Purchases 4,580 4,778 168,220 177,578B2. Recoveries - - - - B3. Revaluations - - - - B4. Other changes - - 115 115
C. Decreases 5,546 5,913 111,155 122,614C1. Sales 967 297 17,200 18,464C2. Depreciation and amortization 4,579 5,616 90,279 100,474 (a) amortization 4,579 5,616 90,279 100,474 (b) permanent write-downs - - - - C3. Other changes - - 3,676 3,676
D. Closing balances 238,879 19,062 662,598 920,539E. Total revaluations - - - - F. Total depreciation and amortization 95,486 87,306 226,571 409,363
(a) amortization 95,486 87,306 226,571 409,363 (b) permanent write-downs - - - -
Opening balances include advances for investments in course relating to furniture and equipment and leased assets of407 thousand euros and 58,008 thousand euros respectively.Closing balances include 7,732 thousand euros relating to bad leased assets.Closing balances include advances for investments in course relating to properties, furniture and equipment and leasedassets for 312 thousand euros and 47,732 thousand euros, respectively.

104
31/12/02Properties Furniture Leased Total
and fittings assetsA. Opening balances 226,146 21,096 380,268 627,510B. Increases 19,369 4,952 297,789 322,110
B1. Purchases 19,369 4,952 297,789 322,110B2. Recoveries - - - - B3. Revaluations - - - - B4. Other changes - - - -
C. Decreases 5,670 5,851 72,639 84,160C1. Sales 1,305 121 10,931 12,357C2. Depreciation and amortization 4,365 5,730 61,708 71,803 (a) amortization 4,365 5,730 61,708 71,803 (b) permanent write-downs - - - - C3. Other changes - - - -
D. Closing balances 239,845 20,197 605,418 865,460E. Total revaluations - - - - F. Total depreciation and amortization 90,912 87,036 163,321 341,269
(a) amortization 90,912 87,036 163,321 341,269 (b) permanent write-downs - - - -
Tangible fixed assets are detailed as follows:
31 /1 2/03 31 /12 /0 2
G ross Total Book G ross Total
value depreciations value value depreciations
P roperties 33 4 ,36 5 95 ,4 86 23 8 ,8 79 3 30 ,75 7 9 0 ,9 12
Furn itu re and fittings 1 8 ,80 6 14 ,8 75 3 ,9 31 18 ,37 2 1 4 ,1 42
M ach inery and equipm ent 8 6 ,28 6 72 ,4 31 1 3 ,8 55 87 ,51 2 7 2 ,8 94
O bjects of art 96 4 - 9 64 94 2 -
Advances for fu ture investm en ts 31 2 - 3 12 40 7 -
– P roperties - - - - -
– Furn itu re and fit tings 31 2 - 3 12 40 7 -
Tota l 440,733 182,792 257,941 437,990 177,948
Leased assets 88 9 ,16 9 2 26 ,5 71 66 2 ,5 98 7 68 ,73 9 1 63 ,3 21
Tota l 1,329,902 409,363 920,539 1,206,729 341,269
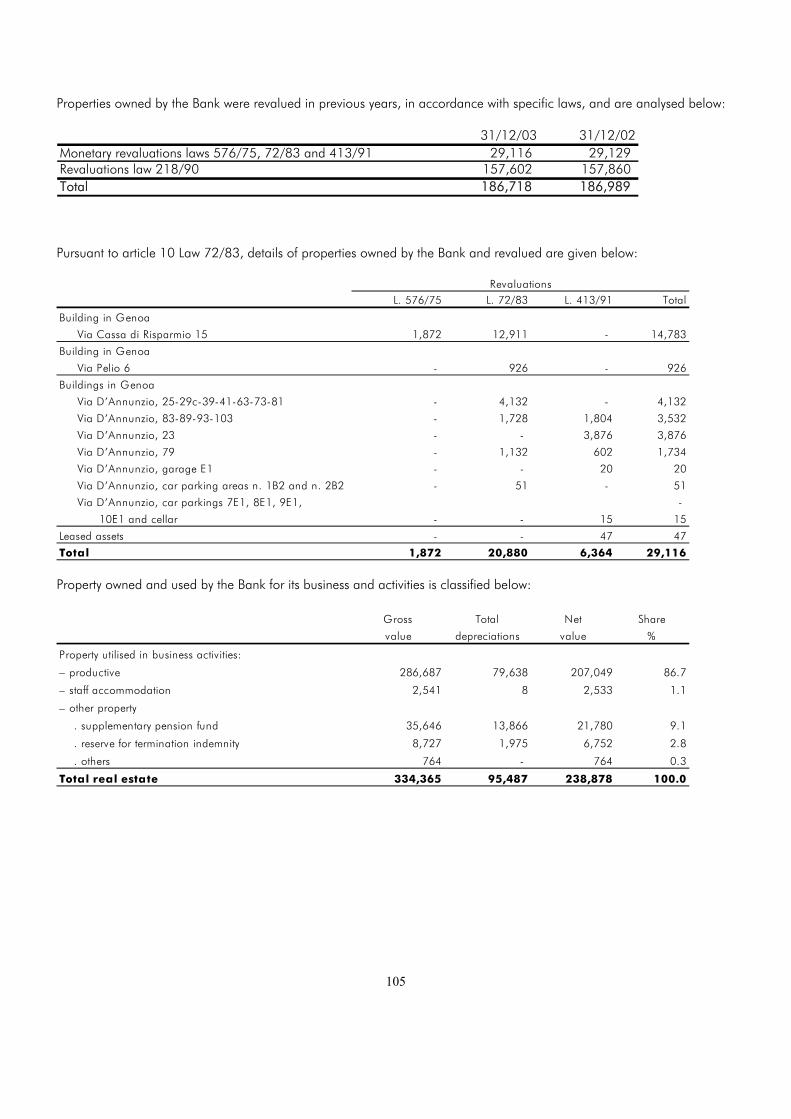
105
Properties owned by the Bank were revalued in previous years, in accordance with specific laws, and are analysed below:
31/12/03 31/12/02Monetary revaluations laws 576/75, 72/83 and 413/91 29,116 29,129 Revaluations law 218/90 157,602 157,860 Total 186,718 186,989
Pursuant to article 10 Law 72/83, details of properties owned by the Bank and revalued are given below:
RevaluationsL. 576/75 L. 72/83 L. 413/91 Total
Building in Genoa
Via Cassa di Risparmio 15 1,872 12,911 - 14,783
Building in Genoa
Via Pelio 6 - 926 - 926
Buildings in Genoa
Via D’Annunzio, 25-29c-39-41-63-73-81 - 4,132 - 4,132
Via D’Annunzio, 83-89-93-103 - 1,728 1,804 3,532
Via D’Annunzio, 23 - - 3,876 3,876
Via D’Annunzio, 79 - 1,132 602 1,734
Via D’Annunzio, garage E1 - - 20 20
Via D’Annunzio, car parking areas n. 1B2 and n. 2B2 - 51 - 51
Via D’Annunzio, car parkings 7E1, 8E1, 9E1, -
10E1 and cellar - - 15 15
Leased assets - - 47 47
Total 1,872 20,880 6,364 29,116
Property owned and used by the Bank for its business and activities is classified below:
Gross Total Net Share
value depreciations value %
Property utilised in business activities:
– productive 286,687 79,638 207,049 86.7
– staff accommodation 2,541 8 2,533 1.1
– other property
. supplementary pension fund 35,646 13,866 21,780 9.1
. reserve for termination indemnity 8,727 1,975 6,752 2.8
. others 764 - 764 0.3
Total real estate 334,365 95,487 238,878 100.0

106
4.2 CHANGES IN INTANGIBLE FIXED ASSETS31/12/03
Software Start-up Goodwill Other intangible Totalcharges (1) fixed assets
A. Opening balances 18,725 1,047 450,799 9,562 480,133B. Increases 10,676 3,608 264 1,896 16,444
B1. Purchases 10,676 3,608 264 1,896 16,444B2. Recoveries - - - - - B3. Revaluations - - - - - B4. Other changes - - - - -
C. Decreases 8,962 1,405 8,671 4,009 23,047C1. Sales - - - - - C2. Depreciation and amortization 8,703 1,405 8,671 3,954 22,733 (a) amortization 8,703 1,405 8,671 3,954 22,733 (b) permanent write-downs - - - - - C3. Other changes 259 - - 55 314
D. Closing balances 20,439 3,250 442,392 7,449 473,530E. Total revaluations - - - - - F. Total depreciation and amortization 24,824 3,772 21,271 16,463 66,330
(a) amortization 24,824 3,772 21,271 16,463 66,330 (b) permanent write-downs - - - - -
(1) Value adjustments on goodwill relate to the purchase of branches during 2000, 2001 and 2002. The item total of 8,671thousand euros (Banco di Sicilia branches: 601 thousand; Intesa branches: 5,532 thousand; Capitalia branches: 2,538thousand) derives from an analytical calculation of amortisation charges as explained in detail in part A, section 1.
The following costs were included under intangible fixed assets during the period (thousand euros):
Software products 10,676Start-up charges 3,608Goodwill (added burdens) 264Other intangible fixed assets 1,896– maintenance of premises not owned by the Bank 981– INVIM (tax on increased value of immovable property) 6– funding for Treasury Service purchases with value attributable to more than one year 909

107
Closing balances of intangible fixed assets amount to 473,530 thousand euros and are as follow:
Software products 20,439Start-up charges 3,250Goodwill 442,392- Banco di Sicilia (initial value 60,167 thousand euros) 55,955- Gruppo Intesa (initial value 276,591 thousand euros) 262,070- Gruppo Capitalia (initial value 126,905 thousand euros) 124,367Other intangible fixed assets 7,449– maintenance of premises not owned by the Bank 3,888– funding for Treasury Service purchases with value attributable to more than one year 1,622– INVIM (tax on increased value of immovable property) 26– research and development costs 373– licences and trademarks 75– securitisation transaction 744_ purchase of finance lease contracts 721
31/12/02Software Start-up Goodwill Other intangible Total
charges fixed assetsA. Opening balances 16,522 3,131 330,912 6,733 357,298B. Increases 9,534 - 126,641 6,563 142,738
B1. Purchases 9,534 - 126,641 6,563 142,738B2. Recoveries - - - - - B3. Revaluations - - - - - B4. Other changes - - - - -
C. Decreases 7,331 2,084 6,754 3,734 19,903C1. Sales - - - - - C2. Depreciation and amortization 7,331 2,084 6,133 3,701 19,249 (a) amortization 7,331 2,084 6,133 3,701 19,249 (b) permanent write-downs - - - - - C3. Other changes - - 621 33 654
D. Closing balances 18,725 1,047 450,799 9,562 480,133E. Total revaluations - - - - - F. Total depreciation and amortization 19,764 9,374 10,525 14,121 53,784
(a) amortization 19,764 9,374 10,525 14,121 53,784 (b) permanent write-downs - - - - -

108
SECTION 5
OTHER ASSETS
Other assets amount to 936,680 thousand euros and are analysed below:
31/12/03 31/12/02thousands of € % thousands of € %
– Other assets (caption 130) 837,371 89.4 795,487 90.7
– Accrued income and prepaid expenses (caption 140) 99,309 10.6 81,300 9.3
Total 936,680 100.0 876,787 100.0
Change31/12/03 31/12/02 absolute %
5.1 CAPTION 130 "OTHER ASSETS" 837,371 795,487 41,884 5.3– miscellaneous accounts receivable from branches 244,107 172,368 71,739 41.6– post-collection notes and other values 128,105 119,848 8,257 6.9– amounts to be collected from customers 50,661 50,053 608 1.2– current account cheques drawn on other banks 46,766 40,415 6,351 15.7– premiums related to option transactions 38,555 27,327 11,228 41.1– current account cheques drawn on the Bank 7,106 6,216 890 14.3– amounts in transit between branches 1,879 4,590 -2,711 -59.1– Bank guarantee deposits 310 501 -191 -38.1– accounts relating to tax collection services 180 3,224 -3,044 -94.4– off balance sheet revaluations 149 230 -81 -35.2– fiscal items: 175,351 191,058 -15,707 -8.2
tax advances 106,471 74,154 32,317 43.6accounts receivable from the tax authorities 16,648 36,189 -19,541 -54.0taxes paid in advance 47,590 74,438 -26,848 -36.1tax advance on provisions to reserve fortermination indemnity (Law 140/97) 4,239 6,140 -1,901 -31.0with-holding taxes 403 137 266 …
– others 144,202 179,657 -35,455 -19.7
The amount of 91,882 thousand paid as an advance for the purchase of a holding in Carinord 2 is recorded at item‘others’.

109
Change31/12/03 31/12/02 absolute %
5.2 CAPTION 140 “ACCRUED INCOME AND PREPAID EXPENSES” 99,309 81,300 18,009 22.2Accrued income: 91,408 71,817 19,591 27.3– interest income on loans and advances to credit institutions 4,787 2,231 2,556 …– interest income on loans to customers 12,189 15,673 -3,484 -22.2– interest income on securities in portfolio 27,416 16,629 10,787 64.9– differentials stemming from derivatives contracts 47,016 37,214 9,802 26.3– others - 70 -70 -100.0Prepaid expenses: 7,901 9,483 -1,582 -16.7– premiums related to currency forward transactions 307 143 164 …– differentials stemming from derivatives contracts 10 - 10 …– discounts on issuing of securities 3,596 4,425 -829 -18.7– administrative charges 1,314 1,572 -258 -16.4– other transactions 2,674 3,343 -669 -20.0
Accrued income and prepaid expenses are not applied directly to the balance sheet accounts, in accordance with article12, item 2 of Law 87/92.
Change31/12/03 31/12/02 absolute %
5.4 DISTRIBUTION OF SUBORDINATED ASSETS 178,675 220,538 -41,863 -19.0a) Loans and advances to credit institutions - - - - b) Loans and advances to customers 6,796 3,548 3,248 91.5c) Bonds and other fixed-income securities 171,879 216,990 -45,111 -20.8
Item c) ‘bond and other debt securities’ includes 65,690 thousand euros relating to the subscription of class Junior notesissued in relation to the securitisation of bad loans carried out by Banca Carige at the end of 2000 and during the 2001.These securities were inserted by the Bank into its investment securities portfolio.

110
SECTION 6
PAYABLES
Payables amount to 11,165,382 thousand euros and are analysed as follows:
31/12/03 31/12/02thousands of € % thousands of € %
– Amounts owed to credit institutions (caption 10) 1,139,632 10.2 1,797,348 16.3
– Amounts owed to customers (caption 20) 5,957,888 53.4 5,912,248 53.6
– Debts evidenced by certificates (caption 30) 4,067,494 36.4 3,323,926 30.1
– Funds managed on behalf of third parties
(caption 40) 368 0.0 310 0.0
Total 11,165,382 100.0 11,033,832 100.0
Change31/12/03 31/12/02 absolute %
6.1 CAPTION 10 “AMOUNTS OWED TO CREDIT INSTITUTIONS” 1,139,632 1,797,348 -657,716 -36.6(a) repurchase agreements 60,094 162,430 -102,336 -63.0(b) loans of securities - - - -
Caption 10 “amounts owed to credit institutions” detail by technical form and currency is the following:
Change31/12/03 31/12/02 absolute %
Deposits 617,311 1,307,786 -690,475 -52.8Current accounts 88,758 53,878 34,880 64.7Financing 130,798 130,110 688 0.5Long term loans 242,671 143,011 99,660 69.7Repurchase agreements with banks 60,094 162,430 -102,336 -63.0Other - 133 -133 -100.0Total 1,139,632 1,797,348 -657,716 -36.6 of which: – resident Euros 364,925 957,563 -592,638 -61.9 – resident foreign currency 106,840 171,122 -64,282 -37.6 – non-resident Euros 523,554 420,956 102,598 24.4 – non-resident foreign currency 144,313 247,707 -103,394 -41.7
Change31/12/03 31/12/02 absolute %
6.2 CAPTION 20 “AMOUNTS OWED TO CUSTOMERS” 5,957,888 5,912,248 45,640 0.8(a) repurchase agreements 149,468 393,676 -244,208 -62.0(b) loans of securities - - - -

111
Caption 20 “Amounts owed to customers” is the following:
Change
31/12/03 31/12/02 absolute %
Euro EuroSavings deposits 472,031 467,776 4,255 0.9Current accounts 5,331,369 5,047,399 283,970 5.6Funding from international organisations - 771 -771 -100.0Repurchase agreements 149,468 393,676 -244,208 -62.0Other 5,020 2,626 2,394 91.2Total 5,957,888 5,912,248 45,640 0.8 of which: – resident Euros 5,778,289 5,757,608 20,681 0.4 – resident foreign currency 80,322 66,477 13,845 20.8 – non-resident Euros 89,284 82,228 7,056 8.6 – non-resident foreign currency 9,993 5,935 4,058 68.4
Caption 30 “Debts evidenced by certificates” is the following:
Change31/12/03 31/12/02 absolute %
Euro Euro
Certificates of deposits 326,769 397,349 -70,580 -17.8Bonds certificates 3,653,863 2,853,874 799,989 28.0Own cheques in circulation 86,862 72,703 14,159 19.5Total 4,067,494 3,323,926 743,568 22.4 of which: – resident Euros 3,867,440 3,112,220 755,220 24.3 – resident foreign currency 199,986 161,523 38,463 23.8 – non-resident Euros 68 50,140 -50,072 -99.9 – non-resident foreign currency - 43 -43 -100.0
Caption 40, “Funds managed on behalf of third parties” (368 thousand euros) includes interest-bearing funds supplied bythe State and other public bodies for the financing of specific projects foreseen by law;the lending transactions carried outon behalf of public bodies, exclusively at fixed remuneration, are stated at section 12.
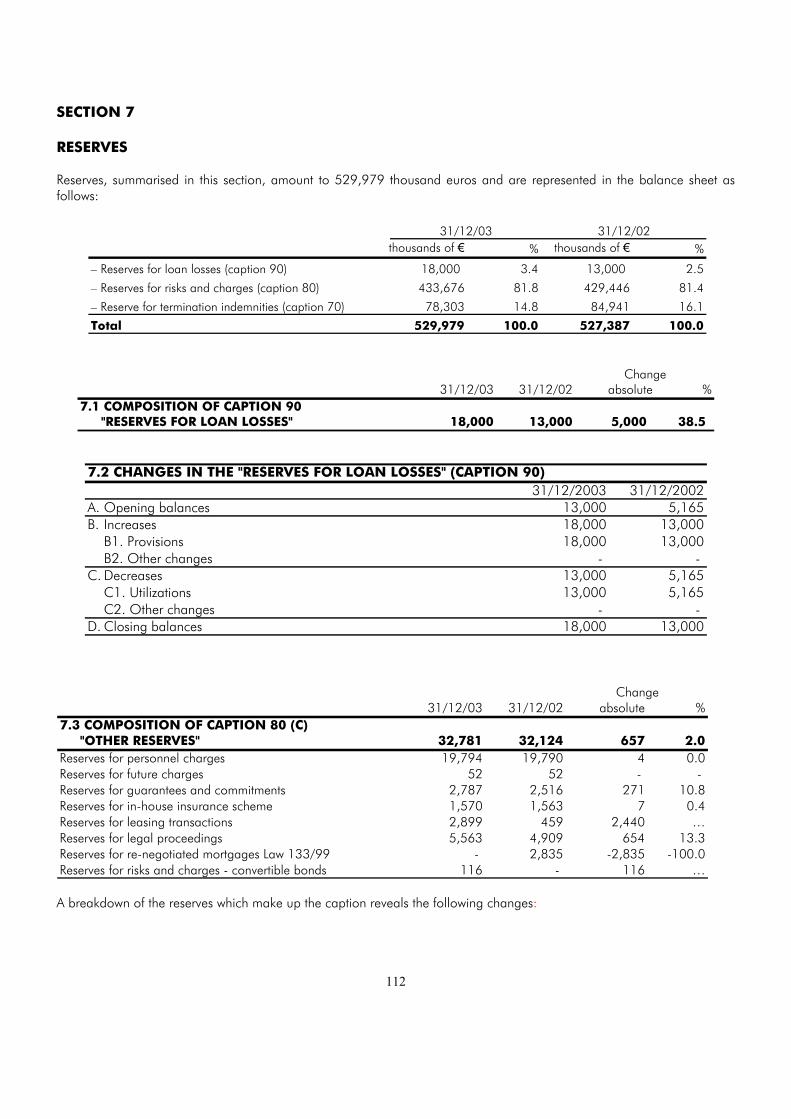
112
SECTION 7
RESERVES
Reserves, summarised in this section, amount to 529,979 thousand euros and are represented in the balance sheet asfollows:
31/12/03 31/12/02thousands of € % thousands of € %
– Reserves for loan losses (caption 90) 18,000 3.4 13,000 2.5
– Reserves for risks and charges (caption 80) 433,676 81.8 429,446 81.4
– Reserve for termination indemnities (caption 70) 78,303 14.8 84,941 16.1
Total 529,979 100.0 527,387 100.0
Change31/12/03 31/12/02 absolute %
7.1 COMPOSITION OF CAPTION 90 "RESERVES FOR LOAN LOSSES" 18,000 13,000 5,000 38.5
7.2 CHANGES IN THE "RESERVES FOR LOAN LOSSES" (CAPTION 90)31/12/2003 31/12/2002
A. Opening balances 13,000 5,165B. Increases 18,000 13,000
B1. Provisions 18,000 13,000B2. Other changes - -
C. Decreases 13,000 5,165C1. Utilizations 13,000 5,165C2. Other changes - -
D. Closing balances 18,000 13,000
Change31/12/03 31/12/02 absolute %
7.3 COMPOSITION OF CAPTION 80 (C) "OTHER RESERVES" 32,781 32,124 657 2.0Reserves for personnel charges 19,794 19,790 4 0.0Reserves for future charges 52 52 - - Reserves for guarantees and commitments 2,787 2,516 271 10.8Reserves for in-house insurance scheme 1,570 1,563 7 0.4Reserves for leasing transactions 2,899 459 2,440 …Reserves for legal proceedings 5,563 4,909 654 13.3Reserves for re-negotiated mortgages Law 133/99 - 2,835 -2,835 -100.0Reserves for risks and charges - convertible bonds 116 - 116 …
A breakdown of the reserves which make up the caption reveals the following changes:

113
Reserves for personnel charges include provisions made for charges relative to staff employed subject to uncertaintyregarding time or amount. Provisions for the year are stated in the Income Statement at caption 80a “Administrative costs- personnel”.
31/12/03 31/12/02A. Opening balance 19,790 17,273B. Increases 17,447 16,354C. Decreases due to utilisation 17,443 13,837D. Closing balance 19,794 19,790
Reserves for future charges. These reserves are almost exclusively destined to meet Deposit Protection Fund charges(FITD).
31/12/03 31/12/02A. Opening balance 52 52B. Increases due to provisions - - C. Decreases due to utilisation - - D. Closing balance 52 52
Reserves for guarantees and commitments. The reserve for guarantees and commitments was created inaccordance with the provisions of Legislative Decree 87/92 and is equal to expected losses on credit commitments.
31/12/03 31/12/02A. Opening balance 2,516 2,780B. Increases due to provisions 271 - C. Decreases due to utilisation - 264D. Closing balance 2,787 2,516
Reserves for in-house insurance scheme. Reserves for in-house insurance schemes were set up to limit exposure torisks not covered by existing insurance policies
31/12/03 31/12/02A. Opening balance 1,563 1,562B. Increases due to provisions 500 714C. Decreases due to utilisation 493 713D. Closing balance 1,570 1,563
Reserves for finance lease transactions. Provisions to this reserve are connected to the valuation of latent creditrisks present in bad leased assets
31/12/03 31/12/02A. Opening balance 459 430B. Increases due to provisions 2,440 29C. Decreases due to utilisation - - D. Closing balance 2,899 459
Reserves for legal proceedings. Reserves for legal proceedings limit exposure to potential loss resulting fromunsettled litigation.

114
31/12/03 31/12/02A. Opening balance 4,909 3,904B. Increases due to provisions 684 1,762C. Decreases due to utilisation 30 757D. Closing balance 5,563 4,909
The reserve for renegotiated mortgages pursuant to Law 133/99 was constituted in 2000 as cover forcharges stemming from the renegotiation of interest rates applied to special rate mortgages foreseen by article 29, Law133/99. Funds from the reserve utilised during the year were calculated on the basis of the Economy and FinanceMinistry’s decree of 31/3/03. A fund surplus of 560 thousand euros was carried forward to the profit and loss account.
31/12/03 31/12/02A. Opening balance 2,835 2,168B. Increases due to provisions - 667C. Decreases due to utilisation 2,835 - D. Closing balance - 2,835
The reserve for risk and charges – convertible bonds was created during the year in relation to Banca Carige’shybrid subordinated loan issue with a premium at reimbursement convertible into ordinary shares (“Banca Carige 1.50%2003-2013”).
31/12/03 31/12/02A. Opening balance - - B. Increases due to provisions 116 - C. Decreases due to utilisation - - D. Closing balance 116 -
CHANGES IN THE “RESERVES FOR TAXATION”(CAPTION 80 B)
Risks for2003 Income Indirect legal
taxes taxes proceedings TotalOpening balances 87,581 19,223 2,630 109,434Increases 68,271 21,359 200 89,830Decreases 68,487 19,223 291 88,001Closing balances 87,365 21,359 2,539 111,263* of which 3,028,000 surplus to reserve requirements and subsequently destined to the income statement (see section 6, Income Statement).
Amounts paid as advances for income tax are recorded at caption 130 ‘other assets’ and amount respectively to: 17,505thousand euros in corporation tax (IRPEG); 10,359 thousand euros in regional levied tax on businesses (IRAP); 17,751thousand euros in stamp duty; 1,203 thousand euros in tax charged on medium/long-term financing (‘impostasostitutiva’).
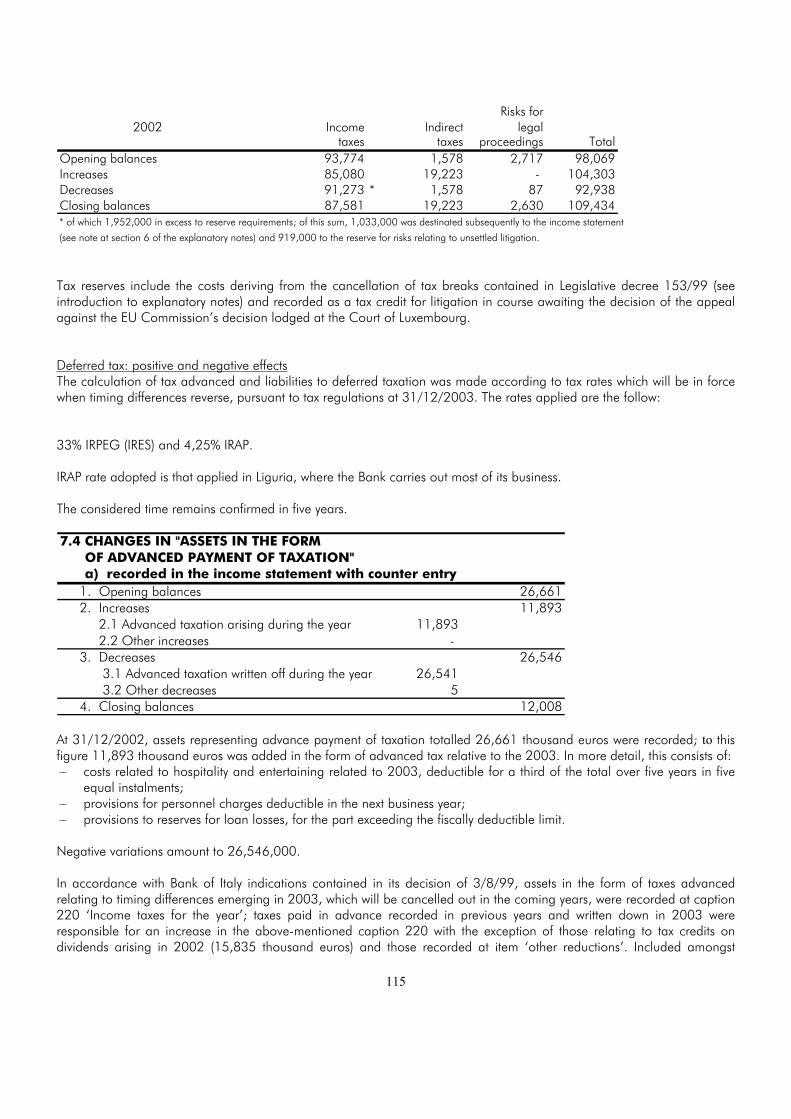
115
Risks for2002 Income Indirect legal
taxes taxes proceedings TotalOpening balances 93,774 1,578 2,717 98,069Increases 85,080 19,223 - 104,303Decreases 91,273 * 1,578 87 92,938Closing balances 87,581 19,223 2,630 109,434* of which 1,952,000 in excess to reserve requirements; of this sum, 1,033,000 was destinated subsequently to the income statement
(see note at section 6 of the explanatory notes) and 919,000 to the reserve for risks relating to unsettled litigation.
Tax reserves include the costs deriving from the cancellation of tax breaks contained in Legislative decree 153/99 (seeintroduction to explanatory notes) and recorded as a tax credit for litigation in course awaiting the decision of the appealagainst the EU Commission’s decision lodged at the Court of Luxembourg.
Deferred tax: positive and negative effectsThe calculation of tax advanced and liabilities to deferred taxation was made according to tax rates which will be in forcewhen timing differences reverse, pursuant to tax regulations at 31/12/2003. The rates applied are the follow:
33% IRPEG (IRES) and 4,25% IRAP.
IRAP rate adopted is that applied in Liguria, where the Bank carries out most of its business.
The considered time remains confirmed in five years.
7.4 CHANGES IN "ASSETS IN THE FORM OF ADVANCED PAYMENT OF TAXATION" a) recorded in the income statement with counter entry
1. Opening balances 26,6612. Increases 11,893 2.1 Advanced taxation arising during the year 11,893 2.2 Other increases - 3. Decreases 26,546 3.1 Advanced taxation written off during the year 26,541 3.2 Other decreases 54. Closing balances 12,008
At 31/12/2002, assets representing advance payment of taxation totalled 26,661 thousand euros were recorded; to thisfigure 11,893 thousand euros was added in the form of advanced tax relative to the 2003. In more detail, this consists of:– costs related to hospitality and entertaining related to 2003, deductible for a third of the total over five years in five
equal instalments;– provisions for personnel charges deductible in the next business year;– provisions to reserves for loan losses, for the part exceeding the fiscally deductible limit.
Negative variations amount to 26,546,000.
In accordance with Bank of Italy indications contained in its decision of 3/8/99, assets in the form of taxes advancedrelating to timing differences emerging in 2003, which will be cancelled out in the coming years, were recorded at caption220 ‘Income taxes for the year’; taxes paid in advance recorded in previous years and written down in 2003 wereresponsible for an increase in the above-mentioned caption 220 with the exception of those relating to tax credits ondividends arising in 2002 (15,835 thousand euros) and those recorded at item ‘other reductions’. Included amongst
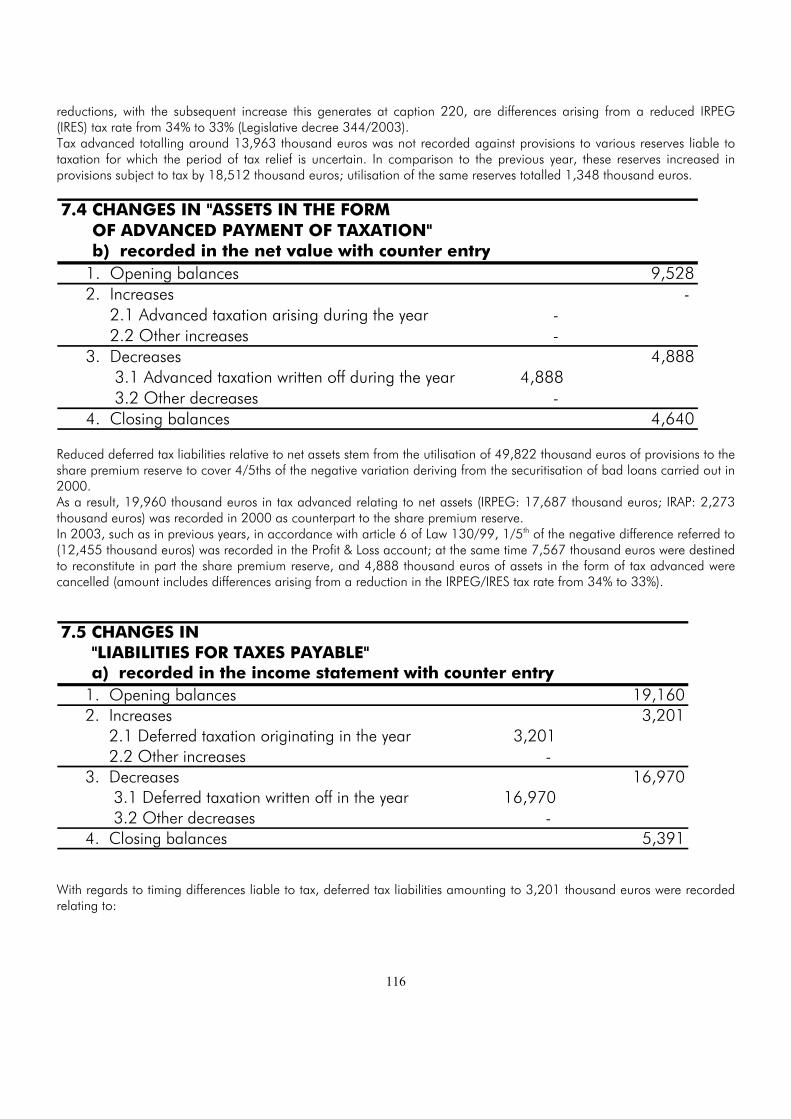
116
reductions, with the subsequent increase this generates at caption 220, are differences arising from a reduced IRPEG(IRES) tax rate from 34% to 33% (Legislative decree 344/2003).Tax advanced totalling around 13,963 thousand euros was not recorded against provisions to various reserves liable totaxation for which the period of tax relief is uncertain. In comparison to the previous year, these reserves increased inprovisions subject to tax by 18,512 thousand euros; utilisation of the same reserves totalled 1,348 thousand euros.
7.4 CHANGES IN "ASSETS IN THE FORM OF ADVANCED PAYMENT OF TAXATION" b) recorded in the net value with counter entry
1. Opening balances 9,5282. Increases - 2.1 Advanced taxation arising during the year - 2.2 Other increases - 3. Decreases 4,888 3.1 Advanced taxation written off during the year 4,888 3.2 Other decreases - 4. Closing balances 4,640
Reduced deferred tax liabilities relative to net assets stem from the utilisation of 49,822 thousand euros of provisions to theshare premium reserve to cover 4/5ths of the negative variation deriving from the securitisation of bad loans carried out in2000.As a result, 19,960 thousand euros in tax advanced relating to net assets (IRPEG: 17,687 thousand euros; IRAP: 2,273thousand euros) was recorded in 2000 as counterpart to the share premium reserve.In 2003, such as in previous years, in accordance with article 6 of Law 130/99, 1/5th of the negative difference referred to(12,455 thousand euros) was recorded in the Profit & Loss account; at the same time 7,567 thousand euros were destinedto reconstitute in part the share premium reserve, and 4,888 thousand euros of assets in the form of tax advanced werecancelled (amount includes differences arising from a reduction in the IRPEG/IRES tax rate from 34% to 33%).
7.5 CHANGES IN "LIABILITIES FOR TAXES PAYABLE" a) recorded in the income statement with counter entry
1. Opening balances 19,1602. Increases 3,201 2.1 Deferred taxation originating in the year 3,201 2.2 Other increases - 3. Decreases 16,970 3.1 Deferred taxation written off in the year 16,970 3.2 Other decreases - 4. Closing balances 5,391
With regards to timing differences liable to tax, deferred tax liabilities amounting to 3,201 thousand euros were recordedrelating to:

117
– gains stemming from the release of investments and property subject to tax relief in the form of instalments foreseenby article 54 of the Consolidated tax Law (2,787 thousand euros);
– dividends of subsidiaries (in the measure of 5%) recorded during the same accounting period as related profits (414thousand euros).
Deferred tax liabilities which became relevant for tax purposes in 2003 amounted to 16,970 thousand euros.The counterpart for these increases and decreases in the deferred tax reserve is caption 220 “Income tax”, in line with taxregulations.
No provisions were made with regard to deferred tax liabilities on reserves benefiting from tax relief totalling 45,975thousand euros as distribution is not foreseen and there is little likelihood of the conditions requiring payment arising. Thisamount includes reserves created under article 22, Legislative decree 153/99 from profits recorded for the years 2000(5,362,000). Related tax liabilities are suspended pending the decision on litigation in course before the Tribunal ofLuxembourg (see Introduction to the Explanatory Notes).
CHANGES IN THE “SUPPLEMENTARY PENSION FUND”(CAPTION 80 A)
31/12/03 31/12/02A. Opening balance 287,888 297,736B. Increases or decreases 1,744 - 9,848D. Closing balance 289,632 287,888
CHANGES IN CAPTION 70“RESERVE FOR TERMINATION INDEMNITIES”
31/12/03 31/12/02A. Opening balance 84,941 71,068B. Increases 11,431 19,668
B.1 Provisions and other changes 11,431 19,668C. Decreases 18,069 5,795
C.1 Termination employment 5,832 1,814C.2 Advances (law 297/82) 9,790 3,718C.3 Others 2,447 263
D. Closing balance 78,303 84,941
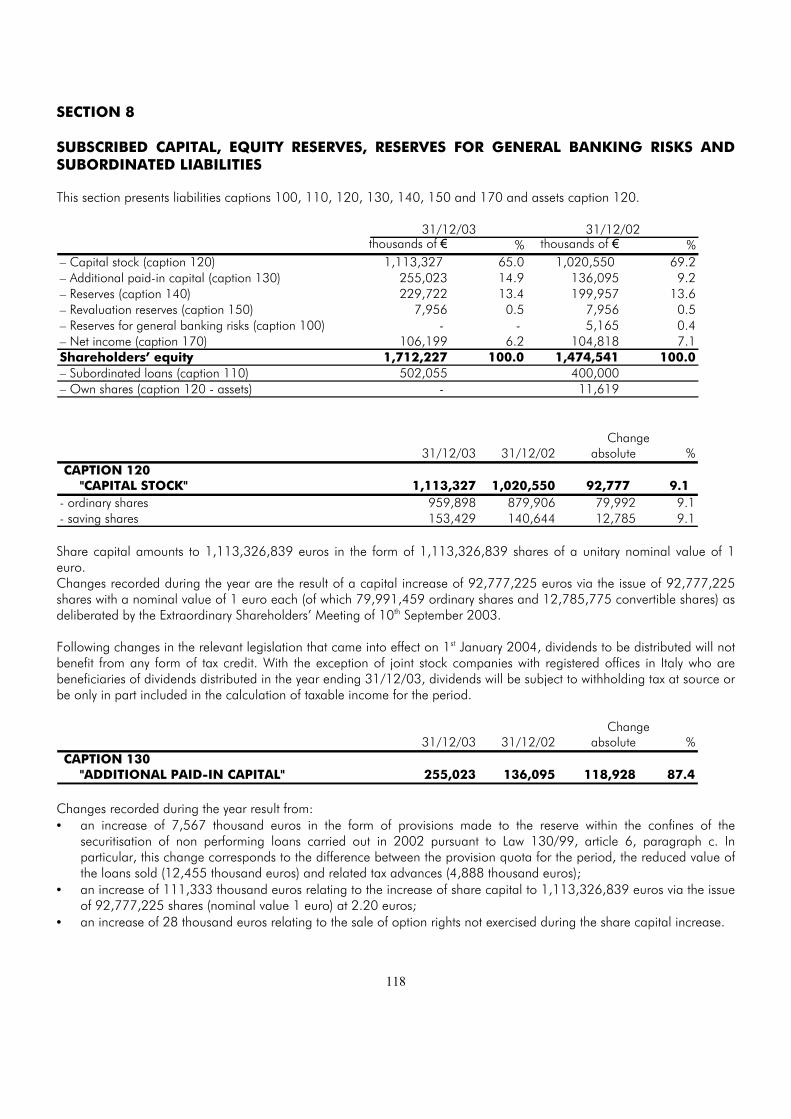
118
SECTION 8
SUBSCRIBED CAPITAL, EQUITY RESERVES, RESERVES FOR GENERAL BANKING RISKS ANDSUBORDINATED LIABILITIES
This section presents liabilities captions 100, 110, 120, 130, 140, 150 and 170 and assets caption 120.
31/12/03 31/12/02thousands of € % thousands of € %
– Capital stock (caption 120) 1,113,327 65.0 1,020,550 69.2– Additional paid-in capital (caption 130) 255,023 14.9 136,095 9.2– Reserves (caption 140) 229,722 13.4 199,957 13.6– Revaluation reserves (caption 150) 7,956 0.5 7,956 0.5– Reserves for general banking risks (caption 100) - - 5,165 0.4– Net income (caption 170) 106,199 6.2 104,818 7.1Shareholders’ equity 1,712,227 100.0 1,474,541 100.0– Subordinated loans (caption 110) 502,055 400,000– Own shares (caption 120 - assets) - 11,619
Change31/12/03 31/12/02 absolute %
CAPTION 120 "CAPITAL STOCK" 1,113,327 1,020,550 92,777 9.1 - ordinary shares 959,898 879,906 79,992 9.1- saving shares 153,429 140,644 12,785 9.1
Share capital amounts to 1,113,326,839 euros in the form of 1,113,326,839 shares of a unitary nominal value of 1euro.Changes recorded during the year are the result of a capital increase of 92,777,225 euros via the issue of 92,777,225shares with a nominal value of 1 euro each (of which 79,991,459 ordinary shares and 12,785,775 convertible shares) asdeliberated by the Extraordinary Shareholders’ Meeting of 10th September 2003.
Following changes in the relevant legislation that came into effect on 1st January 2004, dividends to be distributed will notbenefit from any form of tax credit. With the exception of joint stock companies with registered offices in Italy who arebeneficiaries of dividends distributed in the year ending 31/12/03, dividends will be subject to withholding tax at source orbe only in part included in the calculation of taxable income for the period.
Change31/12/03 31/12/02 absolute %
CAPTION 130 "ADDITIONAL PAID-IN CAPITAL" 255,023 136,095 118,928 87.4
Changes recorded during the year result from:• an increase of 7,567 thousand euros in the form of provisions made to the reserve within the confines of the
securitisation of non performing loans carried out in 2002 pursuant to Law 130/99, article 6, paragraph c. Inparticular, this change corresponds to the difference between the provision quota for the period, the reduced value ofthe loans sold (12,455 thousand euros) and related tax advances (4,888 thousand euros);
• an increase of 111,333 thousand euros relating to the increase of share capital to 1,113,326,839 euros via the issueof 92,777,225 shares (nominal value 1 euro) at 2.20 euros;
• an increase of 28 thousand euros relating to the sale of option rights not exercised during the share capital increase.

119
Change31/12/03 31/12/02 absolute %
CAPTION 140 "RESERVES" 229,722 199,957 29,765 14.9a) legal reserve 67,351 56,869 10,482 18.4b) reserve for purchase of treasury stock - 11,619 -11,619 -100.0c) other reserves 162,371 131,469 30,902 23.5
- taxed extraordinary reserve 44,396 25,309 19,087 75.4 - reserve for purchase of treasury stock disposable amount 77,000 65,381 11,619 17.8 - reserve for incorporation 16,589 16,589 - - - reserve (legislative decree 17/5/99 n. 153) 11,718 11,718 - - - reserve (legislative decree 21/4/93 n. 124) 56 - 56 … - merger reserve 12,341 12,341 - - - reserve for dividends on own shares 140 - 140 … - reserve (art. 55 Decree 917/86) 131 131 - -
Legal reserve increased from 56,869 thousand euros to 67,351 thousand euros by the distribution of the 2002 netprofit, as decided by stockholders’ resolutions of 31/3/2003.
The extraordinary taxed reserve increased by 19,087 thousand euros subsequent to the destination of profit for2002, as deliberated by the Annual Shareholders’ Meeting of 31/3/2003.
The reserve for the purchase of own shares, created in conformity to the provisions contained in article 2357 andfollowing the Italian Civil Code, amounts to 77 million euros; at 31st December 2003, following no utilisations recordedduring the year.
Merger reserve was formed in 1994 in accordance with art. 7 c. 3 of Law 218/90 and with art. 1 of Law 489/93 andrecorded no change.
The reserve foreseen by Legislative decree 153/99, constituted during the year 2000 in order to benefit fromthe tax benefits contained in the same decree relating to merger operations, recorded no change.
The reserve foreseen by Legislative decree 124/93 was constituted during the year after allocation of 2002 netprofit, as approved by the Meeting of Shareholders held on 31st March 2003, related to annual provisions to reserve fortermination indemnities destined to complementary pension funds.
Reserve for incorporation and the reserve foreseen by art. 55, Presidential Decree 917/86 recorded nochanges during the year.
The dividends on own shares reserve (140 thousand euros) is related to the dividend on own shares held inportfolio at 7/4/2003 and was constituted as deliberated by the Annual Shareholders’ Meeting of 31/3/2003.
Change31/12/03 31/12/02 absolute %
CAPTION 150"REVALUATION RESERVES" 7,956 7,956 - - Revaluation reserves (law 72/83) 1,930 1,930 - - Revaluation reserves (law 413/91) 6,026 6,026 - -

120
Revaluation reserves, which show the same amount as at 31/12/02, benefited from the tax-break opportunitiesoffered by article 123, item 4, Presidential Decree 917/86, as present in the balance sheets of the incorporatedcompanies.During 1995 Carige released the revaluation reserves connected to Law 413/91, by the payment of taxes in accordancewith article 22 of Law 85/95.
Change31/12/03 31/12/02 absolute %
CAPTION 100 "RESERVES FOR GENERAL BANKING RISKS" - 5,165 5,165- 100.0-
The reserves for general banking risks have been completely used during the year.
Change31/12/03 31/12/02 absolute %
CAPTION 110 "SUBORDINATED LOANS" 502,055 400,000 102,055 25.5
During the year, a new hybrid subordinated bond with premium at reimbursement convertible into ordinary shares wasissued by the Bank.The issue is therefore as follows:
Code Amount Currency Interest rate Maturity
XSO135565637 400,000 euro Euribor 3 months + 28/11/2011annual spread of 0.80
ITO003563035 102,055 euro 1.5% + 16% atmaturity
5/12/2013
With regards to the first loan issue, reimbursement will be effected at maturity in one payment. The Bank can, however,anticipate repayment after the fifth year with Bank of Italy authorisation. In the eventuality of liquidation, the bonds will berepaid only after all other claims have been met.The repayment ranking of the bond issue ‘Banca Carige 1.50% 2003-2013’ performed during the year in case of theBank’s going into liquidation or receivership is as follows: the bonds will be repaid only after all other creditorssubordinated or otherwise have been repaid with the exception of those creditors with an equal or more accentuateddegree of subordination. Further characteristics of the issue are as follows:- from 1st January 2006 until 31st October 2013 the bonds can be converted into shares of the Bank on a one-to-one
basis;- for those bonds for which no conversion right has been exercised as at 31st October, the principal shall be repaid in
one payment on 5th December 2013 with a 16% premium on the nominal value.
Changes in assets caption 120 “Own shares” are described below:

121
31/12/03 31/12/02
QuantityNominal
valueAmount /1000
QuantityNominal
valueAmount /1000
A. Opening balances 6,024,532 6,024,532 11,619 11,731,923 11,731,923 21,951B. Increases 8,870,380 8,870,380 24,723 33,112,887 33,112,887 65,123
- Purchases 8,870,380 8,870,380 22,446 33,112,887 33,112,887 63,909- Writebacks - - - - - - - Other changes - - 2,277 - - 1,214
C. Decreases 14,894,912 14,894,912 36,342 38,820,278 38,820,278 75,455- Sales 14,894,912 14,894,912 36,342 38,820,278 38,820,278 75,444- Adjustments - - - - - - - Other changes - - - - - 11
D. Closing balances - (1) - - 6,024,532 (1) 6,024,532 11,619
(1) Figure does not include 227.92 shares corresponding to 44/50 of 259 non converted shares.
Relative to article 16, Legislative decree 87/92, available reserves recorded at 31/12/2003 offer sufficient cover for thosecosts not amortised as by article 10 (comma 2a) and d))of the same decree.
The table below provides the details of the Bank's total capital and prudential management requirements.
Total capital and prudential requirements
CATEGORIES/VALUES 31/12/03 31/12/02A. Total capitalA.1 Tier 1 1,147,180 899,640A.2 Tier 2 512,498 405,708A.3 Deductions 190,582 181,120A.4 Total capital 1,469,096 1,124,228B. Prudential requirementsB.1 Credit risks 637,107 598,064B.2 Trading risks 69,181 47,672
including:– trading securities risks 69,181 47,672– exchange rate risks - -
B.3 Subordinated loans of 3° level - - B.4 Other prudential requirements 33,830 33,830B.5 Total prudential requirements 740,118 679,566C. Capital adequacy ratiosC.1 Risk-Weighted Assets (*) 10,573,114 9,708,086C.2 Tier 1% of RWA 10.85% 9.27%C.3 Total capital % of RWA 13.89% 11.58%
(*) Total prudential requirements multiplied by the reciprocal minimum obligatory credit risk coefficient.

122
SECTION 9
OTHER LIABILITIES
Other liabilities amount to 743,411 thousand euros and are analysed as follows:
31/12/03 31/12/02thousands of € % thousands of € %
– Other liabilities (caption 50) 579,839 78.0 813,614 84.9– Accrued expenses and deferred income (caption 60) 163,572 22.0 144,444 15.1Total 743,411 100.0 958,058 100.0
Change31/12/03 31/12/02 absolute %
9.1 CAPTION 50 "OTHER LIABILITIES" 579,839 813,614 -233,775 -28.7– miscellaneous accounts payable to branches 205,916 208,682 -2,766 -1.3– excess of adjustment on discounted notes 151,597 224,404 -72,807 -32.4– beneficiaries of outstanding invoices 30,920 78,121 -47,201 -60.4– amounts due to customers 56,465 77,096 -20,631 -26.8– amounts due to tax authorities on behalf of third parties 12,961 15,988 -3,027 -18.9– staff charges 12,819 10,180 2,639 25.9– amounts related to writedowns on off-balance sheet transactions 5,013 7,283 -2,270 -31.2- amounts in transit with branches 6,698 6,314 384 6.1- premiums related to options transactions 5,607 2,675 2,932 109.6– accrued costs to be recognized 913 2,420 -1,507 -62.3– guarantee deposits from third parties 764 985 -221 -22.4– amounts relating to tax collection service 499 699 -200 -28.6– other 89,667 178,767 -89,100 -49.8
The amount of 5,151 thousand euros paid as an advance to Cassa di Risparmio di Firenze SpA for the purchase of aholding in Carinord 2 is recorded at item ‘others’.

123
Change31/12/03 31/12/02 absolute %
9.2 CAPTION 60 "ACCRUED EXPENSES AND DEFERRED INCOME" 163,572 144,444 19,128 13.2Accrued expenses: 95,528 80,733 14,795 18.3
– interest expenses due to banks 3,132 4,903 -1,771 -36.1– interest expenses due to customers 310 1,639 -1,329 -81.1– interest payable on debt securities 44,522 43,188 1,334 3.1– differentials stemming from derivatives 47,450 30,904 16,546 53.5 contracts– others 114 99 15 15.2
Deferred income: 68,044 63,711 4,333 6.8– premiums related to currency forward 636 122 514 421.3 transactions– differentials stemming from derivatives 3,777 4,633 -856 -18.5 contracts– discounted notes 1,702 2,211 -509 -23.0– leasing rents 59,838 55,835 4,003 7.2– others 2,091 910 1,181 129.8
Accrued expenses and deferred income are not applied directly to the balance sheet accounts in accordance with article12, Legislative Decree 87/92.

124
SECTION 10
GUARANTEES AND COMMITMENTS
Guarantees and commitments amount to 2,181,874 thousand euros and are analysed below:
31/12/03 31/12/02thousands of € % thousands of € %
– Guarantees given (caption 10) 1,271,681 58.3 1,321,238 63.2– Commitments (caption 20) 910,193 41.7 770,378 36.8Total 2,181,874 100.0 2,091,616 100.0
Change31/12/03 31/12/02 absolute %
10.1 CAPTION 10 "GUARANTEES GIVEN" 1,271,681 1,321,238 -49,557 -3.8(a) commercial guarantees 1,170,959 1,210,355 -39,396 -3.3(b) financial guarantees 31,694 26,539 5,155 19.4(c) assets held in guarantee 69,028 84,344 -15,316 -18.2Total 1,271,681 1,321,238 -49,557 -3.8Caption 10 is analysed below:– sureties 1,140,003 1,181,890 -41,887 -3.5– documentary and non documentary credits 60,040 49,739 10,301 20.7– acceptances on behalf of third parties 2,610 4,210 -1,600 -38.0– joint securities - 1,056 -1,056 -100.0– other sureties on behalf of third parties 1 - 1 …– bond sureties on behalf of third parties 69,027 84,343 -15,316 -18.2
Credit commitments related to non-performing loans amount to 18,461 thousand euros.Reserve for guarantees and commitments, which amount to 2,787 thousand euros, cover all relevant risks.

125
Change31/12/03 31/12/02 absolute %
10.2 CAPTION 20 "COMMITMENTS" 910,193 770,378 139,815 18.1(a) Commitments to extend credit (certain to be called on) 458,915 391,328 67,587 17.3(b) Commitments to extend credit (not certain to be called on) 451,278 379,050 72,228 19.1Commitments are analysed as follows:– stipulated mortgages to be granted 355,254 278,956 76,298 27.4– derivative contracts on credits 194,087 258,949 -64,862 -25.0– purchases of securities to be settled 112,074 123,277 -11,203 -9.1– unused irrevocable lines of credit 104,828 53,714 51,114 95.2– amounts to be granted to customers 14,010 823 13,187 …– stipulated leasing transactions to be granted 15,800 29,427 -13,627 -46.3– commitments with Deposit Protection Fund Liabilities (FITD) 15,650 12,635 3,015 23.9– subsidiaries' shares and quotas to be received 97,874 4,881 92,993 …– option on securities - 5,165 -5,165 -100.0– deposits to be made with banks 616 2,551 -1,935 -75.9Total 910,193 770,378 139,815 18.1
Commitment of 91,882 thousand euros related to the purchase of Carinord 2 SpA is in commitments certain to be calledon.
Change31/12/03 31/12/02 absolute %
10.3 ASSETS HELD TO GUARANTEE THE BANK’S LIABILITIES 228,857 570,056 -341,199 -59.9Securities held to guarantee:– bank drafts issued by Carige 23,129 18,101 5,028 27.8– repurchase agreements 205,728 551,955 -346,227 -62.7Total 228,857 570,056 -341,199 -59.9
Change31/12/03 31/12/02 absolute %
10.4 UNUSED LINES OF CREDIT BY THE BANK 129,712 245,679 -115,967 -47.2(a) central banks 102,385 143,794 -41,409 -28.8(b) other banks 27,327 101,885 -74,558 -73.2

126
10.5 FORWARD TRANSACTIONS31/12/03 31/12/02
Hedging Trading Other Hedging Trading Other1. Purchase/sale of: - 328,602 - 10,914 332,522 - 1.1 Securities - 145,439 - - 150,922 - – purchases - 112,074 - - 123,277 - – sales - 33,365 - - 27,645 - 1.2 Currency - 183,163 - 10,914 181,600 -
– currency against currency - - - - - - – purchases against euro - 45,456 - 10,051 42,692 - – sales against euro - 137,707 - 863 138,908 -
2. Deposits and loans - - 66,546 - - 38,735– to be made - - 16,210 - - 5,281– to be received - - 50,336 - - 33,454
3. Derivatives contracts 3,541,457 3,436,316 178,885 2,655,053 2,904,802 83,1143.1 With exchange of principal 274,227 125,636 102,171 263,559 65,562 -
(a) securities 116,997 15,980 102,171 106,329 6,616 - – purchases - 300 - 10,329 988 - – sales 116,997 15,680 102,171 96,000 5,628 - (b) currency 157,230 109,656 - 157,230 58,946 - – currency against currency - - - - - - – purchases against euro 157,230 54,828 - 157,230 29,473 - – sales against euro - 54,828 - - 29,473 - (c) other instruments - - - - - - – purchases - - - - - - – sales - - - - - -
3.2 Without exchange of principal 3,267,230 3,310,680 76,714 2,391,494 2,839,240 83,114(a) currency - - - - - - – currency against currency - - - - - - – purchases against euro - - - - - - – sales against euro - - - - - - (b) other instruments 3,267,230 3,310,680 76,714 2,391,494 2,839,240 83,114– purchases 1,278,824 1,672,981 - 1,102,715 1,476,355 - – sales 1,988,406 1,637,699 76,714 1,288,779 1,362,885 83,114
Total 3,541,457 3,764,918 245,431 2,665,967 3,237,324 121,849
Deposits and financing to be made or received include exclusively short-term repurchase agreements; sale and repurchaseagreements with currency as the underlying totalled 20.7 million euros.With reference to derivatives contracts, the notional value of options incorporated in structured bonds issued by the Bank,the value of which is derived from the liabilities of other parties, are recorded at column ‘other transactions’. In particular,in capital-exchange contracts, the values recorded are those of the options implicitly sold to the subscribers of convertiblebonds (into ordinary shares) issued during 2003 (see section 8).The notional value of options incorporated in assets or liabilities which allow either the Bank or the counterparty totransform, after a certain period of time, the interest rate stipulated in the contract from fixed to floating, or vice versa, wasrecorded at section 11.6 ‘Maturities of assets and liabilities’.

127
10.6 DERIVATIVES CONTRACTS ON LENDING31/12/03 31/12/02
Trading Banking Trading Bankingbook book book book
1. Hedging purchases 20,918 - 29,535 - 1.1 With exchange of principal 20,918 - 29,535 -
- credit default product 20,918 - 29,535 - 2. Hedging sales 162,087 32,000 226,949 32,0002.1 With exchange of principal 2,000 32,000 52,000 32,000
- credit default product 2,000 32,000 52,000 32,0002.2 Without exchange of principal 160,087 - 174,949 -
- total rate of return swap 160,087 - 174,949 - Total 183,005 32,000 256,484 32,000
Total principal of derivatives contracts amounts to 7,371.7 million euros (inclusive of basis swaps contracts for 1,170.7million of euros, the notional value of which is recorded at section 10.5).
PRINCIPAL (1)Interest Exchange Share Other Total
rate rate rates1. Trading contracts 2,328,918 109,656 409,210 220,685 3,068,4691.1 Non-quoted trading contracts 2,328,918 109,656 393,461 205,005 3,037,040
Forwards - - - - - Swaps (2) 2,157,123 - - - 2,157,123Options bought 61,363 54,828 107,288 - 223,479Options sold 110,432 54,828 286,173 - 451,433Derivatives on credits - - - 205,005 205,005
1.2 Quoted trading contracts - - 15,749 15,680 31,429Futures bought - - 1,450 - 1,450Futures sold - - 4,249 15,680 19,929Options bought - - 3,300 - 3,300Options sold - - 6,750 - 6,750
2. Non-quoted hedging contracts 2,769,730 157,230 195,497 10,000 3,132,457Swaps (2) 2,229,578 157,230 - - 2,386,808Options bought 540,152 - 136,841 - 676,993Options sold - - 58,656 - 58,656Derivatives on credits - - - 10,000 10,000
Total 5,098,648 266,886 604,707 230,685 6,200,926
(1) Principal in basis swaps is stated once(2) Caption includes basis swaps, cross currency swaps, interest rate swaps and overnight indexed swaps.

128
PRINCIPAL IN HEDGING CONTRACTS (1)Swaps Options Options Derivatives Total
bought sold on credits1. Assets 1,258,254 383,493 58,656 10,000 1,710,403
Loans to customers 413,997 325,152 - - 739,149Trading securities 552,257 58,341 58,656 10,000 679,254Deposits with banks 292,000.0 - - - 292,000
2. Liabilities 1,071,680 293,500 - - 1,365,180Bonds 1,071,680 293,500 - - 1,365,180
3. Other (2) 56,874 - - - 56,874Total 2,386,808 676,993 58,656 10,000 3,132,457
(1) Principal in basis swaps is stated once.(2) Non-specific hedging contracts on interest-rate risk related to customer borrowing and lending.
PRINCIPAL IN CONTRACTS CLASSIFIED BY REMAINING CONTRACT LIFE (1)Up to 12 From 1 to 5 More than Total
months years 5 years1. Trading contracts 455,760 1,359,437 1,253,272 3,068,4691.1 Non-quoted trading contracts 424,631 1,359,137 1,253,272 3,037,040
Swaps 294,335 1,175,263 687,525 2,157,123Options bought 26,791 91,937 104,751 223,479Options sold 103,505 91,937 255,991 451,433Derivatives on credits - - 205,005 205,005
1.2 Quoted trading contracts 31,129 300 - 31,429Futures bought 1,450 - - 1,450Futures sold 19,929 - - 19,929Options bought 3,000 300 - 3,300Options sold 6,750 - - 6,750
2. Non-quoted hedging contracts 543,769 1,417,120 1,171,568 3,132,457Swaps 541,269 1,076,794 768,745 2,386,808Options bought 2,500 271,670 402,823 676,993Options sold - 58,656 - 58,656Derivatives on credits - 10,000 - 10,000
Total 999,529 2,776,557 2,424,840 6,200,926
(1) Principal in basis swaps is stated once.
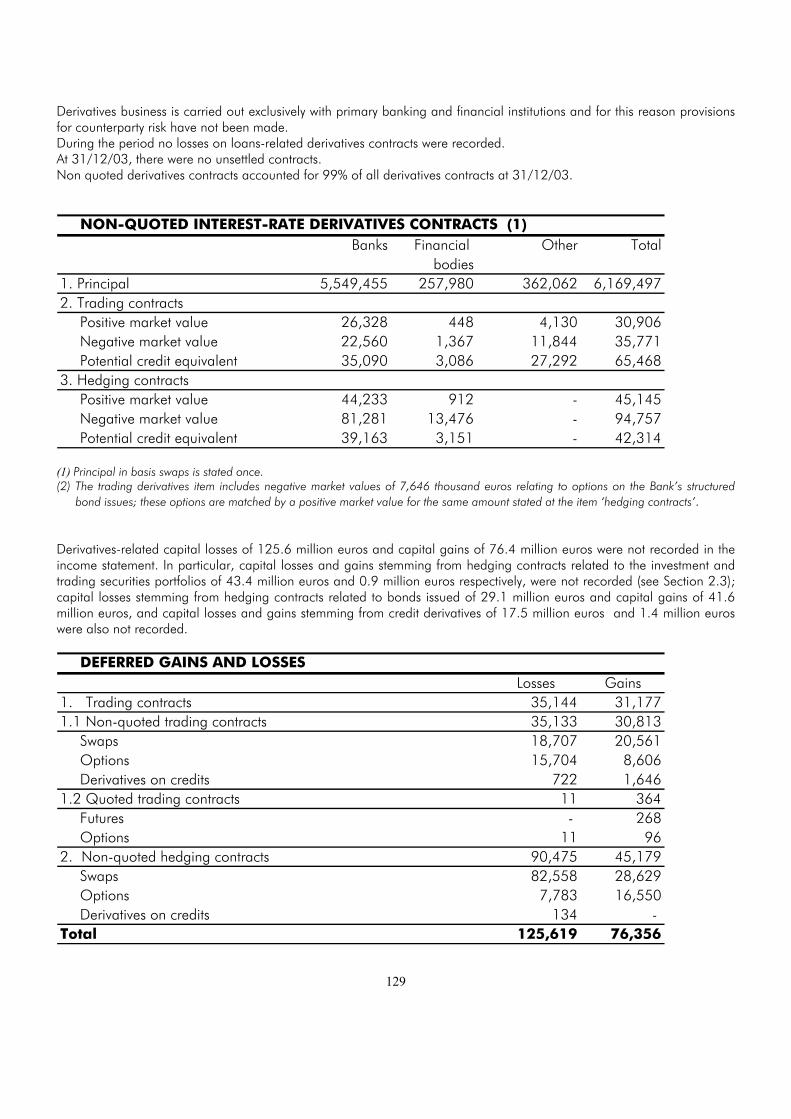
129
Derivatives business is carried out exclusively with primary banking and financial institutions and for this reason provisionsfor counterparty risk have not been made.During the period no losses on loans-related derivatives contracts were recorded.At 31/12/03, there were no unsettled contracts.Non quoted derivatives contracts accounted for 99% of all derivatives contracts at 31/12/03.
NON-QUOTED INTEREST-RATE DERIVATIVES CONTRACTS (1)Banks Financial Other Total
bodies1. Principal 5,549,455 257,980 362,062 6,169,4972. Trading contracts
Positive market value 26,328 448 4,130 30,906Negative market value 22,560 1,367 11,844 35,771Potential credit equivalent 35,090 3,086 27,292 65,468
3. Hedging contractsPositive market value 44,233 912 - 45,145Negative market value 81,281 13,476 - 94,757Potential credit equivalent 39,163 3,151 - 42,314
(1) Principal in basis swaps is stated once.(2) The trading derivatives item includes negative market values of 7,646 thousand euros relating to options on the Bank’s structured
bond issues; these options are matched by a positive market value for the same amount stated at the item ‘hedging contracts’.
Derivatives-related capital losses of 125.6 million euros and capital gains of 76.4 million euros were not recorded in theincome statement. In particular, capital losses and gains stemming from hedging contracts related to the investment andtrading securities portfolios of 43.4 million euros and 0.9 million euros respectively, were not recorded (see Section 2.3);capital losses stemming from hedging contracts related to bonds issued of 29.1 million euros and capital gains of 41.6million euros, and capital losses and gains stemming from credit derivatives of 17.5 million euros and 1.4 million euroswere also not recorded.
DEFERRED GAINS AND LOSSESLosses Gains
1. Trading contracts 35,144 31,1771.1 Non-quoted trading contracts 35,133 30,813
Swaps 18,707 20,561Options 15,704 8,606Derivatives on credits 722 1,646
1.2 Quoted trading contracts 11 364Futures - 268Options 11 96
2. Non-quoted hedging contracts 90,475 45,179Swaps 82,558 28,629Options 7,783 16,550Derivatives on credits 134 -
Total 125,619 76,356
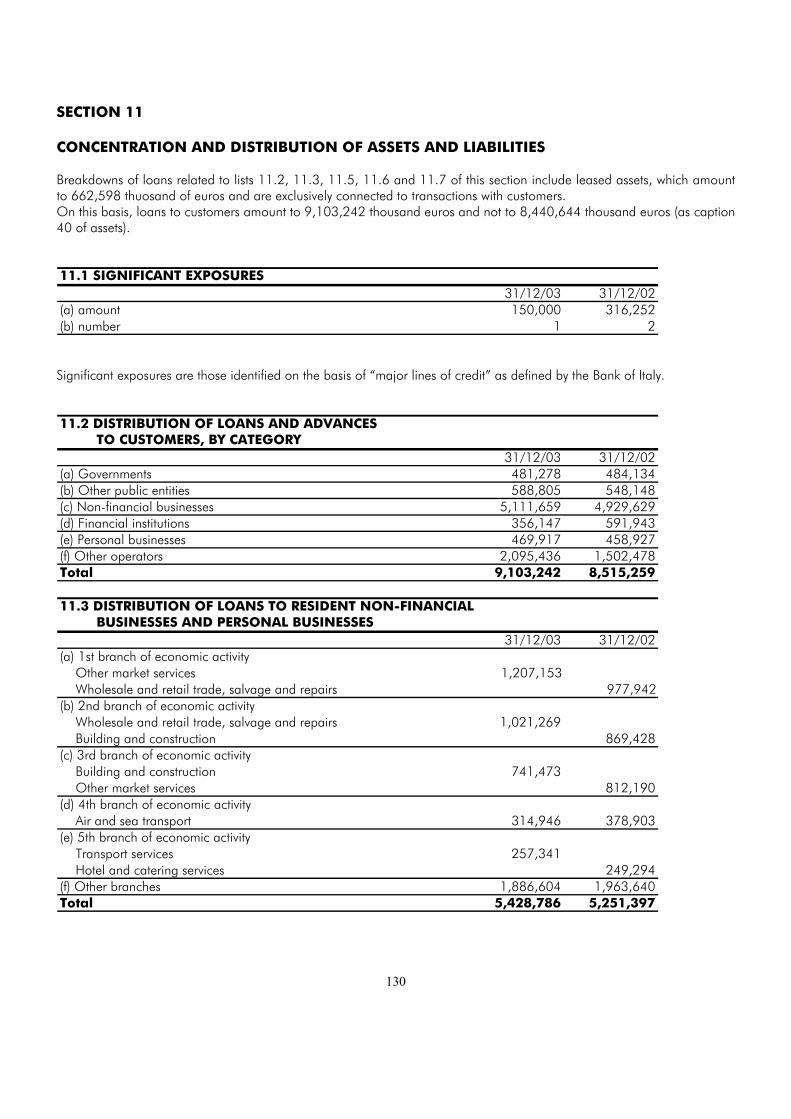
130
SECTION 11
CONCENTRATION AND DISTRIBUTION OF ASSETS AND LIABILITIES
Breakdowns of loans related to lists 11.2, 11.3, 11.5, 11.6 and 11.7 of this section include leased assets, which amountto 662,598 thuosand of euros and are exclusively connected to transactions with customers.On this basis, loans to customers amount to 9,103,242 thousand euros and not to 8,440,644 thousand euros (as caption40 of assets).
11.1 SIGNIFICANT EXPOSURES31/12/03 31/12/02
(a) amount 150,000 316,252(b) number 1 2
Significant exposures are those identified on the basis of “major lines of credit” as defined by the Bank of Italy.
11.2 DISTRIBUTION OF LOANS AND ADVANCES TO CUSTOMERS, BY CATEGORY
31/12/03 31/12/02(a) Governments 481,278 484,134(b) Other public entities 588,805 548,148(c) Non-financial businesses 5,111,659 4,929,629(d) Financial institutions 356,147 591,943(e) Personal businesses 469,917 458,927(f) Other operators 2,095,436 1,502,478Total 9,103,242 8,515,259
11.3 DISTRIBUTION OF LOANS TO RESIDENT NON-FINANCIAL BUSINESSES AND PERSONAL BUSINESSES
31/12/03 31/12/02(a) 1st branch of economic activity
Other market services 1,207,153Wholesale and retail trade, salvage and repairs 977,942
(b) 2nd branch of economic activityWholesale and retail trade, salvage and repairs 1,021,269Building and construction 869,428
(c) 3rd branch of economic activityBuilding and construction 741,473Other market services 812,190
(d) 4th branch of economic activityAir and sea transport 314,946 378,903
(e) 5th branch of economic activityTransport services 257,341Hotel and catering services 249,294
(f) Other branches 1,886,604 1,963,640Total 5,428,786 5,251,397

131
11.4 DISTRIBUTION OF GUARANTEES GIVEN,BY CATEGORY OF COUNTERPART
31/12/03 31/12/02(a) Governments - - (b) Other public entities 9,772 4,406(c) Banks 137,584 163,307(d) Non-financial businesses 984,583 929,015(e) Financial institutions 93,910 163,673(f) Personal businesses 13,012 13,234(g) Other operators 32,820 47,603Total 1,271,681 1,321,238
11.5 GEOGRAPHIC DISTRIBUTION OF ASSETS AND LIABILITIES
31/12/03Caption/countries Italy Other EU Other Total
countries countries1. Assets 11,516,829 564,537 87,399 12,168,765
1.1 Due from banks 578,500 332,234 28,102 938,8361.2 Loans to customers 8,842,545 214,663 46,034 9,103,2421.3 Securities 2,095,784 17,640 13,263 2,126,687
2. Liabilities 10,600,224 822,126 245,087 11,667,4372.1 Due to banks 571,765 525,106 42,761 1,139,6322.2 Deposits from customers 5,858,610 87,020 12,258 5,957,8882.3 Securities issued 4,067,426 0 68 4,067,4942.4 Others 102,423 210,000 190,000 502,423
3. Guarantees and Commitments 2,099,321 26,596 55,957 2,181,874
31/12/02Caption/countries Italy Other EU Other Total
countries countries1. Assets 11,018,333 829,876 105,075 11,953,284
1.1 Due from banks 1,025,233 301,629 28,805 1,355,6671.2 Loans to customers 8,263,686 227,761 23,812 8,515,2591.3 Securities 1,729,414 300,486 52,458 2,082,358
2. Liabilities 10,226,823 951,873 255,136 11,433,8322.1 Due to banks 1,128,685 613,958 54,705 1,797,3482.2 Deposits from customers 5,824,085 77,915 10,248 5,912,2482.3 Securities issued 3,273,743 50,000 183 3,323,9262.4 Others 310 210,000 190,000 400,310
3. Guarantees and Commitments 1,789,121 284,570 17,925 2,091,616
Geographic distribution is analysed with reference to the counterparts’ residence.
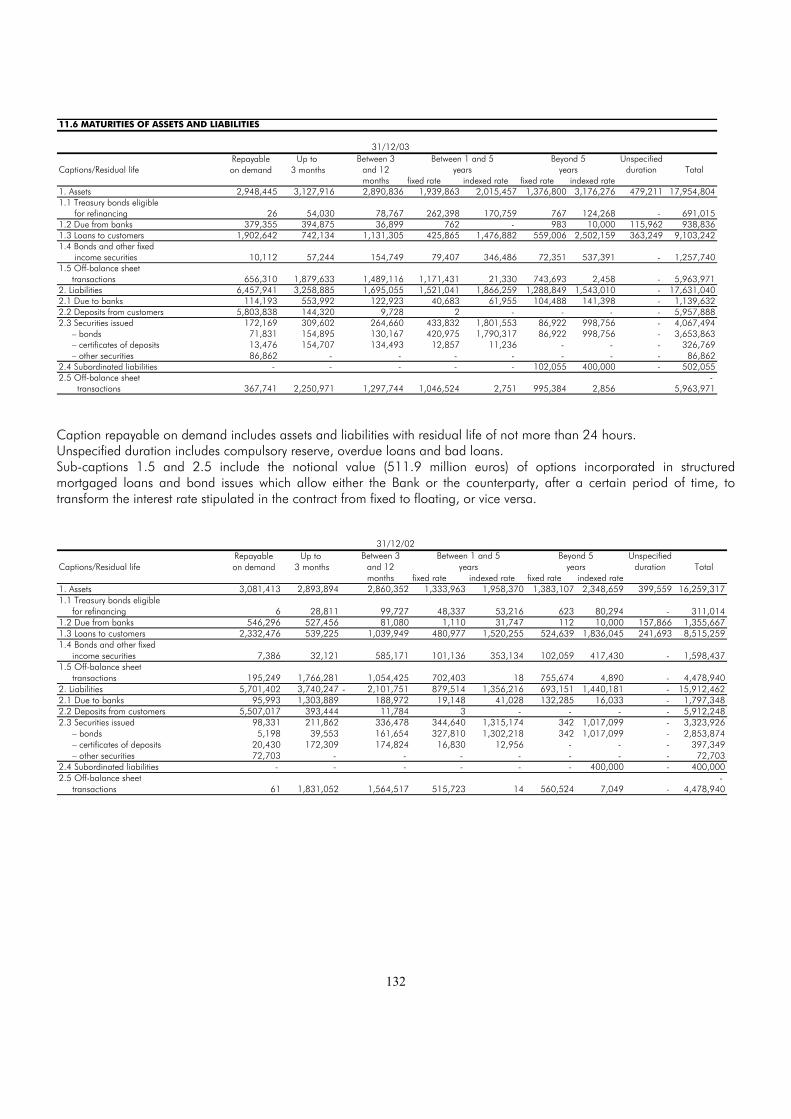
132
11.6 MATURITIES OF ASSETS AND LIABILITIES
31/12/03Repayable Up to Between 3 Between 1 and 5 Beyond 5 Unspecified
Captions/Residual life on demand 3 months and 12 years years duration Totalmonths fixed rate indexed rate fixed rate indexed rate
1. Assets 2,948,445 3,127,916 2,890,836 1,939,863 2,015,457 1,376,800 3,176,276 479,211 17,954,8041.1 Treasury bonds eligible
for refinancing 26 54,030 78,767 262,398 170,759 767 124,268 - 691,0151.2 Due from banks 379,355 394,875 36,899 762 - 983 10,000 115,962 938,8361.3 Loans to customers 1,902,642 742,134 1,131,305 425,865 1,476,882 559,006 2,502,159 363,249 9,103,2421.4 Bonds and other fixed
income securities 10,112 57,244 154,749 79,407 346,486 72,351 537,391 - 1,257,7401.5 Off-balance sheet
transactions 656,310 1,879,633 1,489,116 1,171,431 21,330 743,693 2,458 - 5,963,9712. Liabilities 6,457,941 3,258,885 1,695,055 1,521,041 1,866,259 1,288,849 1,543,010 - 17,631,0402.1 Due to banks 114,193 553,992 122,923 40,683 61,955 104,488 141,398 - 1,139,6322.2 Deposits from customers 5,803,838 144,320 9,728 2 - - - - 5,957,8882.3 Securities issued 172,169 309,602 264,660 433,832 1,801,553 86,922 998,756 - 4,067,494
– bonds 71,831 154,895 130,167 420,975 1,790,317 86,922 998,756 - 3,653,863– certificates of deposits 13,476 154,707 134,493 12,857 11,236 - - - 326,769– other securities 86,862 - - - - - - - 86,862
2.4 Subordinated liabilities - - - - - 102,055 400,000 - 502,0552.5 Off-balance sheet -
transactions 367,741 2,250,971 1,297,744 1,046,524 2,751 995,384 2,856 5,963,971
Caption repayable on demand includes assets and liabilities with residual life of not more than 24 hours.Unspecified duration includes compulsory reserve, overdue loans and bad loans.Sub-captions 1.5 and 2.5 include the notional value (511.9 million euros) of options incorporated in structuredmortgaged loans and bond issues which allow either the Bank or the counterparty, after a certain period of time, totransform the interest rate stipulated in the contract from fixed to floating, or vice versa.
31/12/02Repayable Up to Between 3 Between 1 and 5 Beyond 5 Unspecified
Captions/Residual life on demand 3 months and 12 years years duration Totalmonths fixed rate indexed rate fixed rate indexed rate
1. Assets 3,081,413 2,893,894 2,860,352 1,333,963 1,958,370 1,383,107 2,348,659 399,559 16,259,3171.1 Treasury bonds eligible
for refinancing 6 28,811 99,727 48,337 53,216 623 80,294 - 311,0141.2 Due from banks 546,296 527,456 81,080 1,110 31,747 112 10,000 157,866 1,355,6671.3 Loans to customers 2,332,476 539,225 1,039,949 480,977 1,520,255 524,639 1,836,045 241,693 8,515,2591.4 Bonds and other fixed
income securities 7,386 32,121 585,171 101,136 353,134 102,059 417,430 - 1,598,4371.5 Off-balance sheet
transactions 195,249 1,766,281 1,054,425 702,403 18 755,674 4,890 - 4,478,9402. Liabilities 5,701,402 3,740,247 - 2,101,751 879,514 1,356,216 693,151 1,440,181 - 15,912,4622.1 Due to banks 95,993 1,303,889 188,972 19,148 41,028 132,285 16,033 - 1,797,3482.2 Deposits from customers 5,507,017 393,444 11,784 3 - - - - 5,912,2482.3 Securities issued 98,331 211,862 336,478 344,640 1,315,174 342 1,017,099 - 3,323,926
– bonds 5,198 39,553 161,654 327,810 1,302,218 342 1,017,099 - 2,853,874– certificates of deposits 20,430 172,309 174,824 16,830 12,956 - - - 397,349– other securities 72,703 - - - - - - - 72,703
2.4 Subordinated liabilities - - - - - - 400,000 - 400,0002.5 Off-balance sheet -
transactions 61 1,831,052 1,564,517 515,723 14 560,524 7,049 - 4,478,940
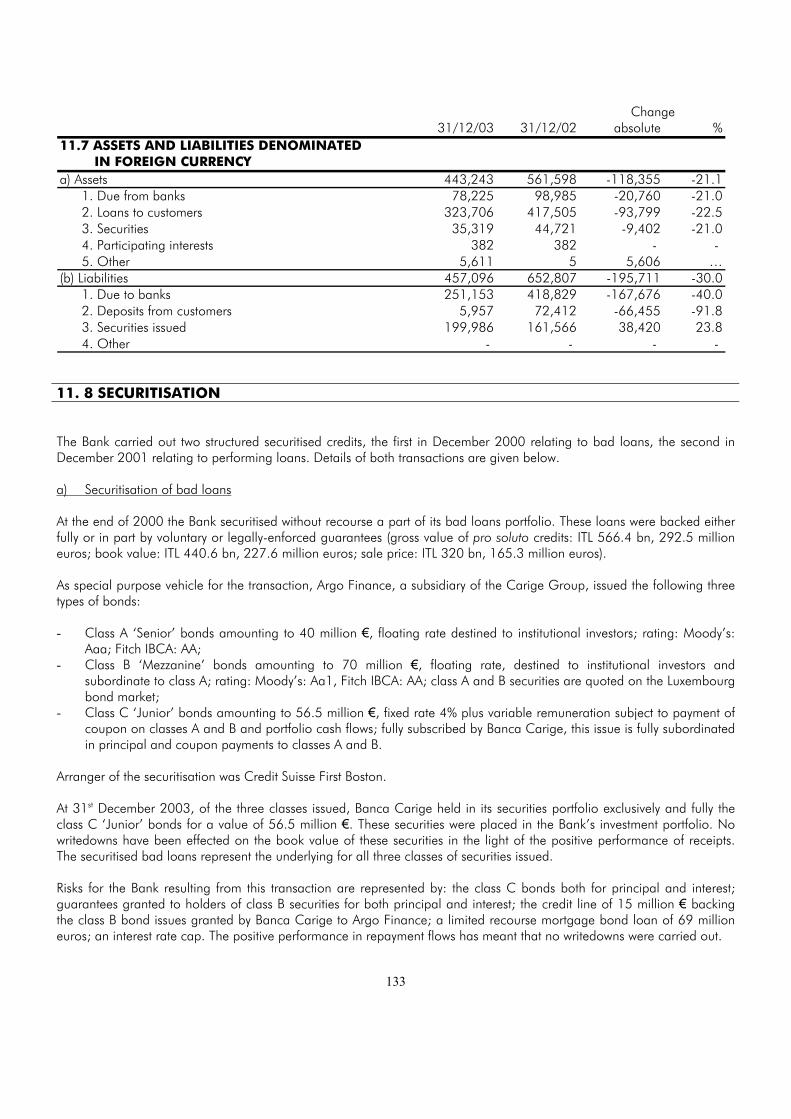
133
Change31/12/03 31/12/02 absolute %
11.7 ASSETS AND LIABILITIES DENOMINATED IN FOREIGN CURRENCY
a) Assets 443,243 561,598 -118,355 -21.11. Due from banks 78,225 98,985 -20,760 -21.02. Loans to customers 323,706 417,505 -93,799 -22.53. Securities 35,319 44,721 -9,402 -21.04. Participating interests 382 382 - - 5. Other 5,611 5 5,606 …
(b) Liabilities 457,096 652,807 -195,711 -30.01. Due to banks 251,153 418,829 -167,676 -40.02. Deposits from customers 5,957 72,412 -66,455 -91.83. Securities issued 199,986 161,566 38,420 23.84. Other - - - -
11. 8 SECURITISATION
The Bank carried out two structured securitised credits, the first in December 2000 relating to bad loans, the second inDecember 2001 relating to performing loans. Details of both transactions are given below.
a) Securitisation of bad loans
At the end of 2000 the Bank securitised without recourse a part of its bad loans portfolio. These loans were backed eitherfully or in part by voluntary or legally-enforced guarantees (gross value of pro soluto credits: ITL 566.4 bn, 292.5 millioneuros; book value: ITL 440.6 bn, 227.6 million euros; sale price: ITL 320 bn, 165.3 million euros).
As special purpose vehicle for the transaction, Argo Finance, a subsidiary of the Carige Group, issued the following threetypes of bonds:
- Class A ‘Senior’ bonds amounting to 40 million €, floating rate destined to institutional investors; rating: Moody’s:Aaa; Fitch IBCA: AA;
- Class B ‘Mezzanine’ bonds amounting to 70 million €, floating rate, destined to institutional investors andsubordinate to class A; rating: Moody’s: Aa1, Fitch IBCA: AA; class A and B securities are quoted on the Luxembourgbond market;
- Class C ‘Junior’ bonds amounting to 56.5 million €, fixed rate 4% plus variable remuneration subject to payment ofcoupon on classes A and B and portfolio cash flows; fully subscribed by Banca Carige, this issue is fully subordinatedin principal and coupon payments to classes A and B.
Arranger of the securitisation was Credit Suisse First Boston.
At 31st December 2003, of the three classes issued, Banca Carige held in its securities portfolio exclusively and fully theclass C ‘Junior’ bonds for a value of 56.5 million €. These securities were placed in the Bank’s investment portfolio. Nowritedowns have been effected on the book value of these securities in the light of the positive performance of receipts.The securitised bad loans represent the underlying for all three classes of securities issued.
Risks for the Bank resulting from this transaction are represented by: the class C bonds both for principal and interest;guarantees granted to holders of class B securities for both principal and interest; the credit line of 15 million € backingthe class B bond issues granted by Banca Carige to Argo Finance; a limited recourse mortgage bond loan of 69 millioneuros; an interest rate cap. The positive performance in repayment flows has meant that no writedowns were carried out.

134
The credit line, which at 31/12/03 was unused, was recorded at balance sheet caption 20 ‘Guarantees’, whilst the limitedrecourse mortgage, also unused, was recorded, as required by the Bank of Italy, at caption 10 ‘Guarantees given’. Thepositive performance in repayment flows has meant that no value adjustments were required.
Banca Carige is the servicer for the transaction. Revenues on the credit portfolio at 30/12/03 amounted to 89.6 millioneuros, of which 27.7 million euros collected during 2003. These amounts are in line with the repayment schedule definedat the start of the transaction.Banca Carige bills Argo Finance One on a monthly and half-yearly basis for the service activity it performs. The half-yearlyaccounts are inspected by the auditors KPMG SpA.The service activity carried out by Banca Carige generated 1,109.6 thousand euros in commission revenues, 1,039.8thousand in reimbursed legal costs (1,495.3 thousand euros), 2,291 thousand in interest received on the class C Juniorbonds. On the basis of interest-rate trends and conditions contained in the contract, no additional revenues were payableon the limited recourse mortgage.
As a result of the positive performance recorded by the repayment schedule, Fitch on 6/3/02 upgraded the class Asecurities transaction from “AA” to “AAA”; on 13th December 2002 the same institute upgraded the transaction relating tothe class B securities from “AA-“ to “AA”.
The positive trend allowed for the full repayment of the class A securities (40 million) in addition to the repayment of part(20.9 million) of the capital relating to the class B securities. After the end of the year, in the month of January 2004, 12.9million of class B securities was also repaid.
The limited recourse mortgage in Italian government stock in support of class B subscribers, previously reduced to 69million in December 2003, was redefined at a nominal value of 51 million at the beginning of 2004.
b).Securitisation of performing loans
At the end of 2001, Banca Carige securitised its performing mortgages in order to improve liquidity in the light ofconsiderable expansion in long-term lending to the family (mortgages, in particular).
A total of 13,858 mortgages was sold with a residual debt at 31/12/01, the date of ceding, on the part of customersamounting to 511.5 million euros.
The portfolio subject to sale was identified on the basis of objective criteria foreseen by the relevant legislation (Law130/99).
In particular, the bundle of credits sold were mortgages granted to private customers for the purchase or renovation ofproperty.
The bundle of credits ceded, whose characteristics were published on Gazzetta Ufficiale of 25/2/2002, were as follows:
1) index-linked, first recorded mortgages/landed property loans distributed to private individuals prior to 31/7/2001;2) mortgages with: a fixed repayment schedule with instalment due 31/12/2001; repayments in order with schedulevia current account direct debit.3) mortgages/landed property loans not classified either as bad loans or watchlists between 31/12/93 (exclusive)and 31/12/01 (inclusive).
The bundle of credits described above was sold on 31/12/01 for 535.5 million euros to the special purpose vehicle ArgoMortgage Srl, in which Banca Carige has a 5% indirect holding via its subsidiary Columbus Carige Immobiliare (theregularity of the operation was evidenced by the signing of servicing, and guarantee and indemnity contracts in the timeprescribed).
The price of the credits ceded were calculated as the sum of the following two components:

135
- an initial price of 511.5 million euros equivalent to the nominal value of the credits ceded;- a deferred price of 24.0 million euros calculated on the basis of profit extraction which, in particular, took into
account the excess spread after the transaction costs relating to each payment date, intrinsic risk levels of the credits,possibility of anticipated re-payment of loan. This spread was actualised using market rates at 31/12/01 on the basisof the duration of the transaction.
The determination of deferred price was carried out with a financial model verified by an auditor. It is paid pro quota ateach payment date in reference to the procedures foreseen in the contract and the payment priorities defined in thetransaction. During 2002 and 2003 deferred-price account payments totalled 3.1 million.The remaining credit of 20.9 million euros at 31/12/2003 with Argo Mortgage Srl related to deferred-price is recorded atthe caption 40 “Loans to customers”.
The securities issued by Argo Mortgage are as follows:
Class Amount inmillions ofeuro
Rating byMoody’s/Fitch(***)
Expectedduration(*)
ContractualMaturity
Effectiveexpectedduration (*)
Euribor 3monthsmargin inbasispoints(**)
Creditenhancement
A 478.0 Aaa/AAA March 2009 October 2036 4.3 years 26 8.0%B 22.0 Aa2/AA March 2009 October 2036 6.8 years 450 3.7%C 11.5 Baa2/BBB March 2009 October 2036 6.8 years 145 1.5%D 9.2 Not rated October 2036
(*) assuming Argo Mortgage exercises its call option in January 2009;(**) step up of applicable spread if call option is not exercised;(***) the rating was assigned by Moody’s and Fitch/IBCA on the basis of due diligence. The rating will be reviewedannually on the basis of collection flows and deviance from business plans.
The class A, B and C securities are quoted on the Luxembourg bond market and have been fully subscribed exclusively byEuropean institutional investors, Italian included.
Class B and C securities were subscribed by Banca Carige. The class D issue was subscribed fully by Banca Carige andplaced in the Bank's investment portfolio.
Payment priority will be as follows:- the payment of senior expenses and swap interest rate, followed by:- the payment of coupon on class A securities at maturity dates prior to maturity at October 2003, followed by:- the payment of coupon on class B securities on the basis of cumulative default ratio, followed by:- the payment of coupon on class C securities
with residual available amounts at each payment date to be paid into a capital accumulation account.
From the October 2003 date of payment onwards, the order of priority is as follows:- the repayment of amortisation paid on class A securities, followed, on the basis of the cumulative default ratio, by:- the payment of coupon on class B securities and the repayment of amortisation paid on class B securities,
followed by:- the payment of coupon on class C securities and the repayment of amortisation relating to the same securities.
The repayment of principal and interest of class D securities is subordinate to the first three classes.
The role of servicer of the transaction was carried out by Argo Mortgage to Banca Carige.
136
Banca Carige bills Argo Mortgage on a three-monthly basis for the service activity it performs. The yearly accounts areinspected by the auditors KPMG SpA.
All proceeds relating to the securitised credits will be paid by mortgage borrowers at the counters of Banca Carige, asforeseen in the contractual documentation regulating the securitisation transaction, carrying out the role of both accountbank and cash manager. Both roles are compatible with the corporate service contract in that Banca Carige will performthe accounting duties on behalf of the special purpose vehicle.
During 2003, total revenues collected amounted to 86.7 million euros, of which 47.7 million euros in capital instalments,19.2 million euros in interest instalments, 19.8 million in advanced repayments, interest and penalty charges. In 2003commissions on revenues for 347.4 thousand euros accrued.The transaction is proceeding according to schedule, consequently no value adjustment relating to the Bank’s relationswith Argo Mortgage were required.
The transaction is monitored by the Bank of New York in its payment report and by Banca Carige in its quarterly andinvestor reports, and certified by the independent auditor (KPMG SPA).
Banca Carige SpA provided the special purpose vehicle with the cash collateral foreseen by the transaction (quota of thetranche of class D securities totalling 7.8 million) which during the year, as a result of the regular repayment flowsscheduled by the contract, reached the figure of 10.7 million, of which 0.3 million of accrued interest.
The London offices of the Bank of New York will represent the bond holders as well as being agent for calculation andsecurity trustee. The same bank’s Luxembourg offices will act as agent for Luxembourg.The Milan offices of BNP Paribas Security Services will be payment agent for the transaction.The arrangers of the transaction were CSFB and CDC IXIS.
The counterparty of the swap contracts utilised by Argo Mortgage for cover against interest rate fluctuations latent in thesecuritised credits is CDC IXIS.
---- ----
Banca Carige is also servicer in the securitisation operation (securitisation of non performing loans) carried out by thesubsidiary Cassa di Risparmio di Savona pursuant to Law 130/99, with the special purpose vehicle Priamar Finance Srl.
c) Securitisation of non-performing loans carried out by Cassa di Risparmio di Savona at the end of 2002.
At the end of 2002, Cassa di Risparmio di Savona securitised a part of its bad loans portfolio. The advantages of thistransaction can be summarised as follows:
- previously illiquid asset positions with low returns can now benefit from higher-yielding market interest rates;- securitisation achieves qualitative improvements in the bank’s risk portfolio;- higher credit rating of the bank has cost benefits for the Banca Carige Group in its funding requirements on
international markets.
The special purpose vehicle Priamar Finance Srl ownership structure is as follows: Stichting Faro of Amsterdam 95%;Banca Carige 5%. The bad loans securitised were classified as such at 31/12/01 and were still effective at 11/12/02.
On 14th January 2004 Banca Carige acquired a majority holding in Priamar Finance Srl, which subsequently wasincorporated into the Banca Carige Group with effect from the business year 2004.Priamar Finance’s share capital ownership structure is as follows:
- 60% Banca Carige SpA- 40% Stichting Faro (Amsterdam).

137
The portfolio subject to sale was identified on the basis of objective criteria foreseen by relevant legislation (Law 130/99and article 58, Law decree 385/93).
The credits sold (contract date: 23/12/02 with effect from 11.59 pm of 31/12/02) consisted of 1,085 debt positions(equivalent to 2,238 sub-items).
The gross value of credits sold excluding previous reductions was calculated at 68.8 million. The corresponding net valuewas 33.7 million after previous writedowns. The sale price, fixed at 28 million, determined a loss on securitisation of 5.7million, registered in the profit and loss account of 2002..
All the loans securitised were denominated in euro and were granted to customers resident in Italy.
All proceeds relating to the securitised credits will be collected at the counters of Banca Carige, the latter, as foreseen inthe contractual documentation regulating the securitisation transaction, carrying out the role of both account bank andcash manager. Both roles are compatible with the administrative service contract signed between Banca Carige andPriamar Finance in that Banca Carige will perform the accounting duties on behalf of the special purpose vehicle.
The role of servicer of the transaction was assigned to Banca Carige by Priamar Finance.
Banca Carige bills Priamar Finance on a monthly and half-yearly basis for the service activity it performs. The yearlyaccounts are inspected by the auditors KPMG SpA.
Priamar Finance is both assignee of the credits and issuer of the securities.
The London offices of the Bank of New York will represent the bond holders in addition to performing the duties ofcalculation agent, security trustee, and payment agent. The same bank’s Luxembourg offices will act as agent forLuxembourg.
Arranger and lead manager of the operation is WestLB AG.
The asset backed securities issued by Priamar Finance on 21st February 2003 are as follows:
Class Amount in millions ofeuro
Expected duration Interest rate
A 18.0 4.6 years Euribor 6 months + 0.15%B 10.2 4% plus any residual portfolio cash
flows
The maturity indicated in the table is that forecasted by the business plan. The expiry date of the operation has been fixedat 31/12/2016.
The class A securities are quoted on the Luxembourg bond market; class B securities are unquoted.
Class B securities were subscribed by Cassa di Risparmio di Savona and were placed in that bank’s investment securitiesportfolio.
The securities are not rated.
Payment priority will be as follows:
- the payment of coupon on class A securities, followed by the principal; on completion of this- the payment of coupon on class B securities, followed by the principal.

138
As stated above, the payment of coupon and principal relating to class B securities is fully subordinated to the class Aissue.
Credit enhancement of the issue is represented, in addition to the class categorization and payment priority describedabove, by a line of credit, a limited recourse bond loan, and an interest cap covering interest rate risk exposure.
Banca Carige has opened a revolving credit line in favour of Priamar Finance of 2.5 million for the duration of the bondissue, renewable on a yearly basis. This line of credit will be used in the case of any temporary interruptions in repaymentflows. Reimbursement of the credit to Banca Carige will be effected according to the conditions stipulated in the contractbetween Banca Carige and Priamar Finance. Repayment of the line of credit utilised is subordinated to the interest andcapital repayments relating to the class A securities.
As stated above, Priamar Finance is covered by an interest rate cap the premium of which was paid by Banca Carige upfront at the issuing of the securities.
Cassa di Risparmio di Savona has made available a limited recourse mortgage in the form of Italian government stock ofnominal 22 million.
Risks for Cassa di Risparmio di Savona resulting from this transaction are represented by: the class B bonds both forprincipal and interest and a limited recourse mortgage bond loan. Risks for Banca Carige, the servicer, are: the credit line,an interest rate cap and subordinate credits related to the role of servicer.
The transaction proceeds according to schedule. Consequently, no value adjustments were required (the proceeds at31/12/2003 were 5,641 thousand euros). For the same reason neither the credit line, nor mortgage bond loan was used.
Given market trends, the interest rate cap was not utilised.
In 2003 the following amounts accrued: 226 thousand euros in servicing commission; 92 thousand euros in recoveredexpenses (518 thousand anticipated).
d) Asset backed securities in portfolio at 31/12/03.
Within the trading securities portfolio at 31/12/03 are securities deriving from securitisation transactions carried out byother parties totalling 63,724 thousand euros. These securities can be classified as follows:

139
ASSET BACKED SECURITIES IN PORTFOLIO AT 31/12/03 DERIVING FROM STRUCTUREDSECURITISED CREDITS CARRIED OUT BY OTHER PARTIES
Underlying Senior securities Mezzanine securities Junior securities
a) Mortgages 18,383 983 -b) Corporate loans 3,449 3,967 -c) Consumer credits 6,286 - -d) Securities - - -e) Various other credits 7,593 - -f) Various other non-performing credits
17,864 5,199 -
Total 53,575 10,149 -
Writedowns relating to the above and carried out according to the accounting principles illustrated in section 1 of theexplanatory notes amounted to 216 thousand euros.Investments made in the form of these securities during 2003 are accounted for at income statement captions 10 ‘Interestincome’ and 60 ‘Gains (losses) from financial transactions’ and are respectively 1,948 thousand euros (interest income)and 1,017 thousand euros (losses on securities and foreign exchange). Details are given in the table below:
EFFECTS ON INCOME STATEMENT 2003 STEMMING FROM ASSET BACKED SECURITIES DERIVINGFROM STRUCTURED SECURITISED CREDITS CARRIED OUT BY OTHER PARTIES
Underlying Senior securities Mezzanine securities Junior securities
Interest Gains/Losses
Write-downs
Interest Gains/Losses
Write-downs
Interest Gains/Losses
Write-downs
a) Mortgages 458 6 - 35 - 16 - - -b) Corporate loans 185 -2 38 139 - 10 - - -
c) Consumer credits 168 4 118 - - - - - -d) Securities - - - - - - - - 250e) Various other credits 198 -560 - - - - - - -f) Various other non-performing credits
607 1 6 158 - 28 - - -
Total 1,616 -551 162 332 - 54 96 - 250

140
SECTION 12
ADMINISTRATION AND DEALING ON BEHALF OF THIRD PARTIES
Change31/12/03 31/12/02 absolute %
12.1 DEALING OF SECURITIESa) Purchases 804,129 217,487 586,642 269.7
1. Settled 802,770 216,442 586,328 270.92. Unsettled 1,359 1,045 314 30.0
(b) Sales 815,080 558,739 256,341 45.91. Settled 810,608 558,270 252,338 45.22. Unsettled 4,472 469 4,003 853.5
Change31/12/03 31/12/02 absolute %
12.2 PRIVATE BANKING 1,154,661 1,752,318 -597,657 -34.11. Securities issued by the Bank 38 5,080 -5,042 -99.32. Other securities 1,154,623 1,747,238 -592,615 -33.9
The figures shown correspond to total market values of property included within administration and trading on behalf ofthird parties.The caption includes wealth accumulation services on behalf of third parties pursuant to article 24, Legislative decree58/98 amounting to 41,169 thousand euros; a sum managed by the Carige Open Pension Fund launched in 1999 incompliance with article 9, Legislative decree 124/93 (38,970 thousand euros).The caption also includes 70,942 thousand euros relating to guaranteed asset management products in which the clientpurchased from the Bank an accessory put option as cover for the initial capital invested.
Change31/12/03 31/12/02 absolute %
12.3 CUSTODY AND ADMINISTRATION OF SECURITIES(a) third-party securities held in deposit 15,969,476 14,619,291 1,350,185 9.2
(private banking not included)1. Securities issued by the Bank 4,060,006 2,959,337 1,100,669 37.22. Other securities 11,909,470 11,659,954 249,516 2.1
(b) third-party securities depositedwith third-parties 14,562,095 12,930,550 1,631,545 12.6
(c) portfolio securities depositedwith third parties 1,533,005 1,007,168 525,837 52.2
Depositary bank-related securities in custody amounted to 2,540,637 thousand euros.
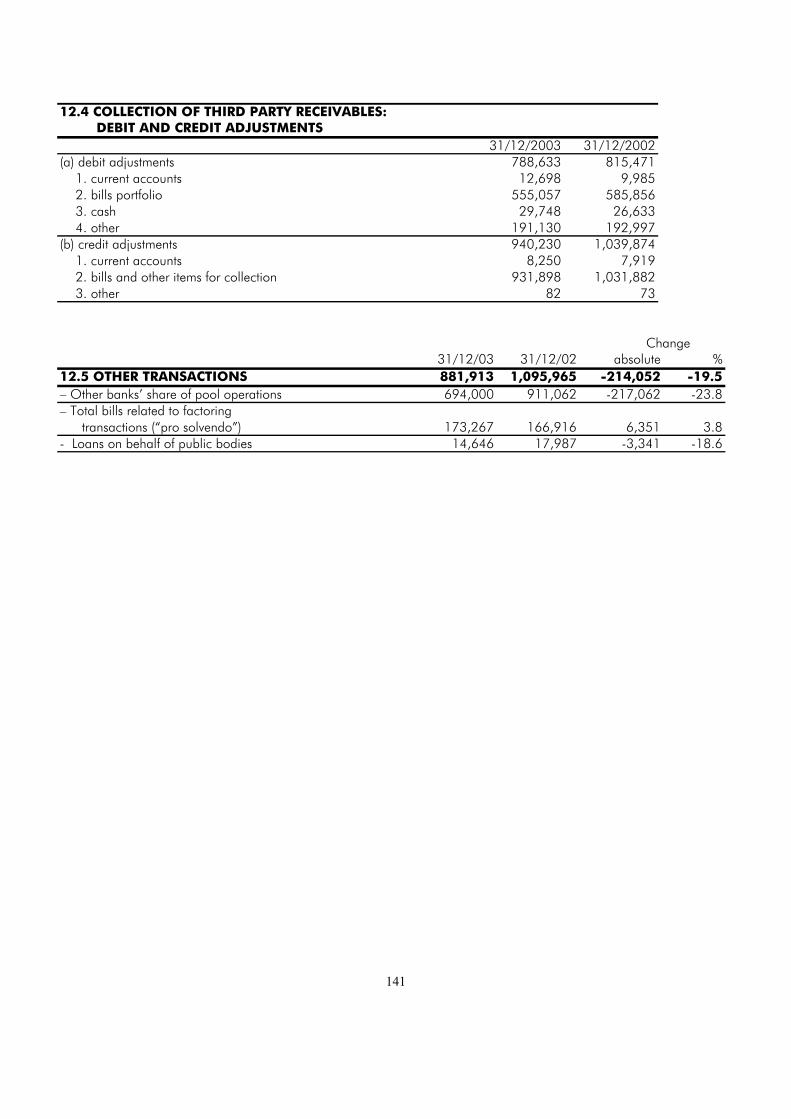
141
12.4 COLLECTION OF THIRD PARTY RECEIVABLES: DEBIT AND CREDIT ADJUSTMENTS
31/12/2003 31/12/2002(a) debit adjustments 788,633 815,471
1. current accounts 12,698 9,9852. bills portfolio 555,057 585,8563. cash 29,748 26,6334. other 191,130 192,997
(b) credit adjustments 940,230 1,039,8741. current accounts 8,250 7,9192. bills and other items for collection 931,898 1,031,8823. other 82 73
Change31/12/03 31/12/02 absolute %
12.5 OTHER TRANSACTIONS 881,913 1,095,965 -214,052 -19.5– Other banks’ share of pool operations 694,000 911,062 -217,062 -23.8– Total bills related to factoring
transactions (“pro solvendo”) 173,267 166,916 6,351 3.8- Loans on behalf of public bodies 14,646 17,987 -3,341 -18.6
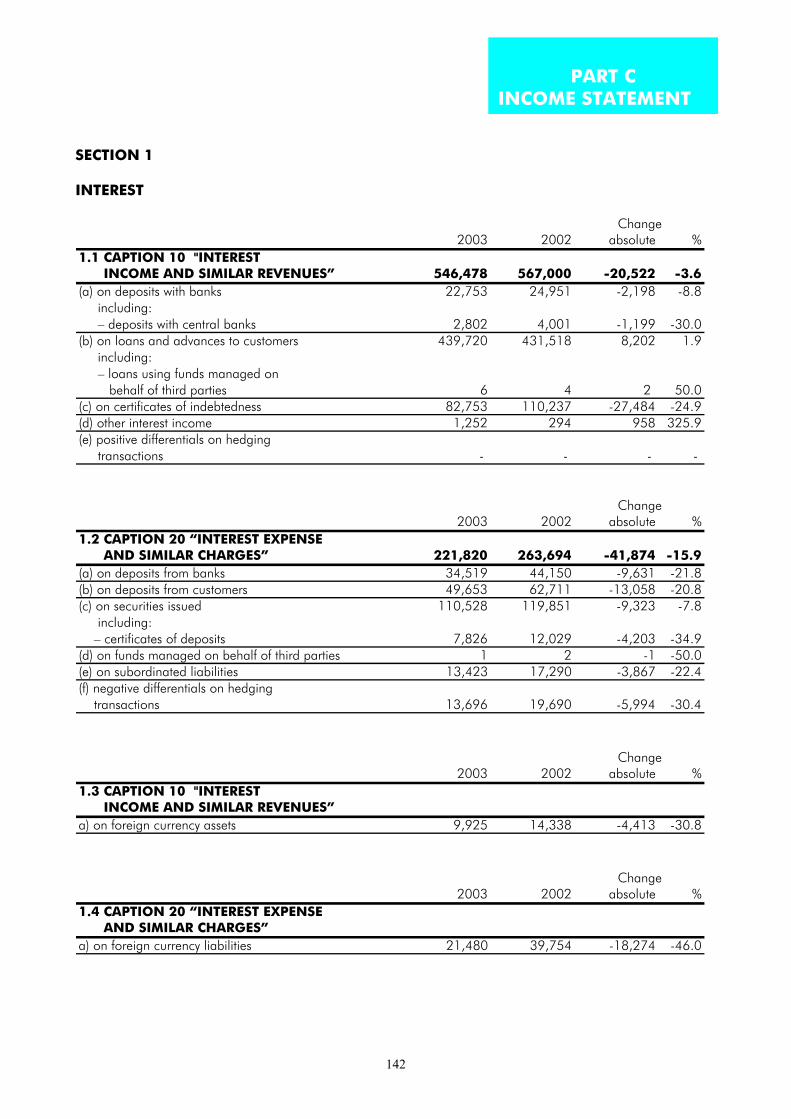
142
SECTION 1
INTEREST
Change2003 2002 absolute %
1.1 CAPTION 10 "INTEREST INCOME AND SIMILAR REVENUES” 546,478 567,000 -20,522 -3.6(a) on deposits with banks 22,753 24,951 -2,198 -8.8 including: – deposits with central banks 2,802 4,001 -1,199 -30.0(b) on loans and advances to customers 439,720 431,518 8,202 1.9 including: – loans using funds managed on behalf of third parties 6 4 2 50.0(c) on certificates of indebtedness 82,753 110,237 -27,484 -24.9(d) other interest income 1,252 294 958 325.9(e) positive differentials on hedging transactions - - - -
Change2003 2002 absolute %
1.2 CAPTION 20 “INTEREST EXPENSE AND SIMILAR CHARGES” 221,820 263,694 -41,874 -15.9(a) on deposits from banks 34,519 44,150 -9,631 -21.8(b) on deposits from customers 49,653 62,711 -13,058 -20.8(c) on securities issued 110,528 119,851 -9,323 -7.8 including: – certificates of deposits 7,826 12,029 -4,203 -34.9(d) on funds managed on behalf of third parties 1 2 -1 -50.0(e) on subordinated liabilities 13,423 17,290 -3,867 -22.4(f) negative differentials on hedging transactions 13,696 19,690 -5,994 -30.4
Change2003 2002 absolute %
1.3 CAPTION 10 "INTEREST INCOME AND SIMILAR REVENUES”a) on foreign currency assets 9,925 14,338 -4,413 -30.8
Change2003 2002 absolute %
1.4 CAPTION 20 “INTEREST EXPENSE AND SIMILAR CHARGES”a) on foreign currency liabilities 21,480 39,754 -18,274 -46.0
PART CINCOME STATEMENT

143
SECTION 2
COMMISSION
Change2003 2002 absolute %
2.1 CAPTION 40 “COMMISSION INCOME” 179,169 160,710 18,459 11.5(a) guarantees given 7,170 5,635 1,535 27.2(b) credit risk derivatives 461 325 136 41.8(c) management, dealing and consultancy services: 67,260 63,864 3,396 5.3 1. securities dealing 1,648 1,297 351 27.1 2. foreign currency dealing 2,848 3,005 -157 -5.2 3. private banking 7,684 6,725 959 14.3
3.1 individual 7,210 6,503 707 10.9 3.2 collective 474 222 252 113.5
4. custody and administration of securities 2,043 2,113 -70 -3.3 5. depositary bank 2,454 2,387 67 2.8 6. placement of securities 38,324 38,343 -19 0.0 6.1 placement of quotas in mutual funds 38,161 37,987 174 0.5 6.2 placement of other securities 163 356 -193 -54.2 7. acceptance of orders 4,097 4,172 -75 -1.8 8. consultancy - - - - 9. distribution of third party products 8,162 5,822 2,340 40.2 9.2 insurance products 4,177 2,496 1,681 67.3 9.3 other products 3,985 3,326 659 19.8(d) collection and payment services 36,673 32,831 3,842 11.7(e) servicing relating to securitisation 1,683 1,510 173 11.5(f) tax and rates collection - - - - (g) other services 65,922 56,545 9,377 16.6
The caption “other services” in more detail is as follows:
Change2003 2002 absolute %
– Deposits and current accounts 38,246 30,914 7,332 23.7– Overdraft facilities 13,549 11,859 1,690 14.3– Financing 9,268 9,397 -129 -1.4– Safe deposit rentals 1,162 1,061 101 9.5– Others 3,697 3,314 383 11.6Total 65,922 56,545 9,377 16.6
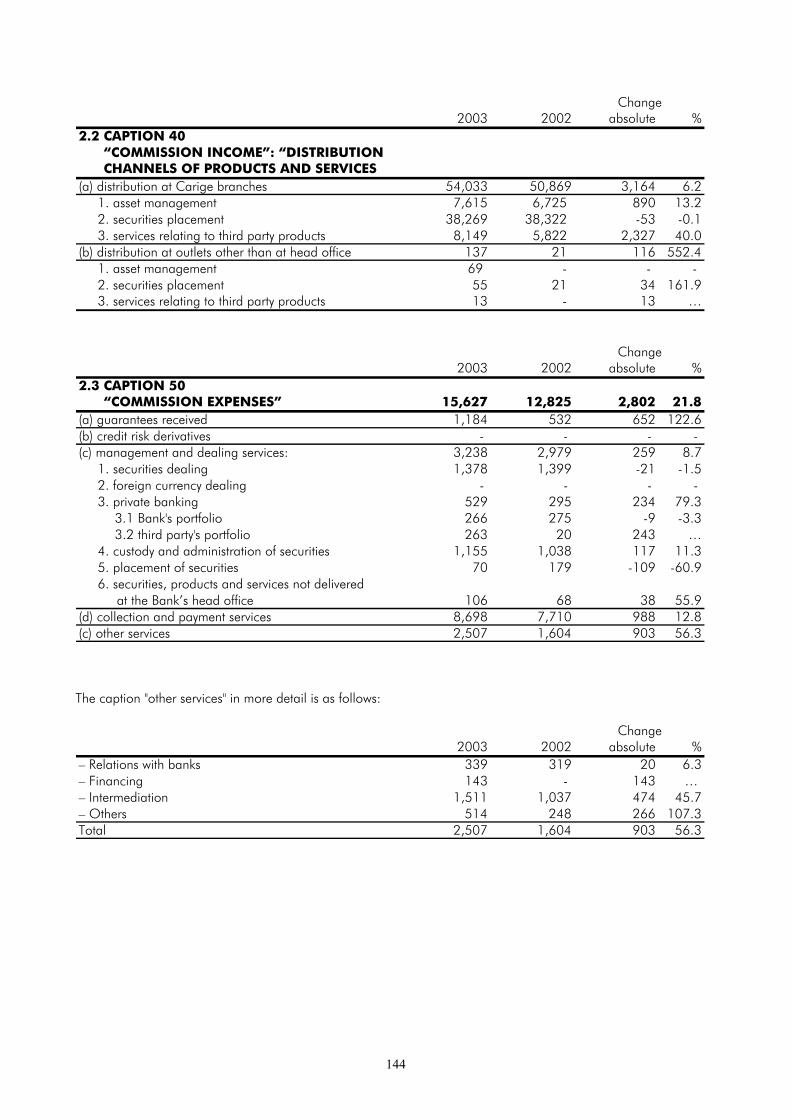
144
Change2003 2002 absolute %
2.2 CAPTION 40 “COMMISSION INCOME”: “DISTRIBUTION CHANNELS OF PRODUCTS AND SERVICES(a) distribution at Carige branches 54,033 50,869 3,164 6.2 1. asset management 7,615 6,725 890 13.2 2. securities placement 38,269 38,322 -53 -0.1 3. services relating to third party products 8,149 5,822 2,327 40.0(b) distribution at outlets other than at head office 137 21 116 552.4 1. asset management 69 - - - 2. securities placement 55 21 34 161.9 3. services relating to third party products 13 - 13 …
Change2003 2002 absolute %
2.3 CAPTION 50 “COMMISSION EXPENSES” 15,627 12,825 2,802 21.8(a) guarantees received 1,184 532 652 122.6(b) credit risk derivatives - - - - (c) management and dealing services: 3,238 2,979 259 8.7 1. securities dealing 1,378 1,399 -21 -1.5 2. foreign currency dealing - - - - 3. private banking 529 295 234 79.3
3.1 Bank's portfolio 266 275 -9 -3.3 3.2 third party's portfolio 263 20 243 …
4. custody and administration of securities 1,155 1,038 117 11.3 5. placement of securities 70 179 -109 -60.9 6. securities, products and services not delivered at the Bank’s head office 106 68 38 55.9(d) collection and payment services 8,698 7,710 988 12.8(c) other services 2,507 1,604 903 56.3
The caption "other services" in more detail is as follows:
Change2003 2002 absolute %
– Relations with banks 339 319 20 6.3– Financing 143 - 143 … – Intermediation 1,511 1,037 474 45.7– Others 514 248 266 107.3Total 2,507 1,604 903 56.3

145
SECTION 3
GAINS FROM FINANCIAL TRANSACTIONS, NETChange
2003 2002 absolute %3.1 CAPTION 60 “GAINS FROM FINANCIAL TRANSACTIONS, NET” 9,229 -5,989 15,218 …
2003Transactions
securities currency otherA.1 Revaluations 751 2,521A.2 Write-downs 6,882 592B. Other gains and losses 8,009 3,124 2,298Total 1,878 3,124 4,2271. Government securities 3,4032. Certificates of indebtedness 3,7873. Shares and other equity securities -1,7354. Derivatives on securities as underlying -3577
2002Transactions
securities currency otherA.1 Revaluations 370 1,660A.2 Write-downs 18,939 4,793B. Other gains and losses 25,195 1,759 -11,241Total 6,626 1,759 -14,3741. Government securities 8,0712. Certificates of indebtedness 9,6153. Shares and other equity securities -11,8204. Derivatives on securities as underlying 760
The positive variation in comparison to 2002 refers to the items “other operations” for 18,601 thousand (increasedprofits of 13,539 thousand, reduced writedowns of 4,201 thousand, increased revaluation of 861 thousand) and“currency transactions” for 1,365 thousand; the item “securities transactions” evidences, instead, a negativevariation of 4,748 thousand (reduced profits of 17,186 thousand, reduced writedowns of 12,057 thousand andincreased revaluations of 381 thousand).
RevaluationsWrite-downs
Other gains and losses
Total
1. Securities transactions 751 6,882 8,009 1,878 Government securities - 580 3,985 3,405 Certificates of indebtedness 516 3,325 6,597 3,788 Shares and other equity securities 235 2,755 785 -1,735 Securities purchases and sales to be settled - 3 - -3 Derivatives on securities as underlying - 219 -3,358 -3,5772. Currency transactions - 2 3,126 3,124 Exchange-rate gains - - 1,927 1,927 Currency derivatives - 2 363 361 Forward currency transactions - - 836 8363. Other transactions 2,521 592 2,298 4,227 Interest rates derivatives 2,424 536 2,067 3,955 Derivatives hedging credit risk 97 56 231 272 Total 3,272 7,476 13,433 9,229
Gains on securities refer to own shares for 2,277 thousand euros.Further details of gains and losses stemming from derivatives contracts recorded or not in the income statement aregiven in the Board of Directors' Report and at section 10.5 of the explanatory notes.

146
SECTION 4
ADMINISTRATIVE COSTS
Change2003 2002 absolute %
4.1 AVERAGE NUMBER OF EMPLOYEES, BY GRADE 3,631 3,506 125 3.6(a) executives 43 41 2 4.9(b) middle management (3rd & 4th levels) 297 281 16 5.7(c) other employees 3,291 3,184 107 3.4
The average for the year includes 371 employees transferred to the Bank as a result of branch purchase fromGruppo Capitalia.
Change2003 2002 absolute %
NUMBER OF OPERATING BRANCHES 393 391 2 0.5
Change2003 2002 absolute %
CAPTION 80 A"PERSONNEL" 234,968 199,388 35,580 17.8– wages and salaries 153,683 138,176 15,507 11.2– social security costs 42,896 38,267 4,629 12.1– termination indemnities 9,258 8,608 650 7.6– pensions and similar commitments 17,764 5,247 12,517 238.6– others 11,367 9,090 2,277 25.0
The increase in personnel costs is related to the branches purchased from Gruppo Capitalia.

147
Change2002 2001 absolute %
CAPTION 80 B"OTHER ADMINISTRATIVE COSTS" 131,744 122,433 9,311 7.6Postage and telephone 12,869 12,851 18 0.1Maintenance of tangible and intangible fixed-assets 11,783 10,418 1,365 13.1Professional fees 8,937 7,343 1,594 21.7Advertising, promotion and publishing 6,675 6,608 67 1.0Rental expenses 10,701 8,838 1,863 21.1Donations 3,767 3,883 -116 -3.0Other banking services 4,546 4,153 393 9.5Office cleaning 3,544 4,169 -625 -15.0Lighting and heating 4,114 3,558 556 15.6EDP processing with third parties 5,310 4,411 899 20.4Travelling and transport 3,650 3,902 -252 -6.5Printing and stationery 2,566 3,235 -669 -20.7Software maintenance 5,259 4,017 1,242 30.9Hardware leasing charges 3,205 3,031 174 5.7Banking premises security services 3,177 3,299 -122 -3.7Insurance premiums 2,165 2,423 -258 -10.6Association fees 598 745 -147 -19.7Indirect taxes 26,437 24,011 2,426 10.1– stamp duty and stock exchange contracts 20,050 18,345 1,705 9.3– ”imposta sostitutiva” Presidential Decree 601/73 3,240 2,604 636 24.4– ICI (Municipal real estate tax) 1,307 1,222 85 7.0– local council taxes 1,457 1,434 23 1.6– taxes paid abroad 248 293 -45 -15.4– INVIM (tax on increased value on properties) 32 34 -2 -5.9– penalties for late tax rolls 39 31 8 25.8– other indirect taxes 64 48 16 33.3Others 12,441 11,538 903 7.8
Item “other” includes the cost of assets of a unit value not exceeding 516 euros (Lit. 1,000,000) purchased duringthe year for a total price of 1,786 thousand euros (2002: 1,784 thousand euros).
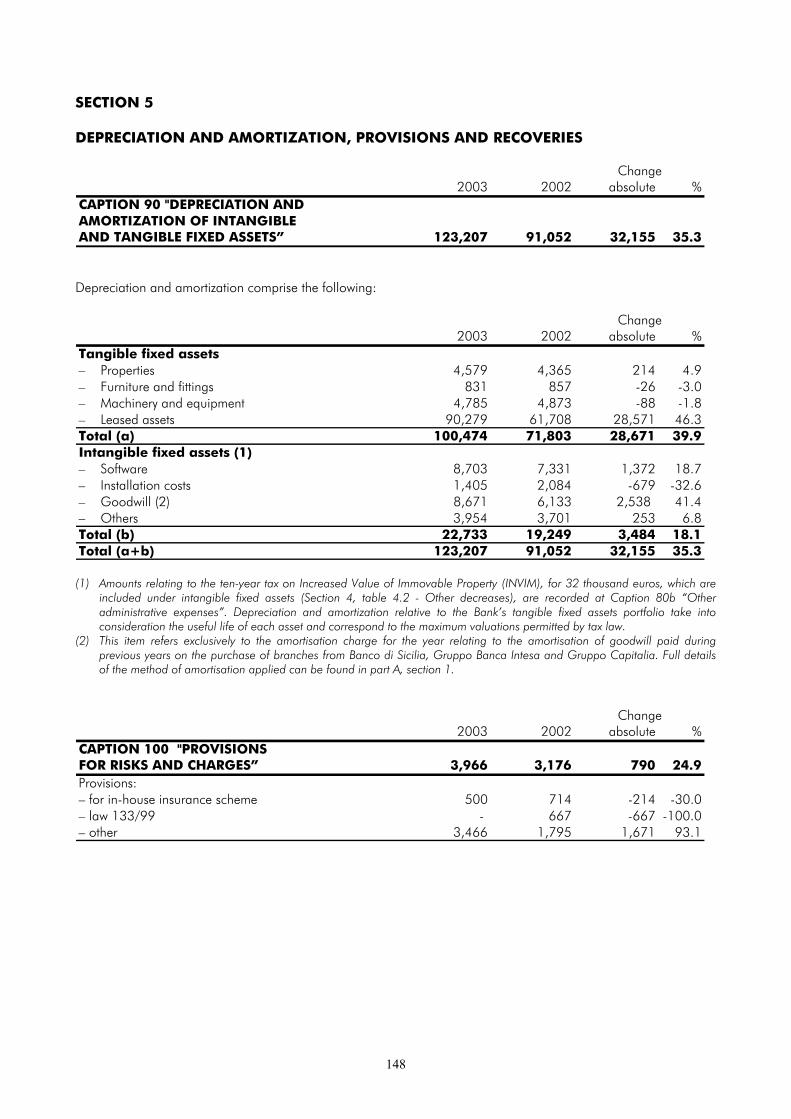
148
SECTION 5
DEPRECIATION AND AMORTIZATION, PROVISIONS AND RECOVERIES
Change2003 2002 absolute %
CAPTION 90 "DEPRECIATION ANDAMORTIZATION OF INTANGIBLEAND TANGIBLE FIXED ASSETS” 123,207 91,052 32,155 35.3
Depreciation and amortization comprise the following:
Change2003 2002 absolute %
Tangible fixed assets– Properties 4,579 4,365 214 4.9– Furniture and fittings 831 857 -26 -3.0– Machinery and equipment 4,785 4,873 -88 -1.8– Leased assets 90,279 61,708 28,571 46.3Total (a) 100,474 71,803 28,671 39.9Intangible fixed assets (1)– Software 8,703 7,331 1,372 18.7– Installation costs 1,405 2,084 -679 -32.6– Goodwill (2) 8,671 6,133 2,538 41.4– Others 3,954 3,701 253 6.8Total (b) 22,733 19,249 3,484 18.1Total (a+b) 123,207 91,052 32,155 35.3
(1) Amounts relating to the ten-year tax on Increased Value of Immovable Property (INVIM), for 32 thousand euros, which areincluded under intangible fixed assets (Section 4, table 4.2 - Other decreases), are recorded at Caption 80b “Otheradministrative expenses”. Depreciation and amortization relative to the Bank’s tangible fixed assets portfolio take intoconsideration the useful life of each asset and correspond to the maximum valuations permitted by tax law.
(2) This item refers exclusively to the amortisation charge for the year relating to the amortisation of goodwill paid duringprevious years on the purchase of branches from Banco di Sicilia, Gruppo Banca Intesa and Gruppo Capitalia. Full detailsof the method of amortisation applied can be found in part A, section 1.
Change2003 2002 absolute %
CAPTION 100 "PROVISIONSFOR RISKS AND CHARGES” 3,966 3,176 790 24.9Provisions:– for in-house insurance scheme 500 714 -214 -30.0– law 133/99 - 667 -667 -100.0– other 3,466 1,795 1,671 93.1

149
Change2003 2002 absolute %
5.1 CAPTION 120 "PROVISIONS FOR LOAN LOSSES AND FOR GUARANTEES AND COMMITMENTS" 66,781 59,670 7,111 11.9(a) provisions for loan losses 66,510 59,670 6,840 11.5 including: – lump-sum allowances for country risks - - - … – other lump-sum allowances 6,858 5,469 1,389 25.4(b) provisions for guarantees and commitments 271 - 271 … including: – lump-sum allowances for country risks - - - - – other lump-sum allowances - - - -
Item (a) “Allowances for loan losses” includes 12,455 thousand euros which corresponds to a fifth of the lossesstemming from the operation of securitisation carried out at December 2000.
Other provisions for 14,176 thousand euros, which are connected to interest on overdue loans realised during theperiod but retained to be not recoverable, are not recorded in the Income Statement.
Change2003 2002 absolute %
CAPTION 130 "RECOVERIES OF LOANS ANDREVERSALS OF PROVISIONS FORGUARANTEES AND COMMITMENTS" 9,195 9,863 -668 -6.8– bad loans -principal 2,189 2,464 -275 -11.2– watchlists - principal 599 608 -9 -1.5– interest – others 522 - 522 …– interest arrears on loans 790 585 205 35.0– credits written-off 5,087 5,501 -414 -7.5– interest credits related to tax collection services 8 9 -1 -11.1– country risks - 432 -432 …– provision for guarantees and commitments - 264 -264 …
These recoveries are related to previously written down credits for which the reason for writing down ceases, fully orin part, to apply.
Change2003 2002 absolute %
CAPTION 140“ADDITIONAL PROVISIONS FORLOAN LOSSES” 18,000 13,000 5,000 38.5
Change2003 2002 absolute %
CAPTION 150“WRITE-DOWNS TO FINANCIALFIXED ASSETS” - 11 -11 -100.0
Change2003 2002 absolute %
CAPTION 160“RECOVERIES OF FINANCIALFIXED ASSETS” 107 88 19 21.6

150
SECTION 6
OTHER INCOME STATEMENT CAPTIONS
Change2003 2002 absolute %
6.1 CAPTION 70 “OTHER OPERATING INCOME” 160,752 123,889 36,863 29.8Leasing rents 120,950 85,104 35,846 42.1Amounts recovered from third parties 31,516 28,426 3,090 10.9 including: stamp duty recovered 18,657 17,050 1,607 9.4Rental income 2,486 2,535 -49 -1.9Repayments from leased assets 895 1,170 -275 -23.5Gains from transfer and revaluation of leased assets 245 194 51 26.3Premiums received on options 79 - 79 …Others 4,581 6,460 -1,879 -29.1
Change2003 2002 absolute %
6.2 CAPTION 110 “OTHER OPERATING EXPENSES” 7,747 5,800 1,947 33.6Recognised losses on leased assets sold 6,648 3,904 2,744 70.3Leasing charges 848 1,311 -463 -35.3Premiums paid on hedging options 251 200 51 25.5Others - 385 -385 …
Change2003 2002 absolute %
6.3 CAPTION 180 “EXTRAORDINARY INCOME” 30,028 14,559 15,469 106.3Surplus in reserves for taxation 3,028 1,983 1,045 52.7Gains from releases: furniture and premises 682 2,321 -1,639 -70.6Gains from releases: holdings 13,587 2,705 10,882 402.3Gains from sale of activities 2,494 1,824 670 36.7Other 10,237 5,726 4,511 78.8
Change2003 2002 absolute %
6.4 CAPTION 190 “EXTRAORDINARY EXPENSES” 7,021 2,598 4,423 170.2Retirement incentives 3,828 - 3,828 …Losses from releases: holdings - 140 -140 -100.0Losses from releases: furniture 360 106 254 239.6Other 2,833 2,352 481 20.5
Change2003 2002 absolute %
CAPTION 220 “INCOME TAXES” 67,000 78,900 -11,900 -15.1Income taxes of the period 81,956 68,421 13,535 19.8Variation of taxes paid in advance -1,187 2,811 -3,998 …Variations of deferred taxes -13,769 7,668 -21,437 …

151
SECTION 7
OTHER INFORMATION REGARDING THE INCOME STATEMENT
7.1 GEOGRAPHIC DISTRIBUTION OF REVENUES
Banca Carige prevalently works in Italy; the only branch outside Italy was opened in Nice (France) in 1994.
2003
Captions ItalyOther
countriesTotal
10 Interest income and similar revenue 543,391 3,087 546,47830 Dividends and other revenues 63,957 - 63,95740 Commission income 178,675 494 179,16960 Gains from financial transactions, net 9,193 36 9,22970 Other operating income 160,712 40 160,752Total 955,928 3,657 959,585
2002
Captions ItalyOther
countriesTotal
10 Interest income and similar revenue 563,794 3,206 567,00030 Dividends and other revenues 87,245 - 87,24540 Commission income 160,203 507 160,71060 Gains from financial transactions, net -6,000 11 -5,98970 Other operating income 123,865 24 123,889Total 929,107 3,748 932,855

SECTION 1
DIRECTORS AND STATUTORY AUDITORS
31/12/03 31/12/021.1 EMOLUMENTS(a) Directors 2,108 2,300(b) Statutory auditors 190 182
The amounts given refer to emoluments paid to directors and statutory auditors in the carrying out ofthose duties related specifically to Banca Carige, as required by article 78 of CONSOB Regulation n.11971.
31/12/03 31/12/021.2 CREDITS AND GUARANTEES GIVEN(a) Directors
- clean credits 23,638 9,463- guarantees given 3,975 8,760
(b) Statutory auditors- clean credits 355 508- guarantees given - -
At 31/12/2003 credits were used by directors and statutory auditors, personally or by companies inwhich the same declared to have pre-eminent interests, in compliance with art. 136 D.Lgs. 385/93, forthese amounts.
The following table provides information relating to remuneration and benefits paid to Directors,Statutory Auditors and General Managers as required by article 78 of CONSOB Regulation(Deliberation n. 11971 of 14/5/99) enacting Legislative Decree 58/98.The Bank did not allocate any option shares to its Directors or General Manager during the year.
PART DOTHER INFORMATION

153
GROSS SALARIES PAID TO DIRECTORS, STATUTORY AUDITORS AND GENERAL MANAGER(article 78, CONSOB n. 11971)
NAME POSITION SALARY(before tax and social securities payments)
Name / Surname Position held Term ofoffice
Expiry ofappointme
nt
Emoluments forpositions held
in the companypreparing the
accounts
Benefitsin kind Bonuses Others
Giovanni BERNESCHI ChairmanManaging Director
31/3-31/121/1 – 30/3 * 943,750.00 98,631.69 (1)
Alessandro SCAJOLA Deputy Chairman 1/1 – 31/12 * 245,750.00 8,315.07 (2)
Adalberto ALBERICI DirectorExecutive Commitee Member
1/1 – 31/121/1 – 31/12 * 60,550.00 17,544.84 (3)
Piergiorgio ALBERTI Director 1/1 – 31/12 * 43,800.00 6,200.00 (4)
Andrea BALDINI DirectorExecutive Commitee Member
1/1 – 31/121/1 – 31/12 * 59,350.00
Giorgio BINDA Director 1/1 – 31/12 * 45,900.00 8,315.07 (5)
Jean Jacques BONNAUD Director 1/1 – 31/12 * 47,150.00
Luca BONSIGNORE Director 31/3 – 31/12 ** 33,275.00
Mario CAPELLI DirectorExecutive Commitee Member
1/1 – 31/121/1 – 31/12 * 56,775.00
Remo Angelo CHECCONI Director 31/3 – 31/12 ** 32,200.00
Maurizio FAZZARI Director 31/3 – 31/12 ** 35,741.67
Pietro ISNARDI Director 1/1 – 31/12 * 45,700.00
Ferdinando MENCONI Director 1/1 – 31/12 * 45,900.00 576,322.46 (6)
Paolo Cesare ODONE DirectorExecutive Commitee Member
1/1 – 31/121/1 – 31/12 * 54,175.00
Vincenzo ROPPO Director 1/1 – 31/12 * 45,466.67 14,715.07 (7)
Enrico Maria SCERNI DirectorExecutive Commitee Member
1/1 – 31/121/1 – 31/12 * 54,975.00
Francesco TARANTO Director 31/3 – 31/12 ** 33,875.00
Oliviero TAROLLI Director 1/1 – 31/12 * 45,475.00 55,855.77 (8)
Fausto CUOCOLO Chairman 1/1 – 31/3 *** 145,500.00 6,200.00 (9)
Piero Guido ALPA Director 1/1 – 31/3 *** 10,600.00 6,200.00 (10)
Giorgio GIORGETTI Director 1/1 – 31/3 *** 11,600.00 71,110.70 (11)
Dominique MONNERON Director 1/1 – 31/3 *** 11,200.00
Fulvio ROSINA Chairman of Board ofStatutory Auditors 1/1 – 31/12 **** 76,355.00 69,065.47 (12)
Antonio SEMERIA Auditor 1/1 – 31/12 **** 57,570.00 2,809.31 (13)
Andrea TRAVERSO Auditor 1/1 – 31/12 **** 55,695.00 3,813.97 (14)
Alfredo SANGUINETTO General Manager 1/5 – 31/12 ****** 403,765.44 14,585.22 (15)
* Confirmed by the Annual Shareholders meeting of 31/3/03 for three years** Appointed by the Annual Shareholders meeting of 31/3/03 for three years*** Annual Shareholders meeting of 31/3/03**** Appointed by the Annual Shareholders meeting of 29/4/02 for three years***** Appointed by the Board of Directors meeting of 14/4/03 beginning from 1/5/03.

154
(1) of which:• 54,228.00 euros paid to Banca Carige as remuneration for the position of Chairman of Carige
Assicurazioni from 1st January to 31st December;• 1,857.50 euros received from Carige Assicurazioni as non-monetary benefits;• 10,329.12 euros paid to Banca Carige as remuneration for the position of Board Member of Carige Vita
Nuova from 11th January to 31st December;• 1,857.50 euros received from Carige Vita Nuova as non-monetary benefits;• 21,424.50 euros paid to Banca Carige as remuneration for the positions of Board Member and Executive
Committee Member of Cassa di Risparmio di Savona from 1st January to 31st December;• 8,515.07 euros paid to Banca Carige as remuneration for the position of Vice Chairman of Carige Asset
Management SGR held from 7th July to 31st December;• 420.00 euros paid to Banca Carige as remuneration for the position of Vice Chairman of Centro Fiduciario
from 1st January to 31st December.(2) 8,315.07 euros paid to Banca Carige as remuneration for the position of Chairman of Carige Asset
Management SGR from 7th July to 31st December.(3) of which:
• 15,493.72 euros as remuneration for the position of Board Member of Carige Assicurazioni from 1st
January to 31st December;• 2,061.12 euros received from Carige Assicurazioni as non-monetary benefits.
(4) 6,200.00 euros as remuneration for the position of member of the Editorial Committee of a review published byBanca Carige.
(5) 8,315.07 euros as remuneration for the position of Board Member of Carige Asset Management SGR from 7th
July to 31st December.(6) of which:
• 315,684.28 euros as remuneration for the position of CEO of Carige Assicurazioni from 1st January to 31st
December;• 2,496.01 euros received from Carige Assicurazioni as non-monetary benefits;• 255,646.16 euros as remuneration for the position of CEO of Carige Vita Nuova from 1st January to 31st
December;• 2,496.01 euros received from Carige Vita Nuova as non-monetary benefits.
(7) of which:• 8,515.07 euros as remuneration for the position of Board Member of Carige Asset Management SGR from
7th July to 31st December;• 6,200.00 euros as remuneration for the position of member of the Editorial Committee of a review
published by Banca Carige.(8) of which:
• 22,871.20 euros as remuneration for the position of Vice Chairman of Carige Assicurazioni from 1st Januaryto 31st December;
• 1,030.56 euros received from Carige Assicurazioni as non-monetary benefits;• 30,923.45 euros as remuneration for the position of Vice Chairman of Carige Vita Nuova from 1st January
to 9th May;• 1,030.56 euros received from Carige Vita Nuova as non-monetary benefits.
(9) 6,200.00 euros as remuneration for the position of member of the Editorial Committee of a review published byBanca Carige.
(10) 6,200.00 euros as remuneration for the position of member of the Editorial Committee of a review published byBanca Carige.
(11) of which:• 6,641.69 euros as remuneration for the position of Board Member of Banca del Monte di Lucca from 28th
April to 31st December;• 21,295.39 euros as remuneration for the position of Board Member of Cassa di Risparmio di Savona from
1st January to 31st December;• 6,200.00 euros as remuneration for the position of Editor of a review published by Banca Carige;• 10,329.14 euros as remuneration for the position of Board Member of Carige Assicurazioni from 9th May to
31st December;• 2,061.12 euros in non-monetary benefits distributed by Carige Assicurazioni;• 23,552.80 euros in remuneration for the position of Vice Chairman of Carige Vita Nuova held from 9th May
to 31st December;• 1,030.56 euros received from Carige Vita Nuova as non-monetary benefits.
(12) of which:• 5,162.48 euros as remuneration for the position of Statutory Auditor of Ligure Leasing from 1st January to
31st December;• 16,732.60 euros as remuneration for the position of Chairman of the Board of Statutory Auditors of Banca

155
del Monte di Lucca from 1st January to 31st December;• 35,213.21 euros as remuneration for the position of Statutory Auditor of Cassa di Risparmio di Savona from
1st January to 31st December;• 2,609.31 euros as remuneration for the position of Statutory Auditor of Carige Asset Management SGR from
7th July to 31st December;• 2,427.35 euros as remuneration for the position of Chairman of the Board of Statutory Auditors of Galeazzo
Srl from 1st January to 31st December;• 6,920.52 euros as remuneration for the position of Chairman of the Board of Statutory Auditors of
Columbus Carige Immobiliare from 1st January to 31st December.(13) 2,809.31 euros as remuneration for the position of Statutory Auditor of Carige Asset Management SGR from 7th
July to 31st December.(14) 3,813.97 euros as remuneration for the position of Chairman of the Board of Statutory Auditors of Carige Asset
Management SGR from 7th July to 31st December.(15) of which:
• 5,860.15 euros as remuneration for the position of Vice Chairman of Banca del Monte di Lucca from 1st
January to 28th April;• 8,515.07 euros for the position of Board Member of Carige Asset Management SGR from 7th July to 31st
December;• 210.00 euros as remuneration for the position of Board Member of Centro Fiduciario from 1st January to
31st December.

156
SITUATION OF PENSION FUND
CHANGES IN SUPPLEMENTARY PENSION FUND
Pursuant to art. 9 of the fund regulation, approved on 23rd January 1992, the following are beneficiariesof the Supplementary Pension Fund:- all staff employed by Cassa di Risparmio di Genova ed Imperia in service at 30th November 1991
and transferred to Banca Carige SpA on 1st December 1991, excluding temporarily employed staff.Staff taken on from 1st December 1991 onwards are beneficiaries of a timed fixed-payment covernot related to the Fund;
- the staff of Istituto di Credito Fondiario della Liguria SpA who were on duty on 31st December 1991;- the staff of Mediocredito Ligure SpA who were on duty on 31st December 1991.
31/12/03 31/12/02Opening balances 287,888 297,736Closing balances 289,632 287,888Net changes of the year 1,744 - 9,848
Incomes related to assets captions 13,794 1,764Employees' contributions 418 498Pension paid 12,443 12,056Voluntary state pension fund payment 25 54
The Supplementary Pension Fund is an in-house reserve without corporate identity recorded in theDirectory of Pension Funds, 3rd special section, no. 9,004 since 14/10/99(1).
The closing balance of the fund – 289,632 thousand euros – corresponds to actuarial calculations onthe basis of cover capital criteria for amounts sufficient to guarantee requiriments as foreseen by thePension Fund regulations for those eligible.
The actuary’s evaluation is made annually and for future requirements an interest rate of 3.75% wasapplied.
(1) The Fund is not structured on the basis of individual accounts. Its position in the accounts guarantees theobligation on the part of the Bank to maintain the Fund’s resources at a level that enables it to satisfy the aimsprescribed in its regulations. Consequently, provisions to the Fund are considered as a guarantee for futurecommitments.The Fund is based on the principle of mutual solidarity. For instance, in the case of disability, retirement payments willbe made on the basis of a period of service longer than that effectively worked.The Fund has the following characteristics:- the retributive potential of provisions made to the Fund is ignored;- provisions made by the Bank are not subject to distrainment on the part of creditors of fund members in
service or in retirement;- in the case of termination of employment prior to qualifying for retirement pay from the Fund, ex-employees
are entitled exclusively to reimbursement of amounts paid into the Fund plus accrued interest.Such characteristics have been confirmed also by jurisdiction.

157
The Fund, in line with the provisions of the Pension Fund regulations, was created by regular provisionsand presents the following composition:
31/12/03 31/12/02- Bonds 207,952 219,278- Shares and quotes - - - Holdings 35,000 35,000- Tangible fixed assets (1) 21,780 22,747- Cash 24,900 10,863Total 289,632 287,888
(1) Balance sheet value

158
SECTION 2
PARENT COMPANY OR EU LENDING INSTITUTION AS HOLDING
2.1 NAMEBANCA CARIGE SpA - Cassa di Risparmio di Genova e Imperia
2.2 LOCATION AND REGISTERED OFFICES
Genova, Via Cassa di Risparmio n. 15.
Registered at the Genoa List of Companies no. 03285880104.Chamber of Commerce (C.C.I.A.) of Genoa registration no. 331717.
Banca Carige is recorded in the register of banks (no. 6175/4) and it belongs, as parent company, toBanca Carige Group, recorded in the special register pursuant to Decree no. 356/90.
The Board of Directors
Genoa, 22nd March 2004

159
PROPOSED RESOLUTION

160
To the Shareholders of Banca Carige,
We submit for your approval the Annual Report for 2003 made up by balance sheet, profit and lossaccount, explanatory notes and attachments supplemented by the reports of the Board of Directors,Statutory Auditors and External Auditors.
We propose1) the approval of the financial statements for 2003 (balance sheet, profit and loss account,
explanatory notes, Board of Directors' report) and the net profit of 106,199,426.63 euros;
2) the distribution of 106,339,724.04, being the sum of net profit stated at point 1) and the total of thedividends on own shares reserve (140,297.41 euros), as follows:
- Legal reserve euro 10,619,942.66- Reserve pursuant to Legislative decree 124/93 euro 65,197.73- Extraordinary taxed reserve euro 12,092,466.77- Total dividends payable to the holders of 959,897,518 ordinary shares (dividend per share of € 0.0723) euro 69,400,590.55- Total dividends payable to the holders of 153,429,321 saving shares (dividend per share of € 0.0923) euro 14,161,526.33
Dividends shall be payable from 6th May 2004 (ex-dividend date: 3rd May 2004) with payment takingplace via the centralised management system of financial instruments as per Borsa Italiana SpA'srecommendation for listed companies;
3) the destining of dividends on the Bank's own shares in portfolio to the specific reserve.
If approved, Banca Carige’s net equity after allocation of profit would amount to 1,628,667 thousand.
Genoa, 22nd March 2004 The Board of Directors
ADOPTION OF ANNUAL REPORTAND ALLOCATION OF NET PROFIT

161
REPORT OF THE BOARDOF STATUTORY AUDITORS
162
STATUTORY AUDITORS’ REPORT TO THE SHAREHOLDERS’ MEETING,in accordance with article 153 of Legislative Decree 58/98
and article 2429 section 3 of the Italian Civil Code
To the shareholders of Banca Carige SpA,
During the business year ending 31/12/2003 we carried out those supervisory dutiesforeseen by law in accordance with the Code of Best Practice recommended by the ItalianCouncil of Chartered Accountants.In particular we took part in the meetings of both the parent company’s Board of Directorsand Executive Committee and received on a quarterly basis (in accordance with article 150of Legislative Decree 55/98 and article 20 of the Bank’s By-Laws) information concerning theactivities of the Bank in addition to significant economic and financial transactions carried outby the Bank and/or its subsidiaries.During the year the Board of Directors met 19 times, the Executive Committee 44 and thisBoard of Statutory Auditors met 51 times. The Internal Control Committee met 6 times.
***
The following economic and financial operations of significance took place during the year:
A. in July 2003, Carige Asset Management SGR SpA was established with an initial sharecapital of 5,200,000 euros. Banca Carige has a 99.5% holding in the company,whilst the remaining 0.5% is held by Carige Vita Nuova SpA. Authorisation tocommence business was received from the Bank of Italy in January 2004;
B. during July 2003, Banca Carige signed a preliminary contract for the purchasetogether with Cassa di Risparmio (C.R.) di Firenze of the entire share capital ofCarinord 2, parent company of Cassa di Risparmio di Carrara SpA and Cassa diRisparmio di Spezia, from Banca Intesa SpA, and the Foundations of C.R Carrara andC.R. Firenze. The objective of the transaction, which received Bank of Italyauthorisation in December 2003 and was completed in January 2004, was for BancaCarige to achieve direct control over C.R. Carrara (holding of 90%) via the break upof Carinord 2 and the subsequent incorporation of C.R. Carrara into the BancaCarige Group. The simplification in the ownership structure of C.R. Carrara resultingfrom the operation is in line with Bank of Italy indications.
C. in December 2003 Banca Carige completed a share capital increase and convertiblebond issue as deliberated by the Extraordinary Meeting of Banca Carige shareholdersof 10th September 2003. The Meeting had approved attributing the Banca CarigeBoard the right to propose raising fresh equity over the next 5 years in several tranchesvia the issue under option to shareholders of ordinary/convertible shares in addition toconvertible bonds up to a maximum of 250 million euros.In detail, the issue is as follows:
163
• fresh equity of 92,777,225 euros was raised via the issue of 92,777,225shares, of which 79,991,450 in the form of ordinary shares, and 12,785,777in convertible shares, of a nominal value of 1 euro each. Issue premium pershare is 1.20 euros.
• a subordinated loan issue “Banca Carige 1.5% 2003-2013 hybridsubordinated loan issue with a premium on reimbursement convertible intoordinary shares.” The issue is in the form of 40,821,979 convertible bonds ofa unitary nominal value of 2.50 euros.
Full details of the transactions and the intended destination of funds raised were madeavailable to investors prior to subscription as required by law. Market response wasextremely positive and the issue was fully subscribed without recourse to placementservices.On completion of the transaction, Banca Carige’s share capital at 31/12/03amounted to 1,113,326,839 euros in the form of 1,113,326,839 ordinary shares ofnominal value of 1 euro each.
D. following the raise in share capital carried out by Carige Assicurazioni SpA, BancaCarige subscribed 17,022 new shares in 2003 with a nominal value of 982 euros inaddition to a premium of 193 euros. The total investment amounted to 20,000,850euros.The increase of Carige Assicurazioni’s share capital of 42.3 million euros asdeliberated, with subscription and payment in two tranches was performed incompliance with indications made by the competent authority for the Italianinsurance industry, ISVAP. After inspections, the regulator identified inadequacies inthe subsidiary’s solvency margin and technical reserves. It should, however, bepointed out that the strengthening of Carige Assicurazioni’s asset structure is part ofwide-ranging measures that Banca Carige has identified as necessary for therestructuring of the company. The parent company has been particularly active inachieving governance improvements also by means of specific changes to CarigeAssicurazioni’s by-laws. The Bank, furthermore, has selected an external consultant towork directly with ISVAP in realising the authority’s recommendations. In the courseof writing this Report, we were informed that the solutions proposed by CarigeAssicurazioni in response to ISVAP’s findings, though receiving approval on the partof the company’s auditors, were judged by ISVAP as unsatisfactory and as suchrequire further review in the light of the regulator’s observations.
In the course of our supervisory duties, to the best of our knowledge we were aware of:
- no transactions deliberated or carried out in breach of the law, the Bank’s articles ofassociation, or the regulations of competent supervisory authorities;
- no actions which could be deemed imprudent, irresponsible or representing a conflictof interest or in contrast with the decisions taken by the Shareholders’ Meeting, orwhich could in any way damage the financial solidity of the Bank.
We found no evidence of transactions, either infra-Group or others, which could be classifiedas unusual or atypical.
The Board of Directors’ Report states adequately that dealings with its subsidiaries andassociated undertakings are these connected to the normal activity of the Bank and areregulated by market conditions. With regards to these dealings, we can confirm that this is the

164
case and that they are carried out in the interest of your company and regulatedeconomically by market conditions.
Within the scope of this Board’s competence, we monitored the adequacy of the Bank’sorganisational structure, and the respect of the codes of best practice concerning itsadministration by means of relevant documentation provided by the Bank’s senior officers inaddition to meetings with the external auditors. In the light of the information in ourpossession we can confirm the adequacy of the Bank’s operating structure in addition to therespect of best practice standards.
We evaluated and monitored the adequacy of the Bank’s systems of internal control andadministration/accounting. With regards to the latter, information was collected from seniorofficers in the form of company documents and audit analyses in order to verify that such asystem was suitably equipped to give a true and fair picture of the Bank’s affairs.
In particular, throughout the year we controlled the Bank’s internal monitoring of all its riskprofiles and can confirm the Bank’s position throughout the year within the limits of allindicators fixed by the Bank of Italy and the Interbank Deposit Protection Fund - FITD.
With regards to internal control systems we can confirm that a specific internal auditing unit isin place, in possession of the Bank of Italy’s regulatory instructions and with full access to theBank’s activities. This body is outside the line of command foreseen by the Bank’sorganisational structure and offers General Management (with regards to which it functionsas a staff position) details of its activities on a systematic basis. It also reports to the Board ofDirectors (on a monthly basis), this Board of Statutory Auditors (every two months), and to themeetings of the Internal Control Committee.
We believe this internal control system is equipped to offer efficient and effectivemanagement of the risks underlying the Bank’s activities.
The methods of assessment and evaluation of these systems is subject to regular review bythose officers of the Bank responsible for Organisation and Internal Control. Suggestions forpossible improvements are communicated to the Board of Directors and the Board ofStatutory Auditors.
The Internal Control Committee is informed of any changes in self-assessment procedures.
This Board of Statutory Auditors can confirm that any organisational and operationaldecisions susceptible to influencing the Bank’s risk profiles are promptly and fully analysed byofficers responsible for the Bank’s Internal Control.
It is our opinion also that the Bank’s administrative-accounting systems are adequate inguaranteeing a clear and fair picture of the Bank’s activities.
During the year the Board received two reports pursuant to article 2408 Italian Civil Codefrom one shareholder in possession of 100 shares. A further communication was receivedfrom the same shareholder in January 2004. We examined the matter, though not requiredby law to do so (article 128 of the Consolidated Finance Law), and concluded that thecharges made were unfounded.

165
We can confirm that as at 31st December 2003 the parent company, Banca Carige SpA,communicated adequate and complete instructions to its subsidiaries pursuant to article 114,section 2, Legislative decree 58/98.
It is our opinion that Banca Carige SpA, the parent company of the Banca Carige Group,communicated adequate and complete instructions to its subsidiaries as foreseen by theConsolidated Banking Law and the regulatory indications issued by the Bank of Italy. Similarinstructions were also supplied to the insurance companies of the Group.
***In accordance with the above-mentioned Legislative decree 58/98, the audit firm Deloitte &Touche SpA during the year examined the accounts of the Bank on a regular basis andreviewed the contents of the directors’ report at 31st December 2003 for consistency with thefinancial statements and conformity with current accounting criteria.
During the course of the year Banca Carige SpA assigned Deloitte & Touche SpA a further 3auditing duties for a total of 155,000 thousand euros. These further duties appear fullyjustified in the light of the Bank’s needs as does the remuneration agreed.
The Board of Statutory Auditors expressed its opinion on matters within its terms of referencein the form foreseen by current legislation.
In accordance with article 159, Legislative decree 58/98, during the year and immediatelysubsequent to 31/12/03 regular meetings were held between this Board and the auditorsDeloitte & Touche SpA for the reciprocal exchange of information. During these meetings nofacts worthy of censure or further investigation came to our notice.
***As a result of this Board’s direct examination of the statements and in cooperation with theauditors, we also can confirm that the financial statements have been prepared inaccordance with the requirements governing financial statements.
In particular:
• the structure of the financial statements and the accounting principles applied thereinare in accordance with those required by legislation and are appropriate for thenature of the Bank’s activities;
• balance sheet and income statement figures are expressed exclusively in euro;• the financial statements prepared are consistent with the results and information in this
Board’s possession acquired both during its meetings with the Bank’s Board ofDirectors and in the course of its inspections;
• the explanatory notes contain additional information concerning significant eventsaffecting the banking industry, as requested by CONSOB in its communicationnumber 1011405 of 15th February 2001;
• In the same explanatory notes the directors of the Bank illustrate the securitisation ofcredits without recourse (Law 130/99) and the state of the transactions as at31/12/03:

166
The first on 21st December 2001 (with effect 31/12/00) was related to ITL566.4 bn classified as bad loans at 30th November 2000, with either full orpartial voluntary or legally-enforced guarantees. Securitisation determined areduction in the value of the credits transferred of ITL 120.6 bn. In accordancewith the opportunities offered by article 6 of Law 130/99 this amount wasrecorded at caption 130 ‘Share premium reserve’ and will be amortised on astraight-line basis in five years from the year the reduction originated (2000);
Banca Carige performs the role of servicer on behalf of the SPV Argo Finance,which has purchased the credits. The total proceeds from the sale of theportfolio amounts to 89.6 million, of which 27.7 million was received during2003.Thanks to this positive performance, the class A securities were fully reimbursed(40 million) as was part of the class B securities for a total of 20.9 million.During the first quarter of 2004, further reimbursements of the class B issueAmounted to 12.9 million;
On 21st December 2001 (with effect 31/12/01) a second securitisationoperation was performed regarding the transfer of performing mortgagedloans with a nominal value of ITL 990.4 bn for a total price of ITL 1,037 bn.This price was the sum of the following two components:- the nominal value of the credits transferred of ITL 990.4 bn;- a deferred price of ITL 46.6 bn calculated via the application of a profitextraction which recognised the increased spread of the mortgages after takinginto consideration transaction costs, risks associated to the underlyingmortgages, and the risk of early repayment of the mortgages. The price wasactualised by using market rates as at 31/12/02 in the light of the length of theoperation, which during 2003 proceeded according to schedule;
Banca Carige performed the role of servicer in the securitisation of bad loanscarried out by Cassa di Risparmio di Savona, as foreseen by Law 130/99, withthe special purpose vehicle Priamar Finance S.r.l. During 2003, the operationproceeded according to schedule.
• the Directors’ report was prepared in accordance with relevant legislation and itscontents are consistent with the financial statements it accompanies.
***
During 2003 and pursuant to the Bank of Italy’s communication of 12th June 2001 andCONSOB’s communication no. 95001286, subsequently amended in its letter dated15/6/01, the Bank sold part of its investment securities portfolio in the light of liquidityrequirements following recent expansion of its operational capacities. The sale of thesecurities for 61.4 million produced a capital gain of 2.5 million recorded at profit and lossitem no. 180 ‘extraordinary revenues’.
***
The Board of Directors of Banca Carige in its meeting of 23rd September 2002 deliberatedthe Bank’s adherence to the Code of Self-Regulation of Listed Companies as prepared by theCorporate Governance Committee of Borsa Italiana SpA in July 2002.

167
During the writing of this report, the Bank’s auditors, Deloitte & Touche SpA, informed us thattheir report will declare that these financial statements are clearly stated and give a true andfair view of the financial position and results of Banca Carige SpA.
We can confirm that during our inspections we were aware of no facts and/or activitiesrequiring the intervention of regulatory bodies or mention in this report. Moreover, we havereceived no such indication either from the Bank’s auditors or from the statutory auditors ofthe Group subsidiaries.
***
Accordingly, we release our Report on the financial statements of Banca Carige as at and forthe year ended 31/12/2003 and approve the distribution of net profit proposed therein.
Genoa, 9th April 2004 The Board of Statutory Auditors

168
REPORT OF THEINDEPENDENT AUDITORS


170
ATTACHMENTS

171
(thousands of euros)
Capitalstock
Additional paid-in capital
Legal reserve
Reserve (art. 55 decree
917/86)
Taxed extraordinary
reserve
Revaluation reserve
Reserve for incorporation
Shareholders' equity at 31/12/2002 1,020,550 136,095 56,869 131 25,309 7,956 12,341Allocation of 2002 net income - reserves 10,482 19,087 - dividends paidAllocation to reserve for dividends on own sharesReserves for general bankingAdditional paid-in capital 118,928Capital stock 92,777Taxed extraordinary reserveReserve for the purchase of treasury stock disposable
Riserve for the purchase of stockNet income 2003Shareholders' equity at 31/12/2003 1,113,327 255,023 67,351 131 44,396 7,956 12,341
STATEMENT OF CHANGESIN STOCKHOLDERS’ EQUITY

172
Reserve D.Lgs
21/4/93 n. 124
Reserve for the purchase of
treasury stock disposable
Reserve for the purchase of
stock
Merger reserve Reserve D.Lgs
17/5/99 n. 153
Reserves for general
banking risks
Reserves fordividends
own share
Net income Total
- 65,381 11,619 16,589 11,718 5,165 - 104,818 1,474,541
56 - 29,625 - - 75,193 - 75,193
140 140- 5,165 - 5,165
118,92892,777
-
11,619 11,619
- 11,619 - 11,619106,199 106,199
56 77,000 - 16,589 11,718 - 140 106,199 1,712,227

173
STATEMENT OF CASH FLOW
2002 2003
FUNDS GENERATED BY OPERATIONS (A) 461,215 476,306
Distributable net income for the year 104,818 106,199
Adjustment to: 197,431 215,176 - tangible fixed assets 71,803 100,474 - intangible fixed assets 19,249 22,733 - financial fixed assets 11 - - trading securities 18,939 6,882 - loan and advances to credit institutions 14,303 297 - loan and advances to customers 73,126 84,790
Provisions for: 158,966 154,931 - reserves for loan losses and leasing transactions 13,029 20,440 - termination indemnities 19,668 11,431 - pensions and similar commitments 2,262 14,212 - taxation 104,303 89,830 - other assets 19,704 19,018
USE OF FUNDS GENERATED BY OPERATIONS (B) 293,102 310,420
Use for: - taxation 92,938 88,002 - termination indemnities 5,795 18,069 - pensions and similar commitments 12,110 12,468 - loan losses 87,528 77,755 - reserves for loan losses 5,165 13,000 - revaluations on holdings - 107 - reserves for general banking risks - 5,165 - other assets 15,780 20,801 - dividends paid 73,786 75,053
CASH FLOW (A-B) 168,113 165,886
INCREASE IN FUNDS TAKEN AND DECREASE IN FUNDS APPLIED (C) 1,847,945 1,561,056
Increase in: 1,500,132 1,122,154 - amount owed to credit institutions 145,351 - - amount owed to customers 1,049,194 45,640 - debts evidenced by certificates 87,663 743,568 - funds managed on behalf of third parties 12 58 - other liabilities 198,404 - - accrued expenses and deferred income 12,378 19,128 - subordinated loans - 102,055 - capital stock 3,040 92,777 - additional paid-in capital 4,090 118,928
Decrease in: 347,813 438,902 - cash in hand, balances with central banks and post offices - 5,333 - securities 332,057 - - loans and advances to credit institutions - 421,950 - own shares 10,219 11,619 - accrued income and prepaid expenses 5,537 -
INCREASE IN FUNDS APPLIED AND DECREASES IN FUNDS TAKEN (D) 2,016,058 1,726,942
- Increase in: 2,016,058 835,451 - cash in hand, balances with central banks and post offices 8,767 - - securities - 51,211 - loans and advances to credit institutions 240,916 - - loans and advances to customers 927,442 543,254 - financial fixed assets 19,717 9,411 - tangible fixed assets 309,752 155,553 - intangible fixed assets 142,084 16,130 - own shares - - - other assets 367,380 41,883 - accrued income and prepaid expenses - 18,009
Decrease in: - 891,491 - amount owed to credit institutions - 657,716 - other liabilities - 233,775
TOTAL OF FUNDS GENERATED AND TAKEN (A+C) 2,309,160 2,037,362
TOTAL OF FUNDS APPLIED (B+D) 2,309,160 2,037,362
Thousands of euros.

174
(thousands of euros )
Goods value Opening balance Increases Decreases Closing balances Market valueHoldings Book value 16,696 - 6,033 10,663 11,975
Fiscal value 11,983 - 5,688 6,295 11,975Securities Book value 6,007 18 1,594 4,431 1,626
Fiscal value 5,809 18 1,541 4,286 1,626Properties Book value 248,539 - 453 248,086 985
Fiscal value 90,679 - 39 90,640 985Total Book value 271,242 18 8,080 263,180 14,586
Fiscal value 108,471 18 7,268 101,221 14,586
STATEMENT IN ACCORDANCE WITHART. 7, C. 2 OF LAW 218/90 (ABSTRACT)

175
(euro)
Location Area m2 Cost price Revaluation Revaluated Depreciation Balance cost fund at sheet value
(1) 31/12/03
Productive
Head office Via Cassa di Risparmio 15 Genova 21278 7,650,177.43 44,104,275.84 51,754,453.27 14,279,888.93 37,474,564.34 Upgrading " " " " 122,536.00 - 122,536.00 3,676.08 118,859.92 Web Point Via Cassa di Risparmio 12 Genova 28 136,824.47 - 136,824.47 9,743.34 127,081.13 Banca continua Via XXV Aprile 10/12 r. Genova 204 48,524.31 678,761.22 727,285.53 13,586.81 713,698.72 Other head office Vico Monte di Pietà 4 Genova 1942 25,822.84 2,991,641.15 3,017,463.99 25,822.84 2,991,641.15 buildings Piazza dei Garibaldi 29 r. Genova 34 3,098.74 59,451.94 62,550.68 3,098.74 59,451.94
Via D. Chiossone 7 - fondi Genova 427 2,582.28 226,860.15 229,442.43 2,582.28 226,860.15 Via D. Chiossone 12 Genova 3655 168,623.18 4,444,695.86 4,613,319.04 168,623.18 4,444,695.86 Vico Monte di Pietà 6/8 r. Genova 126 68,688.77 97,304.35 165,993.12 68,688.77 97,304.35 Vico Monte di Pietà 10 r. Genova 50 - 59,909.00 59,909.00 - 59,909.00 Via D. Chiossone 7/6 Genova 93 - 38,734.27 38,734.27 - 38,734.27 Via D. Chiossone 10 Genova 2475 49,776.89 271,359.63 321,136.52 49,776.89 271,359.63 Piazza dei Garibaldi 33 r. Genova 45 7,230.40 58,734.06 65,964.46 7,230.40 58,734.06 Piazza dei Garibaldi 31 r. Genova 37 39,813.95 48,661.56 88,475.51 39,813.95 48,661.56 Via G. D'Annunzio Torri E e F Genova 7396 15,722,082.69 10,502,339.28 26,224,421.97 14,667,315.18 11,557,106.79 Via G. D'Annunzio Torri E e F 2° p. Genova " 1,104,680.65 580,313.04 1,684,993.69 562,299.32 1,122,694.37
Upgrading " " " " 21,083.25 - 21,083.25 632.50 20,450.75 Warehouse Via Emilia 48 C E r. Genova 3653 556,274.87 977,992.85 1,534,267.72 556,274.87 977,992.85
Via Emilia 48 D r. Genova " 242,337.57 426,056.29 668,393.86 239,914.20 428,479.66 Via G. D'Annunzio "A" (q.9,40) Genova 27 18,325.44 24,161.19 42,486.63 18,142.18 24,344.45 Via G. D'Annunzio "B" (q.10,75) Genova 50 27,302.49 41,475.51 68,778.00 27,029.46 41,748.54 Via G. D'Annunzio "B" (q.10,75) Genova 176 48,051.15 64,734.05 112,785.20 47,570.63 65,214.57 Via G. D'Annunzio "C" (q.14,95) Genova 275 161,375.74 213,609.69 374,985.43 159,761.98 215,223.45
Car parking Corso Sardegna Genova 18 7,488.63 34,935.08 42,423.71 7,488.63 34,935.08 Warehouse Via Arrivabene 39 r. Genova 1536 64,857.44 811,203.63 876,061.07 62,911.70 813,149.37 Car parking areas Via G. D'Annunzio - 66 posti auto Genova 1080 772,671.29 749,381.35 1,522,052.64 760,767.46 761,285.18 Archivie Via Pelio 6 Genova 4760 878,428.99 2,559,088.93 3,437,517.92 1,522,692.34 1,914,825.58 Archivie Via Pelio 6 Genova " 107,681.26 109,759.98 217,441.24 48,456.57 168,984.67 Archivie Via Pelio 6 Genova " 119,732.25 148,972.77 268,705.02 53,879.52 214,825.50 Upgrading " " " " 38,500.00 - 38,500.00 1,155.00 37,345.00 Archivie Via Monticelli 13/2 Genova 50 10,344.12 51,630.71 61,974.83 10,344.12 51,630.71 Employess club Via XX Settembre 41 6° piano Genova 830 293,458.08 764,308.90 1,057,766.98 55,149.33 1,002,617.65 Genoa branch no.87 Via Pisa 58 Genova 1185 219,627.00 1,575,193.54 1,794,820.54 13,177.62 1,781,642.92 Upgrading " " " 450,715.85 - 450,715.85 13,521.48 437,194.37 Genoa branch no.41 Via G. D'Annunzio 25-29c-39-41-63-73-81 Genova 1700 1,173,775.44 3,775,717.00 4,949,492.44 2,473,727.36 2,475,765.08 E.A.D. Via Isonzo 21 Genova 8520 1,728,259.06 12,757,061.39 14,485,320.45 1,711,422.23 12,773,898.22 Upgrading " " " " 55,260.00 - 55,260.00 1,657.80 53,602.20 Genoa branch no.39 Piazza delle Americhe 1 Genova 2680 6,094,413.47 1,728,123.68 7,822,537.15 2,698,355.02 5,124,182.13 Main office Milan Piazza Pattari 5-7 Milano 1970 2,157,550.34 5,324,742.43 7,482,292.77 2,157,550.34 5,324,742.43 Main office Milan Piazza Pattari 5-7 2° p. Milano " 823,025.71 2,031,192.44 2,854,218.15 790,104.68 2,064,113.47 Main office Milan Piazza Pattari 5-7 3° p. Milano " 1,434,749.97 488,485.59 1,923,235.56 493,771.23 1,429,464.33 Main office Turin Corso Matteotti 13 Torino 1146 722,628.97 1,457,699.60 2,180,328.57 330,378.66 1,849,949.91 Main office Turin Via Parini 13 Torino 300 110,780.00 69,179.40 179,959.40 63,214.33 116,745.07 Upgrading " " " 169,570.00 - 169,570.00 5,087.10 164,482.90 Genoa branch no.1 Via Cesarea 60 r. Genova 536 71,843.29 1,347,820.30 1,419,663.59 71,843.29 1,347,820.30 Genoa branch no.2 Via B. Buozzi 57- 58 rr. Genova 187 60,941.91 329,130.23 390,072.14 60,941.91 329,130.23 Genoa branch no.2 Piazza Dinegro 2-3-4 rr. Genova 70 116,202.80 - 116,202.80 34,860.83 81,341.97 Genoa branch no.3 Via G. Torti 80 r. Genova 498 2,166.54 10,942.07 13,108.61 2,166.54 10,942.07 Genoa branch no.3 Via G. Torti 24 Genova " 187,525.50 947,095.54 1,134,621.04 187,525.50 947,095.54 Genoa branch no.4 Via Lagustena 40/48 Genova 465 852,153.88 572,725.47 1,424,879.35 544,078.98 880,800.37 Genoa branch no.5 Via Monticelli 70 r. Genova 1035 47,596.25 76,397.84 123,994.09 47,596.25 76,397.84 Genoa branch no.5 Via Monticelli Genova " 645,571.12 1,036,220.95 1,681,792.07 639,115.41 1,042,676.66 Genoa branch no.6 Piazza Dante 30 r. Genova 330 54,024.28 838,298.55 892,322.83 54,024.28 838,298.55 Genoa branch no.6 Via Fieschi 47 r. Genova " 32,868.97 510,030.08 542,899.05 32,868.97 510,030.08 Genoa branch no.7 Via della Liberta' 68-70-72-74-74A-78 rr. Genova 340 16,844.80 174,800.79 191,645.59 16,844.80 174,800.79 Genoa branch no.7 Via L. Pareto 6/8 Genova " 30,987.41 321,560.64 352,548.05 30,987.41 321,560.64 Genoa branch no.8 Piazza S. Sabina 6 Genova 872 376,497.08 1,234,495.96 1,610,993.04 376,497.08 1,234,495.96 Genoa branch no.9 Corso Sardegna 94 r. Genova 340 2,737.22 13,894.40 16,631.62 2,737.22 13,894.40 Genoa branch no.9 Corso Sardegna 90 r. Genova " 645.57 3,276.98 3,922.55 645.57 3,276.98 Genoa branch no.9 Corso Sardegna 96 r. p.t. Genova " 28,405.13 144,187.16 172,592.29 28,405.13 144,187.16 Genoa branch no.9 Corso Sardegna 44/1 Genova " 120,921.00 613,806.58 734,727.58 120,921.00 613,806.58 Genoa branch no.9 Corso Sardegna 98 r. Genova " 219,492.45 - 219,492.45 26,586.07 192,906.38 Genoa branch no.10 Via S. Vincenzo 26 Genova 760 333,878.87 884,182.95 1,218,061.82 333,878.87 884,182.95 Genoa branch no.10 Via Galata 51 A r. Genova " 25,822.84 68,384.44 94,207.28 25,822.84 68,384.44 Genoa branch no.11 Via Piacenza 94 E Genova 391 384,132.89 464,849.72 848,982.61 384,132.89 464,849.72
PROPERTIES(excluding leased fixed assets)

176
Location Area m2 Cost price Revaluation Revaluated Depreciation Balancecost fund at sheet value
(1) 31/12/03
Genoa branch no.11 Via Piacenza 179 G Genova " 8,556.54 10,354.50 18,911.04 4,877.23 14,033.81 Genoa branch no.13 Via XII Ottobre 7 r. Genova 536 42,607.69 1,629,850.82 1,672,458.51 42,607.69 1,629,850.82 Upgrading " " " " 87,407.13 - 87,407.13 2,622.21 84,784.92 Genoa branch no.14 Piazza Manin 2/1 Genova 321 5,866.57 296,689.91 302,556.48 5,866.57 296,689.91 Genoa branch no.14 Piazza Manin 2/1 Genova " 3,520.12 178,022.93 181,543.05 3,520.12 178,022.93 Genoa branch no.15 Via Napoli 40 r. Genova 180 14,338.39 236,488.17 250,826.56 14,338.39 236,488.17 Genoa branch no.16 Viale des Geneys 2/1 - 2/A/B/C/D/E Genova 423 387,342.67 469,265.65 856,608.32 383,469.25 473,139.07 Genoa branch no.17 Via Posalunga 11 r. Genova 585 3,859.64 35,292.99 39,152.63 1,505.26 37,647.37 Genoa branch no.17 Via Timavo 96 - 104 r. Genova " 18,092.03 165,435.47 183,527.50 7,055.89 176,471.61 Genoa branch no.17 Via Posalunga 5 r. Genova " 7,165.32 101,054.69 108,220.01 7,165.32 101,054.69 Genoa branch no.17 Via Timavo 86-94 Genova " 21,538.14 303,758.79 325,296.93 20,891.99 304,404.94 Genoa branch no.17 Via Posalunga 7-9 r. Genova " 9,019.08 127,198.75 136,217.83 8,432.83 127,785.00 Genoa branch no.18 Via Corsica 13-19 r. Genova 802 65,168.73 668,212.88 733,381.61 65,168.73 668,212.88 Genoa branch no.19 Via Quinto 38 r. Genova 123 43,898.84 270,823.54 314,722.38 43,898.84 270,823.54 Genoa branch no.20 Via Avio 2 r. Genova 765 211,756.62 1,136,575.64 1,348,332.26 197,992.45 1,150,339.81 Genoa branch no.20 Via Pesce - Via Mamiani 3 Genova 319 154,141.73 325,884.43 480,026.16 103,274.64 376,751.52 Genoa branch no.21 Via Sestri 114 r. Genova 787 225,776.28 1,621.16 227,397.44 27,195.49 200,201.95 Genoa branch no.21 Via Sestri 24/1 r. Genova " 18.90 290.47 309.37 7.66 301.71 Genoa branch no.21 Via Donizetti 46/46A/46B/48 Genova " 77,468.53 1,190,462.05 1,267,930.58 77,468.53 1,190,462.05 Genoa branch no.21 Via Donizetti 8 A/3 - 8 A/4 Genova " 10,277.49 157,934.63 168,212.12 10,277.49 157,934.63 Genoa branch no.21 Via Donizetti 8 A/1 - 8 A/2 Genova " 10,277.49 157,934.63 168,212.12 10,277.49 157,934.63 Genoa branch no.21 Via Donizetti 8 A - 46 - 48 Genova " 25,822.84 396,820.68 422,643.52 25,822.84 396,820.68 Genoa branch no.21 Via Donizetti 50 r. Genova " 6,507.36 99,998.81 106,506.17 3,172.34 103,333.83 Genoa branch no.21 Via Donizetti 52 r. Genova " 6,507.36 71,530.57 78,037.93 2,602.95 75,434.98 Genoa branch no.21 Piazza Rosolino Pilo 1 Genova 15 57,275.30 4,183.07 61,458.37 17,844.18 43,614.19 Genoa branch no.22 Piazza Sebastiano Gaggero 9 r. Genova 730 265,321.90 925,257.98 1,190,579.88 222,721.10 967,858.78 Genoa branch no.22 Via Don G. Verità 28 r. Genova " 1,084.56 4,416.00 5,500.56 1,084.56 4,416.00 Genoa branch no.22 Via Don G. Verità 6/2 Genova " 261.20 1,063.52 1,324.72 133.22 1,191.50 Genoa branch no.23 Via Pastorino 26 - Via Custo 22 r. Genova 831 617,474.01 909,206.15 1,526,680.16 617,474.01 909,206.15 Genoa branch no.23 Via G.B. Custo 18 - 20 r. Genova 142 87,797.67 129,278.61 217,076.28 86,919.70 130,156.58 Genoa branch no.24 Via F. del Canto 4 A Genova 424 5,342.75 408,245.81 413,588.56 5,342.75 408,245.81 Genoa branch no.25 Via G. Jori 22 A - B Genova 337 11,580.63 297,377.50 308,958.13 10,827.89 298,130.24 Genoa branch no.25 Via G. Jori 22/1 Genova " 4,131.66 106,096.22 110,227.88 4,131.66 106,096.22 Genoa branch no.26 Via Martiri della Libertà 3 A Genova 490 37,410.53 193,343.55 230,754.08 37,410.53 193,343.55 Genoa branch no.26 Via Garelli 11 r. Genova " 61,968.89 320,265.04 382,233.93 59,490.14 322,743.79 Genoa branch no.26 Via Garelli 5 - 7 - 9 r. Genova " 274,256.92 - 274,256.92 106,960.21 167,296.71 Genoa branch no.26 Via Martiri della Libertà 7-9 Genova " 251,101.34 7,127.11 258,228.45 75,330.40 182,898.05 Genoa branch no.27 Via Oberdan 120 A Genova 243 3,098.74 544,921.42 548,020.16 3,098.74 544,921.42 Genoa branch no.28 Via Molassana 70 r. - Via S. D'Acquisto Genova 512 6,197.48 408,119.74 414,317.22 6,197.48 408,119.74 Genoa branch no.29 Via C. Rolando 56 E r. Genova 346 36,537.57 143,645.99 180,183.56 36,537.57 143,645.99 Genoa branch no.29 Via C. Abba 43 - 45 r. Genova " 61,974.83 243,651.55 305,626.38 61,974.83 243,651.55 Genoa branch no.30 Via S. G. D'Acri 6 r. Genova 304 890.89 22,887.36 23,778.25 890.89 22,887.36 Genoa branch no.30 Via S. G. D'Acri 4 r. Genova " 2,919.53 75,004.20 77,923.73 2,831.95 75,091.78 Genoa branch no.30 Via S. G. D'Acri 12 r. Genova " 9,253.87 237,736.64 246,990.51 8,652.38 238,338.13 Genoa branch no.30 Via S. G. D'Acri 4-1 Genova 382,406.74 - 382,406.74 70,167.01 312,239.73 Genoa branch no.31 Via Pra 140 A/R Genova 287 7,230.40 118,036.61 125,267.01 7,230.40 118,036.61 Genoa branch no.31 Via Venezian 1 Genova " 11,341.39 185,148.85 196,490.24 11,341.39 185,148.85 Genoa branch no.32 Piazza Banchi 2 r Genova 210 7,746.85 147,216.76 154,963.61 7,746.85 147,216.76 Genoa branch no.32 Via S. Luca 2 Genova 10 5,164.57 98,144.50 103,309.07 2,169.12 101,139.95 Genoa branch no.34 Via Struppa 146 C e via Buscaglia 18 r Genova 331 220,306.78 285,234.11 505,540.89 220,306.78 285,234.11 Genoa branch no.47 Via di Francia 3 r. Genova 770 2,324,056.05 - 2,324,056.05 1,043,681.92 1,280,374.13 Genoa branch no.55 Via del Capriolo 1 - 3 rr. Genova 106 213,038.47 - 213,038.47 83,085.00 129,953.47 Genoa branch no.60 Piazza Leopardi 2 Genova 426 963,192.12 - 963,192.12 375,644.92 587,547.20 Branch Recco Via IV Novembre 2r - P.za N.da Recco27/2 Recco 512 2,065.83 55,114.34 57,180.17 2,065.83 55,114.34 Branch Recco P.za N. da Recco 24 Recco " 77,468.53 826,715.15 904,183.68 37,029.96 867,153.72 Branch S.Margherita L. Via XXV Aprile 6/1 S.Margherita L. 137 1,446.08 10,089.04 11,535.12 1,446.08 10,089.04 Branch S.Margherita L. Largo Giusti 17 S.Margherita L. 311 178,114.96 792,710.67 970,825.63 142,272.60 828,553.03 Branch Chiavari Piazza Roma 34 r. - Piazza Roma 10/1 Chiavari 1540 12,214.21 75,851.11 88,065.32 12,214.21 75,851.11 Branch Chiavari Corso Dante p.t. Chiavari " 463,651.72 976,189.33 1,439,841.05 253,787.83 1,186,053.22 Branch Chiavari Corso Dante 16/4 Chiavari " 157,002.90 846,710.05 1,003,712.95 59,123.99 944,588.96 Upgrading " " " " 14,901.23 - 14,901.23 447.04 14,454.19 Branch Sestri L. Corso Colombo 19 r. Sestri Levante 311 56,985.50 671,323.26 728,308.76 56,985.50 671,323.26 Branch Rapallo Via Giustiniani 9 Rapallo 496 18,979.79 258,780.44 277,760.23 18,979.79 258,780.44 Branch Rapallo Galleria Raggio 2D e 3D Rapallo " 4,080.01 55,628.99 59,709.00 4,080.01 55,628.99 Branch Rapallo Via Matteotti 7/3 Rapallo " 6,135.77 83,658.26 89,794.03 6,135.77 83,658.26 Branch Rapallo Via Giustiniani 7 Rapallo " 54,227.97 739,372.67 793,600.64 54,227.97 739,372.67

177
Location Area m2 Cost price Revaluation Revaluated Depreciation Balance cost fund at sheet value
(1) 31/12/03
Branch Rapallo Galleria Raggio 4/D Rapallo " 15,449.55 210,647.27 226,096.82 15,449.55 210,647.27 Rapallo branch no.1 Via del Pozzo 24 Rapallo 151 193,154.88 240,619.85 433,774.73 193,154.88 240,619.85 Branch Lavagna Piazza della Libertà 40/2 Lavagna 106 204,516.93 76,833.29 281,350.22 85,897.12 195,453.10 Branch La Spezia Corso Nazionale 252 La Spezia 2141 4,399,246.47 2,190,810.17 6,590,056.64 2,381,917.53 4,208,139.11 La Spezia Branch Ag.2 Corso Cavour 154 La Spezia 153 499,894.13 - 499,894.13 179,876.51 320,017.62 La Spezia Branch Ag.2 Via Monale 76 La Spezia 140 107,939.49 - 107,939.49 32,381.84 75,557.65 Branch Rezzoaglio Via Roma 12 Rezzoaglio 399 233,866.14 416,009.34 649,875.48 233,866.14 416,009.34 Branch Montoggio Via Roma 89 Montoggio 234 2,065.83 170,126.07 172,191.90 2,065.83 170,126.07 Branch Torriglia Via Matteotti 48 r. Torriglia 120 1,084.56 18,261.95 19,346.51 1,084.56 18,261.95 Branch Torriglia Via Molinetto 7 Torriglia " 6,960.94 117,209.20 124,170.14 6,960.94 117,209.20 Branch Campoligure P.za Martiri della Benedicta 2 Campoligure 254 1,910.89 6,545.20 8,456.09 1,910.89 6,545.20 Branch Campoligure Via Trento 2 Campoligure " 62,511.94 214,116.41 276,628.35 62,511.94 214,116.41 Branch Campoligure Via Trento 6 Campoligure 57 38,062.87 38,907.67 76,970.54 36,540.37 40,430.17 Branch Arenzano Via Pallavicini 25 Arenzano 419 2,114.34 47,631.15 49,745.49 2,114.34 47,631.15 Branch Arenzano Via Pallavicini 29 Arenzano " 27,555.41 620,758.11 648,313.52 25,764.30 622,549.22 Branch Ronco Scrivia Corso Italia 29 Ronco Scrivia 562 294,380.43 308,208.57 602,589.00 294,380.73 308,208.27 Branch Cogoleto Piazza Giusti 1 Cogoleto 564 356,013.90 440,736.83 796,750.73 349,812.11 446,938.62 Branch Cogoleto Piazza Giusti 1 Cogoleto " 41,833.01 46,733.92 88,566.93 36,327.58 52,239.35 Branch Isola Cantone Via Roma 118 r. Isola Cantone 261 1,239.50 11,340.98 12,580.48 1,239.50 11,340.98 Branch Isola Cantone Via Roma 182 1^ p. Isola Cantone " 20,658.28 189,016.40 209,674.68 20,658.28 189,016.40 Branch Camogli Piazza Schiaffino 9 Camogli 225 31,585.92 340,596.66 372,182.58 5,532.30 366,650.28 Branch Rossiglione Via Roma 10 Rossiglione 203 774.69 170,316.51 171,091.20 774.69 170,316.51 Branch Masone Via Veneto 6 Masone 188 4,352.18 41,523.26 45,875.44 4,352.18 41,523.26 Branch Masone Via Roma 27 Masone " 19,936.27 190,207.79 210,144.06 19,936.27 190,207.79 Branch Casella Viale Mandelli Casella 189 169,493.74 234,771.90 404,265.64 23,217.54 381,048.10 Branch Savignone Via Giovanni XXIII 1 Savignone 130 83,149.56 60,262.77 143,412.33 39,911.80 103,500.53 Branch Sori Via Garibaldi 6 B - C Sori 249 15,638.06 219,607.85 235,245.91 15,638.06 219,607.85 Branch Sori Via Garibaldi 6 D Sori " 3,360.33 47,189.63 50,549.96 3,360.33 47,189.63 Upgrading " " " " 15,325.62 - 15,325.62 459.77 14,865.85 Branch Moconesi Viale De Gasperi 19 Moconesi 175 16,720.29 191,214.47 207,934.76 15,633.48 192,301.28 Branch Moconesi Viale De Gasperi 19 Moconesi " 517.25 5,915.30 6,432.55 465.53 5,967.02 Branch Pedemonte Via Medicina p.t. 104 Serra Ricco' 293 24,789.93 238,002.64 262,792.57 24,789.93 238,002.64 Branch Pedemonte Via Medicina p.fondi 104 Serra Ricco' " 6,713.94 64,459.05 71,172.99 6,713.94 64,459.05 Branch S.Olcese Via Poire'43 S.Olcese di M. 309 18,912.16 187,014.16 205,926.32 17,682.85 188,243.47 Branch S.Olcese Via Poire'69 S.Olcese di M. " 10,788.87 106,686.44 117,475.31 9,709.99 107,765.32 Branch Casarza L. Via IV Novembre 28 B Casarza L. 308 36,132.71 270,069.62 306,202.33 36,132.71 270,069.62 Branch S.Colombano C. Via D.Cuneo 163/C - D - E S.Colombano C. 221 44,080.22 163,098.13 207,178.35 44,080.22 163,098.13 Branch S.Colombano C. Via D.Cuneo 163/C - D - E S.Colombano C. " 9,211.10 34,081.36 43,292.46 9,211.10 34,081.36 Upgrading " " " " 13,251.60 - 13,251.60 397.55 12,854.05 Branch Campomorone Via De Gasperi 60 - 62 - 64 - 70 Campomorone 408 284,128.76 388,415.94 672,544.70 284,128.76 388,415.94 Branch Alassio Via Mazzini 2 Alassio 683 160,342.57 1,284,853.94 1,445,196.51 149,920.30 1,295,276.21 Branch Alassio Via Mazzini 2 Alassio " 133.32 1,068.34 1,201.66 119.99 1,081.67 Branch Alassio Via Dante 114/1 Alassio " 1,084.56 8,690.77 9,775.33 1,084.56 8,690.77 Branch Leca d'Albenga Piazza del Popolo 13 Leca d'Albenga 206 212,780.24 - 212,780.24 82,984.30 129,795.94 Branch Toirano Via Braida 21 - 23 - 27 Toirano 135 29,954.50 102,694.70 132,649.20 29,954.50 102,694.70 Branch Toirano Via Braida 21 - 23 - 27 Toirano " 7,883.71 27,028.18 34,911.89 7,883.71 27,028.18 Branch Finale Ligure Via Garibaldi 1 - Via Roma 12/1 Finale L. 315 516.46 579,388.46 579,904.92 516.46 579,388.46 Branch Varazze Piazza Dante 6 Varazze 280 3,098.74 476,749.11 479,847.85 3,098.74 476,749.11 Branch Cairo M. Via F.lli Francia 3 Cairo M. 225 131,696.51 54,741.83 186,438.34 57,033.62 129,404.72 Branch Loano Corso Roma 198 Loano 130 2,014.18 170,133.68 172,147.86 2,014.18 170,133.68 Branch Loano main office Via Stella (Pal. Sirena) Loano 404 179,935.19 536,026.84 715,962.03 79,603.19 636,358.84 Branch Pietra L. P.zza Martiri Libertà 10 ) Pietra L. 610 - - - - - Branch Pietra L. Via Vinzone 1/1^-2^p. ) Pietra L. 3,873.43 913,000.93 916,874.36 3,873.43 913,000.93 Branch Pietra L. Via Vinzone 1/3^p. Pietra L. " 460.94 108,647.11 109,108.05 262.74 108,845.31 Branch Pietra L. Lev. Corso Italia 15 Pietra L. 99 10,595.63 167,755.38 178,351.01 10,595.63 167,755.38 Main office Imperia Via Berio 14 r. Imperia 1634 14,615.73 126,338.83 140,954.56 14,615.73 126,338.83 Main office Imperia Via Berio 4/1 e 4/2 Imperia " 8,947.62 77,343.47 86,291.09 8,947.62 77,343.47 Main office Imperia Via Berio 4 Imperia " 13,849.24 119,713.27 133,562.51 13,433.77 120,128.74 Main office Imperia Via Berio 10/5 Imperia " 3,492.53 30,189.53 33,682.06 3,387.76 30,294.30 Main office Imperia Via Berio 10/8 Imperia " 100,606.32 869,644.17 970,250.49 100,606.32 869,644.17 Main office Imperia Via Berio 6 Imperia " 35,635.53 308,034.60 343,670.13 35,635.53 308,034.60 Main office Imperia Via Berio 10/6 Imperia " 189,540.26 777,698.07 967,238.33 99,400.85 867,837.48 Branch Sanremo Corso Mombello 25,25 A,27,29 Sanremo 1605 1,140,794.80 2,440,000.62 3,580,795.42 1,125,393.87 2,455,401.55 Branch Bordighera Corso V.Emanuele 153/155 r. Bordighera 810 356,163.84 902,925.21 1,259,089.05 155,040.00 1,104,049.05 Branch Pieve di Teco Via Eula 33 Pieve di Teco 246 8,661.41 200,814.18 209,475.59 8,098.42 201,377.17 Upgrading " " " " 30,000.00 - 30,000.00 900.00 29,100.00 Branch Arma di Taggia Via Blengino 19 Arma di Taggia 236 63,559.42 654,551.45 718,110.87 59,428.05 658,682.82
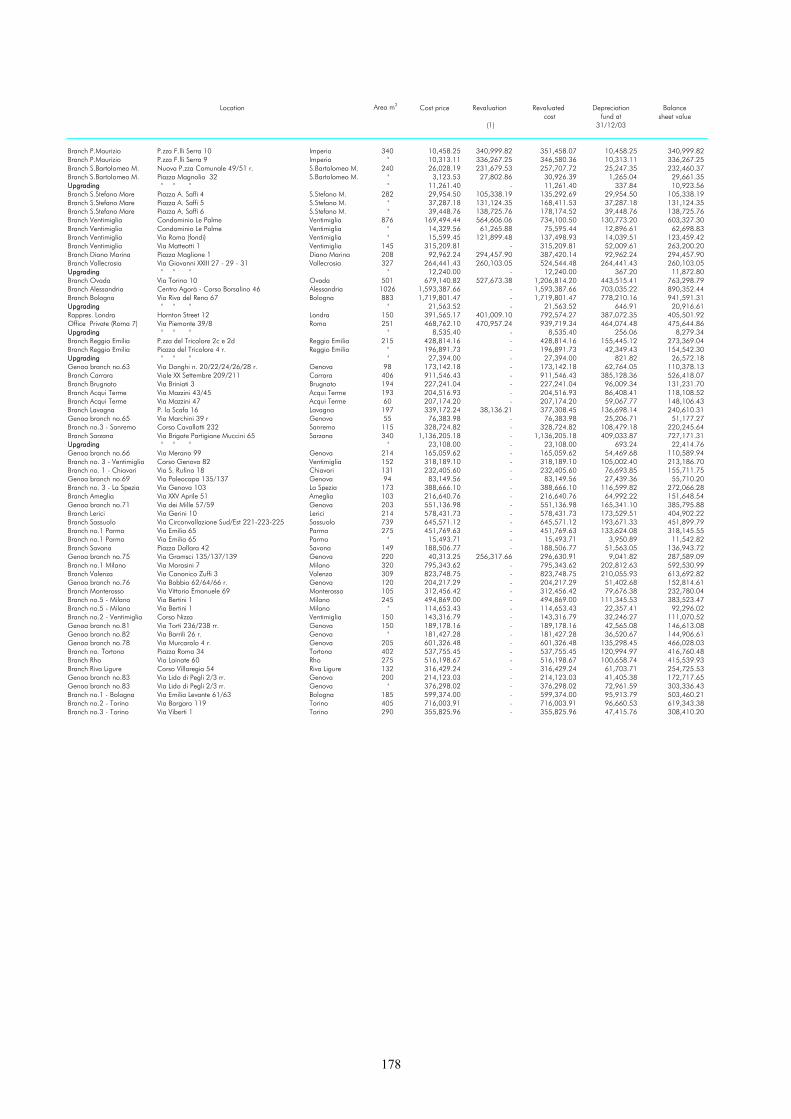
178
Location Area m2 Cost price Revaluation Revaluated Depreciation Balancecost fund at sheet value
(1) 31/12/03
Branch P.Maurizio P.zza F.lli Serra 10 Imperia 340 10,458.25 340,999.82 351,458.07 10,458.25 340,999.82 Branch P.Maurizio P.zza F.lli Serra 9 Imperia " 10,313.11 336,267.25 346,580.36 10,313.11 336,267.25 Branch S.Bartolomeo M. Nuova P.zza Comunale 49/51 r. S.Bartolomeo M. 240 26,028.19 231,679.53 257,707.72 25,247.35 232,460.37 Branch S.Bartolomeo M. Piazza Magnolia 32 S.Bartolomeo M. " 3,123.53 27,802.86 30,926.39 1,265.04 29,661.35 Upgrading " " " " 11,261.40 - 11,261.40 337.84 10,923.56 Branch S.Stefano Mare Piazza A. Saffi 4 S.Stefano M. 282 29,954.50 105,338.19 135,292.69 29,954.50 105,338.19 Branch S.Stefano Mare Piazza A. Saffi 5 S.Stefano M. " 37,287.18 131,124.35 168,411.53 37,287.18 131,124.35 Branch S.Stefano Mare Piazza A. Saffi 6 S.Stefano M. " 39,448.76 138,725.76 178,174.52 39,448.76 138,725.76 Branch Ventimiglia Condominio Le Palme Ventimiglia 876 169,494.44 564,606.06 734,100.50 130,773.20 603,327.30 Branch Ventimiglia Condominio Le Palme Ventimiglia " 14,329.56 61,265.88 75,595.44 12,896.61 62,698.83 Branch Ventimiglia Via Roma (fondi) Ventimiglia " 15,599.45 121,899.48 137,498.93 14,039.51 123,459.42 Branch Ventimiglia Via Matteotti 1 Ventimiglia 145 315,209.81 - 315,209.81 52,009.61 263,200.20 Branch Diano Marina Piazza Maglione 1 Diano Marina 208 92,962.24 294,457.90 387,420.14 92,962.24 294,457.90 Branch Vallecrosia Via Giovanni XXIII 27 - 29 - 31 Vallecrosia 327 264,441.43 260,103.05 524,544.48 264,441.43 260,103.05 Upgrading " " " " 12,240.00 - 12,240.00 367.20 11,872.80 Branch Ovada Via Torino 10 Ovada 501 679,140.82 527,673.38 1,206,814.20 443,515.41 763,298.79 Branch Alessandria Centro Agorà - Corso Borsalino 46 Alessandria 1026 1,593,387.66 - 1,593,387.66 703,035.22 890,352.44 Branch Bologna Via Riva del Reno 67 Bologna 883 1,719,801.47 - 1,719,801.47 778,210.16 941,591.31 Upgrading " " " " 21,563.52 - 21,563.52 646.91 20,916.61 Rappres. Londra Hornton Street 12 Londra 150 391,565.17 401,009.10 792,574.27 387,072.35 405,501.92 Office Private (Roma 7) Via Piemonte 39/8 Roma 251 468,762.10 470,957.24 939,719.34 464,074.48 475,644.86 Upgrading " " " " 8,535.40 - 8,535.40 256.06 8,279.34 Branch Reggio Emilia P.zza del Tricolore 2c e 2d Reggio Emilia 215 428,814.16 - 428,814.16 155,445.12 273,369.04 Branch Reggio Emilia Piazza del Tricolore 4 r. Reggio Emilia " 196,891.73 - 196,891.73 42,349.43 154,542.30 Upgrading " " " " 27,394.00 - 27,394.00 821.82 26,572.18 Genoa branch no.63 Via Donghi n. 20/22/24/26/28 r. Genova 98 173,142.18 - 173,142.18 62,764.05 110,378.13 Branch Carrara Viale XX Settembre 209/211 Carrara 406 911,546.43 - 911,546.43 385,128.36 526,418.07 Branch Brugnato Via Briniati 3 Brugnato 194 227,241.04 - 227,241.04 96,009.34 131,231.70 Branch Acqui Terme Via Mazzini 43/45 Acqui Terme 193 204,516.93 - 204,516.93 86,408.41 118,108.52 Branch Acqui Terme Via Mazzini 47 Acqui Terme 60 207,174.20 - 207,174.20 59,067.77 148,106.43 Branch Lavagna P. la Scafa 16 Lavagna 197 339,172.24 38,136.21 377,308.45 136,698.14 240,610.31 Genoa branch no.65 Via Marchini 39 r Genova 55 76,383.98 - 76,383.98 25,206.71 51,177.27 Branch no.3 - Sanremo Corso Cavallotti 232 Sanremo 115 328,724.82 - 328,724.82 108,479.18 220,245.64 Branch Sarzana Via Brigate Partigiane Muccini 65 Sarzana 340 1,136,205.18 - 1,136,205.18 409,033.87 727,171.31 Upgrading " " " " 23,108.00 - 23,108.00 693.24 22,414.76 Genoa branch no.66 Via Merano 99 Genova 214 165,059.62 - 165,059.62 54,469.68 110,589.94 Branch no. 3 - Ventimiglia Corso Genova 82 Ventimiglia 152 318,189.10 - 318,189.10 105,002.40 213,186.70 Branch no. 1 - Chiavari Via S. Rufino 18 Chiavari 131 232,405.60 - 232,405.60 76,693.85 155,711.75 Genoa branch no.69 Via Paleocapa 135/137 Genova 94 83,149.56 - 83,149.56 27,439.36 55,710.20 Branch no. 3 - La Spezia Via Genova 103 La Spezia 173 388,666.10 - 388,666.10 116,599.82 272,066.28 Branch Ameglia Via XXV Aprile 51 Ameglia 103 216,640.76 - 216,640.76 64,992.22 151,648.54 Genoa branch no.71 Via dei Mille 57/59 Genova 203 551,136.98 - 551,136.98 165,341.10 385,795.88 Branch Lerici Via Gerini 10 Lerici 214 578,431.73 - 578,431.73 173,529.51 404,902.22 Branch Sassuolo Via Circonvallazione Sud/Est 221-223-225 Sassuolo 739 645,571.12 - 645,571.12 193,671.33 451,899.79 Branch no.1 Parma Via Emilia 65 Parma 275 451,769.63 - 451,769.63 133,624.08 318,145.55 Branch no.1 Parma Via Emilia 65 Parma " 15,493.71 - 15,493.71 3,950.89 11,542.82 Branch Savona Piazza Dallara 42 Savona 149 188,506.77 - 188,506.77 51,563.05 136,943.72 Genoa branch no.75 Via Gramsci 135/137/139 Genova 220 40,313.25 256,317.66 296,630.91 9,041.82 287,589.09 Branch no.1 Milano Via Morosini 7 Milano 320 795,343.62 - 795,343.62 202,812.63 592,530.99 Branch Valenza Via Canonico Zuffi 3 Valenza 309 823,748.75 - 823,748.75 210,055.93 613,692.82 Genoa branch no.76 Via Bobbio 62/64/66 r. Genova 120 204,217.29 - 204,217.29 51,402.68 152,814.61 Branch Monterosso Via Vittorio Emanuele 69 Monterosso 105 312,456.42 - 312,456.42 79,676.38 232,780.04 Branch no.5 - Milano Via Bertini 1 Milano 245 494,869.00 - 494,869.00 111,345.53 383,523.47 Branch no.5 - Milano Via Bertini 1 Milano " 114,653.43 - 114,653.43 22,357.41 92,296.02 Branch no.2 - Ventimiglia Corso Nizza Ventimiglia 150 143,316.79 - 143,316.79 32,246.27 111,070.52 Genoa branch no.81 Via Torti 236/238 rr. Genova 150 189,178.16 - 189,178.16 42,565.08 146,613.08 Genoa branch no.82 Via Barrili 26 r. Genova " 181,427.28 - 181,427.28 36,520.67 144,906.61 Genoa branch no.78 Via Murcarolo 4 r. Genova 205 601,326.48 - 601,326.48 135,298.45 466,028.03 Branch no. Tortona Piazza Roma 34 Tortona 402 537,755.45 - 537,755.45 120,994.97 416,760.48 Branch Rho Via Lainate 60 Rho 275 516,198.67 - 516,198.67 100,658.74 415,539.93 Branch Riva Ligure Corso Villaregia 54 Riva Ligure 132 316,429.24 - 316,429.24 61,703.71 254,725.53 Genoa branch no.83 Via Lido di Pegli 2/3 rr. Genova 200 214,123.03 - 214,123.03 41,405.38 172,717.65 Genoa branch no.83 Via Lido di Pegli 2/3 rr. Genova " 376,298.02 - 376,298.02 72,961.59 303,336.43 Branch no.1 - Bologna Via Emilia Levante 61/63 Bologna 185 599,374.00 - 599,374.00 95,913.79 503,460.21 Branch no.2 - Torino Via Borgaro 119 Torino 405 716,003.91 - 716,003.91 96,660.53 619,343.38 Branch no.3 - Torino Via Viberti 1 Torino 290 355,825.96 - 355,825.96 47,415.76 308,410.20

179
Location Area m2 Cost price Revaluation Revaluated Depreciation Balance cost fund at sheet value
(1) 31/12/03
Genoa branch no.85 Via Teglia 23/25/27 rr Genova 170 346,213.17 - 346,213.17 36,352.39 309,860.78 Branch no.7 - Milano Via Rembrandt Milano 332 973,239.40 - 973,239.40 102,190.13 871,049.27 Branch no.1 - Palermo Via F. Crispi 146 Palermo 303 617,849.98 - 617,849.98 45,972.13 571,877.85 Upgrading " " " " 83,520.00 - 83,520.00 2,505.60 81,014.40 Branch no.7 - Palermo Via Castelforte 5 Palermo 267 302,127.29 - 302,127.29 22,659.55 279,467.74 Palermo main office Piazza Monte di Pietà 16 - 18 Palermo 2600 2,530,638.81 - 2,530,638.81 37,959.58 2,492,679.23 Branch Lercara Friddi Via V.Emanuele 30 Lercara friddi 431 180,243.46 - 180,243.46 13,518.26 166,725.20 Branch Termini Imerese C.so Umberto e Margherita 85-87-89-91 Termini Imerese 543 561,572.95 - 561,572.95 41,611.66 519,961.29 Branch Leonforte C.so Umberto I 168 Leonforte 305 334,938.35 - 334,938.35 23,357.72 311,580.63 Branch Nicosia Via F.lli Testa 38-40-42 Nicosia 260 269,074.04 - 269,074.04 20,180.55 248,893.49 Other head Via G. D'Annunzio - Lotto "D" Genova 1755 1,757,195.91 811,074.46 2,568,270.37 782,820.09 1,785,450.28 office buildings Via G. D'Annunzio - Lotto "E" Genova 1210 1,637,487.54 773,038.41 2,410,525.95 736,869.40 1,673,656.55
Via G. D'Annunzio - Lotto "F" Genova 80 213,584.88 99,484.23 313,069.11 96,113.20 216,955.91 Via G. D'Annunzio - Lotto "G" Genova 607 1,067,926.48 502,583.82 1,570,510.30 480,566.91 1,089,943.39
Car parking 1-2 B Via D'Annunzio 31 Genova 27 14,460.79 50,288.54 64,749.33 50,977.21 13,772.12 Via D'Annunzio 31 Genova " 212.94 740.50 953.44 744.25 209.19 Via D'Annunzio 23 Genova 2810 4,021,722.18 2,079,683.71 6,101,405.89 5,092,146.31 1,009,259.58 Via D'Annunzio 23 Genova " 3,698,004.03 1,784,792.76 5,482,796.79 4,656,509.61 826,287.18 Via D'Annunzio 23 Genova " 18,477.59 8,007.36 26,484.95 22,284.12 4,200.83 Via D'Annunzio 23 Genova " 457.06 154.80 611.86 508.23 103.63
Garage Via D'Annunzio 23 Genova 52 64,697.07 19,549.75 84,246.82 74,969.83 9,276.99 N. 4 car parking Via D'Annunzio 23 (+ cantina) Genova 67 81,588.32 14,737.22 96,325.54 93,420.80 2,904.74 Garage Via D'Annunzio 23 Genova 27 2,141.71 706.22 2,847.93 2,374.54 473.39
Via D'Annunzio 23 Genova " 9,202.84 3,552.42 12,755.26 10,665.77 2,089.49 N. 2 car parking Via D'Annunzio Genova 25 14,047.63 24,616.07 38,663.70 31,339.06 7,324.64 N. 4 car parking Via D'Annunzio Genova 50 60,873.72 11,995.85 72,869.57 71,888.34 981.23 Branch Corte Brugnatella Via Genova loc. Marsaglia Corte Brugnatella 75 76,693.85 - 76,693.85 5,752.05 70,941.80 Branch Villaguardia Via Varesina 42 Villa Guardia 307 388,092.26 - 388,092.26 29,106.92 358,985.34 Branch Taranto Via Berardi 48/B Taranto 1155 1,046,361.05 - 1,046,361.05 78,477.08 967,883.97 Branch Fidenza Via Tagliasacchi 7-P.za Pezzana Fidenza 421 1,027,427.26 - 1,027,427.26 77,057.05 950,370.21 Branch Alcamo Corso VI Aprile 83-85 - V. F. Gioia Alcamo 230 88,867.27 - 88,867.27 6,665.05 82,202.22 Branch Marsala Via XI Maggio 133-135-137 Marsala 285 161,453.03 - 161,453.03 12,108.98 149,344.05 Branch Vescovato Piazza Roma 28 Vescovato 441 351,831.52 - 351,831.52 26,387.37 325,444.15 Branch Treviglio P.za L.Manara Treviglio 715 619,748.28 - 619,748.28 46,481.12 573,267.16 Main office Perugia Via Sicilia 35 Perugia 2241 2,059,250.69 - 2,059,250.69 30,888.76 2,028,361.93 Branch Treviso Viale N.Bixio 31 Treviso 188,107.31 - 188,107.31 2,821.61 185,285.70 Branch Frosinone Via A.Paleario 3 Frosinone 647,605.37 - 647,605.37 9,714.08 637,891.29 Branch Rieti Via Cintia 65 Rieti 503 1,462,334.70 - 1,462,334.70 21,935.02 1,440,399.68 Branch Sora Via Vittorio Veneto 8 A Sora 1,357,882.10 - 1,357,882.10 20,368.23 1,337,513.87 Branch Catania Piazza del Duomo 5 Catania 783,393.59 - 783,393.59 11,750.90 771,642.69 Branch no.8 - Rome Piazza Risorgimento 56 Roma 1,566,787.18 - 1,566,787.18 23,501.81 1,543,285.37 Branch no.10 - Rome Piazza Vega 34/40 - Ostia Lido Roma 684,163.73 - 684,163.73 10,262.46 673,901.27 Branch no.11 - Rome Via Emanuele Filiberto 180 E Roma 1,775,692.14 - 1,775,692.14 26,635.38 1,749,056.76 Branch no.14 - Rome Via Tiburtina 493 ang. Via Morello Roma 3,316,366.19 - 3,316,366.19 49,745.49 3,266,620.70 Upgrading " " " " 14,303.00 - 14,303.00 214.55 14,088.45 Main office Ancona Corso Garibaldi 13/15 Ancona 3,370,956.00 - 3,370,956.00 50,564.34 3,320,391.66 Branch Sesta Godano Via Sogari 25 Sesta Godano 196,185.00 - 196,185.00 2,942.78 193,242.22 Branch Viterbo Via della Ferrovia 2-4-6 Viterbo 339,443.00 - 339,443.00 5,091.65 334,351.35
Total 127,691,668.75 158,928,450.13 286,620,118.88 79,637,789.85 206,982,329.03
Staff accomodation
Flat Via XX Settembre 20/131 Genova 36 52,929.60 36,323.64 89,253.24 1,455.56 87,797.68 Flat Via XX Settembre 20/132 Genova 36 54,486.72 34,809.34 89,296.06 1,498.39 87,797.67 Flat Via XX Settembre 20/133 Genova 34 59,399.77 30,031.39 89,431.16 1,633.49 87,797.67 Flat Via XX Settembre 20/134 Genova 34 59,399.77 30,031.39 89,431.16 1,633.49 87,797.67 Flat Via XX Settembre 20/136 Genova 35 62,999.99 26,530.18 89,530.17 1,732.50 87,797.67 Flat Via Ceresio 3 int.4/1 Milano 70 62,749.51 25,048.16 87,797.67 87,797.67 Flat Via Ceresio 3 int.5/1 Milano 81 71,529.28 31,762.10 103,291.38 103,291.38 Flat Via Ceresio 3 int.6/1 Milano 71 62,749.51 25,048.16 87,797.67 87,797.67 Flat Via Ceresio 3 int.9/1 Milano 46 45,293.27 32,175.26 77,468.53 77,468.53 Flat Via Ceresio 3 int.9/2 Milano 46 45,293.27 32,175.26 77,468.53 77,468.53 Flat Via Ceresio 3 int.8/3 Milano 48 45,293.27 32,175.26 77,468.53 77,468.53

180
Location Area m2 Cost price Revaluation Revaluated Depreciation Balance cost fund at sheet value
(1) 31/12/03
Flat Via Ceresio 3 int.8/5 Milano 48 45,293.27 32,175.26 77,468.53 77,468.53 Flat Via Ceresio 3 int.9/5 Milano 46 45,293.27 32,175.26 77,468.53 77,468.53 Flat Corso Mombello 25 p.attico/1 S.Remo 45 33,569.70 54,227.97 87,797.67 87,797.67 Flat Corso Mombello 25 p.attico/2 S.Remo 45 33,569.70 54,227.97 87,797.67 87,797.67 Flat Corso Mombello 25 p.attico/3 S.Remo 50 36,151.98 51,645.69 87,797.67 87,797.67 Flat Via Roma 12 a/1 Rezzoaglio 48 36,151.98 5,164.57 41,316.55 41,316.55 Flat Via Roma 12 a/2 Rezzoaglio 73 56,810.26 5,164.57 61,974.83 61,974.83 Flat Via Perletti 9 - 2^ p. Piacenza 117 105,098.98 18,850.68 123,949.66 123,949.66 Flat Via Mezzacosta 1 Bologna 243 602,395.33 - 602,395.33 602,395.33 Flat Corso Matteotti 13 Torino 180 56,810.26 98,126.81 154,937.07 154,937.07 Flat Via XX Settembre 20 139/154 Genova 75 179,727.00 - 179,727.00 179,727.00
Total 1,852,995.69 687,868.92 2,540,864.61 7,953.43 2,532,911.18
Other propertiesa) Supplementary pension found
Shop Via Luccoli 19-21 r. Genova 340 69,721.68 246,253.11 315,974.79 31,374.76 284,600.03 Shop Via XXV Aprile 14-16 r. Genova 150 82,063.83 441,573.65 523,637.48 36,928.71 486,708.77 Flat Via Cassa di Risparmio 4/1 Genova 60 - 56,810.26 56,810.26 - 56,810.26 Flat Via Cassa di Risparmio 4/3 Genova 110 23,120.53 118,345.88 141,466.41 10,404.25 131,062.16 Flat Via Cassa di Risparmio 4/6 Genova 110 - 123,949.66 123,949.66 - 123,949.66 Flat Via Cassa di Risparmio 4/13 Genova 50 - 56,810.26 56,810.26 - 56,810.26 Flat Via Cassa di Risparmio 4/14 Genova 105 25,822.84 157,196.57 183,019.41 11,620.29 171,399.12 Shop Via F. Turati 2 - 4 - 6 rr. Genova 85 17,993.77 164,340.60 182,334.37 3,418.81 178,915.56 Shop Via F. Turati 8/10 rr. Genova 40 9,476.46 53,327.56 62,804.02 1,800.53 61,003.49 Shop Via S. Martino 65 B - C Genova 1180 75,975.37 705,357.83 781,333.20 25,831.62 755,501.58 Shop Via S. Martino 152 - 154 - 156 rr. Genova 220 2,040.00 256,188.44 258,228.44 - 258,228.44 Offices Via XX Settembre 41 - 5° piano Genova 700 82,180.13 771,115.27 853,295.40 27,941.24 825,354.16 Offices Via XX Settembre 41 - 5° piano Genova 380 30,816.42 279,057.72 309,874.14 10,477.58 299,396.56 Offices Via XX Settembre 41 - 6° piano Genova 270 30,256.12 248,630.61 278,886.73 10,287.08 268,599.65 Offices Via XX Settembre 41 - 7° piano Genova 600 71,901.95 754,429.09 826,331.04 24,446.66 801,884.38 Shop Vico Casana 74-76 rr. Genova 260 24,930.62 312,947.79 337,878.41 8,476.41 329,402.00 Shop Vico Casana 38 r. Genova 35 - 92,962.24 92,962.24 - 92,962.24 Shop Vico Casana 40 r. Genova 26 - 61,974.83 61,974.83 - 61,974.83 Shop Vico Casana 42 r. Genova 26 - 61,974.83 61,974.83 - 61,974.83 Shop Vico Casana 44/46 r. Genova 95 - 123,949.66 123,949.66 - 123,949.66 Shop Vico Casana 48 r. Genova " - 61,974.83 61,974.83 - 61,974.83 Shop Vico Casana 50 r. Genova " - 61,974.83 61,974.83 - 61,974.83 Warehouse Via G. D'Annunzio p. A/3 (lotto B q. 10,75) Genova 100 48,051.15 42,271.07 90,322.22 30,272.22 60,050.00 Offices Piazza Dante 8/2 Genova 170 12,994.22 194,725.53 207,719.75 2,858.72 204,861.03 Shop Via Fiasella 36 - 38 - 40 rr. Genova 190 11,555.72 402,418.70 413,974.42 808.90 413,165.52 Shop Via Cesarea 66 r. Genova 75 12,373.99 143,645.81 156,019.80 3,835.94 152,183.86 Shop Via Cesarea 68 r. Genova 687 11,624.05 299,267.19 310,891.24 3,603.45 307,287.79 Car parkings Via G. D'Annunzio Genova 170 168,336.94 113,576.60 281,913.54 136,352.92 145,560.62 Shop V.le Des Geneys 14 r. Genova 175 5,887.61 237,734.67 243,622.28 5,887.61 237,734.67 Shop Via de Nicolay 44 r. Genova 160 42.31 206,540.45 206,582.76 - 206,582.76 Shop Via Monticelli 35 Genova 720 56,795.28 283,485.26 340,280.54 56,795.28 283,485.26 Flat/Offices Via Monticelli 11/1 Genova 150 25,822.84 150,740.86 176,563.70 25,822.84 150,740.86 Shop Via Colombo 49 r. Genova 180 4,596.47 408,615.02 413,211.49 45.96 413,165.53 Shop Via G.B. Custo 11 r. Genova 220 1,378.94 205,217.61 206,596.55 13.79 206,582.76 Offices Via di Francia 5 A r. Genova 635 284,051.29 - 284,051.29 128,533.21 155,518.08 Flat Piazzetta dei Garibaldi 27 r. Genova 35 45,448.21 5,897.94 51,346.15 17,724.81 33,621.34 Shop Via Lungomare S.Maria 9/11/13 Cogoleto 100 2,347.30 101,149.47 103,496.77 375.57 103,121.20 Shop Via Dante 225 B Alassio 65 976.10 76,511.95 77,488.05 9.76 77,478.29 Shop Via Dante 229 Alassio 65 845.96 81,804.07 82,650.03 8.46 82,641.57 Shop Via della Concezione 60 Finale Ligure 130 187,495.55 205,260.96 392,756.51 187,495.55 205,260.96 Shop Via S. Maurizio 25 Imperia 35 427.76 46,053.36 46,481.12 - 46,481.12 Shop Via S. Maurizio 27 Imperia 40 822.79 61,152.04 61,974.83 - 61,974.83 Shop Via S. Maurizio 27 A Imperia 40 608.69 56,201.57 56,810.26 - 56,810.26 Flat C.so Mombello 25 piano 3 int. 3 Sanremo 104 92,962.24 30,987.41 123,949.65 - 123,949.65 Flat C.so Mombello 25 piano 3 int. 4 Sanremo 149 113,620.52 41,316.55 154,937.07 - 154,937.07 Shop Corso Mombello 46/48/50 rr. Sanremo 180 71.45 309,802.69 309,874.14 - 309,874.14 Shop Via Boselli 21 r. Arma di Taggia 125 614.58 154,322.49 154,937.07 - 154,937.07 Shop Via Vittorio Emanuele 176 Bordighera 150 7,486.56 173,928.43 181,414.99 1,197.85 180,217.14 Offices Via D'Annunzio 79 Genova 615 325,540.94 1,733,909.98 2,059,450.92 1,373,654.14 685,796.78 Offices Via Sestri 128/130/132 rr. Genova 2,076 2,119,074.07 210,708.19 2,329,782.26 826,438.91 1,503,343.35
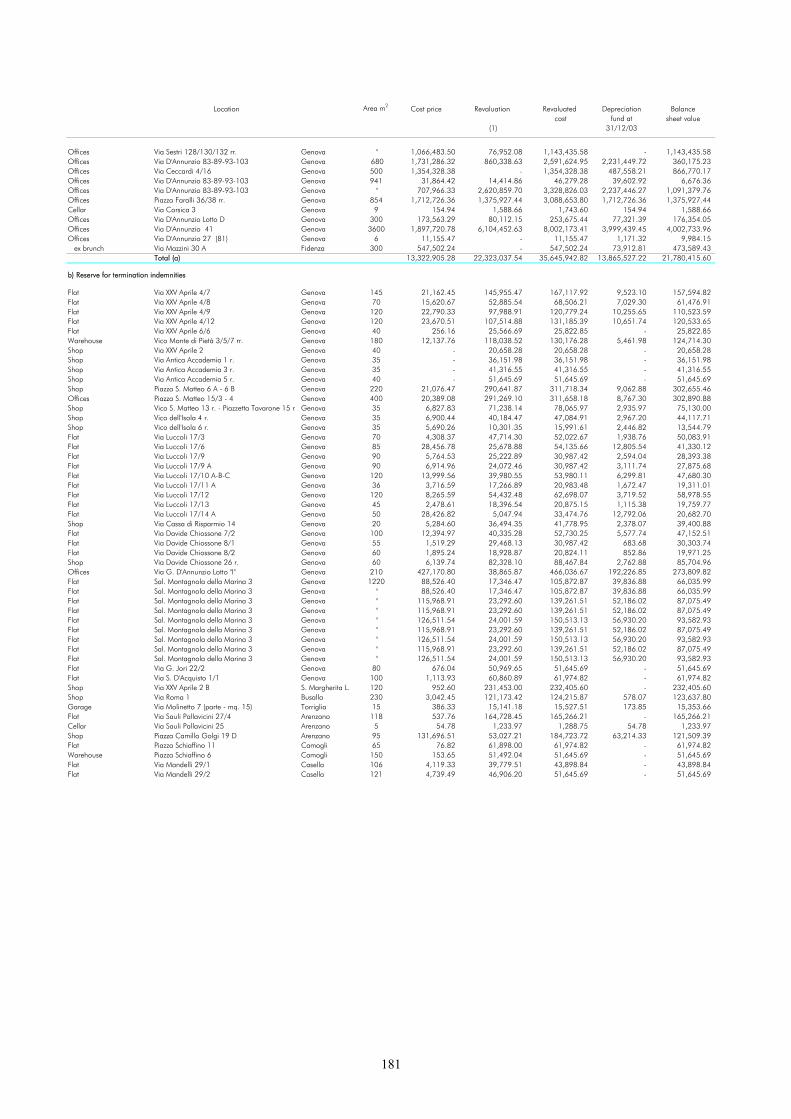
181
Location Area m2 Cost price Revaluation Revaluated Depreciation Balance cost fund at sheet value
(1) 31/12/03
Offices Via Sestri 128/130/132 rr. Genova " 1,066,483.50 76,952.08 1,143,435.58 - 1,143,435.58 Offices Via D'Annunzio 83-89-93-103 Genova 680 1,731,286.32 860,338.63 2,591,624.95 2,231,449.72 360,175.23 Offices Via Ceccardi 4/16 Genova 500 1,354,328.38 - 1,354,328.38 487,558.21 866,770.17 Offices Via D'Annunzio 83-89-93-103 Genova 941 31,864.42 14,414.86 46,279.28 39,602.92 6,676.36 Offices Via D'Annunzio 83-89-93-103 Genova " 707,966.33 2,620,859.70 3,328,826.03 2,237,446.27 1,091,379.76 Offices Piazza Faralli 36/38 rr. Genova 854 1,712,726.36 1,375,927.44 3,088,653.80 1,712,726.36 1,375,927.44 Cellar Via Corsica 3 Genova 9 154.94 1,588.66 1,743.60 154.94 1,588.66 Offices Via D'Annunzio Lotto D Genova 300 173,563.29 80,112.15 253,675.44 77,321.39 176,354.05 Offices Via D'Annunzio 41 Genova 3600 1,897,720.78 6,104,452.63 8,002,173.41 3,999,439.45 4,002,733.96 Offices Via D'Annunzio 27 (81) Genova 6 11,155.47 - 11,155.47 1,171.32 9,984.15 ex brunch Via Mazzini 30 A Fidenza 300 547,502.24 - 547,502.24 73,912.81 473,589.43
Total (a) 13,322,905.28 22,323,037.54 35,645,942.82 13,865,527.22 21,780,415.60
b) Reserve for termination indemnities
Flat Via XXV Aprile 4/7 Genova 145 21,162.45 145,955.47 167,117.92 9,523.10 157,594.82 Flat Via XXV Aprile 4/8 Genova 70 15,620.67 52,885.54 68,506.21 7,029.30 61,476.91 Flat Via XXV Aprile 4/9 Genova 120 22,790.33 97,988.91 120,779.24 10,255.65 110,523.59 Flat Via XXV Aprile 4/12 Genova 120 23,670.51 107,514.88 131,185.39 10,651.74 120,533.65 Flat Via XXV Aprile 6/6 Genova 40 256.16 25,566.69 25,822.85 - 25,822.85 Warehouse Vico Monte di Pietà 3/5/7 rr. Genova 180 12,137.76 118,038.52 130,176.28 5,461.98 124,714.30 Shop Via XXV Aprile 2 Genova 40 - 20,658.28 20,658.28 - 20,658.28 Shop Via Antica Accademia 1 r. Genova 35 - 36,151.98 36,151.98 - 36,151.98 Shop Via Antica Accademia 3 r. Genova 35 - 41,316.55 41,316.55 - 41,316.55 Shop Via Antica Accademia 5 r. Genova 40 - 51,645.69 51,645.69 - 51,645.69 Shop Piazza S. Matteo 6 A - 6 B Genova 220 21,076.47 290,641.87 311,718.34 9,062.88 302,655.46 Offices Piazza S. Matteo 15/3 - 4 Genova 400 20,389.08 291,269.10 311,658.18 8,767.30 302,890.88 Shop Vico S. Matteo 13 r. - Piazzetta Tavarone 15 r Genova 35 6,827.83 71,238.14 78,065.97 2,935.97 75,130.00 Shop Vico dell'Isola 4 r. Genova 35 6,900.44 40,184.47 47,084.91 2,967.20 44,117.71 Shop Vico dell'Isola 6 r. Genova 35 5,690.26 10,301.35 15,991.61 2,446.82 13,544.79 Flat Via Luccoli 17/3 Genova 70 4,308.37 47,714.30 52,022.67 1,938.76 50,083.91 Flat Via Luccoli 17/6 Genova 85 28,456.78 25,678.88 54,135.66 12,805.54 41,330.12 Flat Via Luccoli 17/9 Genova 90 5,764.53 25,222.89 30,987.42 2,594.04 28,393.38 Flat Via Luccoli 17/9 A Genova 90 6,914.96 24,072.46 30,987.42 3,111.74 27,875.68 Flat Via Luccoli 17/10 A-B-C Genova 120 13,999.56 39,980.55 53,980.11 6,299.81 47,680.30 Flat Via Luccoli 17/11 A Genova 36 3,716.59 17,266.89 20,983.48 1,672.47 19,311.01 Flat Via Luccoli 17/12 Genova 120 8,265.59 54,432.48 62,698.07 3,719.52 58,978.55 Flat Via Luccoli 17/13 Genova 45 2,478.61 18,396.54 20,875.15 1,115.38 19,759.77 Flat Via Luccoli 17/14 A Genova 50 28,426.82 5,047.94 33,474.76 12,792.06 20,682.70 Shop Via Cassa di Risparmio 14 Genova 20 5,284.60 36,494.35 41,778.95 2,378.07 39,400.88 Flat Via Davide Chiossone 7/2 Genova 100 12,394.97 40,335.28 52,730.25 5,577.74 47,152.51 Flat Via Davide Chiossone 8/1 Genova 55 1,519.29 29,468.13 30,987.42 683.68 30,303.74 Flat Via Davide Chiossone 8/2 Genova 60 1,895.24 18,928.87 20,824.11 852.86 19,971.25 Shop Via Davide Chiossone 26 r. Genova 60 6,139.74 82,328.10 88,467.84 2,762.88 85,704.96 Offices Via G. D'Annunzio Lotto "I" Genova 210 427,170.80 38,865.87 466,036.67 192,226.85 273,809.82 Flat Sal. Montagnola della Marina 3 Genova 1220 88,526.40 17,346.47 105,872.87 39,836.88 66,035.99 Flat Sal. Montagnola della Marina 3 Genova " 88,526.40 17,346.47 105,872.87 39,836.88 66,035.99 Flat Sal. Montagnola della Marina 3 Genova " 115,968.91 23,292.60 139,261.51 52,186.02 87,075.49 Flat Sal. Montagnola della Marina 3 Genova " 115,968.91 23,292.60 139,261.51 52,186.02 87,075.49 Flat Sal. Montagnola della Marina 3 Genova " 126,511.54 24,001.59 150,513.13 56,930.20 93,582.93 Flat Sal. Montagnola della Marina 3 Genova " 115,968.91 23,292.60 139,261.51 52,186.02 87,075.49 Flat Sal. Montagnola della Marina 3 Genova " 126,511.54 24,001.59 150,513.13 56,930.20 93,582.93 Flat Sal. Montagnola della Marina 3 Genova " 115,968.91 23,292.60 139,261.51 52,186.02 87,075.49 Flat Sal. Montagnola della Marina 3 Genova " 126,511.54 24,001.59 150,513.13 56,930.20 93,582.93 Flat Via G. Jori 22/2 Genova 80 676.04 50,969.65 51,645.69 - 51,645.69 Flat Via S. D'Acquisto 1/1 Genova 100 1,113.93 60,860.89 61,974.82 - 61,974.82 Shop Via XXV Aprile 2 B S. Margherita L. 120 952.60 231,453.00 232,405.60 - 232,405.60 Shop Via Roma 1 Busalla 230 3,042.45 121,173.42 124,215.87 578.07 123,637.80 Garage Via Molinetto 7 (parte - mq. 15) Torriglia 15 386.33 15,141.18 15,527.51 173.85 15,353.66 Flat Via Sauli Pallavicini 27/4 Arenzano 118 537.76 164,728.45 165,266.21 - 165,266.21 Cellar Via Sauli Pallavicini 25 Arenzano 5 54.78 1,233.97 1,288.75 54.78 1,233.97 Shop Piazza Camillo Golgi 19 D Arenzano 95 131,696.51 53,027.21 184,723.72 63,214.33 121,509.39 Flat Piazza Schiaffino 11 Camogli 65 76.82 61,898.00 61,974.82 - 61,974.82 Warehouse Piazza Schiaffino 6 Camogli 150 153.65 51,492.04 51,645.69 - 51,645.69 Flat Via Mandelli 29/1 Casella 106 4,119.33 39,779.51 43,898.84 - 43,898.84 Flat Via Mandelli 29/2 Casella 121 4,739.49 46,906.20 51,645.69 - 51,645.69
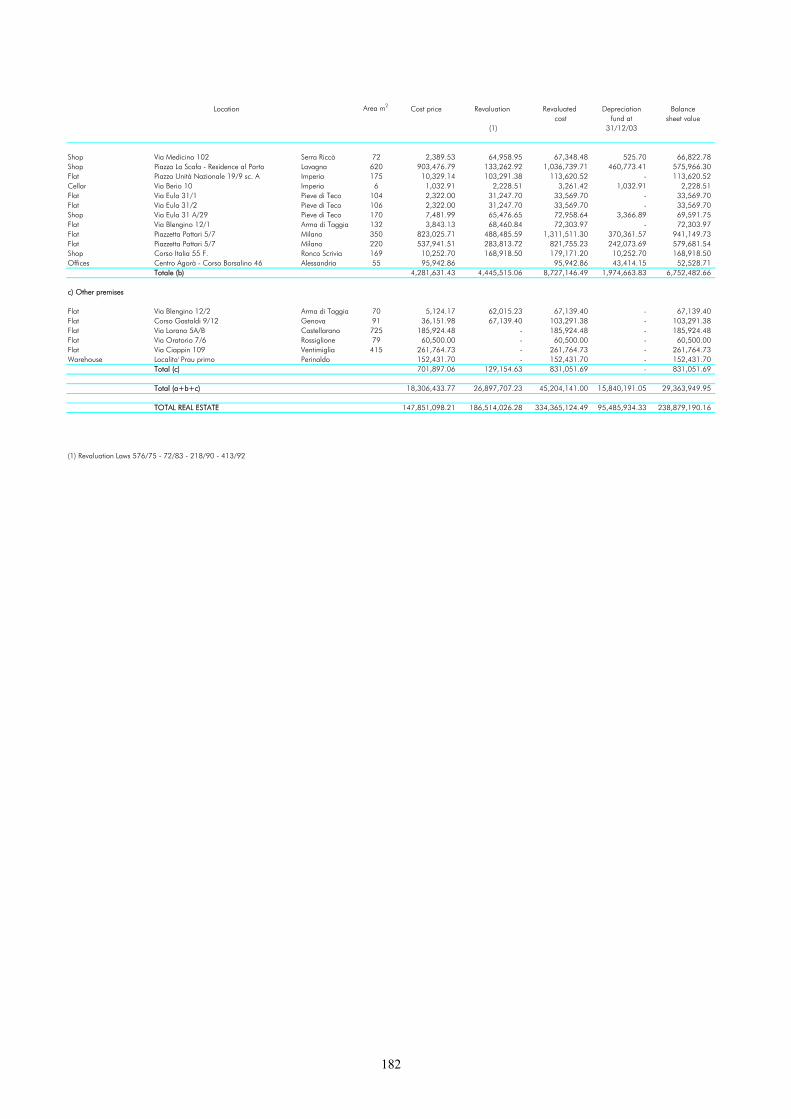
182
Location Area m2 Cost price Revaluation Revaluated Depreciation Balance cost fund at sheet value
(1) 31/12/03
Shop Via Medicina 102 Serra Riccò 72 2,389.53 64,958.95 67,348.48 525.70 66,822.78 Shop Piazza La Scafa - Residence al Porto Lavagna 620 903,476.79 133,262.92 1,036,739.71 460,773.41 575,966.30 Flat Piazza Unità Nazionale 19/9 sc. A Imperia 175 10,329.14 103,291.38 113,620.52 - 113,620.52 Cellar Via Berio 10 Imperia 6 1,032.91 2,228.51 3,261.42 1,032.91 2,228.51 Flat Via Eula 31/1 Pieve di Teco 104 2,322.00 31,247.70 33,569.70 - 33,569.70 Flat Via Eula 31/2 Pieve di Teco 106 2,322.00 31,247.70 33,569.70 - 33,569.70 Shop Via Eula 31 A/29 Pieve di Teco 170 7,481.99 65,476.65 72,958.64 3,366.89 69,591.75 Flat Via Blengino 12/1 Arma di Taggia 132 3,843.13 68,460.84 72,303.97 - 72,303.97 Flat Piazzetta Pattari 5/7 Milano 350 823,025.71 488,485.59 1,311,511.30 370,361.57 941,149.73 Flat Piazzetta Pattari 5/7 Milano 220 537,941.51 283,813.72 821,755.23 242,073.69 579,681.54 Shop Corso Italia 55 F. Ronco Scrivia 169 10,252.70 168,918.50 179,171.20 10,252.70 168,918.50 Offices Centro Agorà - Corso Borsalino 46 Alessandria 55 95,942.86 95,942.86 43,414.15 52,528.71
Totale (b) 4,281,631.43 4,445,515.06 8,727,146.49 1,974,663.83 6,752,482.66
c) Other premises
Flat Via Blengino 12/2 Arma di Taggia 70 5,124.17 62,015.23 67,139.40 - 67,139.40 Flat Corso Gastaldi 9/12 Genova 91 36,151.98 67,139.40 103,291.38 - 103,291.38 Flat Via Lorano 5A/B Castellarano 725 185,924.48 - 185,924.48 - 185,924.48 Flat Via Oratorio 7/6 Rossiglione 79 60,500.00 - 60,500.00 - 60,500.00 Flat Via Ciappin 109 Ventimiglia 415 261,764.73 - 261,764.73 - 261,764.73 Warehouse Localita' Prau primo Perinaldo 152,431.70 - 152,431.70 - 152,431.70
Total (c) 701,897.06 129,154.63 831,051.69 - 831,051.69
Total (a+b+c) 18,306,433.77 26,897,707.23 45,204,141.00 15,840,191.05 29,363,949.95
TOTAL REAL ESTATE 147,851,098.21 186,514,026.28 334,365,124.49 95,485,934.33 238,879,190.16
(1) Revaluation Laws 576/75 - 72/83 - 218/90 - 413/92

183
(Euro)REVALUATION LAW 413/91
Via Puggia 43,45,47 r. Genoa 22,341.92Loc. Anderlino fraz. Avenza Carrara 24,346.75Total 46,688.67
LEASED FIXED ASSETS REVALUED INACCORDANCE WITH LAW 413/91

184
(Euro)Balance at 31/12/2002
Code Description Nominal Cost BookValue Price Value
356303 CARIGE 1,5 CV - - - 305691 TELECOM 1,5 04 5.20 100.38 5.22333188 ALITALIA 2,9 CV 10,890 91.970 10,015.73
Total 10,895.41 - 10,020.95
CONVERTIBLE BONDS

185
Balance at 31/12/2003
Nominal Countervalue Gains/losses Revaluations/ Nominal Cost BookValue writebacks Value Price Value
107,927.50 114,651.26 - - 107,927.50 106.230 114,651.264,499,991.60 4,734,920.75 1,122 - 2,696.50 4,499,996.80 105.19 4,733,350.97
- 10,890.21 - 9,788.25 - 227.48 - - - -
4,597,028.89 4,839,783.76 894.02 -2,696.50 4,607,924.30 4,848,002.23
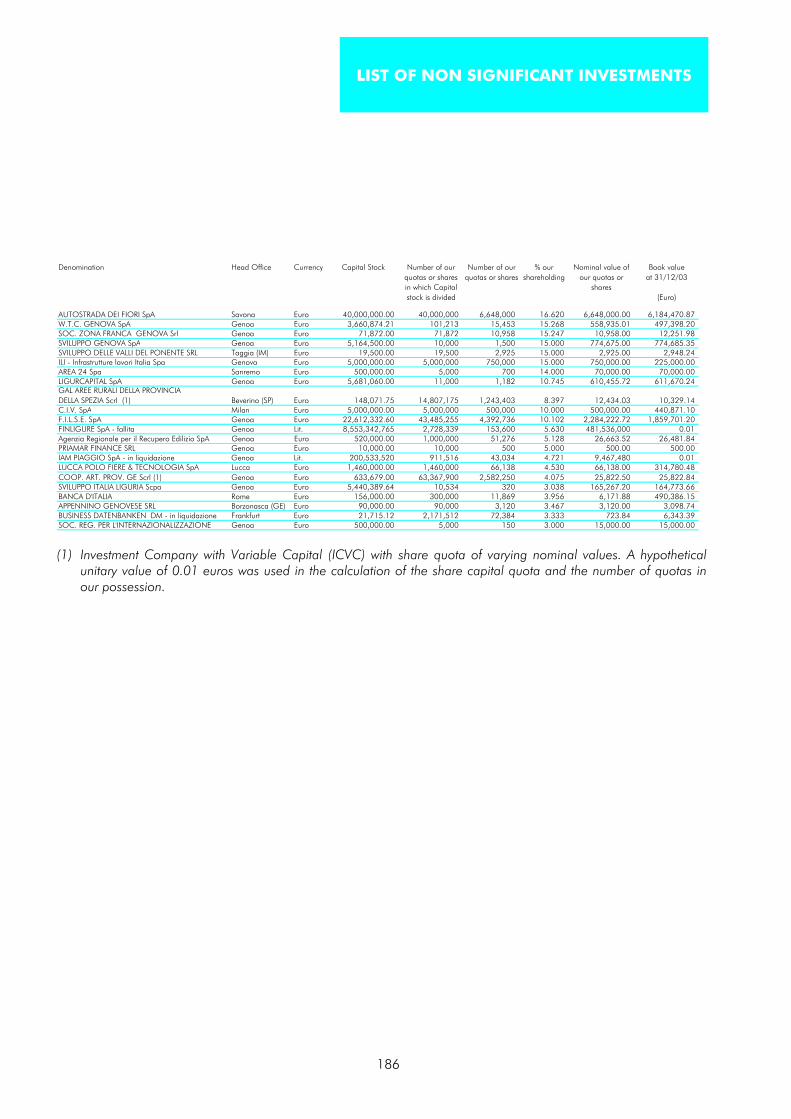
186
Denomination Head Office Currency Capital Stock Number of our quotas or sharesin which Capitalstock is divided
Number of ourquotas or shares
% ourshareholding
Nominal value ofour quotas or
shares
Book valueat 31/12/03
(Euro)
AUTOSTRADA DEI FIORI SpA Savona Euro 40,000,000.00 40,000,000 6,648,000 16.620 6,648,000.00 6,184,470.87W.T.C. GENOVA SpA Genoa Euro 3,660,874.21 101,213 15,453 15.268 558,935.01 497,398.20SOC. ZONA FRANCA GENOVA Srl Genoa Euro 71,872.00 71,872 10,958 15.247 10,958.00 12,251.98SVILUPPO GENOVA SpA Genoa Euro 5,164,500.00 10,000 1,500 15.000 774,675.00 774,685.35SVILUPPO DELLE VALLI DEL PONENTE SRL Taggia (IM) Euro 19,500.00 19,500 2,925 15.000 2,925.00 2,948.24ILI - Infrastrutture lavori Italia Spa Genova Euro 5,000,000.00 5,000,000 750,000 15.000 750,000.00 225,000.00AREA 24 Spa Sanremo Euro 500,000.00 5,000 700 14.000 70,000.00 70,000.00LIGURCAPITAL SpA Genoa Euro 5,681,060.00 11,000 1,182 10.745 610,455.72 611,670.24GAL AREE RURALI DELLA PROVINCIA DELLA SPEZIA Scrl (1) Beverino (SP) Euro 148,071.75 14,807,175 1,243,403 8.397 12,434.03 10,329.14C.I.V. SpA Milan Euro 5,000,000.00 5,000,000 500,000 10.000 500,000.00 440,871.10F.I.L.S.E. SpA Genoa Euro 22,612,332.60 43,485,255 4,392,736 10.102 2,284,222.72 1,859,701.20FINLIGURE SpA - fallita Genoa Lit. 8,553,342,765 2,728,339 153,600 5.630 481,536,000 0.01Agenzia Regionale per il Recupero Edilizio SpA Genoa Euro 520,000.00 1,000,000 51,276 5.128 26,663.52 26,481.84PRIAMAR FINANCE SRL Genoa Euro 10,000.00 10,000 500 5.000 500.00 500.00IAM PIAGGIO SpA - in liquidazione Genoa Lit. 200,533,520 911,516 43,034 4.721 9,467,480 0.01LUCCA POLO FIERE & TECNOLOGIA SpA Lucca Euro 1,460,000.00 1,460,000 66,138 4.530 66,138.00 314,780.48COOP. ART. PROV. GE Scrl (1) Genoa Euro 633,679.00 63,367,900 2,582,250 4.075 25,822.50 25,822.84SVILUPPO ITALIA LIGURIA Scpa Genoa Euro 5,440,389.64 10,534 320 3.038 165,267.20 164,773.66BANCA D'ITALIA Rome Euro 156,000.00 300,000 11,869 3.956 6,171.88 490,386.15APPENNINO GENOVESE SRL Borzonasca (GE) Euro 90,000.00 90,000 3,120 3.467 3,120.00 3,098.74BUSINESS DATENBANKEN DM - in liquidazione Frankfurt Euro 21,715.12 2,171,512 72,384 3.333 723.84 6,343.39SOC. REG. PER L'INTERNAZIONALIZZAZIONE Genoa Euro 500,000.00 5,000 150 3.000 15,000.00 15,000.00
(1) Investment Company with Variable Capital (ICVC) with share quota of varying nominal values. A hypotheticalunitary value of 0.01 euros was used in the calculation of the share capital quota and the number of quotas inour possession.
LIST OF NON SIGNIFICANT INVESTMENTS
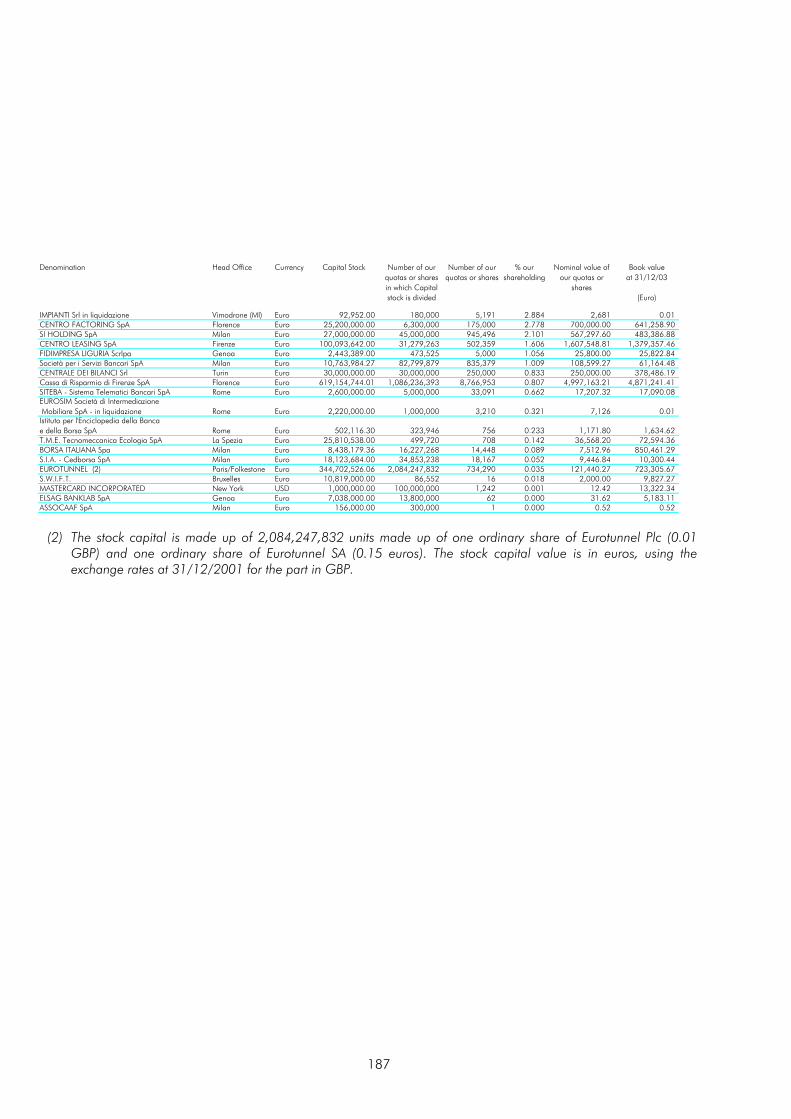
187
Denomination Head Office Currency Capital Stock Number of our quotas or sharesin which Capitalstock is divided
Number of ourquotas or shares
% ourshareholding
Nominal value ofour quotas or
shares
Book valueat 31/12/03
(Euro)
IMPIANTI Srl in liquidazione Vimodrone (MI) Euro 92,952.00 180,000 5,191 2.884 2,681 0.01CENTRO FACTORING SpA Florence Euro 25,200,000.00 6,300,000 175,000 2.778 700,000.00 641,258.90SI HOLDING SpA Milan Euro 27,000,000.00 45,000,000 945,496 2.101 567,297.60 483,386.88CENTRO LEASING SpA Firenze Euro 100,093,642.00 31,279,263 502,359 1.606 1,607,548.81 1,379,357.46FIDIMPRESA LIGURIA Scrlpa Genoa Euro 2,443,389.00 473,525 5,000 1.056 25,800.00 25,822.84Società per i Servizi Bancari SpA Milan Euro 10,763,984.27 82,799,879 835,379 1.009 108,599.27 61,164.48CENTRALE DEI BILANCI Srl Turin Euro 30,000,000.00 30,000,000 250,000 0.833 250,000.00 378,486.19Cassa di Risparmio di Firenze SpA Florence Euro 619,154,744.01 1,086,236,393 8,766,953 0.807 4,997,163.21 4,871,241.41SITEBA - Sistema Telematici Bancari SpA Rome Euro 2,600,000.00 5,000,000 33,091 0.662 17,207.32 17,090.08EUROSIM Società di Intermediazione Mobiliare SpA - in liquidazione Rome Euro 2,220,000.00 1,000,000 3,210 0.321 7,126 0.01Istituto per l'Enciclopedia della Bancae della Borsa SpA Rome Euro 502,116.30 323,946 756 0.233 1,171.80 1,634.62T.M.E. Tecnomeccanica Ecologia SpA La Spezia Euro 25,810,538.00 499,720 708 0.142 36,568.20 72,594.36BORSA ITALIANA Spa Milan Euro 8,438,179.36 16,227,268 14,448 0.089 7,512.96 850,461.29S.I.A. - Cedborsa SpA Milan Euro 18,123,684.00 34,853,238 18,167 0.052 9,446.84 10,300.44EUROTUNNEL (2) Paris/Folkestone Euro 344,702,526.06 2,084,247,832 734,290 0.035 121,440.27 723,305.67S.W.I.F.T. Bruxelles Euro 10,819,000.00 86,552 16 0.018 2,000.00 9,827.27MASTERCARD INCORPORATED New York USD 1,000,000.00 100,000,000 1,242 0.001 12.42 13,322.34ELSAG BANKLAB SpA Genoa Euro 7,038,000.00 13,800,000 62 0.000 31.62 5,183.11ASSOCAAF SpA Milan Euro 156,000.00 300,000 1 0.000 0.52 0.52
(2) The stock capital is made up of 2,084,247,832 units made up of one ordinary share of Eurotunnel Plc (0.01GBP) and one ordinary share of Eurotunnel SA (0.15 euros). The stock capital value is in euros, using theexchange rates at 31/12/2001 for the part in GBP.

188
Galeazzo SrlColumbus
CarigeImmobiliare
Ettore Centro Carige Immobiliare SpA Vernazza SpA Fiduciario SpA Assicurazioni
(thousands of Euros) SpABALANCE SHEET (1) (1) (1) (1) (1)ASSETSLoans to bank 2,849 - 1 646 34,893Other loans (2) 83 2,307 20 233 210,812Securities - - 2,324 (4) 971 391,210 (7)Equity investments 5 1 - - 2,208Tangible and intangible fixed assets 1,045 28,706 5,567 38 206,581Other assets - 5,057 - 6 322,614Total assets 3,982 36,071 7,912 1,894 1,168,318LIABILITIES AND STOCKHOLDERS' EQUITYAmounts owed to banks - 10,669 1,008 410 232Other payables (3) 14 307 1,053 324 715,629Other liabilities 119 - 717 192 311,391 (5)Stockholders' equity 3,849 25,095 5,134 968 141,066Total liabilities and stockholders' equity 3,982 36,071 7,912 1,894 1,168,318INCOME STATEMENTProfit (loss) on ordinary activities 102 733 1,549 256 8,410Extraordinary profit (loss) 2 - 20 - 2 - 25 238Changes of reserves for general bank - - - - - Taxation 36 208 657 109 5,938Profit (loss) for the financial year 68 505 890 122 2,710
Net equity includes credit risk and general banking risk funds, and does not include dividendsdeliberated (recorded at item ‘other debts’).
(1) Financial statements as of 31/12/03 prepared by directors.(2) With reference to insurance companies, item includes reserves of reinsurers and retrocessionaries.(3) With reference to insurance companies, item includes actuarial, premium and damage reserves.(4) Own shares.(5) Includes subordinated liabilities of 46,000 thousand euros.(6) Includes shareholders’ provisions for losses recorded during the year.(7) Of which own shares 3,346 thousand euros.(8) Financial statements as of 31/12/02 prepared by directors.
INFORMATION ON SUBSIDIARIES ANDOTHER SIGNIFICANT COMPANY
INTERESTS
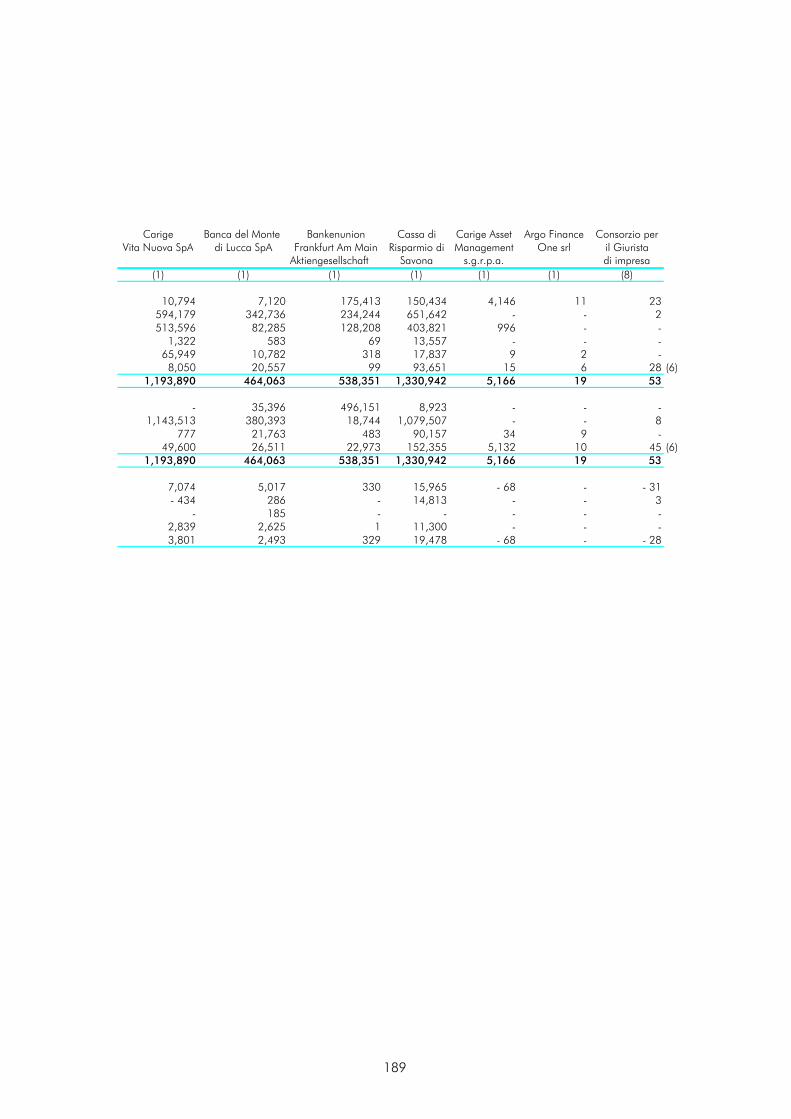
189
Carige Banca del Monte Bankenunion Cassa di Carige Asset Argo Finance Consorzio perVita Nuova SpA di Lucca SpA Frankfurt Am Main Risparmio di Management One srl il Giurista
Aktiengesellschaft Savona s.g.r.p.a. di impresa(1) (1) (1) (1) (1) (1) (8)
10,794 7,120 175,413 150,434 4,146 11 23594,179 342,736 234,244 651,642 - - 2513,596 82,285 128,208 403,821 996 - -
1,322 583 69 13,557 - - - 65,949 10,782 318 17,837 9 2 -
8,050 20,557 99 93,651 15 6 28 (6)1,193,890 464,063 538,351 1,330,942 5,166 19 53
- 35,396 496,151 8,923 - - - 1,143,513 380,393 18,744 1,079,507 - - 8
777 21,763 483 90,157 34 9 - 49,600 26,511 22,973 152,355 5,132 10 45 (6)
1,193,890 464,063 538,351 1,330,942 5,166 19 53
7,074 5,017 330 15,965 - 68 - - 31- 434 286 - 14,813 - - 3
- 185 - - - - - 2,839 2,625 1 11,300 - - - 3,801 2,493 329 19,478 - 68 - - 28

190
Autostrada Assi 90 AG Assimilano Savona 2000dei Fiori srl srl srl srl
(thousands of Euros)BALANCE SHEET (1) (1) (1) (1) (1)ASSETSLoans to bank 2,570 956 446 1,318 191Other loans (2) 38,752 305 95 485 31Securities - - - 41 - Equity investments 6,214 1,697 8 2 - Tangible and intangible fixed assets 608,437 205 383 414 66Other assets 120,368 3,745 369 2,556 61Total assets 776,341 6,908 1,301 4,816 349LIABILITIES AND STOCKHOLDERS' EQUITYAmounts owed to banks 119,785 - 90 - - Other payables (3) 386,876 5,775 773 2,142 10Other liabilities 37,636 212 417 2,611 269Stockholders' equity 232,044 921 21 63 70Total liabilities and stockholders' equity 776,341 6,908 1,301 4,816 349INCOME STATEMENTProfit (loss) on ordinary activities 41,404 1,462 - 4 3 63Extraordinary profit (loss) - 812 244 25 - 17 8Changes of reserves for general bank - - - - - Taxation 16,775 761 18 30 31Profit (loss) for the financial year 23,817 945 3 - 44 40
The shareholders'equity includes reserves for loan losses and for general banking risks, and it's net of deliberateddividends (included into caption "Other liabilities").
(1) Financial statements as of 31/12/03 prepared by directors.(2) With reference to insurance companies, item includes reserves of reinsurers and retrocessionaries.(3) With reference to insurance companies, item includes actuarial, premium and damage reserves.(4) Financial statements as of 31/12/02 prepared by directors.(5) Values taken from Carige Vita Nuova finacial statements.

191
BDA Recina Servizi Assistars Didiass U.C. Sport e AtomaSpA srl srl srl Sicurezza srl srl
(4) (4) (4) (4) (4) (5)
18 2,623 96 - - 520 30 59 - 1,338
- - - - - - 113 - - -
366 630 4 17 4622 2,575 345 207 27 12
1,526 5,971 504 224 1,369 12
- 28 - - - 796 638 368 3 1,073303 4,722 86 247 286427 583 50 - 26 10 12
1,526 5,971 504 224 1,369 12
9 1,554 17 - 40 820 - 26 34 - - 1
- - - - - 29 655 34 7 5
- 873 17 - 47 2 -

192
BALANCE SHEET - ACCUMULATION OF CAPITAL 31/12/2003 31/12/2002 31/12/2003 31/12/2002 31/12/2003 31/12/200210 - Investments 9,103,731 4,160,339 13,362,809 6,649,031 18,328,547 11,066,111 10 a) - Investments - banking deposits 478,834 677,162 599,538 1,228,021 700,915 1,487,002 10 h) - Investments - mutual funds and unit trusts 8,617,156 3,472,471 12,748,626 5,398,568 17,604,002 9,532,962 10 l) - Investments - accrued income and prepaid expenses - - - - - - 10 n) - Financial trust management: other assets 7,741 10,706 14,645 22,442 23,630 46,147 30 - TAX CREDIT - 608 48,807 36,131 219,363 195,150 30 a) - Tax credit on “imposta sostitutiva” paid - 521 15,385 32,944 149,434 188,985 30 b) - Tax credit on collective investment schemes - 87 33,422 3,187 69,929 6,165 10 - Pension and health trust management: liabilities -3,989 - - -5,449 0 -1,357 10 a) - Pension and health trust management: amounts owed -3,989 - - -5,449 0 -1,357 30 - Financial management liabilities -5,723 -6,799 -12,764 -16,317 -23,809 -39,567 30 c) - Accruals and payables liabilities 30 d) - Financial trust management: other liabilities -5,723 -6,799 -12,764 -16,317 -23,809 -39,567 40 - Tax liabilities -189 - - - - - 100 - Net asset for benefit 9,093,830 4,154,148 13,398,852 6,663,396 18,524,101 11,220,337Credit account (1) 1,261,000 1,296,678 1,517,472 1,666,108 1,555,053 1,330,433 INCOME STATEMENT -ACCUMULATION OF CAPITAL
10 - Settlement of social security contributions 4,825,601 3,567,106 6,593,389 5,231,319 6,983,755 7,522,377 10 a) - Social security contributions 4,860,316 3,638,503 6,828,033 5,327,818 7,186,678 7,631,318 10 b) - Advances -24,670 - -69,000 - - - 10 c) - Transfer and redemptions 5,660 -68,005 -155,976 -88,788 -185,463 -90,416 10 e) - Distributions of capital -10,719 - - - - - 10 f) - Other contributions -4,986 -3,392 -9,668 -7,711 -17,460 -18,525 20 -Settlement of financial management 168,571 110,986 250,308 -65,926 531,257 -1,151,509 20 a) - Dividends and interests 13,904 3,708 20,530 5,546 21,976 7,164 20 b) - Profits (losses) from financial transactions, net 154,667 107,278 229,778 -71,472 509,281 -1,158,673 30 - Operating expenses -53,693 -15,318 -120,918 -47,452 -235,461 -130,286 30 a) - Management trust -53,530 -15,084 -120,785 -46,784 -235,330 -129,415 30 b) - Other expenses -163 -234 -133 -668 -131 -871 50 - “Imposta sostitutiva” (Law 85/95) 797- 521 12,677 31,130 24,213 159,758 Changes on net asset for benefits(10)+(20)+(30)+(50) 4,939,682 3,663,295 6,735,456 5,149,071 7,303,764 6,400,340
"Asset defence" investment
"Contribution paid development"
investment
"Long term asset revaluation"
investment
INFORMATION ON OPEN PENSION FUND
“FONDO PENSIONE APERTO CARIGE”

193
CURRENCY 2003 2002US dollar USD 1.26300 1.04870British pound GBP 0.70480 0.65050Danish krone DKK 7.44500 7.42880Canadian dollar CAD 1.62340 1.65500Japanese yen YPY 135.05000 124.39000Swiss franc CHF 1.55790 1.45240Norwegian krone NOK 8.41410 7.27560Swedish krona SEK 9.08000 9.15280Australian dollar AUD 1.68020 1.85560South African rand ZAR 8.32760 9.00940Hong Kong dollar HKD 9.80490 8.17810Indian rupee INR 56.90000 50.20000Tunisian dinar TND 1.52330 1.40300Malaysian ringgit MYR 4.75250 -Moroccan dirham MAD 11.06500 10.53990Singapore dollar SGD 2.14500 1.81990United Arab Emirates dirham AED 4.59340 3.64875Czech koruna CZK 32.41000 31.57700Argentine peso ARS 3.67300 -Mexican peso MXN 14.00500 10.75050Brazilian cruz BRL 3.62000 3.66513Indonesian rupee IDR 10604.35000 9317.26000Philippines peso PHP 69.45000 55.38330Thaylandian bath THB 49.59000 45.07160Hungaryan forint HUF 262.50000 236.29000Polish zloty PLN 4.70190 4.02100Venezuelan bolivar VEB 1998.54000 1443.00000Israeli shekel ILS 5.45500 4.99404Peruvian sol PEN 4.33800 3.66593 South Korean won KRW 1506.32000 1247.51000New Zeland dollar NZD 1.92440 1.99750Algerian dinar DZD 89.90000 81.89550Sri Lanka rupee LKR 120.48000 -Qatar riyal QAR 4.55200 3.79360Libyian dinar LYD 1.67946 1.27815Honduras lempira HNL 22.46600 17.62980Saudi Arabian riyal SAR 4.67975 3.90303Chinese renbimby RBY 10.34660 8.62941Uruguayan peso UYP 35.67600 28.04560C.F.A. franc XAF 655.95700 655.95700Mauritanian ouguiya MRO 321.14700 283.37300Yemeni riyal YER 222.44100 185.39600Jordanian dinar JOD 0.88471 0.73891Bahrain dinar BHD 0.47100 -Iranian riyal IRR 10374.10000 8329.96000Egyptian pound EGP 7.70500 4.81816Kuwait dinar KWD 0.36777 0.31319Iraqi dinar IQD 0.38862 0.32412Pakistan rupee PKR 71.82310 60.82800C.F.A. franc (BCEAO) XOF 655.95700 655.95700Maltese lira MTL 0.43120 0.41790Namibian dollar NAD 8.23330 8.97910Turkish lira TRL 1752635.00000 1713000.00000
LIST OF EXCHANGE RATESUSED IN CONVERTINGFOREIGN CURRENCIES

194
CONSOLIDATED ACCOUNTS
2003
BANCA CARIGE GROUP

195
CONSOLIDATED FINANCIAL HIGHLIGHTS
31/12/03 30/9/03 31/12/02 31/12/01 2003 2002
BALANCE SHEET (1)Total assets 15,918.3 15,903.3 15,388.9 13,961.8 3.4 10.2
Funding 12,897.4 12,983.1 12,424.9 11,216.7 3.8 10.8– Customer Deposits 11,373.9 11,090.2 10,558.2 9,377.2 7.7 12.6
– Amounts owed to customers 6,861.1 6,717.6 6,900.8 5,838.1 - 0.6 18.2– Debts evidenced by certificates 4,512.8 4,372.6 3,657.4 3,539.1 23.4 3.3
– Deposits from Banks 1,006.0 1,477.5 1,466.4 1,439.2 - 31.4 1.9– Funds managed on behalf of third parties 0.4 0.4 0.3 0.3 33.3 - – Subordinated loans 517.1 415.0 400.0 400.0 29.3 -
Other Financial Intermediation Activities (OFIA) 14,316.9 14,387.9 13,929.9 12,884.8 2.8 8.1– Assets Under Management 7,436.7 7,359.7 6,842.9 6,421.6 8.7 6.6– Assets in Custody 6,880.2 7,028.2 7,087.0 6,463.2 - 2.9 9.7
Total Financial Intermediation Activities (TFIA) 25,690.8 25,478.1 24,488.1 22,262.0 4.9 10.0
Lending (2) (3) 13,737.6 13,864.9 13,210.9 12,317.2 4.0 7.3– Loans to Customers (2) (3) 10,251.3 9,794.7 9,495.1 8,341.4 8.0 13.8– Loans to Banks (2) 922.3 1,352.0 1,328.1 1,175.1 - 30.6 13.0– Securities 2,564.0 2,718.2 2,387.7 2,800.7 7.4 - 14.7
– Investiment Securities 214.7 273.7 242.0 460.1 - 11.3 - 47.4– Trading Securities 2,349.3 2,444.5 2,145.7 2,340.6 9.5 - 8.3
Shareholders’ Equity (4) 1,504.3 1,302.9 1,305.8 1,275.5 15.2 2.4GROUP INSURANCE COMPANIES (1)Total premiums 670.7 473.5 676.2 668.4 - 0.8 1.2Damages paid-out 403.5 293.1 430.3 512.9 - 6.2 - 16.1INCOME STATEMENT (1)Operating Income 206.7 140.3 186.4 213.2 10.9 - 12.6Income from Ordinary Activities 121.5 91.3 112.0 162.6 8.5 - 31.1Income before Taxation 156.4 112.8 128.5 178.0 21.7 - 27.8Net Income 84.7 57.7 66.2 96.1 28.1 - 31.1RESOURCES (5)Number of branches 456 455 452 403 0.9 12.2Number of employees 4,354 4,382 4,111 4,104 5.9 0.2Insurance companies:- number of branches 416 420 443 482 - 6.1 - 8.1- number of employees 377 390 402 408 - 6.2 - 1.5FINANCIAL RATIOSNon interest income
/ Gross operating income 50.69% 49.74% 48.08% 47.64% Operating costs
/ Gross operating income 72.83% 74.70% 72.74% 68.89%Income before Taxation
/ Shareholders’ Equity (4) 10.42% 8.66% 9.84% 13.96%
ROE 5.64% 4.43% 5.07% 7.53%
ROAE (6) 6.41% 4.42% 5.13% 7.58%SOLVENCY RATIOS (7) Risk-Weighted Assets (RWA) (1) 11,254.3 11,196.2 10,164.1 9,231.1 10.7 10.1Tier 1% of RWA 8.61% 6.91% 7.13% 8.71%Total Capital % of RWA 11.67% 8.99% 9.01% 12.56%(1) Millions of Euros.
(2) Gross of allowance for credit risks.
(3) Including leased fixed assets.
(4) Including reserves for general banking risks.
(5) Statistics at the end of period.
(6) Net income on average shareholders’ equity (Return On Average Equity).
(7) Ratios communicated to the Bank of Italy, Excluding ratios at 30/9/2003.
Change %
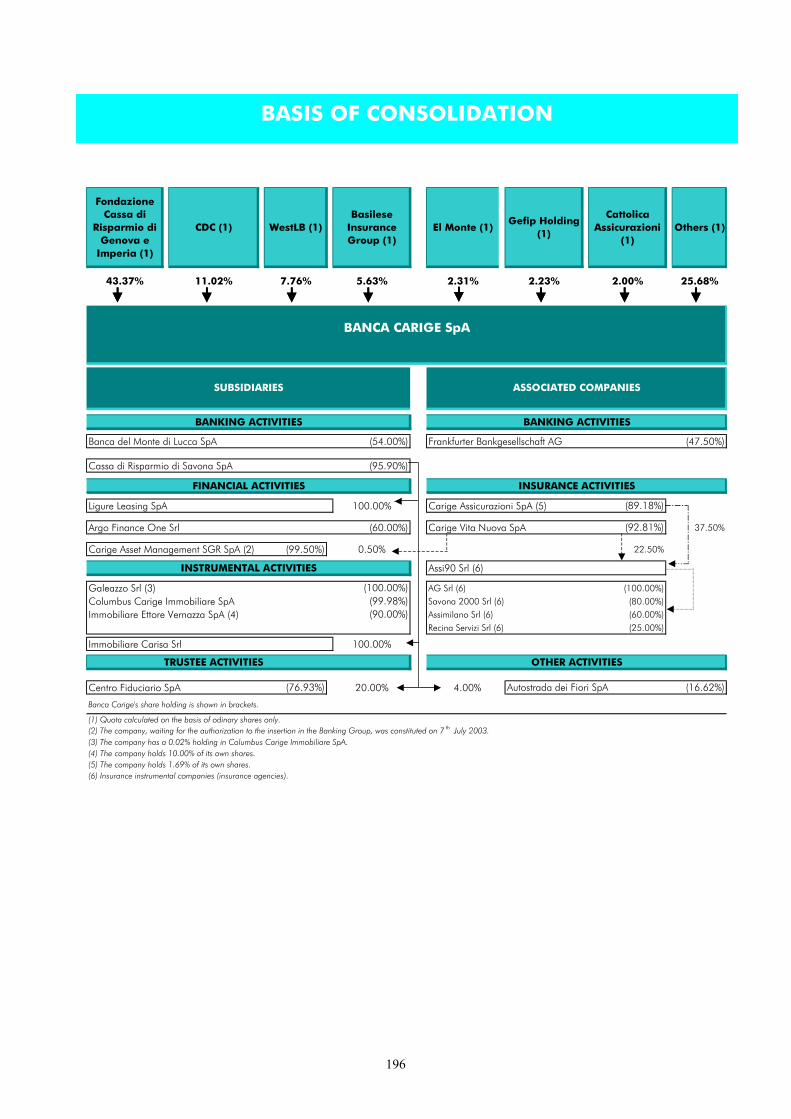
196
Fondazione Cassa di
Risparmio di Genova e
Imperia (1)
CDC (1) WestLB (1)Basilese
Insurance Group (1)
El Monte (1)Gefip Holding
(1)
Cattolica Assicurazioni
(1)Others (1)
43.37% 11.02% 7.76% 5.63% 2.31% 2.23% 2.00% 25.68%
BANCA CARIGE SpA
BANKING ACTIVITIES BANKING ACTIVITIES
Banca del Monte di Lucca SpA (54.00%) Frankfurter Bankgesellschaft AG (47.50%)
Cassa di Risparmio di Savona SpA (95.90%)
FINANCIAL ACTIVITIES INSURANCE ACTIVITIES
Ligure Leasing SpA 100.00% Carige Assicurazioni SpA (5) (89.18%)
Argo Finance One Srl (60.00%) Carige Vita Nuova SpA (92.81%) 37.50%
Carige Asset Management SGR SpA (2) (99.50%) 0.50% 22.50%
INSTRUMENTAL ACTIVITIES Assi90 Srl (6)
Galeazzo Srl (3) (100.00%) AG Srl (6) (100.00%)Columbus Carige Immobiliare SpA (99.98%) Savona 2000 Srl (6) (80.00%)Immobiliare Ettore Vernazza SpA (4) (90.00%) Assimilano Srl (6) (60.00%)
Recina Servizi Srl (6) (25.00%)
Immobiliare Carisa Srl 100.00%
TRUSTEE ACTIVITIES OTHER ACTIVITIES
Centro Fiduciario SpA (76.93%) 20.00% 4.00% Autostrada dei Fiori SpA (16.62%)
Banca Carige's share holding is shown in brackets.
(1) Quota calculated on the basis of odinary shares only.(2) The company, waiting for the authorization to the insertion in the Banking Group, was constituted on 7 th July 2003.(3) The company has a 0.02% holding in Columbus Carige Immobiliare SpA.(4) The company holds 10.00% of its own shares.(5) The company holds 1.69% of its own shares.(6) Insurance instrumental companies (insurance agencies).
SUBSIDIARIES ASSOCIATED COMPANIES
BASIS OF CONSOLIDATION

197
CONSOLIDATED BOARD OFDIRECTORS’ REPORT

198
INTRODUCTION
To the Shareholders of the Banca Carige Groupcompanies,
These consolidated financial statements havebeen prepared in accordance with Legislativedecree 87/92 in addition to the specificrequirements stated in the Bank of Italy’s rulingof 30/7/92 and subsequent modifications withregards to the accounting procedures to befollowed in the preparation of consolidatedbanking statements.The Bank has taken advantage of article 82 ofCONSOB’s ruling 11991 of 14/5/99 and theexemption contained therein with regards to thepublication of fourth quarter statements on thecondition that these consolidated annualstatements are made public no later than 90days after the close of the accounting period.This report includes the consolidated statementsat 31/12/03, 30/9/03, 31/12/02 and31/12/01 of the Banca Carige Group.
THE YEAR IN ITALY AND ABROAD
The world’s economy recorded improved growthduring 2003 in comparison to the previous year;GDP increased from 2.6% to 3%. This result wasdue principally to expansion in Asianeconomies, whilst the seven most industrialisedcountries, though also recording increases overthe previous twelve months, had final GDPfigures generally below the average. Differinglevels of economic expansion were typicallygenerated by expansionary economic policies(both in terms of monetary and fiscal policy) andpartial upturns in the performances of financialmarkets, which went some way in clawing backthe losses suffered during 2002. Reducedpolitical tension worldwide also helped thedevelopment of world trade. The dollar lostconsiderable ground against the euro so shiftingpurchasing power at world level.During 2003 the United States’ economyrose at 3%, higher than in 2002 (+2.2%).Recoveries in domestic consumption and
investment levels (especially in software andmachinery) in the second half of the year playedan important part. There was an increase inexports favoured by a weak dollar and a surgein demand from Asian markets. Inflation rose inannual terms at 2.3% and unemploymentremained basically unchanged at 6% (2002:5.8%).The improved economic and political climate ofthe second half of 2003 also helped theeconomies of the European MonetaryUnion (EMU) which, however, in annual termspaid the price of recession-like conditionsrecorded during the first six months of the year.Gross Domestic Product for the area was+0.5% in comparison to +0.8% in 2002. Inparticular, there was weak internal demand,characterised by low growth in both consumer(+1.2%) and public spending (+1.6%), andstrong export demand from Asia and easterncentral Europe. Inflation was down on theprevious year’s 2.2% to 2% at 31/12/03.Unemployment for the area rose slightly from8.4% to 8.8%., as a result of a generalisedworsening of the Union’s labour market. Theeuro/dollar rate at the end of the year was 1.25euros, an increase of 19.2% over December2002.In Italy, the economy experienced negativegrowth during the first half of the year to befollowed by a recovery in the second; a scenarioalready recorded in the previous year.Consequently the annual rise in GDP for 2003was 0.3%. What growth there was came fromrises in family spending and overall stability inexports thanks to rising demand from Asia andthe United States. These two factorscompensated for the significant erosion ofcompetitiveness that stemmed from the rise inthe euro against the US dollar. Investment levelscontinued to recorded negative results: inparticular, there were falls in investmentsdestined to manufacturing (-7.1%). The buildingsector, however, recorded an increase of 2.1%.Inflation levels in the country continued to becomparatively high with regards to othercountries in the EU. The average consumer priceindex for 2003 was 2.5% (2002: 2.4%). Risingprices accompanied the changeover to the euroand continued with increases in certain foodprices, particularly fruit and vegetables. Duringthe summer there was an apparent truce, butpressure returned in the last quarter.

199
Italy’s labour market on the basis of figuressupplied by the Italian national statistics institute(ISTAT) recorded a 0.9% increase inemployment in comparison to 1.2% in theprevious year. Expansion in sales-related jobswas of 1.5%. Unemployment was down from8.9% to 8.5%. The ‘two nations’ division,however, remains with considerable differencesin unemployment levels between the north andthe south of the country.Italian government PSBR at 31st December 2003was around 45 billion euros. Growth ingovernment revenues continued to be low, butwere supported by capital account takingsespecially from the sale of public sectorproperties. Initial estimates for the country’sdeficit/GDP ratio is around 3%; debt/GDP wasdown slightly from 106.7% to 106.6%.In Liguria, the economy reflected the difficultiesexperienced at international and national levels.There was a worsening in some of the region’sstructural problem areas, especially during thefirst half of the year, followed by a slightimprovement during the second half ininvestments after the significant falls in 2002,and in exports. The region’s GDP rose by 0.3%(no growth recorded in 2002) generated by arecovery in consumption, exclusively relating tospending on food, and in foreign trade. Therewere negative investment levels in the area ofmachinery and equipment, whilst increases wererecorded for the building and constructionsector. Port-related activities continued to rise,but the region’s tourist industry had a difficultyear. Employment levels continued to improve.On the business front, the number of firmsclassified as going concerns rose by 0.5% incomparison to the national average of 0.9% to136,463.
KEY EVENTS FOR THE BANCACARIGE GROUP IN 2003
Banca Carige’s strategy in recent years has beendeveloped so as to protect our autonomy andinfluence in the Italian banking industry.In order to achieve this aim, Banca Carige hasover the last ten years become the parentcompany of a group – the Banca Carige Group
– that is equipped to offer a wide range ofinnovative banking, finance, savings andpension solutions. (In this Report, the BancaCarige Group will be referred to also as ‘theGroup’).Banca Carige is:
- national, working from its traditionalstronghold of Liguria, the Group willcontinue to expand into new marketareas highlighting the need to recognisethe importance of creating strong tieswith the local community via anemphasis on a multi-local approach;
- retail, focusing on the family, smalland medium-sized businesses, and localauthorities;
- universal, in terms of the range ofborrowing and lending products, andservices offered by the Group;
- multi-channel, exploiting theopportunities offered by variousintegrated distribution solutions (real,remote, mobile);
- aggregation point for other smalland medium-sized banks with particularlocation, structural and managementcharacteristics whose inclusion in theGroup is compatible with the Group’sstrategic objectives.
During 2003, Carige continued with strategicmeasures designed to create long-term value forour shareholders via consolidated channels ofdevelopment: increases in operational capacity,profitability, and efficiency. These objectives willbe realised via well-established profiles: market(distribution and production structure); finance;organisation and human resources; informationand communication technology; capitalmanagement; relations with our internationalpartners; merger and acquisition.Significant progress was made in the realisationof these objectives during 2003. Further detailsare given in the section ‘Strategy’ of the Boardof Directors’ Report of Banca Carige SpA.With regards to the recent financial collapsessuffered by the Cirio and Parmalat Groups, thebanks of the Carige Group at all times operatedin full respect of banking best practices and atno time took part in consortia formed for theplacement of securities of the companies inquestion nor had access to price sensitiveinformation. The three banks of the CarigeGroup intend to assist their customers in theirattempts to recover savings by supporting

200
and/or promoting Italian Banking Association(ABI) initiatives in the matter.The principal operations carried out by theGroup leader Banca Carige include thepurchase from Ligure Leasing of almost its entireoutstanding leasing contract portfolio, with effect1st January 2003.On 13th January, Banca Carige was informed ofthe entry into its equity of Gefip Holding SA ofBrussels through an acquisition of 2.281% ofCarige’s share capital.On 31st March the Ordinary General Meeting ofthe Bank approved the financial statements for2002 and also selected Deloitte & Touche SpAas auditors for the annual and half-yearstatements. The same meeting appointed thenew Board with Mr Giovanni Berneschi asChairman.Following the meeting, on 14th April the Boardof Directors deliberated a thorough review of theBank’s existing organisational structure. As aresult, changes were made to the Bank’s topmanagement: the previous position of CEO wasreplaced by a General Manager (Mr AlfredoSanguinetto), and a new position of deputygeneral manager was added to the existing two;the three positions are: Mr Giovanni Poggio(Administration), Mr Carlo Arzani (Resources),and Mr Achille Tori (Market).With regards to collaboration with internationalPartners, measures were taken to improveCarige’s market position. With this in mind, theBoard of Directors deliberated during theirmeeting of 30th June 2003 that Banca Carigeassume the role of co-promoter together withother partners including Gefip Holding SA andILI SpA in the presentation of a project financingproposal for motorway links in the north east(Orte-Venice), and in Sicily (Catania-Siracusa),in addition to a proposal for the construction ofa motorway link between the A12 and A7motorways around Genoa.The strategic objectives of continuing both theprivatisation of the Bank (continuing reduction inthe Carige Foundation’s holding) andsupporting recent expansion with suitablefinancial resources were the subject of theBoard’s meeting of 16th June, during which itwas agreed to present to the Shareholders’Meeting the proposal of a share capitalincrease.This proposal was approved by the Meeting of10th September, which deliberated attributing tothe Board of Directors the right to raise fresh
equity by means of a paid-up share issue in theform of ordinary shares or savings shares as wellas in the form of bonds either convertible or withwarrant to be offered in option to shareholders.The total share capital increase, together withthe amount of shares that can originate onconversion of the total of convertible bonds,cannot exceed a nominal value of 250 millioneuros.In its meeting of 29th September, the Board ofDirectors deliberated as a part of the powersdelegated to it by the Meeting the raising offresh equity via the issue of 92,777,225 shareswith a nominal value of 1 euro each, and12,785,775 saving shares under option toshareholders on a basis of 1 new share for everyparcel of 11 shares of the same type previouslyheld. The same meeting also deliberated theissue of 40,821,979 convertible subordinatedbonds under option to shareholders on a basisof 1 bond for 25 securities of any category inpossession.On 23rd December the equity raising operationwas concluded with the full subscription of thesecurities issued. Consequently, Banca Carige’sshare capital at 31/12/03 amounted to euro1,113,326,839 made up by 959,897,518ordinary shares with a nominal value of euro 1each, and 153,429,321 convertible savingsshares with the same nominal value of euro 1each. During the same transaction, 40,821,979bonds were issued, convertible from 2006onwards into ordinary shares on a one-to-onebasis. Total funds raised by the issue amountedto 306 million.The strengthening of the Bank’s financialposition goes hand-in-hand with expansion;‘external’ growth via the acquisition ofstrategically significant banks or branchescontinued during 2003 with the signing byBanca Carige and Cassa di Risparmio di Firenzeof an agreement on 16th July for the purchasefrom Banca Intesa and the two Foundations ofthe banks concerned of the entire share capitalof Carinord 2, a holding controlling Cassa diRisparmio di Carrara and Cassa di Risparmio diSpezia. The purchase was the first step towardsreaching direct control on the part of BancaCarige and C.R. Firenze of, respectively, C.R.Carrara and C.R. Spezia. The transaction wascompleted on 16th January 2004 with BancaCarige’s acquiring a 41.05% stake in Carinord2 and with it control of C.R. Carrara in the formof a 90% holding.
201
‘Internal’ growth in the form of new branchopenings continued with two branches beingopened, one in Monza near Milan, and theother in the city of Genoa.There now follows details of the year’s principalevents for the Carige Group subsidiaries.The General Meeting of Cassa di Risparmiodi Savona SpA held on 8th May confirmedProf Bartolini and Mr Bissolotti as, respectively,Chairman and Deputy Chairman. Mr Oldrati,previously Deputy General Manager of BancaCarige, was appointed to the Savona bank’sBoard and took charge as Managing Director.The Savona bank opened two new branches inthe province of Cuneo, Piedmont.On 26th May the shareholders of Banca delMonte di Lucca SpA during their generalmeeting confirmed the positions of Mr LucianoCasapietra and Prof Giorgio Giorgetti as boardmembers; the former was also appointed DeputyChairman of the bank. Both Mr Casapietra andProf Giorgetti had been co-opted by the Boardof Directors during their meeting of 28th April inthe light of the resignations of the previousDeputy Chairman, Mr Sanguinetto, and boardmember Mr Remuzzi.On 27th March the general meetings of theGroup’s two insurance companies CarigeAssicurazioni SpA and Carige VitaNuova SpA deliberated an increase in thenumber of board members of each companyfrom 5 to 7; Mr Giorgio Somaschini wasappointed to both boards, taking charge asGeneral Manager of both companies. At thesame time, the Board of Directors of BancaCarige proposed the appointment of ProfGiorgio Giorgetti as member of bothcompanies’ boards proposing further that ProfGiorgetti be appointed Deputy Chairman ofCarige Vita Nuova.The extraordinary meetings of the two insurancecompanies held on 23rd June approved thecompanies’ new by-laws. During the generalmeeting of Carige Assicurazioni, theshareholders deliberated the acquisition of ownshares up to a maximum of 0.708% of sharecapital.The Board of Directors of Carige Assicurazioniduring their meeting of 15th Septemberproposed calling an extraordinary shareholders’meeting to transact a share capital increasefrom 102,520,800 euros to 137,872,800 eurosto be carried out by means of an ordinary shareissue of 36,000 shares with a nominal value of
982 euros and premium of 193; the issue willbe offered under option to shareholders on thebasis of 10 new shares every 29 ordinary sharesin possession.Following the extraordinary meeting’s resolutionof 15th September referred to above, BancaCarige exercised its option on 17,022 newshares for an overall amount of 20 million. Totalshare capital inclusive of an additional 30shares subscribed by other shareholders on 31st
December amounted to at year end 140.9million in comparison to 120.1 million at theend of 2002. The completion date for thetransaction in question is 31st March 2004.On 7th July 2003 Carige AssetManagement SGR SpA was formed with ashare capital of 5.2 million, 99.5% of whichheld by Banca Carige with the remaining 0.5%held by Carige Vita Nuova. An application wasmade for Bank of Italy authorisation to carry outasset management activities in the form of amanager trust (società per la gestione delrisparmio) both for the collective management ofsavings and the individual management ofinvestment portfolios, in addition to theenrolment of the company in the registry ofmanager trusts foreseen by article 35, section 1of the Consolidated Law regulating the area.Authorisation for the incorporation of CarigeAsset Management into the Banca CarigeGroup was also made.In parallel to the above, the Board of Directorsof Banca Carige selected the Group leader’srepresentatives on the Board of Directors andthe Board of Statutory Auditors of Carige AssetManagement. They are as follows: Chairman,Mr Alessandro Scajola; Deputy Chairman, MrGiovanni Berneschi; Chairman of the Board ofStatutory Auditors, Mr Andrea Traverso.On 24th July, Banca Carige entirely subscribedthe share capital increase carried out byColumbus Carige Immobiliare totalling5,164,5000 euros. Banca Carige’s share in thecompany consequently rose to 99.98%; theremaining amount of capital is held by theGroup subsidiary, Immobiliare GaleazzoOn 25th July, in accordance with thedeliberation of Banca Carige’s Board ofDirectors of 23rd June, the purchase of 25,000shares of Centro Fiduciario CF SpA (5% ofshare capital) from INVESP SpA (San Paolo IMIGroup) was formalised; the price paidcorresponding to the pro quota value of thecompany’s equity was 48,032 euros. Banca

202
Carige’s holding in Centro Fiduciario after theacquisition rose to 76.93%. Cassa di Risparmiodi Savona holds another 20%.On 30th June, Eptaconsors SpA left theBanca Carige Group following the sale ofCarige’s holding in the company (holding of20.24%) to the Sanpaolo-IMI Group. The pricereceived for the sale was 19.04 million.The total number of banking staff of the BancaCarige Group at 31/12/03 amounted to 4,354employees, 28.7% at head office and 71.3% inthe Group’s distribution network. At the samedate, there were 377 insurance employees.Details regarding the performance of Carigeshares are given in the Banca Carige Report(‘Carige Shares’).
INTERMEDIATION ACTIVITIES
The Banca Carige Group’s total assets at 31st
December 2003 amounted to 15,918.3 million,an increase of 3.4% in comparison to theprevious year.Total Financial Intermediation Activities(TFIA) reached 25,690.8 million, up 4.9% over2002. Of this total, 44.3% is in the form ofdirect deposits (customer deposits), whilst theremaining 55.7% is represented by indirectdeposits (other financial intermediationactivities).
TOTAL FINANCIAL INTERMEDIATION ACTIVITIES (millions of Euros)
Consolidated Change %31/12/03 30/9/03 31/12/02 31/12/01 2003 2002
Total (a+b) 25,690.8 25,478.1 24,488.1 22,262.0 4.9 10.0
Direct deposits (a) 11,373.9 11,090.2 10,558.2 9,377.2 7.7 12.6 % Total 44.3% 43.5% 43.1% 42.1%Indirect deposits (OFIA) (b) 14,316.9 14,387.9 13,929.9 12,884.8 2.8 8.1 % Total 55.7% 56.5% 56.9% 57.9% - Assets under management 7,436.7 7,359.7 6,842.9 6,421.6 8.7 6.6 % Total 28.9% 28.9% 27.9% 28.8% % OFIA 51.9% 51.2% 49.1% 49.8% - Assets in custody 6,880.2 7,028.2 7,087.0 6,463.2 -2.9 9.7 % Total 26.8% 27.6% 28.9% 29.0% % OFIA 48.1% 48.8% 50.9% 50.2%
Total deposits amounted to 12,897.4 million,an increase of 3.8% over the end of 2002.Direct deposits rose 7.7% in comparison tothe total recorded at the end of 2002 to11,373.9 million. There was a generalisedincrease over most items with the exception ofsale and repurchase agreements, andcertificates of deposit.Short-term deposits slipped 1.2% to 7,271.2million. Despite a 6.1% rise in current accountsthat brought the total up to 6,066.5 million, theshort-term deposits aggregate felt the effect of a60.6% fall in sale and repurchase agreements(total down to 254.1 million). Medium/long-term borrowing rose 28.2% to 4,102.7 million.Within this aggregate, bonds rose 29.5% to4,073.5 million.
By sector, direct deposits are distributedamongst households (68.6% of the total;4,706.4 million), and non financial firms andfamily businesses (18.7% of the total; 1,282.6million at 31/12/03; 17.7% and 1,219.1million at 31/12/02).Amounts owed to banks fell 31.4% from1,466.4 million to 1,006 million.Funds managed on behalf of thirdparties remained marginal at 0.4 million.Subordinated loans amounted to 517.1million and are made up principally by asubordinated loan issued by the Group leader inaddition to another 15 million in the form of asubordinated loan issued by Banca del Monte diLucca.

203
FUNDING (millions of euros)
Consolidated Change %
31/12/03 30/9/03 31/12/02 31/12/01 2003 2002
Total (a+b+c+d) 12,897.4 12,983.1 12,424.9 11,216.7 3.8 10.8
Direct deposits (a) 11,373.9 11,090.2 10,558.2 9,377.2 7.7 12.6-Amounts owed to customers 6,861.1 6,717.6 6,900.8 5,838.1 -0.6 18.2 current accounts 6,066.5 5,832.2 5,720.1 4,766.5 6.1 20.0 repurchase agreements 254.1 358.9 644.9 608.6 -60.6 6.0 saving deposits 534.6 521.3 531.1 451.0 0.7 17.8 loans - 0.2 0.8 3.4 -100.0 -76.5 other borrowings 5.9 5.0 3.9 8.6 51.3 -54.7 -Debts evidenced by certificates 4,512.8 4,372.6 3,657.4 3,539.1 23.4 3.3 bond certificates 4,073.5 3,921.2 3,146.6 2,943.4 29.5 6.9 certificates of deposits 351.4 370.4 429.5 515.1 -18.2 -16.6 outstanding cheques 88.0 81.0 81.3 80.6 8.2 0.9
-short term deposits 7,271.2 7,138.0 7,357.0 6,318.9 -1.2 16.4 % Total 63.9 64.4 69.7 67.4-long term deposits 4,102.7 3,952.2 3,201.2 3,058.3 28.2 4.7 % Total 36.1 35.6 30.3 32.6Amounts owed to credit institutions (b) 1,006.0 1,477.5 1,466.4 1,439.2 -31.4 1.9Deposits 612.0 1,045.3 1,148.4 1,122.3 -46.7 2.3Financing 374.0 330.6 274.1 289.1 36.4 -5.2 Current accounts 19.9 31.3 43.7 26.9 -54.5 62.5Repurchase agreements - 70.3 - - … … Others 0.1 - 0.2 0.9 - 50.0 - 77.8
Funds managed on behalf of third parties (c) 0.4 0.4 0.3 0.3 33.3 -
517.1 415.0 400.0 400.0 29.3 - Subordinated loans (d)
DIRECT DEPOSITS (1) - DISTRIBUTION BY SECTOR (millions of euros)
31/12/03 31/12/02 31/12/01% % %
Amounts owed to customers 6,861.1 6,900.8 5,838.1Public Administration 248.5 3.6% 193.0 2.8% 211.4 3.6%Financial institutions 281.0 4.1% 674.3 9.8% 298.0 5.1%Non-financial institutions and personal businesses 1,282.6 18.7% 1,219.1 17.7% 1,028.4 17.6%Private social bodies 252.2 3.7% 217.2 3.1% 310.8 5.3%Families 4,706.4 68.6% 4,505.9 65.3% 3,900.9 66.8%Total residents 6,770.7 98.7% 6,809.5 98.7% 5,749.5 98.5%Rest of the world 90.4 1.3% 91.3 1.3% 88.6 1.5%Total 6,861.1 100.0% 6,900.8 100.0% 5,838.1 100.0%
Debts evidenced by certificates 4,512.8 3,657.4 3,539.1
TOTAL DIRECT DEPOSITS 11,373.9 10,558.2 9,377.2
(1) Captions 20 and 30 of Liabilities and Stockholders' equity.

204
With regards to the geographical distribution ofthe Group’s direct deposits, Liguria continues tobe the primary source of deposits (74.8%) andalso absorbs the entirety of the Bank’s EMTNprogramme. However, the share of otherregions is increasing: in particular, Latium in thecentre of the country accounts for 5.6% of total
Group deposits followed by Sicily (4.3%),Lombardy (3.4%), Tuscany (3.3%), andPiedmont (2.9%). The share of total depositsrepresented by the Group’s other operatingregions is: Emilia Romagna (1.6%), Apulia(1.3%) and Veneto, Sardinia, Marches andUmbria all at below 1%.
DIRECT DEPOSITS (1) - GEOGRAPHICAL DISTRIBUTION (millions of euros)
31/12/03 31/12/02 31/12/01% % %
Liguria 8,492.6 74.8% 8,207.7 77.7% 7,784.6 83.0%Latium 635.0 5.6% 490.4 4.6% 144.9 1.5%Sicily 485.0 4.3% 436.8 4.1% 363.3 3.9%Lombardy 391.4 3.4% 345.7 3.3% 271.9 2.9%Tuscany 380.7 3.3% 291.7 2.8% 261.7 2.8%Piedmont 333.2 2.9% 258.0 2.4% 218.9 2.3%Emilia Romagna 185.2 1.6% 176.8 1.7% 145.1 1.5%Apulia 152.3 1.3% 118.3 1.1% 85.9 1.0%Veneto 117.1 1.0% 87.2 0.8% 46.3 0.5%Sardinia 95.1 0.8% 52.7 0.5% 30.2 0.3%Marches 52.7 0.5% 47.9 0.5% - - Umbria 19.9 0.2% 18.4 0.2% - - Total Italy 11,340.2 99.7% 10,531.6 99.7% 9,352.8 99.7%Abroad 33.7 0.3% 26.6 0.3% 24.4 0.3%Total 11,373.9 100.0% 10,558.2 100.0% 9,377.2 100.0%
(1) Balance Sheet (Liabilities) captions 20 and 30.
Indirect deposits (other financialintermediation activities) rose 2.8% to 14,316.9million. Within the aggregate, assets undermanagement increased 8.7% to 7,436.7 millionand assets in custody totalled 6,880.2 million (-2.9%).Within asset management, mutual fundsrose by 12.9% to 4.369.9 million; privatebanking was down 0.7% to 2,319.5 million andbancassurance rose 17.8% to 747.3 million.Insurance products sold by the Group’s banks
totalled 726 million, an increase of 16.5% incomparison to the end of the previous year.Despite an increase in critical mass, the 30.3%increase in accident premiums collected couldnot offset a 4.7% decrease in life assurancepremiums.Assets in custody includes Italian governmentsecurities, and other debt and capital securities.The former recorded a fall of 14.8% to 3,524.3million, whilst other capital and debt securitiesincreased their value by 13.8% to 3,355.9million.

205
INDIRECT DEPOSITS (millions of euros)
Change %
31/12/03 30/9/03 31/12/02 31/12/01 2003 2002
Total (a+b) 14,316.9 14,387.9 13,929.9 12,884.8 2.8 8.1
Assets under management (a) 7,436.7 7,359.7 6,842.9 6,421.6 8.7 6.6 - Mutual funds and unit trusts 4,369.9 4,351.5 3,872.1 3,470.0 12.9 11.6 - Private banking 2,319.5 2,297.3 2,336.2 2,419.7 -0.7 -3.5 including: Security management (1) 1,328.2 1,270.9 1,183.9 1,161.0 12.2 2.0 Mutual funds management 991.3 1,023.9 1,152.3 1,258.7 -14.0 -8.5 - Bancassurance products 747.3 710.9 634.6 531.9 17.8 19.3
Assets in custody (b) 6,880.2 7,028.2 7,087.0 6,463.2 -2.9 9.7 - Government securities 3,524.3 3,761.2 4,137.4 3,831.3 -14.8 8.0 - Others 3,355.9 3,267.0 2,949.6 2,631.9 13.8 12.1(1) The figure includes the entire securities portfolio of the insurance subsidiaries.
BANCASSURANCE (thousands of euros)
Var. %31/12/03 31/12/02 31/12/01 2003 2002
Life branch 726,019 623,417 525,387 16.5 18.7
Total prizes 151,139 157,407 102,040 -4.0 54.3
Life 147,157 154,351 98,792 -4.7 56.2- Carige Unit 10,307 44,080 - -76.6 … - Gestilink 28,609 31,704 62,619 -9.8 -49.4- Gestilink Plus 259 2,522 - -89.7 … - Risparmio assicurato 27,853 32,454 33,104 -14.2 -2.0- Carige Index 77,154 40,996 - 88.2 … - Vita assicurata 1,351 1,540 1,723 -12.3 -10.6- Previdenza attiva 801 923 1,080 -13.2 -14.5- Mutuo assicurato 823 132 266 523.5 -50.4
Accident 3,982 3,056 3,248 30.3 -5.9- Correntista sicuro 1,080 1,082 1,142 -0.2 -5.3- Auto assicurata 1,218 1,125 1,113 8.3 1.1- Casa assicurata 386 407 763 -5.2 -46.7- C/c assicurato 167 179 195 -6.7 -8.2- Famiglia Assicurata 546 263 35 107.6 651.4- Mutuo 100% 585 - - … …

206
INDIRECT DEPOSITS - DISTRIBUTION BY SECTOR (millions of euros)
31/12/03 31/12/02 31/12/01% % %
Public Administration 175.7 1.2% 151.3 1.1% 181.1 1.4%Financial institutions 1,562.3 10.9% 1,449.4 10.4% 811.6 6.3%Non-financial institutions and personal businesses 626.2 4.4% 581.0 4.2% 815.7 6.3%Private social bodies 110.1 0.8% 115.3 0.8% 73.3 0.6%Families 11,804.6 82.4% 11,610.2 83.3% 10,987.1 85.3%Total residents 14,279.0 99.7% 13,907.2 99.8% 12,868.8 99.9%Rest of the world 37.9 0.3% 22.7 0.2% 16.0 0.1%Total 14,316.9 100.0% 13,929.9 100.0% 12,884.8 100.0%
Households account for 82.4% of the aggregatetotal at 11.804.6 million, a share that has,however, been falling since 2001.Indirect deposits are concentrated in Liguria(82%). The share of some of the Group’s otheroperating regions fell during the year: Latiumfrom 4.25 to 3.9%, Lombardy from 4.2% to2.8%, Marches from 0.9% to 0.7%, Veneto from
0.8% to 0.7%, and Umbria from 0.3% to 0.2%.The Group’s other operating regions remainedunchanged. The fall recorded in certain areas isin part due to the process of converting intodirect deposits those bonds reaching maturityissued by the previous owners of the 124branches acquired between 2000 and 2002.
INDIRECT DEPOSITS - GEOGRAPHICAL DISTRIBUTION (millions of euros)
31/12/03 31/12/02 31/12/01% % %
Liguria 11,731.3 82.0% 11,143.7 80.0% 10,772.8 83.6%Latium 554.7 3.9% 589.9 4.2% 136.7 1.1%Lombardy 407.7 2.8% 395.7 2.8% 389.3 3.0%Sicily 407.3 2.8% 580.3 4.2% 652.5 5.1%Piedmont 370.2 2.6% 365.6 2.6% 249.3 1.9%Tuscany 286.3 2.0% 285.5 2.0% 283.0 2.2%Emilia Romagna 180.9 1.3% 166.3 1.2% 173.9 1.3%Marches 107.1 0.7% 121.4 0.9% - - Veneto 106.7 0.7% 115.0 0.8% 108.0 0.8%Apulia 94.7 0.7% 97.6 0.7% 97.0 0.8%Umbria 32.4 0.2% 40.0 0.3% - - Sardinia 30.4 0.2% 21.3 0.2% 11.4 0.1%Total Italy 14,309.7 99.9% 13,922.3 99.9% 12,873.9 99.9%Abroad 7.2 0.1% 7.6 0.1% 10.9 0.1%Total indirect deposits 14,316.9 100.0% 13,929.9 100.0% 12,884.8 100.0%
The Group’s total lending reached 13,573.9million at the end of 2003, up 3.9% over 2002.Lending to customers amounted to10,251.3 million, an increase of 8%; afterwritedowns the aggregate moved totalled10,091.5 million (+7.8%).In terms of product, there was a significantincrease in mortgages (+16.2%; 4,925.4
million). The increase in other credit forms(273.9 million; +145.9%) was due to anincrease in interest-bearing postal bonds from61 to 211 million. Parabanking credits rose by8.4% to 787.1 million, principally due toincreased leasing activity (+9.2%). There werefalls in current account lending forms (3,605.8

207
million; -5.2%) and in the portfolio (316.1million; -7.3%).Bad loans amounted to 328 million; the badloans/lending ratio for the year was 3.2% (1.9%excluding revaluations).Bad loans are concentrated amongst nonfinancial and family businesses: 59.5 % of the
aggregate for a total of 6,109.7 million; thissector is followed by households (23.2%;2,376.3 million). The manufacturing branch ofnon finance and family businesses most at riskcontinues to be services to trade, salvage andrepairs, which absorbs 12.8% of the Group’stotal bad loans for a total of 1,314.4 million.
LENDING (millions of euros)
Consolidated Change %31/12/03 30/9/03 31/12/02 31/12/01 2003 2002
Total (a+b+c) 13,573.9 13,698.8 13,068.7 12,144.0 3.9 7.6
Loans to customers (a) 10,091.5 9,637.6 9,360.8 8,175.6 7.8 14.5-Gross value (1) 10,251.3 9,794.7 9,495.1 8,341.4 8.0 13.8 . Current accounts 3,605.8 3,547.6 3,803.0 3,198.4 -5.2 18.9 . Discounted notes 316.1 285.7 341.0 256.2 -7.3 33.1 . Mortgages 4,925.4 4,605.0 4,238.0 3,407.5 16.2 24.4 . Parabanking (2) 787.1 763.1 726.4 595.6 8.4 22.0 - leasing 683.7 663.1 625.9 462.5 9.2 35.3 - factoring 99.2 95.8 96.2 126.6 3.1 -24.0 - consumer credit loans 4.2 4.2 4.3 6.5 -2.3 -33.8 . Loans backed by pledged assets 15.0 15.4 14.4 13.4 4.2 7.5 . Others 273.9 265.1 111.4 571.5 145.9 -80.5
-short term loans 3,484.9 3,410.6 3,503.5 3,610.8 -0.5 -3.0 -long term loans 6,438.5 6,071.3 5,730.7 4,431.8 12.4 29.3
. Bad loans 328.0 312.8 260.9 298.8 25.7 -12.7
-Specific allowances for 159.8 157.1 134.3 165.8 19.0 -19.0 loan lossesLoans to banks (b) 918.4 1,343.0 1,320.2 1,167.7 -30.4 13.1-Gross value 922.3 1,352.0 1,328.1 1,175.1 -30.6 13.0 . Compulsory reserves 114.3 73.0 163.1 174.9 -29.9 -6.7 . Deposits 725.5 965.7 963.7 737.3 -24.7 30.7 . Current accounts 41.2 37.2 85.5 105.6 -51.8 -19.0 . Repurchase agreements - 21.8 19.4 - -100.0 … . Other loans 23.8 231.8 74.7 157.3 -68.1 -52.5
. Bad loans 17.5 22.5 21.7 - -19.4 …
-Specific allowances for loan losses ( 3.9 9.0 7.9 7.4 -50.6 6.8
Securities (c) 2,564.0 2,718.2 2,387.7 2,800.7 7.4 -14.7-Government securities 1,242.9 1,685.7 1,443.9 1,598.3 -13.9 -9.7-Other securities 1,143.2 855.7 743.3 1,104.5 53.8 -32.7-Shares and equity securities 177.9 176.8 200.5 97.9 -11.3 104.8
(1 Including bad loans.(2) Including leased fixed-assets (669.8 million at 31/12/2003, 614.3 million at 31/12/2002).

208
LOANS TO CUSTOMERS (1) - DISTRIBUTION BY SECTOR (millions of euros)
31/12/03 31/12/02 31/12/01% % %
Public Administration 1,177.1 11.5% 1,046.1 11.0% 901.0 11.0%Financial institutions 275.6 2.7% 560.0 5.9% 890.6 5.9%Non-financial and personal businesses 6,109.7 59.5% 5,850.5 61.7% 5,061.5 61.7%
Agriculture, farming and fishing 87.1 0.9% 95.9 1.0% 86.3 1.0%Energy products 211.8 2.1% 229.3 2.4% 170.0 2.4%Mineral and ferrous metals and non ferrous 100.7 1.0% 122.1 1.3% 98.6 1.3%Mineral and non metallic products 96.3 0.9% 98.1 1.0% 106.9 1.0%Chemical products 75.5 0.7% 75.4 0.8% 62.9 0.8%Metal products 197.9 1.9% 163.1 1.7% 143.3 1.7%Agricultural and industrial machinery 140.9 1.4% 156.7 1.7% 160.6 1.7%Office equipment 29.7 0.3% 31.7 0.3% 29.9 0.3%Electrical supplies 93.6 0.9% 108.0 1.1% 111.6 1.1%Means of transport 70.0 0.7% 91.1 1.0% 93.4 1.0%Food, drink, tobacco 216.1 2.1% 185.3 2.0% 148.8 2.0%Textiles, leather goods, clothing 97.1 1.0% 83.8 0.9% 72.9 0.9%Paper, printing and publishing 84.8 0.8% 89.5 0.9% 78.1 0.9%Rubber and plastic goods 63.4 0.6% 70.2 0.7% 60.4 0.7%Other industrial products 109.7 1.1% 106.1 1.1% 97.7 1.1%Building and public works 862.0 8.4% 974.6 10.3% 908.6 10.3%Wholesale & retail trade, salvage and repairs 1,183.3 11.5% 1,121.6 11.8% 1,026.9 11.8%Hotel and catering services 319.8 3.1% 311.0 3.3% 244.9 3.3%Transport services 146.7 1.4% 138.9 1.5% 126.3 1.5%Air and sea transport-related services 329.7 3.2% 390.0 4.1% 319.1 4.1%Transport-related services 265.6 2.6% 251.7 2.7% 187.6 2.7%Communications-related services 13.6 0.1% 61.8 0.7% 10.0 0.7%Sales-related services 1,314.4 12.8% 894.6 9.4% 716.7 9.4%
Private social bodies 36.7 0.4% 34.3 0.4% 28.4 0.4%Families 2,376.3 23.2% 1,739.5 18.2% 1,330.3 18.2%Total residents 9,975.4 97.3% 9,230.4 97.2% 8,211.8 97.2%Rest of the world 275.9 2.7% 264.7 2.8% 129.6 2.8%Total 10,251.3 100.0% 9,495.1 100.0% 8,341.4 100.0%
(1) Balance Sheet (Assets) caption 40 inclusive of expected losses and leasing.
Liguria continues to account for the majority ofthe Group’s lending activities, receiving 62.9%of credits granted. However, with the extensionof the Group’s operations outside Liguria,logically the share represented by the Group’s
other operating regions has increased. Inparticular, Lombardy’s share rose by 12.1%. Theshare of Marches and Umbria, recent entries tothe Group’s distribution network, was of 1.2%and 0.8%, respectively.

209
LOANS TO CUSTOMERS (1) - GEOGRAPHIC DISTRIBUTION (millions of euros)
31/12/03 31/12/02 31/12/01% % %
Liguria 6,434.1 62.9% 6,083.5 64.2% 5,910.7 70.8%Lombardy 1,242.0 12.1% 1,049.6 11.1% 803.4 9.6%Emilia Romagna 556.4 5.4% 542.7 5.7% 522.9 6.3%Piedmont 495.1 4.8% 458.2 4.8% 429.7 5.2%Tuscany 387.2 3.8% 319.0 3.4% 277.8 3.3%Latium 379.2 3.7% 315.7 3.3% 74.1 0.9%Sicily 166.1 1.6% 155.0 1.6% 96.3 1.2%Veneto 146.6 1.4% 165.3 1.7% 102.1 1.2%Marches 122.1 1.2% 134.8 1.4% - - Umbria 82.4 0.8% 94.9 1.0% - - Apulia 78.5 0.8% 61.5 0.6% 46.9 0.6%Sardinia 74.7 0.7% 41.7 0.4% 15.2 0.2%Total Italy 10,164.4 99.2% 9,421.9 99.2% 8,279.1 99.3%Abroad 86.9 0.8% 73.2 0.8% 62.3 0.7%Total loans to customer 10,251.3 100.0% 9,495.1 100.0% 8,341.4 100.0%
(1) Balance Sheet (Assets) caption 40 inclusive of expected losses and leasing.
Lending to banks totalled 922.3 million at31st December 2002, a fall of 30.6%. TheGroup’s net interbank balance (amountsowed to banks – lending to banks) was negativeat the end of the year at 83.7 million (2002:138.3 million).The value of the Group’s securities portfoliorose by 7.45 to 2,564 million. The investmentsecurities portfolio totalled 215.7 million, down10.9% as a result of the sale of certain securitiescarried out by Banca Carige (deliberation of theBoard of Directors of 28th October 2003) as
part of liquidity raising required by the Groupleader’s expansion strategy.Potential capital gains present in the securitiesportfolio amount to 62.7 million, of which 45.1million relate to derivatives. Potential lossesamount to 0.3 million, exclusively present in theinvestment securities portfolio.The notional value of outstanding derivativecontracts totalled 5,933.2 million, the majorityof which do not foresee principal exchange. TheGroup’s prudent use of these instruments isreflected by the fact that 84.9% of the total is inthe form of hedging or balanced contracts.

210
DERIVATIVES CONTRACTS AT 31/12/2003 - CONSOLIDATED (millions of euros)
Principal (1) Hedging Trading Totalbalanced open-ended Total
contracts (5) contracts (6)
- Forwards (2) - - - - - - Swaps (3) 2,626.8 1,195.6 515.5 1,711.1 4,337.9 - Futures - - 21.4 21.4 21.4 - Securities options 122.0 2.8 102.5 105.3 227.3 - Interest rate options (4) 626.2 346.7 49.1 395.8 1,022.0 - Exchange-rate options - 109.6 - 109.6 109.6 - Credit default product 10.0 - 205.0 205.0 215.0Total 3,385.0 1,654.7 893.5 2,548.2 5,933.2 - with exchange of principal 284.2 109.6 323.2 432.8 717.0 - without exchange of principal 3,100.8 1,545.1 570.3 2,115.4 5,216.2
(1) Principal relative to basis swaps is stated once.(2) Includes forward rate agreements.(3) Includes basis swaps, interest rate swaps, overnight indexed swaps and cross currency swaps.(4) Includes interest rate caps.(5) Contracts matched by contracts of same characteristics so giving the Group full cover against interest and exchange-rate risk.(6) Contracts entailing exposure to interest and exchange-rate risk.
Total risk aggregates relating to cashcredits and guarantees and commitmentsreached 616.6 million at the end of the year, anincrease of 15.2% over 2002.The negative economic climate of the lastcouple of years has led to a worsening of creditquality levels for the Group: the percentage oftotal credits represented by total cash credits atrisk rose from 4.6% to 5.2%. Taking intoaccount lending to customers, the ratio of riskaggregates/total lending rises from 5% in 2002to 5.5%. Total cash credits at risk amounted to584.8 million, an increase of 16.9% over 2002.There was a fall in guarantees and commitmentsat risk of 20.2% to 23.2 million. Within the
aggregate of cash credits at risk, Parmalat-related items totalled 23.5 million.Expected credit losses for the Group arecalculated on the basis of an analyticalvaluation of bad loans, rescheduled loans,underlying credit positions in leasing contracts,and significant watchlist positions. Remainingwatchlists are assigned lump-sum provisions asapplied for expected losses.Expected losses for the Group amounted to170.1 million at 31st December 2003, anincrease of 14.9% over the previous year; 12.6million of the total refers to lending granted tothe Parmalat Group.

211
CREDITS AT RISK AND TOTAL ALLOWANCES (thousands of euros)
31/12/2003 30/09/2003Cash Guarantees and Leased Total Cash Guarantees and Leased Totalcredits commitments assets credits commitments assets
Bad loans 345,436 13,088 - 358,524 335,282 13,493 - 348,775Watchlists 212,714 10,069 - 222,783 206,362 8,584 - 214,946Country risk 12,466 5 - 12,471 12,500 617 - 13,117Rescheduled loans 14,123 - - 14,123 10,778 - - 10,778Bad leased assets - - 8,138 8,138 - - 6,971 6,971Total credits at risks 584,739 23,162 8,138 616,039 564,922 22,694 6,971 594,587
Specific allowances 163,698 4,124 2,276 170,098 166,050 3,717 1,905 171,672
Total allowances 183,695 4,124 2,276 190,095 180,694 3,717 1,905 186,316 - Specific allowances for loan losses 163,698 - - 163,698 166,050 - - 166,050 - Specific allowances for guarantees and commitments - 4,124 - 4,124 - 3,717 - 3,717 - Specific allowances for leased assets - - 2,276 2,276 - - 1,905 1,905 - General allowances for loan losses 19,997 - - 19,997 14,644 - - 14,644
31/12/2002 31/12/2001Cash Guarantees and Leased Total Cash Guarantees and Leased Totalcredits commitments assets credits commitments assets
Bad loans 282,626 18,113 - 300,739 298,809 11,773 - 310,582Watchlists 188,687 10,207 - 198,894 186,627 12,687 - 199,314Country risk 19,488 687 - 20,175 35,119 1,575 - 36,694Rescheduled loans 9,315 - - 9,315 7,902 - - 7,902Bad leased assets - - 6,018 6,018 - - 3,979 3,979Total credits at risks 500,116 29,007 6,018 535,141 528,457 26,035 3,979 558,471
Specific allowances 142,180 4,551 1,240 147,971 173,206 4,807 1,281 179,294
Total allowances 156,824 4,551 1,240 162,615 179,915 4,807 1,281 186,003 - Specific allowances for loan losses 142,180 - - 142,180 173,207 - - 173,207 - Specific allowances for guarantees and commitments - 4,551 - 4,551 - 4,807 - 4,807 - Specific allowances for leased assets - - 1,240 1,240 - - 1,281 1,281 - General allowances for loan losses 14,644 - - 14,644 6,708 - - 6,708
Bad loans closed the year at 358.5 million(+19.2%), of which 345.4 million were in theform of cash credits and 13.1 million inguarantees and commitments.The Group’s bad loans/lending (cash credits toretail customers) moved from 2.7% at 31/12/02to 3.1%.Watchlist positions rose 12% over the figurerecorded at the end of 2002.
Country risks amounted to 12.5 million,down 38.2%. Rescheduled loans rose51.6% to 14.1 million.Aggregates at risk related to leasingincreased 35.2% to 8.1 million, of whichallowances for expected losses totalled 2.3million.
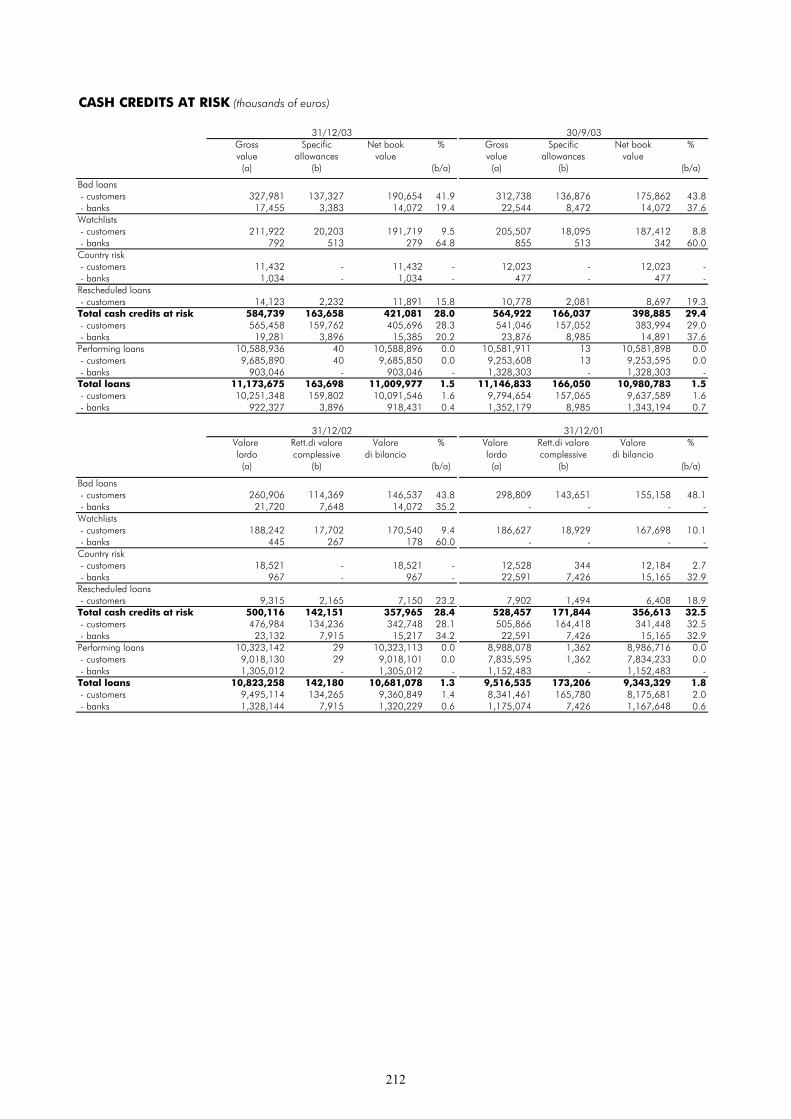
212
CASH CREDITS AT RISK (thousands of euros)
31/12/03 30/9/03Gross Specific Net book % Gross Specific Net book %value allowances value value allowances value(a) (b) (b/a) (a) (b) (b/a)
Bad loans- customers 327,981 137,327 190,654 41.9 312,738 136,876 175,862 43.8- banks 17,455 3,383 14,072 19.4 22,544 8,472 14,072 37.6Watchlists- customers 211,922 20,203 191,719 9.5 205,507 18,095 187,412 8.8- banks 792 513 279 64.8 855 513 342 60.0Country risk- customers 11,432 - 11,432 - 12,023 - 12,023 - - banks 1,034 - 1,034 - 477 - 477 - Rescheduled loans- customers 14,123 2,232 11,891 15.8 10,778 2,081 8,697 19.3Total cash credits at risk 584,739 163,658 421,081 28.0 564,922 166,037 398,885 29.4- customers 565,458 159,762 405,696 28.3 541,046 157,052 383,994 29.0- banks 19,281 3,896 15,385 20.2 23,876 8,985 14,891 37.6Performing loans 10,588,936 40 10,588,896 0.0 10,581,911 13 10,581,898 0.0- customers 9,685,890 40 9,685,850 0.0 9,253,608 13 9,253,595 0.0- banks 903,046 - 903,046 - 1,328,303 - 1,328,303 - Total loans 11,173,675 163,698 11,009,977 1.5 11,146,833 166,050 10,980,783 1.5- customers 10,251,348 159,802 10,091,546 1.6 9,794,654 157,065 9,637,589 1.6- banks 922,327 3,896 918,431 0.4 1,352,179 8,985 1,343,194 0.7
31/12/02 31/12/01Valore Rett.di valore Valore % Valore Rett.di valore Valore %lordo complessive di bilancio lordo complessive di bilancio(a) (b) (b/a) (a) (b) (b/a)
Bad loans- customers 260,906 114,369 146,537 43.8 298,809 143,651 155,158 48.1- banks 21,720 7,648 14,072 35.2 - - - - Watchlists- customers 188,242 17,702 170,540 9.4 186,627 18,929 167,698 10.1- banks 445 267 178 60.0 - - - - Country risk- customers 18,521 - 18,521 - 12,528 344 12,184 2.7- banks 967 - 967 - 22,591 7,426 15,165 32.9Rescheduled loans- customers 9,315 2,165 7,150 23.2 7,902 1,494 6,408 18.9Total cash credits at risk 500,116 142,151 357,965 28.4 528,457 171,844 356,613 32.5- customers 476,984 134,236 342,748 28.1 505,866 164,418 341,448 32.5- banks 23,132 7,915 15,217 34.2 22,591 7,426 15,165 32.9Performing loans 10,323,142 29 10,323,113 0.0 8,988,078 1,362 8,986,716 0.0- customers 9,018,130 29 9,018,101 0.0 7,835,595 1,362 7,834,233 0.0- banks 1,305,012 - 1,305,012 - 1,152,483 - 1,152,483 - Total loans 10,823,258 142,180 10,681,078 1.3 9,516,535 173,206 9,343,329 1.8- customers 9,495,114 134,265 9,360,849 1.4 8,341,461 165,780 8,175,681 2.0- banks 1,328,144 7,915 1,320,229 0.6 1,175,074 7,426 1,167,648 0.6

213
CREDIT COMMITMENTS (thousands of euros)
31/12/03 30/9/03Nominal Specific % Nominal Specific %
value allowances value allowances(a) (b) (b/a) (a) (b) (b/a)
Bad loans 13,088 4,124 31.5 13,493 3,717 27.5Watchlists 10,069 - - 8,584 - - Country risk 5 - - 617 - - Total guarantees andcommitments at risk 23,162 4,124 17.8 22,694 3,717 16.4Performing guaranteesand commitments 1,244,339 - - 1,368,268 - - Total guarantees andcommitments 1,267,501 4,124 0.3 1,390,962 3,717 0.3
31/12/02 31/12/01Nominal Specific % Nominal Specific %
value allowances value allowances(a) (b) (b/a) (a) (b) (b/a)
Bad loans 18,113 4,551 25.1 11,773 4,335 36.8Watchlists 10,207 - - 12,687 - - Country risk 687 - - 1,575 473 30.0Total guarantees andcommitments at risk 29,007 4,551 15.7 26,035 4,808 18.5Performing guaranteesand commitments 1,278,376 - - 1,181,810 - - Total guarantees andcommitments 1,307,383 4,551 0.3 1,207,845 4,808 0.4
Bad loans are concentrated amongst nonfinancial and family businesses (243 million;74.1% of the total) followed by households(56.6 million; 17.3% of the total). The mostsignificant branches of the non-financial andfamily business sector are building and publicworks (71.1 million; 21.7% of the total) andservices to trade, salvage and repairs ( 50.7million; 15.5% of the total).The bad loans/total lending ratio reveals thatthe sector most at risk for the Group is the non-
financial and family business sector at 4%.Although the sectors of private social bodies,financial firms, and non-residents have higherlevels (5.1%, 5% and 4.6%, respectively), badloans of each represent respectively 0.6%, 4.2%and 3.9% of the Group’s total bad loans.Branches with the highest concentration of creditrisk measured in terms of the same ratio arefood and drink (15.1%) and building and publicworks (8.2%).

214
BAD LOANS (1) - DISTRIBUTION BY SECTOR (thousands of euros)
31/12/03 31/12/02 31/12/01% % %
Public Administration 23 0.0% 21 0.0% 23 0.0%Financial institutions 13,720 4.2% 11,497 4.4% 10,681 3.6%Non-financial and personal businesses 242,980 74.1% 190,762 73.1% 221,135 74.0%
Agriculture, farming and fishing 2,829 0.9% 3,303 1.3% 4,103 1.4%Energy products 237 0.1% 177 0.1% 279 0.1%Mineral and ferrous metals and non ferrous 1,592 0.5% 283 0.1% 332 0.1%Mineral and non metallic products 4,767 1.5% 4,055 1.6% 3,861 1.3%Chemical products 837 0.3% 983 0.4% 829 0.3%Metal products 8,965 2.7% 6,700 2.6% 7,998 2.7%Agricultural and industrial machinery 4,817 1.5% 6,723 2.6% 15,180 5.1%Office equipment 883 0.3% 1,358 0.5% 786 0.3%Electrical supplies 2,153 0.7% 3,060 1.2% 3,822 1.3%Means of transport 2,303 0.7% 2,510 1.0% 1,575 0.5%Food, drink, tobacco 32,703 10.0% 8,901 3.4% 9,208 3.1%Textiles, leather goods, clothing 6,790 2.1% 5,072 1.9% 5,376 1.8%Paper, printing and publishing 2,094 0.6% 1,397 0.5% 1,836 0.6%Rubber and plastic goods 2,364 0.7% 2,434 0.9% 2,587 0.9%Other industrial products 3,314 1.0% 3,175 1.2% 3,277 1.1%Building and public works 71,101 21.7% 66,849 25.6% 59,835 20.0%Wholesale & retail trade, salvage and repairs 50,713 15.5% 42,188 16.2% 53,927 18.0%Hotel and catering services 9,803 3.0% 7,989 3.1% 11,087 3.7%Transport services 5,780 1.8% 6,293 2.4% 8,188 2.7%Air and sea transport-related services 131 0.0% 79 0.0% 134 0.0%Transport-related services 2,039 0.6% 1,684 0.6% 919 0.3%Communications-related services 67 0.0% 219 0.1% 211 0.1%Sales-related services 26,698 8.1% 15,330 5.9% 25,785 8.6%
Private social bodies 1,884 0.6% 1,244 0.5% 1,506 0.5%Families 56,644 17.3% 45,794 17.6% 53,945 18.1%Total residents 315,251 96.1% 249,318 95.6% 287,290 96.1%Rest of the world 12,730 3.9% 11,588 4.4% 11,519 3.9%Total 327,981 100.0% 260,906 100.0% 298,809 100.0%
(1) Inclusive of expected losses.
BAD LOANS/LENDING RATIO (1) - DISTRIBUTION BY SECTOR
Public Administration 0.0% 0.0% 0.0%Financial institutions 5.0% 2.1% 1.2%Non-financial and personal businesses 4.0% 3.3% 4.4%
- including (2):Sales-related services 2.0% 1.7% 3.6%Wholesale & retail trade, salvage and repairs 4.3% 3.8% 5.3%Building and public works 8.2% 6.9% 6.6%Air and sea transport-related services 0.0% 0.0% 0.0%Hotel and catering services 3.1% 2.6% 4.5%
Private social bodies 5.1% 3.6% 5.3%Families 2.4% 2.6% 4.1%Total residents 3.2% 2.7% 3.5%Rest of the world 4.6% 4.4% 8.9%Total 3.2% 2.7% 3.6%
(1) Inclusive of expected losses.(2) Principal branches of the economy in terms of overall credit exposure.
31/12/2002 31/12/200131/12/2003
The Group’s traditional operating area, Liguria,absorbs 57.3% of bad loans, five percent downon 2002. Outside Liguria, Emilia Romagnaaccounts for 13.2%, followed by Piedmont
(8.5%), Lombardy (7.6%) and Tuscany (5.2%).The Group’s other operating areas representmarginal levels.

215
BAD LOANS (1) - GEOGRAPHIC DISTRIBUTION (thousands of euros)
31/12/03 31/12/02 31/12/01% % %
Liguria 187,486 57.2% 162,848 62.5% 202,509 67.9%Emilia Romagna 43,089 13.2% 19,911 7.6% 23,133 7.7%Piedmont 27,914 8.5% 25,642 9.8% 26,706 8.9%Lombardy 25,057 7.6% 15,621 6.0% 13,794 4.6%Tuscany 17,169 5.2% 16,956 6.5% 16,181 5.4%Sicily 6,704 2.0% 5,675 2.2% 4,447 1.5%Veneto 3,886 1.2% 852 0.3% 895 0.3%Apulia 2,362 0.7% 986 0.4% - - Latium 2,099 0.6% 809 0.3% 19 - Marches 286 0.1% - - - - Umbria 133 0.0% - - - - Sardinia 90 0.0% 60 0.0% - - Total Italy 316,275 96.5% 249,360 95.6% 287,684 96.3%Abroad 11,706 3.6% 11,546 4.4% 11,125 3.7%Total 327,981 100.1% 260,906 100.0% 298,809 100.0%
(1) Inclusive of expected losses.
Risk levels in terms of the bad loans/lendingratio are low in most of the Group’s operatingareas, with the exception of Carige’s one foreignbranch in Nice (13.5%), and Emilia Romagna(7.7%), in the wake of the collapse of the
Parmalat group. In the other regions, the badloans/total lending ratio is highest in Piedmont(5.6%), Tuscany (4.4%) and Sicily (4%).
BAD LOANS / LENDING RATIO (1) - GEOGRAPHIC DISTRIBUTION
31/12/03 31/12/02 31/12/01
Emilia Romagna 7.7% 3.7% 4.4%Piemonte 5.6% 5.6% 6.2%Toscana 4.4% 5.3% 5.8%Sicilia 4.0% 3.7% 4.6%Puglia 3.0% 1.6% - Liguria 2.9% 2.7% 3.4%Veneto 2.7% 0.5% 0.9%Lombardia 2.0% 1.5% 1.7%Latium 0.6% 0.3% - Marches 0.2% - … Umbria 0.2% - … Sardinia 0.1% 0.1% - Total Italy 3.1% 2.6% 3.5%Abroad 13.5% 15.8% 17.9%Total 3.2% 2.7% 3.6%
(1) Inclusive of expected losses.
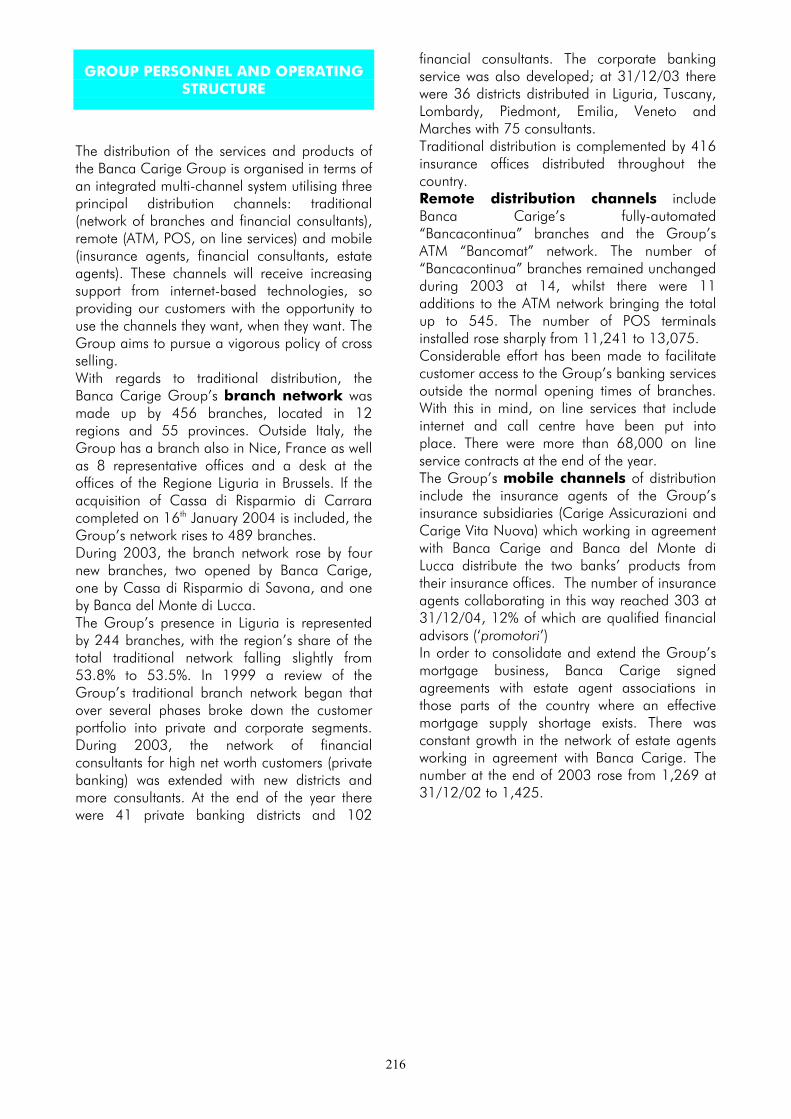
216
GROUP PERSONNEL AND OPERATINGSTRUCTURE
The distribution of the services and products ofthe Banca Carige Group is organised in terms ofan integrated multi-channel system utilising threeprincipal distribution channels: traditional(network of branches and financial consultants),remote (ATM, POS, on line services) and mobile(insurance agents, financial consultants, estateagents). These channels will receive increasingsupport from internet-based technologies, soproviding our customers with the opportunity touse the channels they want, when they want. TheGroup aims to pursue a vigorous policy of crossselling.With regards to traditional distribution, theBanca Carige Group’s branch network wasmade up by 456 branches, located in 12regions and 55 provinces. Outside Italy, theGroup has a branch also in Nice, France as wellas 8 representative offices and a desk at theoffices of the Regione Liguria in Brussels. If theacquisition of Cassa di Risparmio di Carraracompleted on 16th January 2004 is included, theGroup’s network rises to 489 branches.During 2003, the branch network rose by fournew branches, two opened by Banca Carige,one by Cassa di Risparmio di Savona, and oneby Banca del Monte di Lucca.The Group’s presence in Liguria is representedby 244 branches, with the region’s share of thetotal traditional network falling slightly from53.8% to 53.5%. In 1999 a review of theGroup’s traditional branch network began thatover several phases broke down the customerportfolio into private and corporate segments.During 2003, the network of financialconsultants for high net worth customers (privatebanking) was extended with new districts andmore consultants. At the end of the year therewere 41 private banking districts and 102
financial consultants. The corporate bankingservice was also developed; at 31/12/03 therewere 36 districts distributed in Liguria, Tuscany,Lombardy, Piedmont, Emilia, Veneto andMarches with 75 consultants.Traditional distribution is complemented by 416insurance offices distributed throughout thecountry.Remote distribution channels includeBanca Carige’s fully-automated“Bancacontinua” branches and the Group’sATM “Bancomat” network. The number of“Bancacontinua” branches remained unchangedduring 2003 at 14, whilst there were 11additions to the ATM network bringing the totalup to 545. The number of POS terminalsinstalled rose sharply from 11,241 to 13,075.Considerable effort has been made to facilitatecustomer access to the Group’s banking servicesoutside the normal opening times of branches.With this in mind, on line services that includeinternet and call centre have been put intoplace. There were more than 68,000 on lineservice contracts at the end of the year.The Group’s mobile channels of distributioninclude the insurance agents of the Group’sinsurance subsidiaries (Carige Assicurazioni andCarige Vita Nuova) which working in agreementwith Banca Carige and Banca del Monte diLucca distribute the two banks’ products fromtheir insurance offices. The number of insuranceagents collaborating in this way reached 303 at31/12/04, 12% of which are qualified financialadvisors (‘promotori’)In order to consolidate and extend the Group’smortgage business, Banca Carige signedagreements with estate agent associations inthose parts of the country where an effectivemortgage supply shortage exists. There wasconstant growth in the network of estate agentsworking in agreement with Banca Carige. Thenumber at the end of 2003 rose from 1,269 at31/12/02 to 1,425.

217
BRANCH NETWORK
A) BRANCHES31/12/03 30/9/03 31/12/02 31/12/01
number Q% number Q% number Q% number Q%NORTH-WEST ITALY 314 68.9 313 68.8 310 68.6 306 75.9Liguria 244 53.5 243 53.4 243 53.8 241 59.8 - Genoa 137 30.0 136 29.9 136 30.1 134 33.3 - Imperia 60 13.2 60 13.2 60 13.3 60 14.9 - La Spezia 28 6.1 28 6.2 28 6.2 28 6.9 - Savona 19 4.2 19 4.2 19 4.2 19 4.7Lombardy 36 7.9 36 7.9 35 7.7 34 8.4Piedmont 34 7.5 34 7.5 32 7.1 31 7.7NORTH-EAST ITALY 31 6.8 31 6.8 31 6.9 31 7.7Emilia Romagna 19 4.2 19 4.2 19 4.2 20 5.0Veneto 12 2.6 12 2.6 12 2.7 11 2.7CENTRAL ITALY 56 12.3 56 12.3 56 12.4 25 6.2Latium 32 7.0 32 7.0 32 7.1 7 1.7Tuscany 20 4.4 20 4.4 20 4.4 18 4.5Marches 3 0.7 3 0.7 3 0.7 - - Umbria 1 0.2 1 0.2 1 0.2 - - SOUTH ITALY AND ISLANDS 54 11.8 54 11.9 54 11.9 40 9.9Sicily 38 8.3 38 8.4 38 8.4 30 7.5Apulia 9 2.0 9 2.0 9 2.0 5 1.2Sardinia 7 1.5 7 1.5 7 1.5 5 1.2BRANCHES ABROAD: Nice (France) 1 0.2 1 0.2 1 0.2 1 0.3TOTAL 456 100.0 455 100.0 452 100.0 403 100.0
31/12/03 30/9/03 31/12/02 31/12/01Private banking consultants 102 105 75 64Corporate consultants 75 60 44 38
B) REMOTE 31/12/02ATM - Bancomat 545 540 534 467Bancacontinua (self service) 14 14 14 14POS (1) 13,075 13,072 11,241 9,765On-line services (2) 68,161 61,381 49,500 38,228(1) Figures at 31/12/2002 do not include ex Capitalia branches.(2) Internet banking and Call Center contracts.
C) MOBILE 31/12/02 31/12/01Insurance agents (3) 303 282 220 92Estate agents 1,425 1,339 1,269 769(3) Agents of the Group’s insurance subsidiaries distributing Banca Carige products.
31/12/03 30/9/03
31/12/03 30/9/03 31/12/01
At 31st December 2002, total staff levels of theBanca Carige Group reached 4,354, (4,731when including employees of the Group’sinsurance subsidiaries). Banking staff assigned tomarket operations accounts for 71.3% of the
total; 28.7% is engaged in head officeadministrative duties.Banca Carige’s training centre in Genoaprovided during the year, 35,067 days oftraining for a total of 21,467 participations.
PERSONNEL
31/12/03 30/9/03 31/12/02 (1) 31/12/01
Grade Managers 55 1.3 55 1.3 51 1.2 53 1.3 Officials 875 20.1 808 18.4 722 17.6 726 17.7 Other employees 3,424 78.6 3,519 80.3 3,338 81.2 3,325 81.0TOTAL 4,354 100.0 4,382 100.0 4,111 100.0 4,104 100.0Activities Head-offices 1,249 28.7 1,230 28.1 1,263 30.7 1,293 31.5 Branches 3,105 71.3 3,152 71.9 2,848 69.3 2,811 68.5(1) Excluding the 371 employees of the 42 ex-Capitalia branches transferred to Banca Carige on 1/1/03

218
On 29th September 2003, the EuropeanCommission, in its adoption of Regulation no.1725, made it compulsory for all EU publiclimited companies to adopt from 1st January2005 new international accounting standards(IFRS) defined in Regulation no. 1606/2002 ofthe European Parliament and Council.On the basis of a regulation currently beingfinalised, differences between the new principlesand those at present in force in Italy emerge.The major differences concern:- the use of the principle of fair value rather
than historic cost for the valuation offinancial instruments and securitiesinvestments;
- the possibility of using, as an alternativeaccounting principle, fair value for thevaluation of intangible assets, premises,machinery, etc.
- the systematic use of actuarialrevaluations/deductions in the valuation ofcertain assets (loans) and liabilities (stafffunds);
- regular application of impairment testing tomonitor the value of significant assts (loans,equity investments, goodwill);
- wider levels of disclosure.Application of the new principles will result indifferences in the valuation of balance sheetitems. On first time adoption, these effects,pursuant to IFRS 1, will be on net assets.Consequently, there are likely to be differencesbetween the value of the net assets of the banksbelonging to the Carige Group recorded at31/12/04 at the value of the same assets at1/1/05.The introduction of the new principles will havean impact far beyond accounting and thepreparation of financial statements; the effectswill be felt on information systems (differentorganisation of data and information),organisation (changes in accounting processeswith knock-on effects on organisationalstructures), corporate culture (the need to createnew professional profiles and specific trainingprogrammes). The coherent application of theprinciples requires an integrated approach thattakes into account the logic underpinning theprinciples and their impact.Banca Carige as the leader of a universalfinancial services group (banking, insurance,financial services) during the first half of 2003
began to identify, on one hand, the professionalduties required and, on the other, to defineguidelines, programmes, models, methods andprocesses that will enable the effectiveintroduction of the newadministrative/accounting system foreseen by theEuropean Commission’s Regulation.The process is part of a wide-rangingreengineering of the Bank that started in 2002.The process of organisational review involvesevery Carige Group company, including theinsurance subsidiaries. It was approved by an adhoc steering committee formed within theGeneral Management of the Bank. TheCommittee’s duties are to direct, coordinate andcontrol all aspects of reengineering. TheCommittee has at its disposal:- a government structure with duties to direct
and guide the reengineering process. Thestructure is made up by senior managersfrom accounting and services, ICT, andOrganisation departments;
- a Coordination Group, an inter-functionalstructure made up by staff members fromaccounting, business and risk management,ITC, and organisation. The Group’sresponsibilities include legal and regulatoryaspects of the process, the definition ofmeasures to be taken, the monitoring ofwork in progress as well as the contributionof external consultants. The Group carriesout its activities in teams of in-house expertsresponsible for the analysis of single sectorsand subsequent implementation;
- an organisational group carries outtechnical support, and is responsible for thecollection and distribution of relevantregulations. Later it will draw up, transmitand store information and operationalinstructions.
The launch of the IFRS project was preceded bya preparatory phase during which theCoordination Group in collaboration with a firmof external consultants:- identified the maximum FTA-induced changes
on information and valuation and its effectson organisation, ITC and accounting;
- calculated the maximum FTA-inducedchanges on assets as at 1/1/05.
This preparatory phase was flanked by a seriesof training courses at first organised within theBank later followed by external courses andItalian Banking Association (ABI) work groups.The preparatory phase was concluded inOctober 2003 with the definition of generaltechnical and organisational guidelines alongwith a formal description of the measures to be
THE ADOPTION OFINTERNATIONAL ACCOUNTING
STANDARDS (IAS)

219
carried out. The actual enactment of thesemeasures (reengineering in its truest sense) willtake place during 2004. At the end of 2003, theproject had effected precise accounting andorganisational diagnostic tests in order to verifythe presence of data required and, whereabsent, the manner of retrieval. Softwaresuppliers to the Bank were brought actively intothis process. With regards to the effects on net
assets following first time adoption of theprinciples, it is reasonable to expect that thepossible negative effects induced by a change inthe valuation criteria applied to loans (fair valueinstead of historic cost) will be outweighed bypositive variations on the value of equityinvestments outside the group and of othertechnical fixed assets.
Net profit for the Group at 31/12/03 was 84.7million, up in comparison to the previous year’sfigure of 66.2 million. This positive result wassupported by encouraging growth both inoperating income (+10.9%) and ordinaryincome (+8.5%). Further help was provided byextraordinary contributions from the sale of non-strategic holdings and capital gains realised byCassa di Risparmio di Savona on the sale ofBanca Carige shares in portfolio.Comparison with 2002’s income statementreveals the effects of the purchase of 42branches from the Capitalia Group carried outby Banca Carige and inserted into the Carigebranch network from 31/12/02 . As a result, incomparison to 2002, there was expansion inboth cost and revenue items.Net interest income rose to 375.2 million(+5.7% in comparison to 31st December 2002)despite a further fall in interest rates with thenarrower margins that this entails. The rise in netinterest income stemmed from increases involumes handled, in part stemming from the ex-Capitalia branches. In detail, there were falls inboth interest income (-3.4% to 613.5 million)and interest expenses (-14.9% to 238.3 million).Interest income on loans to customers amountedto 494.1 million, whilst interest expenses totalled195.4 million. Interest income on securities inportfolio totalled 96.4 million.Non-interest, service-generated incomerose 17.3% over December 2002 to 328.7million. The result reflects a generalised increasein all non-interest income items. There were risesin net commission income and other operatingincome, which both benefited from expansion inthe Group’s operational capacity. Othercontributions to the aggregate came from risesin dividends received and profits recorded byholdings carried at equity, and 11 million in netprofits from financial transactions, which in theprevious year had recorded a negative result of -5.8 million. Commission income rose from184.2 million in 2002 to 204.4 million (+11%).
Commission expenses increased by 19.3% incomparison to 31/12/02 from 13.7 million to16.4 million. Dividends more than doubled,reaching 18.5 million (2002: 8.8 million) andthe net profits of the Group companies carriedat equity totalled 10 million, an increase of17.8%. Other operating income amounted to167.5 million (+6.2%), whilst other operatingcharges dropped 17.1% to 9.2 million.Gross operating income therefore rose11.3% over December 2002 to 760.9 million.Operating costs rose 11.5% over twelvemonths from 497.2 million to 554.2 million.Here, too, the effects of expansion following thepurchase of branches from Capitalia were felt.In particular, administrative costs rose at a morecontained level (+5.1%) to 148.5 million.Writedowns on financial fixed assets rose 11.5%to 137.2 million as a result of expansion inleasing activity on the one hand andamortisation relating to the ex-Capitaliabranches on the other.Operating income for the year movedforward 10.9% from 186.4 million recorded atthe end of 2002 to 206.7 million.Provisions and writedowns amounted to85.2 million, an increase of 14.6% overDecember 2002. In particular, provisions forrisks and charges totalled 4.2 million incomparison to 3.3 million at 31/12/02(+28.6%). Credit risk, measured in terms of thedifference between writedowns and provisions torisk funds, and writebacks rose 13.9% to 81million (2002: 71.2 million).Income from ordinary activities recordedan increase of 8.5% over 31st December 2002,reaching 121.5 million.Extraordinary income, net amounted to 35.3 million (December 2002: 16.5 million). Thissharp increase was due to the sales, on the onehand, of non-strategic equity investments (16million) and, on the other, of Carige shares onthe part of the banking subsidiary Cassa diRisparmio di Savona (11.3 million).
INCOME STATEMENT

220
After 5.1 million in utilisations from thegeneralbanking risks fund, 74.7 million inincome tax (+22.7%), and 2 million in profitsdestined to minority interests (+48.1%), net
profit at 31st December 2003 rose 28.1% to84.7 million in comparison to December 2002’sresult of 66.2 million.
INCOME STATEMENT (thousands of Euros)
2003 30/09/03 2002 20012003 2002
10 Interest income and similar revenues 613,535 461,781 635,012 682,992 -3.4 -7.020 Interest expense and similar charges -238,334 -183,193 -280,157 -324,108 -14.9 -13.6
NET INTEREST INCOME 375,201 278,588 354,855 358,884 5.7 -1.140 Commission income 204,447 147,408 184,235 166,254 11.0 10.850 Commission expenses -16,351 -12,199 -13,705 -12,711 19.3 7.860 Gains (losses)
from financial transactions 10,674 4,232 -5,844 4,427 … …30 Dividends and other revenues 18,536 16,994 8,754 9,348 … -6.4
170 Profit (losses) on investments carried at equity 10,030 3,779 8,512 7,575 17.8 12.470 Other operating income 167,518 121,099 157,806 161,308 6.2 -2.2
110 Other operating expenses -9,199 -5,593 -11,101 -9,720 -17.1 14.2NON INTEREST INCOME 385,655 275,720 328,657 326,481 17.3 0.7GROSS OPERATING INCOME 760,856 554,308 683,512 685,365 11.3 -0.3
80 Administrative costs -416,916 -312,281 -374,031 -357,217 11.5 4.7– Personnel -268,412 -199,137 -232,748 -225,839 15.3 3.1– Other administrative costs -148,504 -113,144 -141,283 -131,378 5.1 7.5
90 Depreciation and amortization of intangible and tangible fixed assets -137,238 -101,776 -123,129 -114,903 11.5 7.2OPERATING COSTS -554,154 -414,057 -497,160 -472,120 11.5 5.3OPERATING INCOME 206,702 140,251 186,352 213,245 10.9 -12.6
100 Provisions for risksand charges -4,209 -3,503 -3,273 -2,908 28.6 12.6
120 Provisions for loan losses and for guarantees and commitments -72,588 -51,460 -67,090 -50,370 8.2 33.2
130 Recoveries of loans and reversals of provisionsfor guarantees and commitments 11,295 6,300 13,264 9,709 -14.8 36.6
140 Additional provisions for loan losses -19,744 -315 -17,334 -7,296 13.9 …150 Write-downs to financial fixed assets - - -33 -57 -100.0 -42.1160 Recoveries of financial fixed assets - - 99 270 -100.0 -63.3
PROVISIONS AND WRITE-DOWNS -85,246 -48,978 -74,367 -50,652 14.6 46.8180 INCOME FROM ORDINARY ACTIVITIES 121,456 91,273 111,985 162,593 8.5 -31.1190 Extraordinary income 43,121 27,651 23,339 18,997 84.8 22.9200 Extraordinary expenses -8,149 -6,086 -6,868 -3,585 18.7 91.6210 EXTRAORDINARY INCOME, NET 34,972 21,565 16,471 15,412 … 6.9
INCOME BEFORE TAXATION 156,428 112,838 128,456 178,005 21.8 -27.8230 Variation of reserves for general banking risks -5,065 - - - … …240 Income taxes -74,721 -53,646 -60,914 -80,977 22.7 -24.8250 Minority interests -2,030 -1,504 -1,371 -967 48.1 41.8260 NET INCOME 84,742 57,688 66,171 96,061 28.1 -31.1
Change %

221
INCOME STATEMENT - QUARTERLY CHANGES (thousands of Euros)
2003 20024th quarter 3rd quarter 2nd quarter 1st quarter 4th quarter 3rd quarter 2nd quarter 1st quarter
10 Interest income and similar revenues 151,754 149,797 154,164 157,820 169,476 157,523 153,421 154,59220 Interest expense and similar charges -55,141 -55,832 -59,838 -67,523 -78,141 -66,673 -67,898 -67,445
NET INTEREST INCOME 96,613 93,965 94,326 90,297 91,335 90,850 85,523 87,14740 Commission income 57,039 49,284 50,221 47,903 46,628 46,145 45,485 45,97750 Commission expenses -4,152 -4,286 -4,415 -3,498 -3,898 -3,914 -3,676 -2,21760 Gains (losses)
from financial transactions 6,442 5,098 -192 -674 7,765 -10,372 -4,888 1,65130 Dividends and other revenues 1,542 -632 15,000 2,626 250 269 3,314 4,921
170 Profit (losses) on investments carried at equity 6,251 1,627 2,105 47 5,524 1,043 1,697 24870 Other operating income 46,419 41,118 40,523 39,458 39,610 43,837 38,102 36,257
110 Other operating expenses -3,606 -3,158 -1,504 -931 -4,624 -18 -3,553 -2,906NON INTEREST INCOME 109,935 89,051 101,738 84,931 91,255 76,990 76,481 83,931GROSS OPERATING INCOME 206,548 183,016 196,064 175,228 182,590 167,840 162,004 171,078
80 Administrative costs -104,635 -105,520 -105,343 -101,418 -97,497 -91,282 -97,633 -87,619– Personnel -69275.0 -65685.0 -66,842 -66,610 -56,051 -58,973 -58,042 -59,682– Other administrative costs -35360.0 -39835.0 -38,501 -34,808 -41,446 -32,309 -39,591 -27,937
90 Depreciation and amortization of intangible and tangible fixed assets -35462.0 -34122.0 -34,628 -33,026 -23,735 -33,267 -33,027 -33,100OPERATING COSTS -140,097 -139,642 -139,971 -134,444 -121,232 -124,549 -130,660 -120,719OPERATING INCOME 66,451 43,374 56,093 40,784 61,358 43,291 31,344 50,359
100 Provisions for risks and charges -706 -139 -2,789 -575 -379 -510 -926 -1,458
120 Provisions for loan losses and for guarantees and commitments -21,128 -21,873 -12,764 -16,823 -18,129 -17,735 -18,170 -13,056
130 Recoveries of loans and reversals of provisionsfor guarantees and commitments 4,995 1,585 2,053 2,662 2,783 3,557 4,532 2,392
140 Additional provisions for loan losses -19,429 -253 28 -90 -16,909 -216 -204 -5150 Write-downs to financial fixed assets - - - - -8 - -25 -160 Recoveries of financial fixed assets - - - - 11 - 88 -
PROVISIONS AND WRITE-DOWNS -36,268 -20,680 -13,472 -14,826 -32,631 -14,904 -14,705 -12,127180 INCOME FROM ORDINARY ACTIVITIES 30,183 22,694 42,621 25,958 28,727 28,387 16,639 38,232190 Extraordinary income 15,470 3,864 8,887 14,900 15,917 1,323 4,205 1,894200 Extraordinary expenses -2,063 -1,632 -2,281 -2,173 -2,778 -518 -2,341 -1,231210 EXTRAORDINARY INCOME, NET 13,407 2,232 6,606 12,727 13,139 805 1,864 663
INCOME BEFORE TAXATION 43,590 24,926 49,227 38,685 41,866 29,192 18,503 38,895230 Variation of reserves for general banking risks -5,065 - - - - - - -240 Income taxes -21,075 -10,596 -26,530 -16,520 -18,124 -15,649 -8,052 -19,089250 Minority interests -526 -367 -485 -652 -542 -191 -390 -248260 NET INCOME 27,054 13,963 22,212 21,513 23,200 13,352 10,061 19,558
Capital resources (Tier 1 and Tier 2) for theBanca Carige Group at 31/12/03 totalled1,312.9 million, an increase of 43.4% in
comparison to 31/12/02. This rise stems from ashare capital increase carried out by BancaCarige at the end of 2003.
BREAKDOWN OF TOTAL CAPITAL (thousands of euros)
31/12/03 30/9/03 31/12/02 31/12/01
Tier 1 Capital: positive elements eligible for inclusion (a) 1,549,697 1,352,492 1,341,443 1,310,197Share capital 1,113,327 1,020,550 1,020,550 1,017,510Reserves 181,247 184,913 179,633 155,517Additional paid-in capital 255,023 141,864 136,095 132,005General banking risks fund 100 5,165 5,165 5,165
Tier 1 Capital: negative elements (b) 580,240 579,346 616,704 505,912Goodwill 546,098 547,289 558,894 440,468Other negative elements 34,142 32,057 57,810 65,444
Total Tier 1 Capital (c = a-b) 969,457 773,146 724,739 804,285
Supplementary capital (d) 526,081 395,516 371,048 405,711
Reductions (e) 182,644 (1) 162,470 (1) 180,385 (1) 50,518
Total core capital (c+d-e) 1,312,894 (1) 1,006,192 (1) 915,402 (1) 1,159,478(1) Includes deduction of equity investment in subsidiary Carige Assicurazioni SpA (124,420 thousand euros) as requested by regulators and the subsidiary's subordinated loan issue subscribed by Banca Carige (44,304 thousand euros). Excluding this deduction,
l capital resources at 31st December 2003 would amount to 1,481,618 thousand euros.
SHAREHOLDERS' EQUITY

222
In particular, tier 1 capital amounted to 969million, an increase of 33.8% in comparison tothe end of the previous year. Tier 1 capitalincludes positive elements totalling 1,549.7million (+15.5%), thanks to fresh equity of 92.8million and issue premium reserves of 111.3million relating to the same share capitalincrease. Negative elements to be deductedamount to 580.2 million, a reduction of 5.9% incomparison to the end of 2002 as a result of adecrease in the number of own shares inportfolio following the sale of Carige shares by
the subsidiary Cassa di Risparmio di Savona.Supplementary capital rose 41.8% to 526.1million and is almost exclusively in the form ofsubordinated loan capital raised by BancaCarige via two issues: a lower Tier 2 issueperformed in September 2001 (398.9 million)and a convertible subordinated loan (102.1million) issued during the share capital increaseconcluded in December 2003.Negative elements are represented by holdingsin Eptaconsors, Frankfurter Bankgesellschaft,Ligurcapital and Carige Assicurazioni.
TOTAL CORE CAPITAL AND SOLVENCY RATIOS (thousands of euros)
31/12/03 30/09/03 31/12/02 31/12/01
Core capital Tier 1 capital 969,457 773,146 724,739 804,285 Tier 2 capital 526,081 395,516 371,048 405,711Deductions (1) 182,644 162,470 180,385 50,518Total capital (1) 1,312,894 1,006,192 915,402 1,159,478
Weighted assetsCredit risks (1) 9,665,037 9,645,888 8,961,900 7,909,038 Market risks 1,095,775 1,056,800 718,900 1,094,475 Other prudential requirements 493,463 493,476 483,288 227,550 Total weighted assets (1) 11,254,275 11,196,164 10,164,088 9,231,063
Solvency ratios %Tier 1/ Weighted assets for credit risk 10.03% 8.02% 8.09% 10.17%Total capital / Weighted assets for credit risk (1) 13.58% 10.43% 10.21% 14.66%
Tier 1 / Total weighted assets (2) 8.61% 6.91% 7.13% 8.71%Total capital / Total weighted assets (1) (2) 11.67% 8.99% 9.01% 12.56%
(1) Amounts include deduction of holding in subsidiary Carige Assicurazioni as requested by regulators. Excluding this deduction, total capital at 31/12/03 would rise to 1,481,618 thousand euros with related rises in the total capital/weightedassets for credit risk from 13.58% to 15.33%, and total capital/total weighted assets ratios from 11.67% to 13.16%. (2) Total weighted assets include credit and market risks.
With regards to capital absorption and capitaladequacy levels, weighted assets for credit risktotalled 9,665 million, with a capital adequacyrequirement of 773.2 million (2002: 717million). Capital adequacy requirements formarket risks totalled 87.7 million, whilst otheramounts required in relation to the Bank’ssecuritisation operations totalled 39.5 million.Overall, capital requirements totalled 900.3million which, deducted from core capital, leavea total of 412.6 million in excess to capitalrequirements.
Solvency, calculated on the basis of the totalcapital/weighted assets for credit risk ratio wasat 31/12/03 13.58%; the total capital ratio,which includes also weighted assets for marketrisks, was 11.67%. The above coefficientsrelating to tier 1 capital were, respectively,9.28% and 8.14%. Both indicators were higherthan those recorded in 2002 as a result of theequity strengthening operation carried out byBanca Carige at the end of 2003.

223
CORE CAPITAL AND SOLVENCY RATIOS1,312.9
969.5915.4
1,159.5
724.7804.3 11.67%
9.01%
12.56%
8.61%
7.13%
8.71%
0
200
400
600
800
1,000
1,200
1,400
31/12/2001 31/12/2002 31/12/20035.00%
10.00%
15.00%
Core capital Tier 1 Total capital ratio Tier 1 ratio
Total capital levels and related solvency ratioshave been influenced over the last few years byexpansion in the Carige Group’s retail network.Expansion by the purchase of branches fromother banks or via new branch openings hasbeen financed by two share capital increasesand one subordinated bond loan issue. Bothchannels seek expansion that goes hand-in-
hand with financial solidity, a characteristic ofBanca Carige’s operational strategy.Details of risk management for the Group canbe found in the Board of Directors’ Report forBanca Carige (‘Risk Management’).Consolidated net equity and net income derivefrom those of the parent company, BancaCarige in the following way:
Net equity Profit for the yearTotals recorded in Banca Carige Financial Statements at 31/12/2003 1,730,228 106,199Positive variations on book value 56,830 21,464Writedowns on allocated capital gains -839 -839Writedowns on positive differences deriving from consolidation and application of the equity method -7,257 -7,257Effects deriving from items recorded in previous accounting periods -94,792 -Profit (loss) on investments carried at equity 7,010 10,030Writedowns on dividends distributed by associated undertakings -3,959 -3,959Writedowns on dividends distributed by subsidiaries -25,160 -36,871Others -18,117 -4,025Consolidated Totals at 31/12/2003 1,643,944 84,742
Changes in consolidated net equity from 31/12/02to 31/12/2003 are a result of the
following variations:
Balance at 31/12/2002 1,421,790 Share capital increases carried out during the year 92,777 Increases in paid-up issue premium 111,361Reintegration of share premium used in securitisation 7,567Dividends distributed during the year to shareholders outside the Group -75,052Variations in credit risk reserves excluding amounts payable by third parties 5,353Variations in general banking risk reserves -5,065Variations in negative differences deriving from the application of the equity method and consolidation -181Variations in reserves following the application of the equity method 627Others 25Consolidated net profit 84,742Balance at 31/12/2003 1,643,944
The increase in assets at 31/12/03 incomparison to the figure recorded at the end of2002 is a result of the share capital increase
carried out by the Group leader Banca Carigeat the end of 2003. The operation raised 204.1

224
million (share capital increase and related issuepremium reserves).Dealings in own shares on the part of the parentcompany, Banca Carige, were related to thepurchase of 8,870,380 shares with a nominalvalue of 8.9 million and a correspondingcounter value of 22.4 million. Sales totalled14,894,912 shares, nominal value 14.9 million,counter value 36.3 million. Trading in ownshares as described above represented 2.1% ofBanca Carige’s share capital. During the year,Carige Assicurazioni also purchased ownshares: 89 ordinary shares with a book value of0.1 million and counter value of 0.2million; the company also purchased 200,718old shares of a book and counter value of 0.1million.
At 31st December 2003, the Group had noBanca Carige shares in portfolio following thesale by Cassa di Risparmio di Savona of itsholding in its parent company (12,950,000shares) for 25.4 million (capital gain of 11.4million).At the same date, Carige Assicurazioni held1,790 of its own shares for a counter value of3.2 million and Immobiliare Vernazza held10,000 own shares for a counter value of 2.3million.
BANCA CARIGE GROUP SUBSIDIARIES: PRINCIPAL DETAILS
Name Registered Holding Equity ratio Net assets Profit/lossoffice Direct Total (thousands (thousands
of euros) of euros)A. Fully consolidated companies
Banks 1. Banca CARIGE SpA Genoa - - - - 106,199 2. Cassa di Risparmio di Savona SpA Savona 95.90 95.90 95.90 152,355 19,478 3. Banca del Monte di Lucca SpA Lucca 54.00 54.00 54.00 26,511 2,493
Financial firms 4. Carige AM SGR SpA Genoa 99.50 100.00 99.96 5,132 -68 5. Ligure Leasing SpA Savona - 100.00 95.90 7,756 15 6. Argo Finance One Srl Genoa 60.00 60.00 60.00 10 -
Property-related services providers 7. Galeazzo Srl Genoa 100.00 100.00 100.00 3,849 68 8. Columbus Carige Imm. SpA Genoa 99.98 100.00 100.00 25,095 505 9. Imm. Ettore Vernazza SpA Genoa 90.00 100.00 100.00 5,134 890 10. Immobiliare CARISA Srl Savona - 100.00 95.90 1,806 -9
Trust company 11. Centro Fiduciario SpA Genoa 76.93 96.93 96.11 967 122
B. Companies consolidated by the equity method
Insurance companies 1. Carige Assicurazioni SpA Milan 89.18 90.82 90.82 141,066 2,710 2. Carige Vita Nuova SpA Genoa 92.81 92.81 92.81 49,600 3,801
Other activities 3. Assi 90 Srl (1) Genoa - 60.00 54.94 1,770 945 4. AG Srl (1) Genoa - 100.00 54.94 21 3 5. Savona 2000 Srl (1) Savona - 80.00 43.95 70 40 6. Assimilano Srl (1) Milan - 60.00 32.96 63 -44
(1) Companies providing insurance-related services
Banking subsidiaries
Cassa di Risparmio di Savona ('Carisa')recorded a rise in the volume of amountshandled. Financial intermediation activities (directand indirect deposits; lending to customers) rose3.8% to 3,063.5 million. In particular, direct andindirect deposits increased 3.4% to 2,405.9million, whilst lending rose 5.5% to 657.6million.
Direct deposits remained substantially unchangedat 1,047.7 million (-0.6%). A drop in short-termdeposits was offset by a rise in medium/long-termcustomer deposits. Indirect deposits ('otherfinancial intermediation activities') rose 6.7% incomparison to the end of 2002 to 1,358.2million. Within indirect deposits, there wassignificant growth in asset management, whichreached 752.4 million (+10.2%), aided bymutual funds; assets under administration, rising
THE GROUP COMPANIES ANDEQUITY INVESTMENTS
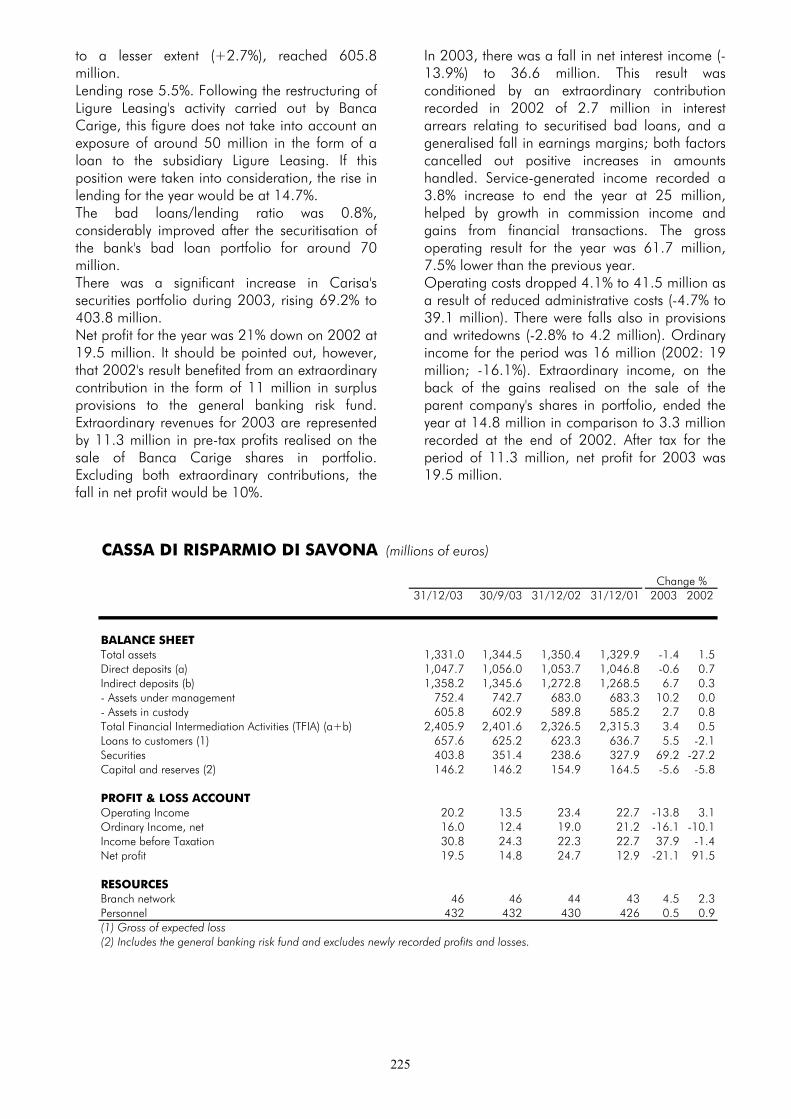
225
to a lesser extent (+2.7%), reached 605.8million.Lending rose 5.5%. Following the restructuring ofLigure Leasing's activity carried out by BancaCarige, this figure does not take into account anexposure of around 50 million in the form of aloan to the subsidiary Ligure Leasing. If thisposition were taken into consideration, the rise inlending for the year would be at 14.7%.The bad loans/lending ratio was 0.8%,considerably improved after the securitisation ofthe bank's bad loan portfolio for around 70million.There was a significant increase in Carisa'ssecurities portfolio during 2003, rising 69.2% to403.8 million.Net profit for the year was 21% down on 2002 at19.5 million. It should be pointed out, however,that 2002's result benefited from an extraordinarycontribution in the form of 11 million in surplusprovisions to the general banking risk fund.Extraordinary revenues for 2003 are representedby 11.3 million in pre-tax profits realised on thesale of Banca Carige shares in portfolio.Excluding both extraordinary contributions, thefall in net profit would be 10%.
In 2003, there was a fall in net interest income (-13.9%) to 36.6 million. This result wasconditioned by an extraordinary contributionrecorded in 2002 of 2.7 million in interestarrears relating to securitised bad loans, and ageneralised fall in earnings margins; both factorscancelled out positive increases in amountshandled. Service-generated income recorded a3.8% increase to end the year at 25 million,helped by growth in commission income andgains from financial transactions. The grossoperating result for the year was 61.7 million,7.5% lower than the previous year.Operating costs dropped 4.1% to 41.5 million asa result of reduced administrative costs (-4.7% to39.1 million). There were falls also in provisionsand writedowns (-2.8% to 4.2 million). Ordinaryincome for the period was 16 million (2002: 19million; -16.1%). Extraordinary income, on theback of the gains realised on the sale of theparent company's shares in portfolio, ended theyear at 14.8 million in comparison to 3.3 millionrecorded at the end of 2002. After tax for theperiod of 11.3 million, net profit for 2003 was19.5 million.
CASSA DI RISPARMIO DI SAVONA (millions of euros)
Change %31/12/03 30/9/03 31/12/02 31/12/01 2003 2002
BALANCE SHEETTotal assets 1,331.0 1,344.5 1,350.4 1,329.9 -1.4 1.5Direct deposits (a) 1,047.7 1,056.0 1,053.7 1,046.8 -0.6 0.7Indirect deposits (b) 1,358.2 1,345.6 1,272.8 1,268.5 6.7 0.3- Assets under management 752.4 742.7 683.0 683.3 10.2 0.0- Assets in custody 605.8 602.9 589.8 585.2 2.7 0.8Total Financial Intermediation Activities (TFIA) (a+b) 2,405.9 2,401.6 2,326.5 2,315.3 3.4 0.5Loans to customers (1) 657.6 625.2 623.3 636.7 5.5 -2.1Securities 403.8 351.4 238.6 327.9 69.2 -27.2Capital and reserves (2) 146.2 146.2 154.9 164.5 -5.6 -5.8
PROFIT & LOSS ACCOUNTOperating Income 20.2 13.5 23.4 22.7 -13.8 3.1Ordinary Income, net 16.0 12.4 19.0 21.2 -16.1 -10.1Income before Taxation 30.8 24.3 22.3 22.7 37.9 -1.4Net profit 19.5 14.8 24.7 12.9 -21.1 91.5
RESOURCESBranch network 46 46 44 43 4.5 2.3Personnel 432 432 430 426 0.5 0.9(1) Gross of expected loss(2) Includes the general banking risk fund and excludes newly recorded profits and losses.

226
Banca del Monte di Lucca recordedsignificant growth in amounts handled: totalfinancial intermediation activities (direct andindirect deposits, loans to customers) rose18.7% to reach 976.4 million. This result followsexpansion carried out in recent years that alsoincluded the opening of 8 new branches. Totaldeposits rose by 15.8% to 629.2 million, whilstlending increased by 24.6% to 347.2 million.Direct deposits ('customer deposits') increased by32.2% to 358.7 million, in particular thanks togrowth in the medium/long-term segment.Indirect deposits recorded little overall change intotal amounts (270.5 million) although therewas a shift in favour of asset managementsolutions, which rose 20.1% to 101.4 million.The Lucca bank's total lending increased by24.6% to 347.2 million. As in the case ofdeposits, there was considerable expansion inmedium/long-term credits, which rose 44.6% to204.1 million. Expansion in short-term lending
was at 4.3% for the year at 128.8 million. Thebank's bad loans/lending ratio improved incomparison with 2002, from 5% to 4.1%.Growth in the securities portfolio continued,rising by 14.1% over 2002 to 82.3 million.Net profit for the year increased 58.8% to 2.5million. In particular, there were rises in both netinterest income rose (+14.5% to 14.5 million)and non interest income (+21.1% to 7.4million). Gross operating income was also up,by 16.6% to 21.9 million. Operational costsincreased by 7.7% to 15.1 million as didwritedowns on credits (+27.7% to 1.7 million).Profit from ordinary activities reached 5 million,an increase of 49.9%. Including extraordinarynet income of 0.3 million, an income tax chargefor the year of 2.6 million, and a withdrawalfrom the general banking risk fund of 0.2million, net profit at 31/12/03 amounted to 2.5million.
BANCA DEL MONTE DI LUCCA (millions of euros)
Change %31/12/03 30/9/03 31/12/02 31/12/01 2003 2002
BALANCE SHEETTotal assets 464.1 458.9 389.2 346.7 19.2 12.2Direct deposits (a) 358.7 346.6 273.3 245.5 31.2 11.3Indirect deposits (b) 270.5 273.5 270.2 267.4 0.1 1.0- Assets under management 101.4 100.5 84.4 66.4 20.1 27.1- Assets in custody 169.1 173.1 185.8 201.0 -9.0 -7.6Total Financial Intermediation Activities (TFIA) (a+b) 629.2 620.2 543.5 513.0 15.8 6.0Loans to customers (1) 347.2 334.5 278.7 236.6 24.6 17.8Securities 82.3 85.8 72.1 53.6 14.1 34.5Capital and reserves (2) 24.0 23.8 23.7 23.5 1.4 0.5
PROFIT & LOSS ACCOUNTOperating Income 6.7 4.9 4.7 2.5 43.5 85.6Ordinary Income, net 5.0 3.7 3.3 1.4 49.9 147.4Income before Taxation 5.3 3.9 3.4 1.9 54.2 85.3Net profit 2.5 1.9 1.6 0.9 58.8 83.0
RESOURCESBranch network 17 17 17 15 0.0 13.3Personnel 142 141 142 143 0.0 -0.7(1) Gross of expected loss(2) Includes the general banking risk fund and excludes newly recorded profits and losses.
Insurance subsidiaries
Total premiums collected by the two insurancesubsidiaries, Carige Assicurazioni and CarigeVita Nuova, amounted to 670.7 million at 31st
December 2003. This figure was effectivelyunchanged over 2002 (-0.8%), whilst there was
a marked fall in accident claims paid of 6.2%(403.5 million). The number of employees of thecompanies was 377. Re-organisation of thedistribution network continued during the yearwith the number of insurance offices falling from443 to 416.

227
BANCA CARIGE GROUP INSURANCE COMPANIES (thousands of euros)
Change %31/12/03 30/9/03 31/12/02 31/12/01 2003 2002
Premiums issued 670,730 473,459 676,214 668,407 -0.8 1.2of which non-life car insurance (third party, fire & theft) 255,656 192,000 280,347 340,117 -8.8 -17.6Claims paid 403,508 293,100 430,307 512,851 -6.2 -16.1Employees 377 390 402 408 -6.2 -1.5Offices 416 420 443 482 -6.1 -8.1
In the light of inspections carried out at theGroup’s insurance companies in 2002 by ISVAP,the competent authority for insuranceundertakings in Italy, an action plan was drawnup by the Boards of Directors of the twocompanies on the basis of indications made bythe parent company Banca Carige and ISVAP.The plan sets out the measures necessary to:
• heighten corporate governance andorganisational efficiencies, redefining bymeans of appropriate changes to thecompanies’ by-laws decision-makingpowers and responsibilities of the Boardsin order to achieve higher levels ofcoordination and power-sharing;
• rationalise holdings via the incorporationof Euroipa Srl and S.P.A. Srl into CarigeR.D. Assicurazioni e Riassicurazioni SpA,the Carige Group non-life insurerreferred to in this report as CarigeAssicurazioni, restructuring at the sametime previously outsourced activities;
• rationalise technical and commercialaspects of the companies’ activities, inparticular those of Carige Assicurazioni,by means of a thorough review of policyin the field of reinsurance (details aregiven in the following paragraphdedicated to Carige Assicurazioni), the
bolstering of technical reserves, and theregular monitoring of their robustness.
As part of a raft of measures taken to achieverationalisation and innovation, at the same timeconsistent with ISVAP’s recommendations, afurther strengthening of Carige Assicurazioni’sequity was carried out in order to improve thecompany’s solvency margin.The Extraordinary Meeting of CarigeAssicurazioni held on 28th November 2003deliberated an increase in share capital from102,520,800 euros to 137,872,800 euros viathe issue of 36,000 new shares with a nominalvalue of 982 euros and a premium of 193 eurosfor an overall total of 42.3 million to be offeredto shareholders in exchange on the basis of 10new shares every 29 old shares in possession.The option to exchange shares on this basismust be exercised no later than 31 March 2004.On 30th December 2003, Banca Carigeexercised its option regarding 17,022 newshares for an overall counter value of 20 million.Other shareholders exercised their option rightson another 30 shares on 30th December.Consequently, the company’s total share capitalat 31/12/03 amounted to 140.9 million incomparison to 120.1 million at 31/12/02.

228
CARIGE ASSICURAZIONI (thousands of euros)
Change %31/12/03 30/9/03 31/12/02 31/12/01 2003 2002
Investments 553,650 526,614 512,288 495,197 8.1 3.5Technical reserves (1) 570,234 474,067 477,948 447,951 19.3 6.7Shareholders' equity 140,862 120,365 120,115 100,032 17.3 20.1Net profit 2,710 2,198 2,251 383 20.4 487.7
Premiums issued 480,411 345,445 478,409 517,923 0.4 -7.6of which non-life car insurance (third party, fire & theft) 255,656 192,000 280,855 340,117 -9.0 -17.4Percentage share 53.2% 55.6% 58.7% 65.7%
Claims received 141,666 99,036 153,658 195,960 -7.8 -21.6of which non-life car insurance (third party, fire & theft) 67,062 48,256 83,409 127,267 -19.6 -34.5
Claims paid (2) 335,424 243,555 364,932 449,527 -8.1 -18.8
Employees 327 338 352 358 -7.1 -1.7Offices 416 420 443 482 -6.1 -8.1
(1) Excluding reinsurance.(2) Item includes expenses relating to damages paid during the year.
Carige Assicurazioni closed the year with a20.4% increase in net profit in comparison to2002, up from 2.3 million to 2.7 million.Total premiums issued in 2003 – 480.4 million– were in line with the previous year’s level(+0.4%). A policy of careful risk monitoringcontinued and brought with it a 9% fall in third-party car insurance premiums and a reduction in37,000 other contracts. Despite this drop inthird-party car insurance premiums, there was a4.5% increase in other car-related insurancepremiums. Diversification from third-party carinsurance, supported by specific marketingmeasures, produced consistent growth in othernon-life classes (+16.3%) and, consequently,greater equilibrium in the company’s portfolio.In 1999, third-party car insurance represented65.6% of premiums issued, whilst at the end of2003 the share was 53.2%, in line with themarket average (September 2003: 53.9%).Other motor insurance cover represented 8.3%and the remaining classes (‘elementari’)accounted for 38.5% (2002: 33.3%).There was a reduction in the number of accidentclaims of around 12,000 (-7.8%), proof of acontinuing qualitative improvement in theportfolio. The fall refers exclusively to third-partycar insurance, which recorded 16,000 fewerclaims in 2003 (-19.6%). Management costsrose (+1.8%) below the rate of inflation andaccounted for 24% of premiums, similar to thelevel recorded in 2002 (23.6%). Costcontainments proved effective despite theextraordinary expenses represented by therenewal of the national employment contract forthe sector. Reserves, excluding reinsurance, rose29.8% to 408.7 million. The company’ssolvency margin was higher than the minimumlevel required. At 31st December 2003, there
were 327 members of staff, 25 fewer than at theend of the previous year. Restructuring of thedistribution resulted in the closure of 27 offices,bringing the total at 31/12/03 to 416.After inspections carried out by the Italianinsurance industry regulator ISVAP, the companywas informed that with regard to two non-lifereinsurance treaties (multi-year reinsurancetreaty 2001-2005 and pure quota-share treaty2001-2003), solvency margins and technicalprovisions were inadequate in the light of theprudential supervision standards for insuranceundertakings identified by Directives2002/12/EC and 2002/13/EC, adopted intoItalian legislation by Legislative decree307/2003. Consequently, the following changeswere made in the accounting of the treatiesfollowing ISVAP’s indications:• closure in advance of the multi-year treaty;• accounting of the last year of cession of
quota-share treaty in accordance withISVAP’s recommendations;
• elimination of all effects these treaties haveon solvability margin and technicalprovisions;
• reclassification of items relating to the treatiesin the balance sheet and profit & loss account(‘other technical items’ in the profit & lossaccount and ‘other assets and liabilities’ inthe balance sheet) separate from itemspertaining to direct business cessions;
• reductions regarding the treaties in questionarisen in previous years are carried forwardover the next three years, a period of timethat corresponds to the original residual lifeof the treaties, as foreseen by Legislativedecree 307/03.
Reductions carried out to technical provisions forthe reinsurance treaties in question are recorded

229
as costs in the profit & loss account for the years2003-06 in the following way:
REDUCTIONS TO REINSURANCE TREATIES (thousands of euros)
Reductions recorded in the P&L
2003 2004 2005 2006
Non-life pure quota-share treaty 2001 16,723 5,574 5,574 5,575 -
Non-life pure quota-share treaty 2002 31,633 7,909 7,908 7,908 7,908Non-life multi-year treaty 2001 28,464 9,000 9,732 9,732 -
TOTAL 76,820 22,483 23,214 23,215 7,908
Total amount
On the basis of the level of accident claimsrecorded at 31/12/03, the company couldqualify for a profit commission of 10,064thousand euros. The final calculation will,however, be made in 2007 on the basis of thelevel of accident claims recorded at the end ofthe treaty’s observation period.Carige Vita Nuova closed the year with a netprofit of 3.8 million, up 73.8% in comparison to2002’s result of 2.2 million. Premiums collecteddropped from 197.8 million in 2002 to 190.3million (-3.8%) after two years of considerablegrowth. Total premiums amounted to at31/12/03 1,020.2 million, up 15.6% over theprevious year. With regards to the company’sproduct portfolio, a further four tranches ofindex linked policies were issued: Carige IndexReddito e Garanzia, Reddito e Garanzia 2,Euro/Dollaro 095 e Reddito e Garanzia 3.Distribution of the product took advantage of thecross selling opportunities offered by the Groupand is reflected by the fact that 76.7% (2002:78%) of total subscriptions were made at thecounters of our banks (146 million), whilst theremaining 23% (2002: 22%) were made atCarige Vita Nuova offices (44.3 million).Total claims paid out during the year amountedto 68.1 million, an increase of 4.1% over theprevious year’s figure of 65.4 million.Administrative costs rose 33% as a result of theincorporation of OPA Srl, a firm that offeredadministrative, organisational and trainingsupport to the insurance office network.Excluding the costs relating to the incorporationof OPA Srl and the revenues produced on billingCarige Assicurazioni, the rise in administrativecosts was 4.7%. Asset management producedan average yield on assets invested of 4.5%(2002: 3.9%); separate management linesproduced the following yields: Norvita 4.91%;
Carige Vita Nuova 5.79%. The prudentialapproach to investments carried out by theparent company meant that there were no Cirioor Fimatica securities in Carige Vita Nuova’sportfolio, and only a small amount of Parmalatgroup securities (1.7 million, written down to 0.9million).There were no changes in staff levels during theyear (50 employees). During 2003, the numberof offices distributing Vita Nuova productsdropped from 320 to 308 as a result of 10 newopenings and 22 closures. In October 2003, thepilot phase began of a project (‘Insieme di Più’)aimed at integrating the Group’s distributionchannels by means of the organisation andmonitoring of banking/insurance activities(insurance-in-bank ‘bancassurance’, and bank-in-insurance ‘assurbanca’). On conclusion of theexperimental phase of the project, currentlyinvolving 30 offices, the project will be extendedto a further 100 to 120 offices.Other significant events for the company duringthe year include: the acquisition of controltogether with Carige Assicurazioni of certainlarge, strategically important insurance offices;the purchase of share quotas in Carige AssetManagement SGR and in an important firm ofinsurance brokers; the separation of the portfolioof policies with a high financial profile,previously managed by the associatedundertaking Assi 90 Srl, and now transferred tothe Group’s banks for management.Some administrative and productive duties areperformed on behalf of the Group’s insurancecompanies by other associated or correlatedfirms also in the form of outsourcing. In line withCONSOB’s requirements, the relations existingbetween these firms and the Group are at alltimes regulated by market conditions.

230
CARIGE VITA NUOVA (thousands of euros)
Change %31/12/03 30/9/03 31/12/02 31/12/01 2003 2002
Investments (1) 1,001,843 953,213 866,735 764,714 15.6 13.3Technical reserves (2) (3) 903,847 855,806 768,674 674,713 17.6 13.9Shareholders' equity 49,226 49,212 48,997 48,968 0.5 0.1Net profit 3,801 3,007 2,187 213 73.8 926.8
Gross premiums issued 190,319 128,014 197,805 150,484 -3.8 31.4 - Insurance offices 44,278 26,535 43,551 52,878 1.7 -17.6 - Banking branches 146,041 101,479 154,254 97,606 -5.3 58.0 * Individual policies 68,235 42,547 73,075 79,357 -6.6 -7.9 * Collective policies 5,144 2,554 4,381 4,347 17.4 0.8 * Unit linked 116,940 82,913 120,349 66,780 -2.8 80.2
Amounts paid 68,084 49,545 65,375 63,324 4.1 3.2
Employees 50 52 50 50 0.0 0.0Offices 309 305 320 352 -3.4 -9.1
(1) Includes those investments in which risk levels are recognised and backed by the assured and pension funds.(2) Includes those reserves in which risk levels are recognised and backed by the assured and pension funds.(3) Excluding reinsurance.
Financial subsidiaries
Argo Finance One Srl was formed in 2002as the special purpose vehicle for thesecuritisation of bad loans carried out by theparent company, Banca Carige. After thepurchase of a 60% holding by the latter, ArgoFinance was consolidated into the Banca CarigeGroup in 2001. In the light of the existingservice contract, the company’s activities aredefined by the parent company. During 2003,securitisation-related revenues totalled 4.1million in comparison to 1.4 million during theprevious year. In particular, total revenuescollected in 2003 amounted to 27.8 million,27.5% higher than the levels foreseen in theoriginal collection programme. The value ofsecuritised credits fell from 120.2 to 103.3million.Ligure Leasing SpA, fully-owned subsidiaryof Cassa di Risparmio di Savona, was thesubject of restructuring carried in 2002 duringwhich lease contracts amounting to 48.9 millionwere sold to Banca Carige. During 2003, thecompany managed the remaining 52performing lease contracts in portfolio as well asnon-performing positions. Net profit for the yearwas 15,000 euros. At 31/12/03, there were 19employees, for the most part Cassa di Risparmiodi Savona staff transferred to the company. Afterthe closure of the financial year, a further 26contracts were sold. The contracts were acquiredby BPU Leasing, and in order to close the
company down the remaining contracts in LigureLeasing’s portfolio are expected to be soldduring the year and along with them thecompany’s premises.In 2003 Carige Asset management SGRwas formed. Operations during the year werestill limited. The company received authorisationto carry out asset management services and wasenrolled in the registry of manager trusts on 10th
January 2004. The company will seek to achieveheightened profitability by integrating all theGroup’s asset management business. It will alsohave autonomy in developing new products.Clients will also benefit from significant costcontainments.
Other subsidiaries
Galeazzo Srl principally manages propertyleased to Banca Carige in Lavagna (to the eastof Genoa). It also manages other propertyleased to third parties in Genoa. During 2003,the company recorded a net profit of 68,000euros in comparison to 211,000 euros in 2002.The previous year’s profit benefited from acapital gain of 208,000 euros realised on thesale of certain properties. Given the fact that thecompany’s net assets are disproportionate to thelimited activities carried out, 1.2 million inextraordinary reserves was distributed.Columbus Carige Immobiliare SpAmanages the property leases of the Group’ssubsidiaries as well as investing in real estate.

231
The company closed the year with a net profit of504,000 euros in comparison to 137,000 eurosin 2002. This increase was due to a 75.8% risein net production value from 624,000 euros to1,472,000 euros, boosted by capital gainsrealised on the sale of investment property andsharp falls in financial expenses (-57.5%) from624,000 euros to 1,472,000 euros, the latterstemming from the company’s recent policy ofselling off non-strategic investments.With regards to the portfolio of propertiesdestined to be leased to the Group’s companies,6 new properties were acquired during the yearfor around 5 million. The activity of propertytrading continued with the acquisition of 11properties and the sale of 8.In order to provide the company with suitablyrobust net assets for the purchase of propertydestined to be leased, share capital was raisedfrom 21 to 26 million, fully subscribed by BancaCarige.Immobiliare Ettore Vernazza SpArecorded a profit of 0.9 million, down on theprevious year’s result of 0.4 million (-33.3%).The fall was due to the extraordinary effectsrecorded in 2002 of the tax breaks contained inthe second edition of the so-called ‘TremontiLaw’; more specifically the benefits arose on the
renovation of property managed by thecompany in Genoa.Immobiliare Carisa Srl, a fully-ownedsubsidiary of Cassa di Risparmio di Savona,ended the year with a loss of 9,000 euros,principally the result of interest charges of107,000 euros payable to Carisa.Centro Fiduciario SpA closed the year with aprofit of 121.7 thousand euros, down 2.8% onthe previous year’s result. Production revenuesrose 7.4% to 822.4 thousand, whilst costsincreased by 5% to 606.4 thousand. These costswere fully related to personnel expenses. Thepositive net operating result was 216 thousand,up 15% over 2002. This growth was, however,offset by a fall in revenue flows resulting fromlow interest rates, and the costs of a courtsettlement following litigation with an ex-employee. Amounts under trust managementrose 6.1% to 233 million. The companybenefited considerably from the incentivescontained in Law decree 350/01 (taxconcessions for the return of capital taken out ofItaly during the period of capital controls) interms of not only increased volumes of business,but also in greater exposure for the company’sactivities.
On 14th January the purchase of a further 55%in the share capital of Priamar Finace fromStitching Faro was completed for € 5,500. Oncompletion of the acquisition, Carige has now a60% holding in the company and the formalitiesfor the incorporation of Priamar into the CarigeGroup began. On 16th January in accordancewith the acquisition contract stipulated on 16th
July 2003, and following authorisation on thepart of regulators, the purchase of 41.05% ofthe share capital of the holding Carinord 2 wascompleted. Through this purchase, Carige hasan indirect holding of 90% in Cassa diRisparmio di Carrara SpA. Subsequently,through the break up of the holding, Carige willhave direct control over the Carrara bank. At thesame time, the shareholders’ meeting ofCarinord 2 appointed its board. Carige’s
representatives in the company are: as boardmember, Mr A. Sanguinetto; as Chairman of theBoard of Statutory Auditors, Mr A. Traverso, andin his absence, Mr A. Semeria. On 29th January,the Bank of Italy informed the subsidiary CarigeAsset Management SGR SpA of its authorisationdated 10th January to operate as a managertrust. The company is enrolled in the list ofcompanies offering savings managementservices foreseen by Legislative decree 58/98(article 35, section 1). Following thisauthorisation, the relevant procedure required toupdate the directory of Italian banking groupsfollowing incorporation into the Carige Group ofCarige Asset management SGR SPA was started.During 2004 the number of Carige Group stafffell by 11, bringing the total of employees to4,343.8.
Genoa, 22nd March 2004 The Board of Directors
SIGNIFICANT EVENTS AFTER31ST DECEMBER 2003

232
CONSOLIDATED FINANCIALSTATEMENTS AT 31/12/2003

233
CONSOLIDATED BALANCE SHEET
ASSETS Change %(thousands of Euros) 31/12/03 31/12/02 2003 2002 10 - CASH AND DEPOSITS WITH CENTRAL BANKS AND POST
OFFICES 192,509 197,247 - 2.4 5.9 20 - TREASURY BILLS AND SIMILAR BILLS ELIGIBLE FOR
REFINANCING WITH CENTRAL BANKS 884,964 427,642 … - 25.9 30 - DUE FROM BANKS: 918,431 1,320,229 - 30.4 13.1
(a) repayable on demand 346,689 547,759 - 36.7 76.9(b) other deposits 571,742 772,470 - 26.0 - 10.0
40 - LOANS TO CUSTOMERS 9,421,748 8,746,577 7.7 13.2including:– loans using funds managed on behalf of third parties 255 188 35.6 -
50 - BONDS AND OTHER DEBT SECURITIES: 1,501,080 1,759,587 - 14.7 - 17.2(a) issued by public bodies 721,226 1,031,803 - 30.1 - 7.0(b) issued by banks 421,719 429,387 - 1.8 - 33.2 including: – own securities 63,930 44,916 42.3 - 18.0(c) issued by financial institutions 258,709 199,423 29.7 - 24.0 including: – own securities - - - - (d) issued by others 99,426 98,974 0.5 - 11.1
60 - SHARES, QUOTAS AND OTHER EQUITY SECURITIES 177,932 200,478 - 11.2 … 70 - EQUITY INVESTMENTS 77,524 103,800 - 25.3 6.6
(a) carried at equity 59,361 75,992 - 21.9 23.1(b) others 18,163 27,808 - 34.7 - 22.0
80 - INVESTMENTS IN GROUP COMPANIES 172,600 152,385 13.3 17.8(a) carried at equity 172,600 152,385 13.3 17.8(b) others - - -
90 - POSITIVE DIFFERENCE ARISING FROM CONSOLIDATION 87,538 93,236 - 6.1 - 1.0 100 -POSITIVE DIFFERENCE ARISING FROM APPLICATION OF
THE EQUITY METHOD 16,168 14,859 8.8 - 3.3 110 -INTANGIBLE FIXED ASSETS 474,210 480,672 - 1.3 34.2
including:– start-up costs 3,268 1,058 … - 66.4– goodwill 442,392 450,799 - 1.9 36.2
120 - TANGIBLE FIXED ASSETS 1,019,881 967,126 5.5 20.4140 - OWN SHARES - 25,613 - 100.0 - 28.5
(nominal value: 2,313)150 - OTHER ASSETS 864,654 809,174 6.9 79.6160 - ACCRUED INCOME AND PREPAID EXPENSES: 109,015 90,308 20.7 - 9.2
(a) accrued income 100,842 80,497 25.3 - 10.9(b) prepaid expenses 8,173 9,811 - 16.7 7.4 including: – discount on bonds issued 3,596 4,425 - 18.7 …
TOTAL ASSETS 15,918,254 15,388,933 3.4 10.2

234
LIABILITIES AND STOCKHOLDERS’ EQUITY Change %(thousands Euro) 31/12/03 31/12/02 2003 200210 - AMOUNTS OWED TO CREDIT INSTITUTIONS: 1,006,049 1,466,421 - 31.4 1.9
(a) repayable on demand 20,329 44,216 - 54.0 - 48.6(b) with agreed maturity dates or periods of notice 985,720 1,422,205 - 30.7 5.1
20 - AMOUNTS OWED TO CUSTOMERS: 6,861,171 6,900,768 - 0.6 18.2(a) repayable on demand 6,595,428 6,239,389 5.7 19.8(b) with agreed maturity dates or periods of notice 265,743 661,379 - 59.8 5.1
30 - DEBTS EVIDENCED BY CERTIFICATES: 4,512,775 3,657,445 23.4 3.3(a) bonds 4,073,476 3,146,656 29.5 6.9(b) certificates of deposits 351,316 429,497 - 18.2 - 16.6(c) other 87,983 81,292 8.2 0.9
40 - FUNDS MANAGED ON BEHALF OF THIRD PARTIES 368 310 18.7 4.0 50 - OTHER LIABILITIES 655,700 851,226 - 23.0 24.4 60 - ACCRUED EXPENSES AND DEFERRED INCOME: 166,822 149,127 11.9 7.0
(a) accrued expenses 97,455 83,940 16.1 - 11.8(b) deferred income 69,367 65,187 6.4 47.5
70 - RESERVE FOR TERMINATION INDEMNITIES 96,814 103,515 - 6.5 15.5 80 - RESERVES FOR RISKS AND CHARGES 440,194 420,792 4.6 - 2.9
(a) reserves for pensions and similar commitments 295,310 294,061 0.4 - 3.4(b) reserves for taxation 106,847 88,574 20.6 - 6.0(c) consolidation reserves for future risks and charges - - - - (d) other reserves 38,037 38,157 - 0.3 9.9
90 - RESERVES FOR LOAN LOSSES 19,997 14,644 36.6 …100 - RESERVES FOR GENERAL BANKING RISKS 100 5,165 - 98.1 - 110 - SUBORDINATED LOANS 517,055 400,000 29.3 - 130 - NEGATIVE DIFFERENCE ARISING FROM APPLICATION
OF THE EQUITY METHOD 34,953 35,134 - 0.5 …140 - MINORITY INTERESTS 17,362 17,539 - 1.0 - 5.2150 - CAPITAL STOCK 1,113,327 1,020,550 9.1 0.3160 - ADDITIONAL PAID-IN CAPITAL 255,023 136,095 87.4 3.1170 - RESERVES 127,752 135,981 - 6.1 20.6
(a) legal reserve 67,351 56,869 18.4 22.3(b) reserve for purchase of treasury stock - 25,613 - 100.0 - 28.5(c) statutory reserves - - - - (d) other reserves 60,401 53,499 12.9 76.0
180 - REVALUATION RESERVES 8,050 8,050 - - 200 - NET INCOME 84,742 66,171 28.1 - 31.1
TOTAL LIABILITIES AND STOCKHOLDERS’ EQUITY 15,918,254 15,388,933 3.4 10.2
GUARANTEES AND COMMITMENTS 10 - GUARANTEES GIVEN 1,336,530 1,391,727 - 4.0 7.7 including:
– acceptances 2,859 4,249 - 32.7 - 55.3– other guarantees 1,333,671 1,387,478 - 3.9 8.2
20 - COMMITMENTS 989,572 820,908 20.5 24.7 including:
– repurchase agreements - - - -
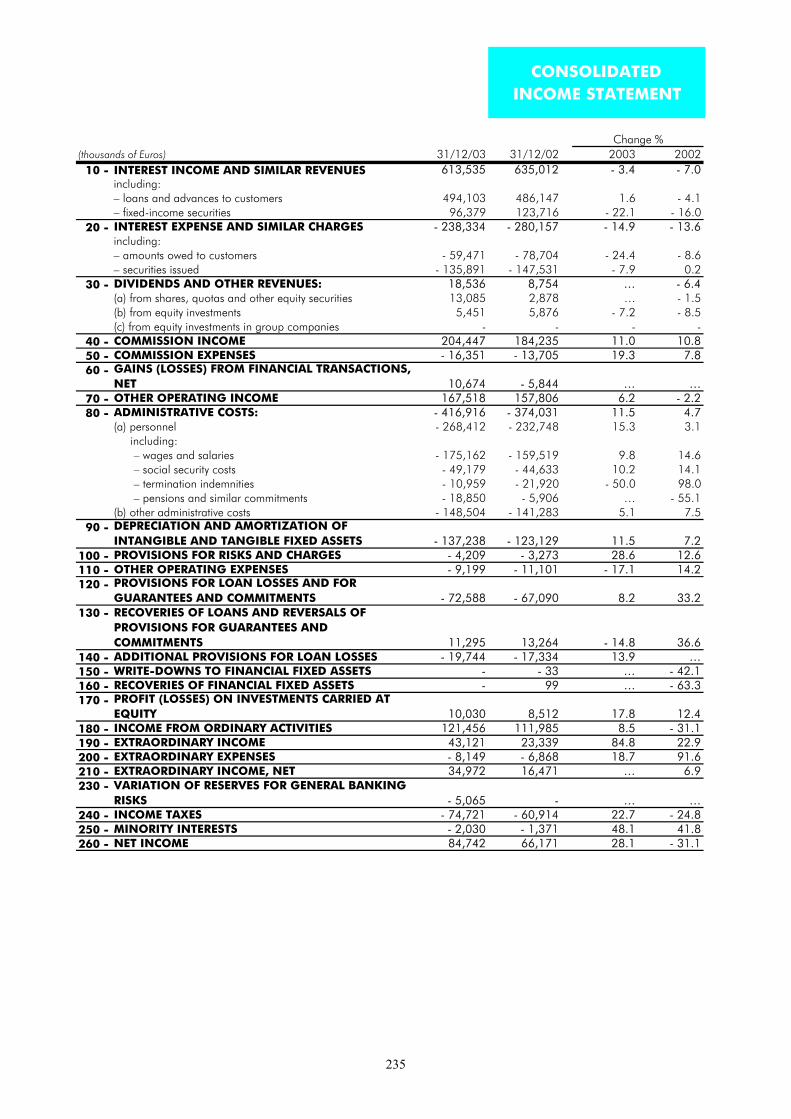
235
CONSOLIDATEDINCOME STATEMENT
Change %(thousands of Euros) 31/12/03 31/12/02 2003 2002 10 - INTEREST INCOME AND SIMILAR REVENUES 613,535 635,012 - 3.4 - 7.0
including:– loans and advances to customers 494,103 486,147 1.6 - 4.1– fixed-income securities 96,379 123,716 - 22.1 - 16.0
20 - INTEREST EXPENSE AND SIMILAR CHARGES - 238,334 - 280,157 - 14.9 - 13.6including:– amounts owed to customers - 59,471 - 78,704 - 24.4 - 8.6– securities issued - 135,891 - 147,531 - 7.9 0.2
30 - DIVIDENDS AND OTHER REVENUES: 18,536 8,754 … - 6.4(a) from shares, quotas and other equity securities 13,085 2,878 … - 1.5(b) from equity investments 5,451 5,876 - 7.2 - 8.5(c) from equity investments in group companies - - - -
40 - COMMISSION INCOME 204,447 184,235 11.0 10.8 50 - COMMISSION EXPENSES - 16,351 - 13,705 19.3 7.8 60 - GAINS (LOSSES) FROM FINANCIAL TRANSACTIONS,
NET 10,674 - 5,844 … … 70 - OTHER OPERATING INCOME 167,518 157,806 6.2 - 2.2 80 - ADMINISTRATIVE COSTS: - 416,916 - 374,031 11.5 4.7
(a) personnel - 268,412 - 232,748 15.3 3.1 including: – wages and salaries - 175,162 - 159,519 9.8 14.6 – social security costs - 49,179 - 44,633 10.2 14.1 – termination indemnities - 10,959 - 21,920 - 50.0 98.0 – pensions and similar commitments - 18,850 - 5,906 … - 55.1
(b) other administrative costs - 148,504 - 141,283 5.1 7.5 90 - DEPRECIATION AND AMORTIZATION OF
INTANGIBLE AND TANGIBLE FIXED ASSETS - 137,238 - 123,129 11.5 7.2 100 - PROVISIONS FOR RISKS AND CHARGES - 4,209 - 3,273 28.6 12.6110 - OTHER OPERATING EXPENSES - 9,199 - 11,101 - 17.1 14.2120 - PROVISIONS FOR LOAN LOSSES AND FOR
GUARANTEES AND COMMITMENTS - 72,588 - 67,090 8.2 33.2130 - RECOVERIES OF LOANS AND REVERSALS OF
PROVISIONS FOR GUARANTEES AND COMMITMENTS 11,295 13,264 - 14.8 36.6
140 - ADDITIONAL PROVISIONS FOR LOAN LOSSES - 19,744 - 17,334 13.9 …150 - WRITE-DOWNS TO FINANCIAL FIXED ASSETS - - 33 … - 42.1160 - RECOVERIES OF FINANCIAL FIXED ASSETS - 99 … - 63.3170 - PROFIT (LOSSES) ON INVESTMENTS CARRIED AT
EQUITY 10,030 8,512 17.8 12.4180 - INCOME FROM ORDINARY ACTIVITIES 121,456 111,985 8.5 - 31.1190 - EXTRAORDINARY INCOME 43,121 23,339 84.8 22.9200 - EXTRAORDINARY EXPENSES - 8,149 - 6,868 18.7 91.6210 - EXTRAORDINARY INCOME, NET 34,972 16,471 … 6.9230 - VARIATION OF RESERVES FOR GENERAL BANKING
RISKS - 5,065 - … …240 - INCOME TAXES - 74,721 - 60,914 22.7 - 24.8250 - MINORITY INTERESTS - 2,030 - 1,371 48.1 41.8260 - NET INCOME 84,742 66,171 28.1 - 31.1

236
INTRODUCTION
These financial statements have been prepared incompliance with Legislative decree 87/92 and theBank of Italy provision dated 30/7/92 andsubsequent modifications.The Balance Sheet and Income Statement showamounts in thousands of euros. Comparison is madeto the business year ending 31/12/02. Captionswhich show no amounts in the balance sheets of theperiods under examination have not been entered.In the explanatory notes, amounts are expressed inthousands of euros, unless otherwise stated. Captionswhich show no amounts for the periods underexamination have been omitted.Section 12.6 “Information regarding securitisationoperations” contains details regarding thesecuritisation of non performing loans carried out bythe Group leader at the end of 2000.In addition to details provided in the explanatorynotes full details are also given in the Board ofDirectors’ report.
Basis of consolidation
The Consolidated Financial Statements containsfinancial data relative to Banca Carige and all itssubsidiaries operating directly or indirectly inbanking, financial and non-financial services.The following companies were fully consolidated:
Company Activity Equityratio %
Galeazzo Srl Real estate 100.000Columbus CarigeImmobiliare SpA
Real estate 100.000
Immobiliare E. VernazzaSpA
Real estate 100.000
Carige AssetManagement S.g.r. SpA(1)
Finance 99.964
Cassa di Risparmio diSavona SpA
Banking 95.901
Ligure Leasing SpA Finance 95.901Immobiliare Carisa Srl Real estate 95.901Centro Fiduciario SpA Trust company 96.110Argo Finance One Srl Finance 60.000Banca del Monte di LuccaSpA
Banking 54.000
(1) The company received Bank of Italy authorisation toconduct business in 2004.
The following companies were accounted for by theequity method:Company Activity Equity
ratio %Carige Vita Nuova SpA Insurance 92.809Carige Assicurazioni SpA(2)
Insurance 90.818
Assi 90 Srl Insurancerelated services
54.940
AG Srl Insurancerelated services
54.940
FrankfurterBankgesellschaft AG
Banking 47.500
Savona 2000 Srl Insurancerelated services
43.952
Assimilano Srl Insurancerelated services
32.964
Autostrada dei Fiori SpA Other 20.456Recina Servizi Srl Insurance
related services13.735
(1) Equity ratio does not take into account the subscriptionof 17,022 shares by Banca Carige within the confines of ashare capital increase that as at 31/12/03 was to still becompleted.
The consolidation of Carige Assicurazioni SpA andCarige Vita Nuova was carried out by applying theequity method in the light of the nature of insurancecompanies’ activities and, subsequently, theirfinancial statements.With regards to Carige Assicurazioni, the Group’sequity ratio in the company rose from 90.708% to90.818% following the purchase on the part of thesubsidiary of 129 own shares. At 31st December2003, 17,022 new shares had been subscribed foran overall value of 20,001 thousand euros. Duringthe year, Carige Assicurazioni and Carige VitaNuova acquired direct control of Assi 90 Srl andindirect control of AG Srl, Assimilano Srl and Savona2000 Srl in addition to s significant holding in RecinaServizi Srl. For this reason the valuation of the twoinsurance subsidiaries via the application of theequity method was carried out on the basis of the twocompanies’ respective financial statements with valueadjustments made where appropriate on the basis ofvaluation at equity rather than cost of the insurance-related service companies referred to above. Thisvaluation generated positive differences attributableto the Group of 2,791 thousand euros, to bedepreciated over 5 years, and negative differences of24 thousand euros.As a result of these direct and indirect holdings, theGroup has significant positions in the ownershipstructures of the following companies: U.C. Sport eSicurezza (45.908%); Atoma Srl (36.627%); AssistarsSrl (18.773%); BDA SpA (10.988%); Didiass Srl(10.988%). The valuation of these companies is thatstated in the respective financial statements in light ofthe fact that any valuation differences arising from theapplication of the equity method would beinsignificant.
CONSOLIDATED EXPLANATORYNOTES

237
For the same reason, the Group’s holding in SocietàConsortile per il Diploma di Giurista d’Impresa a.r.l.was not valuated according to the equity method.
During the year the Group sold its holding inEptaconsors SpA. The 2002 consolidated loss ofEptaconsors SpA pertaining to the Group (1,307thousand euros) is at caption 170 "Profit (losses) oninvestments carried at equity" of the consolidatedbalance sheet. Caption 190 "Extraordinary income"receives instead 2,165 thousand euros, differencebetween cession price and valutation by equitymethod of the holding in Eptaconsors SpA based onits consolidated balance sheet at 31/12/2002.
Statements referred to
The consolidated balance sheet was prepared byusing the financial statements of the consolidatedcompanies reclassified and adjusted to conform toregulations in force and the Group’s accountingprinciples.
Reference date
Financial data from those statements used forconsolidation are as at 31/12/03. The accounting ofthe associated companies under the equity methodmakes reference to the most recently approvedbalance sheet.
Consolidation principles
Subsidiaries, excluding those operating in insurance,are fully consolidated. Therefore, assets, liabilities,off-balance sheet items as well as receivables andpayables are included. The insurance subsidiariesalong with those companies offering insurance-related services were accounted for under the equitymethod.Consolidated holdings in subsidiaries are offset bythe corresponding proportion of the subsidiaries’carrying value of net assets recorded in theconsolidated statement for the first time. In the eventof differences emerging, these are put down to thesubsidiaries’ assets and liabilities. Differences for theyear resulting from consolidation pertaining to thirdparties are recorded at a specific caption. Inaccordance with the Bank of Italy’s instructionsregarding consolidated statements, positivedifferences arising from consolidation are partiallyoffset by the relative revaluation and credit riskreserve provisions of those subsidiaries to which theyrefer. In addition, these are written down againstnegative differences stemming from consolidationuntil the two amounts match.The remaining amount is considered goodwill and ischarged to assets at “Positive differences arising fromconsolidation”. Subsequent to the year in whichconsolidation were calculated, changes pertaining tothe Group in subsidiaries’ net assets are recorded inthe consolidated statements at the relevant caption
under liabilities; changes relative to third parties arerecorded at caption 140 “Minority interests”.Significant intra-subsidiary relations have beeneliminated.The accounting principles applied in the preparationof financial statements of those companiesconsolidated were brought into line in the case ofsignificant differences being present at consolidation.The value of insurance companies and those in whichBanca Carige has a significant holding wascalculated by applying the equity method. In the caseof a company in which Banca Carige has asignificant interest having itself to prepare aconsolidated statement, consolidated net assets wereused as the basis for calculation.Positive differences arising from the increase in valueof the investment are recorded under net equity as“equity investments” for the share that refers to fixedassets, and at “Positive differences arising fromapplication of the equity method” for the part relatedto goodwill.Negative differences are classified under “Negativedifferences arising from application of the equitymethod”.Positive or negative changes in the value of the equityinvestment arising in the first six months of the yearare accounted for. This change is recorded atcaption 170 of the consolidated income statement“Profit (loss) on investments carried at equity”.
Consob request for information (Consobcommunication no. 1011405 dated15/2/2001)
Below is presented the information Italian banks arerequired to supply to Consob pursuant to article 114,legislative decree 58/98.
a) Tax relief foreseen by articles 22 and 23of Legislative decree 153/99
The European Commission in its decision of 11th
December 2001 judged the tax relief foreseen byLegislative decree 153/99 as State aidincompatible with the principles of the commonmarket.The Italian Government lodged an appeal againstthe decision with the Court of European Justice.The Italian Banking Association (ABI) alsopresented on 25th February 2002 an appealagainst the decision at the Tribunal ofLuxembourg. Banca Carige actively supports ABI’sdecision and will give the necessary help requiredin preparing an effective line of defence.On 15th June 2002 Law decree 63/2002 wasconverted into Law 212/2002 implementing theEuropean Commission’s decision and suspendingthe tax relief contained in articles 22 and 23 ofLegislative decree 153/99 from 2001 until thequestion is resolved. From 2001 onwardsawaiting judgement on ABI’s appeal, the Banksuspended special reserve provisions. On 24th

238
December 2002 Law decree 282/02 was enactedwhich, in carrying out the provisions of the EUCommission, obliged those banks which hadbenefited from Legislative decree 153/99 toreturn the sums owed plus interest charges within31/12/02.The Group leader, Banca Carige SpA, repaid1,557 thousand. Given the nature of the case(litigation with the European Community) thisamount was recorded at item ‘tax credits’.The total credit is matched by adequate provisionsto tax reserves in the event of a negative decisionon the part of the Court.
b) Special rate mortgages (Law 133/99and article 145 of Law accompanying2001 Budget)
Article 29 of Law 133/99 foresees the re-negotiation of mortgage with charges, all or inpart, to be covered by the State or public bodiesat an reference interest rate equal to the system-wide average (as defined by article 145 of theLaw accompanying the 2001 budget).The renegotiation rate to be applied wasestablished by article 2 of the Economy andFinance Ministry’s Decree dated 31/3/03.On renegotiation at the rate defined in the aboveDecree, charges calculated by Banca Carige SpAfor 2003 and previous years will be met by thespecific reserve constituted in 2000. The questionhas limited importance for the other banks of theGroup.
c) Capitalisation of interest due(Constitutional Court Sentence 425 of9/10/00)
The Constitutional Court’s ruling number 425 of9/10/00 declared illegitimate the contents ofarticle 25, Legislative decree 344/99. The articleexcluded from liability to legal action thoseclauses between banks and customers relating tocapitalisation of interest due signed after thecoming into effect of the Inter-ministerialCommittee for Credit and Saving’s deliberation of22/4/00, enacting Legislative decree 344/99.The Constitutional Court confined its judgementexclusively to a criticism of the government in itsenactment of the above-mentioned law.In the light of the above and the inevitability offurther legislation on the matter, the banks of theGroup have declined the requests they havereceived from customers for the return of interestpaid until June 2000 as a result of the quarterlycapitalisation of bank interest income.The number of actions started for the return ofinterest charges paid has progressively decreasedover time. Given that it is reasonable to expectthat the actions will be time-barred after ten years,
the exceptionable period of time as at 2003 isreduced from 1994 to 30th June 2000.For the limited number of actions started, theBank strongly contests the grounds for returningamounts previously paid also in the light ofdiffering positions regarding the matter on thepart of judges. If anything, the majority of firstinstance and appeal court judges have so farupheld the validity of using different time periodsfor the calculation of customers’ interest incomeand charges.
These consolidated financial statements wereaudited by Deloitte & Touche SpA. The selection ofthe Bank’s auditors for the period 2003-2005 wasapproved by the Shareholders’ Meeting of 31/3/03pursuant to Legislative decree 58/98. The duties ofthe auditors for the period are the auditing of theBank’s financial statements, the consolidatedfinancial statements, and a limited review of the halfyearly report at 30 June.

239
SECTION 1The Accounting Policies are in compliance with lawdecree 87/92 and the Bank of Italy’s provisions of30/7/92 and subsequent modifications and are thesame as those used previous year.
LOANS, GUARANTEES AND COMMITMENTSLoans are stated at their estimated realizable valueand are determined according to debtors’ solvencyand the debt-paying difficulty of the debtor’s homecountry.The valuation of loans is made under the applicationof either an analytic or lump-sum method.The interest on overdue loans is adjusted by theportion of loans considered to be irrecoverable.Reserves for loan losses, recorded under “Liabilities”,have been created exclusively to offset contingentcredit risks.Reserves for guarantees and commitments, recordedunder “Liabilities” have been created to offset thisparticular kind of risk.
SECURITIES PORTFOLIO AND OFF-BALANCESHEET TRANSACTIONS EXCLUDING THOSEIN CURRENCY
Investment securities. Investment securities arevalued at cost, adjusted on an accruals basis for thedifference between cost and their redemption atmaturity and includes unamortized issue premiums ordiscounts.In the event of long term deterioration of the issuer’ssolvency, the securities are written down. In the caseof those securities deriving from structured securitiseddebt transactions, writing down is carried out on thebasis of expected proceeds stemming from theunderlying.The original value of investment securities isreinstated when the reasons for writing down cease toapply.Trading securities.
– trading securities quoted on organised marketsare valued either at purchase price or the averagemarket price for the last month of the year,whichever is lower;
– securities not quoted on organised markets arevalued at cost adjusted for market trends andissuer solvency. In the case of those securitiesderiving from structured securitised debttransactions, value adjustments are carried out onthe basis of expected proceeds stemming from theunderlying.
The purchase price, determined according to theprinciple of daily weighted average, includesadjustments for the relevant annual quota of issue
premium or discount accumulated during the periodthe securities are held.Securities held at 1/12/91 and still in portfolio atyear end 2003 are valued at cost defined as thevalue of transfer to Banca Carige at 1/12/91 andadjusted for issue premium or discount pursuant toLegislative decree 719/94 and subsequent changes.The original value of the securities is reinstated whenthe reasons for writing down cease to apply.Any securities to be transferred from the investment totrading portfolio will be recorded at the book valueon the date of transfer calculated on the basis of thecriteria applied to investment securities foreseen inthe Bank of Italy’s communication of 12/6/01,CONSOB’s communication no.95001286 of15/2/95, the latter modified by CONSOB’s letterdated 15/6/01. Securities transferred still present inportfolio at year end are valuated according to thecriteria applied to the portfolio to which they aredestined
Off balance sheet operations, excludingthose in currency. Unsettled securitiestransactions are evaluated according to the criteria ofthe portfolio to which they are destined. Unsettledtrading securities transactions are evaluatedaccordingly:
a) with regards to commitments to purchase andcommitments to sell which have the sameunderlying securities with the same nominal value,any positive difference between the settlementprice of the commitment to purchase and thesettlement price of the commitment to sell isrecorded in the income statement;
b) the residual commitments to purchase areevaluated at either settlement price or marketprice, whichever is lower;
c) the residual commitments to sell are evaluated ateither settlement price or book value, whichever islower.
Derivative contracts on securities, interest rate etc.,are evaluated accordingly:a) contracts related to underlying equity invest-
ments are evaluated at cost and written down inthe event of long-term deterioration of the is-suer's solvency;
b) trading derivatives contracts are evaluated ateither cost or market value, whichever is lower.Market value of contracts is that quoted at thelast day of the business year. Those contractswhich are not quoted on organised markets butwhich can be evaluated according to officialparameters, are evaluated at replacement cost atthe last day of the business year;
c) economically-linked trading contracts, which areclosely correlated both technically andfinancially, are evaluated in the same way. Thelosses which exceed connected gains arerecorded in the income statement;
P A R T AACCOUNTING PRINCIPLES

240
d) hedging contracts on trading securities areevaluated in the same way as the underlying:market value is the average of prices andparameters recorded in the last month of thebusiness year. Losses which exceed gains onsecurities or gains which correspond to losses onsecurities are recorded in the income statement;
e) hedging contracts on assets and liabilities whichare evaluated at cost are in turn evaluated atcost.
EQUITY INVESTMENTSThe Bank’s stock rights in relation to its subsidiariesare included under holdings. These rights, in the formof securities or not, are held for investment.Holdings, both substantial and those in Groupsubsidiaries, are valued at purchase cost or sub-scription as according to Law 218/90. The cost iswritten down to reflect any permanent loss in value.The original value is reinstated when the reasons forwriting down ceased to apply. Dividends fromholdings valued at cost are recorded in theaccounting period in which they were deliberated,usually coinciding with the period of collection.
FOREIGN CURRENCY ASSETS ANDLIABILITIES INCLUDING OFF-BALANCESHEET TRANSACTIONSAssets, excluding equity investments, and liabilitiesexpressed in foreign currencies are valued applyingthe spot rate at 31/12/003.Equity investments expressed in foreign currencies arevalued according to the rate in force at the time ofpurchase.Off-balance sheet transactions expressed in foreigncurrencies are valued:
– at the spot rate as of the last business day of theperiod in the case of unsettled spot contracts;
– at the forward exchange rate as of the lastbusiness day of the period for maturitiescorresponding to those of the contracts beingvalued, in the case of forward transactions.
In the case of on-balance sheet assets and liabilitieslinked to off-balance sheet assets and liabilities, off-balance sheet items are accounted for in a mannersimilar to the accounting of on-balance sheet items.
TANGIBLE FIXED ASSETSTangible assets are recorded at purchase price plusrelated charges, and include leased assets and thoseassets that are to be leased.The value of tangible fixed assets includes revaluationin accordance with Laws 575/75, 72/83, 413/91and with reference to capital gains, Law 218/90.Advances to supplies for the purpose of tangible fixedassets are included under tangible fixed assets.Depreciation is determined by using the straight-linemethod over the useful life of each category.Objects of art, being assets which conserve if notincrease their value, are not amortized.
Included in this category are leased assets, in linewith the equity method.
INTANGIBLE FIXED ASSETSIntangible fixed assets are, in those cases foreseen byrelevant legislation, recorded with the consent of theBoard of Statutory Auditors and are amortized on astraight-line basis. Start-up and improvement costs inaddition to research and development costs areamortised over a period not exceeding five years.Amortisation of goodwill stemming from the purchaseof branches from Banco di Sicilia, Intesa andCapitalia will be carried out over twenty years from1st January 2001, 1st October 2001 and 1st January2003.The length of amortisation corresponds to theaverage length of time of goodwill intrinsic in thebranches acquired.Amortisation rates on goodwill deriving from thepurchase of branches stem from the application of ananalytical model which takes into account theexpected returns on the branches acquired and theperiod of time required for their integration into theBanca Carige Group.The method utilises a rising-charge rate until theintegration of the branches acquired is completed(2006 for the ex-Banco di Sicilia branches; 2007 forthe ex-Intesa Group branches; 2008 for the ex-Capitalia Group branches). Post-integrationamortisation will be on a fixed-charge basis.With the application of this methodology, a weightedaverage rate of 1.87% was applied for 2003.
PAYABLESPayables are recorded at face value, with theexception of zero coupon and one coupon debtsecurities, which are recorded at a valuecorresponding to net proceeds plus accrued interest.
TERMINATION INDEMNITYTermination indemnity is in accordance with currentlegislation.
RESERVES FOR RISKS AND CHARGES -RESERVES FOR TAXATIONProvisions for tax were calculated by each companyon the basis of forecasted tax liabilities for the period.Deferred tax provisions have been made relating tothose consolidated revaluations that have had amaterial effect on the result for the accounting periodand for which subsequently liability to tax is expected.In order to present income statement and balancesheet items more completely, taxes relating todividends distributed by subsidiaries and thosecompanies accounted for according to the equitymethod are recorded net of benefits deriving from theuse of related tax credits.
OTHER TAX ASPECTS - DEFERRED TAX:POSITIVE AND NEGATIVE EFFECTS
241
The calculation of deferred tax is made on the basisof the equity method with reference to the timingdifferences existing between the value attributed to anasset or liability under accounting criteria and thevalue attributed to the same for the calculation of tax.Tax advanced is recorded under assets subject to thecondition that, for prudential reasons, there is areasonable expectation of realising, over a period offive years, taxable income sufficient for its recovery.The recording of liabilities for taxes payable in thefuture is subject to the condition that there is apossibility of the liability to tax occurring.The treatment of deferred tax in these financialstatements is in accordance with the Bank of Italy'sinstructions dated 3/8/99.
SUPPLEMENTARY PENSION FUNDThe subsidiaries’ supplementary pension funds aremanaged according to regulations specific to eachcompany.
ACCRUALS AND DEFERRALSAccruals and deferrals are calculated in accordancewith the matching principle.
POSITIVE CONSOLIDATION AND NETEQUITY DIFFERENCESPositive consolidation and net equity differences areamortised over five years.Positive net equity differences relative to majorityholdings in insurance subsidiaries are amortised overa longer period of time in the light of the nature ofinsurance companies' activities and the reasonableexpectation of slower depreciation.Consequently, positive net equity differencesstemming from the consolidation of the insurancesubsidiaries Carige Assicurazioni and Carige VitaNuova are amortised over fifteen years.Differences respectively of net equity andconsolidation relative to Cassa di Risparmio diSavona and Banca del Monte di Lucca are amortisedover twenty years.
SECTION 2
TAX-RELATED ADJUSTMENTS ANDPROVISIONS
2.1 Tax AdjustmentsNot carried out.
2.2 Tax ProvisionsNot carried out.

242
SECTION 1
LOANS
The consolidated loans portfolio, summarized in this section, amounts to 10,532,688 thousands of euros and isanalysed below:
31/12/03 31/12/02thousands of € % thousands of € %
– Cash and deposits with central banksand post offices (caption 10) 192,509 1.8 197,247 1.9
– Due from banks (caption 30) 918,431 8.7 1,320,229 12.9– Loans to customers (caption 40) 9,421,748 89.5 8,746,577 85.2Total 10,532,688 100.0 10,264,053 100.0
Change31/12/03 31/12/02 absolute %
CAPTION 10 "CASH AND DEPOSITSWITH CENTRAL BANKS AND POST OFFICES” 192,509 197,247 -4,738 -2.4Cash 191,271 197,069 -5,798 -2.9Promissory notes of Bank of Italy andpostal orders and cheques 134 107 27 25.2Deposits with– central banks - - - - – post offices 1,104 71 1,033 …Total 192,509 197,247 -4,738 -2.4
Change31/12/03 31/12/02 absolute %
1.1 CAPTION 30 "DUE FROM BANKS" 918,431 1,320,229 -401,798 -30.4(a) deposits with central banks 114,306 163,109 -48,803 -29.9(b) bills eligible for refinancing by central banks - - - - (c) loans for leased assests - - - - (d) repurchase agreements - 19,454 -19,454 …(e) loans of securities - - - -
PART BCONSOLIDATED BALANCE
SHEET

243
Caption 30 detail by technical form is the following:
Change31/12/03 31/12/02 absolute %
Nominal valueDeposits with central banks 114,306 163,109 -48,803 -29.9– Compulsory reserves 114,306 163,109 -48,803 -29.9Deposits with banks 808,021 1,165,035 -357,014 -30.6– Deposits 725,486 963,711 -238,225 -24.7– Repurchase agreements - 19,454 -19,454 -100.0– Discounted notes 1,029 2,795 -1,766 -63.2– Overdraft facilities 41,232 85,455 -44,223 -51.8– Loans (Financial backing) 11,098 63,711 -52,613 -82.6– Long term loans 1,364 211 1,153 546.4– Bad loans 17,455 21,720 -4,265 -19.6– Other 10,357 7,978 2,379 29.8
922,327 1,328,144 -405,817 -30.6(–) Total specific allowances 3,896 7,915 -4,019 -50.8– Long term loans 3,383 7,648 -4,265 -55.8– Other loans 513 267 246 92.1Total 918,431 1,320,229 -401,798 -30.4
At 31/12/03, all non-guaranteed credits to residents outside the OECD were valuated analytically; credit riskpositions are classified as either bad loans or watchlists.
1.2 CASH CREDITS BANKS 31/12/03 31/12/02
CATEGORIES/BALANCES Gross valueSpecific
allowancesNet value Gross value
Specific allowances
Net value
A. Credits at risks 19,281 3,896 15,385 23,132 7,915 15,217A.1 Bad loans 17,455 3,383 14,072 21,720 7,648 14,072A.2 Watchlists 792 513 279 445 267 178A.3 Credits undergoing restructuring - - - - - - A.4 Restructured loans - - - - - - A.5 Non-guaranteed credits towards countries at risk 1,034 - 1,034 967 - 967
B. Performing credits 903,046 - 903,046 1,305,012 - 1,305,012
At 31/12/03, items A.1 “Bad loans” and A.2 “Watchlists” refer entirely to country-risk positions.

244
1.3 DOUBTFUL LOANS BANKS
CATEGORIES/BALANCES Bad loans WatchlistsLoans subject
to rescheduling
Rescheduled loans
Country risk non-
guaranteed loans
A. Total opening exposure at 31/12/02 21,720 445 - - 967A.1 of which: interest on overdue loans 364 - - - -
B. Increases 1,101 502 - - 701B.1 ex-performing loans - - - - - B.2 interest on overdue loans 1,100 - - - - B.3 transfer from other doubtful loan categories - 484 - - - B.4 other increases 1 18 - - 701
C. Decreases 5,366 155 - - 634C.1 re-performing credits - - - - - C.2 write offs 5,366 - - - - C.3 payments received - - - - 1C.4 gains from ceding - - - - - C.5 transfer to other doubtful loan categories - - - - 484C.6 other decreases - 155 - - 149
D. Total closing exposure at 31/12/03 17,455 792 - - 1,034D.1 of which: interest on overdue loans 1,100 - - - -
CATEGORIES/BALANCES Bad loans WatchlistsLoans subject
to rescheduling
Rescheduled loans
Country risk non-
guaranteed loans
A. Total opening exposure at 31/12/01 - - - - 22,592A.1 of which: interest on overdue loans - - - - -
B. Increases 21,720 21,885 - - 59B.1 ex-performing loans - - - - - B.2 interest on overdue loans 364 - - - - B.3 transfer from other doubtful loan categories 21,356 21,303 - - - B.4 other increases - 582 - - 59
C. Decreases - 21,440 - - 21,684C.1 re-performing credits - - - - - C.2 write offs - - - - - C.3 payments received - - - - - C.4 gains from ceding - - - - - C.5 transfer to other doubtful loan categories - 21,356 - - 21,303C.6 other decreases - 84 - - 381
D. Total closing exposure at 31/12/02 21,720 445 - - 967D.1 of which: interest on overdue loans 364 - - - -

245
1.4 TOTAL VALUE ADJUSTMENTS BANKS
CATEGORIES/BALANCES Bad loans WatchlistsLoans subject
to rescheduling
Rescheduled loans
Country risk non-
guaranteed loans
Performing loans
A. Total opening adjustments at 31/12/02 7,648 267 - - - - A.1 of which: interest on overdue loans 365 - - - - -
B. Increases 1,101 296 - - - - B.1 adjustments 1,101 296 - - - - B.1.1 of which: interest on overdue loans 1,100 - - - - - B.2 amounts from credit risk fund - - - - - - B.3 transfer from other loan categories - - - - - - B.4 other increases - - - - - -
C. Decreases 5,366 50 - - - - C.1 recoveries stemming from evaluation - 50 - - - - C.1.1 of which: interest on overdue loans - - - - - - C.2 recoveries stemming from payments received - - - - - - C.2.1 of which: interest on overdue loans - - - - - - C.3 write offs 5,366 - - - - - C.4 transfer to other loan categories - - - - - - C.5 other decreases - - - - - -
D. Total closing adjustments at 31/12/03 3,383 513 - - - - D.1 of which: interest on overdue loans 1,100 - - - - -
CATEGORIES/BALANCES Bad loans WatchlistsLoans subject
to rescheduling
Rescheduled loans
Country risk non-
guaranteed loans
Performing loans
A. Total opening adjustments at 31/12/01 - - - - 7,426 - A.1 of which: interest on overdue loans - - - - - -
B. Increases 7,648 7,020 - - - - B.1 adjustments 945 - - - - - B.1.1 of which: interest on overdue loans 365 - - - - - B.2 amounts from credit risk fund - - - - - - B.3 transfer from other loan categories 6,703 7,020 - - - - B.4 other increases - - - - - -
C. Decreases - 6,753 - - 7,426 - C.1 recoveries stemming from evaluation - 50 - - 406 - C.1.1 of which: interest on overdue loans - - - - - - C.2 recoveries stemming from payments received - - - - - - C.2.1 of which: interest on overdue loans - - - - - - C.3 write offs - - - - - - C.4 transfer to other loan categories - 6,703 - - 7,020 - C.5 other decreases - - - - - -
D. Total closing adjustments at 31/12/02 7,648 267 - - - - D.1 of which: interest on overdue loans 364 - - - - -

246
Change31/12/03 31/12/02 absolute %
1.5 CAPTION 40 “LOANS TO CUSTOMERS” 9,421,748 8,746,577 675,171 7.7(a) bills eligible for refinancing by central banks - - - - (b) loans for leased assets 13,917 11,638 2,279 19.6(c) repurchase agreements - - - - (d) loans of securities - - - -
Coption 40 detail by technical form is the following:
Change31/12/03 31/12/02 absolute %
Nominal valueDiscounted notes 32,784 38,411 -5,627 -14.6Advances with recourse 283,334 302,555 -19,221 -6.4Current accounts 1,514,592 1,642,710 -128,118 -7.8Other non-current account loans 2,091,211 2,148,114 -56,903 -2.6Loans backed by pledged assets 14,981 14,370 611 4.3Mortgage loans 4,925,453 4,238,040 687,413 16.2Salary backed loans 16,977 12,221 4,756 38.9Consumer credit loans 4,242 4,338 -96 -2.2Factoring 99,141 96,174 2,967 3.1Loans for leased assets 13,917 11,638 2,279 19.6Bad loans 327,981 260,906 67,075 25.7Postal bonds 211,000 61,000 150,000 245.9Other 45,937 50,365 -4,428 -8.8
9,581,550 8,880,842 700,708 7.9(–) Total specific allowances 159,802 134,265 25,537 19.0 – Bad loans 137,327 114,369 22,958 20.1 – Other 22,475 19,896 2,579 13.0Total 9,421,748 8,746,577 675,171 7.7
The nominal value of the credits was adjusted to take into account expected losses as follows:
31/12/03 31/12/02– analytic allowances 152,321 128,093– lump-sum allowances 7,481 6,172 - country risks - - - other 7,481 6,172Total 159,802 134,265
All bad loan positions are evaluated analytically as are significant watchlist and country-risk positions specified at1.1.Other watchlists are evaluated on a lump-sum basis.
Rescheduled loans were evaluated analytically calculating future flows on the basis of the difference betweenrenegotiated interest rates and the annual average yield for interbank company loans for 2003.
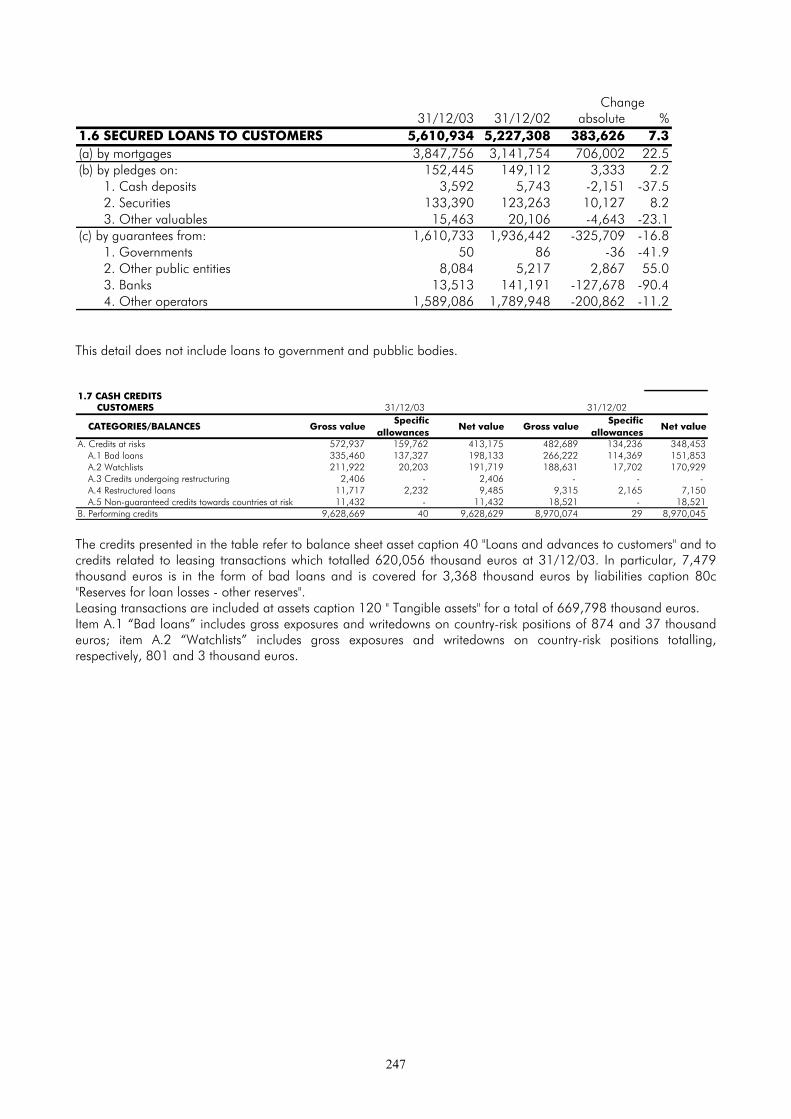
247
Change31/12/03 31/12/02 absolute %
1.6 SECURED LOANS TO CUSTOMERS 5,610,934 5,227,308 383,626 7.3(a) by mortgages 3,847,756 3,141,754 706,002 22.5(b) by pledges on: 152,445 149,112 3,333 2.2
1. Cash deposits 3,592 5,743 -2,151 -37.52. Securities 133,390 123,263 10,127 8.23. Other valuables 15,463 20,106 -4,643 -23.1
(c) by guarantees from: 1,610,733 1,936,442 -325,709 -16.81. Governments 50 86 -36 -41.92. Other public entities 8,084 5,217 2,867 55.03. Banks 13,513 141,191 -127,678 -90.44. Other operators 1,589,086 1,789,948 -200,862 -11.2
This detail does not include loans to government and pubblic bodies.
1.7 CASH CREDITS CUSTOMERS 31/12/03 31/12/02
CATEGORIES/BALANCES Gross valueSpecific
allowancesNet value Gross value
Specific allowances
Net value
A. Credits at risks 572,937 159,762 413,175 482,689 134,236 348,453A.1 Bad loans 335,460 137,327 198,133 266,222 114,369 151,853A.2 Watchlists 211,922 20,203 191,719 188,631 17,702 170,929A.3 Credits undergoing restructuring 2,406 - 2,406 - - - A.4 Restructured loans 11,717 2,232 9,485 9,315 2,165 7,150A.5 Non-guaranteed credits towards countries at risk 11,432 - 11,432 18,521 - 18,521
B. Performing credits 9,628,669 40 9,628,629 8,970,074 29 8,970,045
The credits presented in the table refer to balance sheet asset caption 40 "Loans and advances to customers" and tocredits related to leasing transactions which totalled 620,056 thousand euros at 31/12/03. In particular, 7,479thousand euros is in the form of bad loans and is covered for 3,368 thousand euros by liabilities caption 80c"Reserves for loan losses - other reserves".Leasing transactions are included at assets caption 120 " Tangible assets" for a total of 669,798 thousand euros.Item A.1 “Bad loans” includes gross exposures and writedowns on country-risk positions of 874 and 37 thousandeuros; item A.2 “Watchlists” includes gross exposures and writedowns on country-risk positions totalling,respectively, 801 and 3 thousand euros.

248
1.8 DOUBTFUL LOANS CUSTOMERS
CATEGORIES/BALANCES Bad loans WatchlistsLoans subject
to rescheduling
Rescheduled loans
Country risk non-
guaranteed loans
A. Total opening exposure at 31/12/02 266,222 188,631 - 9,315 18,521A.1 of which: interest on overdue loans 46,887 5,485 - - -
B. Increases 167,934 122,261 2,406 2,775 1,366B.1 ex-performing loans 91,168 113,017 2,406 2,775 - B.2 interest on overdue loans 13,902 1,881 - - - B.3 transfer from other doubtful loan categories 48,605 16 - - - B.4 other increases 14,259 7,347 - - 1,366
C. Decreases 98,696 98,970 - 373 8,455C.1 re-performing credits - 35,157 - 275 - C.2 write offs 54,768 227 - - - C.3 payments received 43,347 7,480 - 98 4,883C.4 gains from ceding - - - - - C.5 transfer to other doubtful loan categories 16 48,605 - - - C.6 other decreases 565 7,501 - - 3,572
D. Total closing exposure at 31/12/03 335,460 211,922 2,406 11,717 11,432D.1 of which: interest on overdue loans 47,259 5,060 - - -
Customers
CATEGORIES/BALANCES Bad loans WatchlistsLoans subject
to rescheduling
Rescheduled loans
Country risk non-
guaranteed loans
A. Total opening exposure at 31/12/01 301,489 187,817 - 7,902 12,528A.1 of which: interest on overdue loans 66,346 6,690 - - -
B. Increases 131,001 72,840 - 1,977 9,965B.1 ex-performing loans 60,993 62,926 - 1,977 - B.2 interest on overdue loans 15,349 2,096 - - - B.3 transfer from other doubtful loan categories 42,580 1,011 - - - B.4 other increases 12,079 6,807 - - 9,965
C. Decreases 166,268 72,026 - 564 3,972C.1 re-performing credits 1,706 11,007 - - - C.2 write offs 97,443 261 - 451 - C.3 payments received 38,835 4,863 - - 31C.4 gains from ceding 28,027 636 - - - C.5 transfer to other doubtful loan categories 39 42,580 - - 972C.6 other decreases 218 12,679 - 113 2,969
D. Total closing exposure at 31/12/02 266,222 188,631 - 9,315 18,521D.1 of which: interest on overdue loans 46,887 5,485 - - -
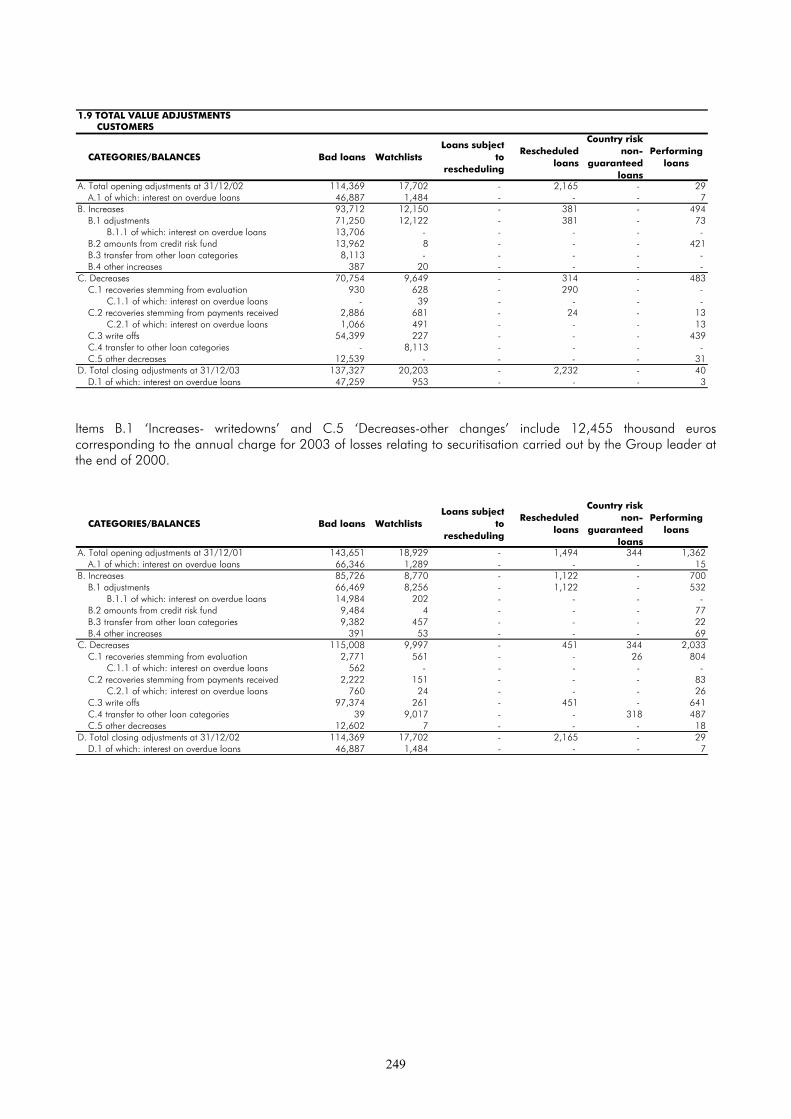
249
1.9 TOTAL VALUE ADJUSTMENTS CUSTOMERS
CATEGORIES/BALANCES Bad loans WatchlistsLoans subject
to rescheduling
Rescheduled loans
Country risk non-
guaranteed loans
Performing loans
A. Total opening adjustments at 31/12/02 114,369 17,702 - 2,165 - 29A.1 of which: interest on overdue loans 46,887 1,484 - - - 7
B. Increases 93,712 12,150 - 381 - 494B.1 adjustments 71,250 12,122 - 381 - 73 B.1.1 of which: interest on overdue loans 13,706 - - - - - B.2 amounts from credit risk fund 13,962 8 - - - 421B.3 transfer from other loan categories 8,113 - - - - - B.4 other increases 387 20 - - - -
C. Decreases 70,754 9,649 - 314 - 483C.1 recoveries stemming from evaluation 930 628 - 290 - - C.1.1 of which: interest on overdue loans - 39 - - - - C.2 recoveries stemming from payments received 2,886 681 - 24 - 13 C.2.1 of which: interest on overdue loans 1,066 491 - - - 13C.3 write offs 54,399 227 - - - 439C.4 transfer to other loan categories - 8,113 - - - - C.5 other decreases 12,539 - - - - 31
D. Total closing adjustments at 31/12/03 137,327 20,203 - 2,232 - 40D.1 of which: interest on overdue loans 47,259 953 - - - 3
Items B.1 ‘Increases- writedowns’ and C.5 ‘Decreases-other changes’ include 12,455 thousand euroscorresponding to the annual charge for 2003 of losses relating to securitisation carried out by the Group leader atthe end of 2000.
CATEGORIES/BALANCES Bad loans WatchlistsLoans subject
to rescheduling
Rescheduled loans
Country risk non-
guaranteed loans
Performing loans
A. Total opening adjustments at 31/12/01 143,651 18,929 - 1,494 344 1,362A.1 of which: interest on overdue loans 66,346 1,289 - - - 15
B. Increases 85,726 8,770 - 1,122 - 700B.1 adjustments 66,469 8,256 - 1,122 - 532 B.1.1 of which: interest on overdue loans 14,984 202 - - - - B.2 amounts from credit risk fund 9,484 4 - - - 77B.3 transfer from other loan categories 9,382 457 - - - 22B.4 other increases 391 53 - - - 69
C. Decreases 115,008 9,997 - 451 344 2,033C.1 recoveries stemming from evaluation 2,771 561 - - 26 804 C.1.1 of which: interest on overdue loans 562 - - - - - C.2 recoveries stemming from payments received 2,222 151 - - - 83 C.2.1 of which: interest on overdue loans 760 24 - - - 26C.3 write offs 97,374 261 - 451 - 641C.4 transfer to other loan categories 39 9,017 - - 318 487C.5 other decreases 12,602 7 - - - 18
D. Total closing adjustments at 31/12/02 114,369 17,702 - 2,165 - 29D.1 of which: interest on overdue loans 46,887 1,484 - - - 7

250
SECTION 2
SECURITIES
The securities held by the Bank amount to 2,563,976 thousand euros and are analysed below:
31/12/03 31/12/02thousands of € % thousands of € %
– Treasury bills and other bills eligible forrefinancing with central banks (caption 20) 884,964 34.5 427,642 17.9
– Bonds and other debt securities (caption 50) 1,501,080 58.5 1,759,587 73.7– Shares, quotas and other equity securities (caption 60) 177,932 7.0 200,478 8.4Total 2,563,976 100.0 2,387,707 100.0of which:– Investment securities 215,697 8.4 241,968 10.1– Trading securities 2,348,279 91.6 2,145,739 89.9
Change31/12/03 31/12/02 absolute %
2.1 INVESTMENT SECURITIES 215,697 241,968 -26,271 -10.9
31/12/03 31/12/02Book Market Book Marketvalue value value value
1. Certificates of indebtedness 215,697 215,360 241,968 240,3471.1 Government securities 101,526 101,839 94,706 95,116– listed 101,526 101,839 94,706 95,116– unlisted - - - - 1.2 Other securities 114,171 113,521 147,262 145,231– listed 32,243 31,961 75,523 73,719– unlisted 81,928 81,560 71,739 71,5122. Shares and equity securities - - - - – listed - - - - – unlisted - - - - Total 215,697 215,360 241,968 240,347
Book value of investment securities comprises the difference, on the basis of “pro rata temporis” criteria, betweencost and redemption value, including issue premium or discount; market value is the average price recorded duringthe first six months of the year.The difference between book and market value (337 thousand euros) represents the potential loss for the portfolio.The positive and negative differences between book value and re-payment value at maturity total 912 thousandeuros and 391 thousand euros, respectively. These differences were calculated separately for each category.

251
Book Redemption Positive Negativevalue value differences differences
1. Listed certificates of indebtedness 133,769 133,191 912 334Public bodies 101,526 100,781 828 83Banks 25,072 25,022 84 34Other 7,171 7,388 - 217
2. Unlisted certificates of indebtedness 81,928 81,985 - 57Public bodies - - - - Banks 6,059 6,116 - 57Other 75,869 75,869 - -
Total 215,697 215,176 912 391
2.2 CHANGES IN INVESTMENT SECURITIES31/12/03 31/12/02
A. Opening balances 241,968 460,123B. Increases 35,749 160,454
B1. Purchases 33,148 57,980B2. Writebacks - - B3. Transfers from trading portfolio - 100,116B4. Other changes 2,601 2,358
C. Decreases 62,020 378,609C1. Sales 61,758 149,760C2. Redemptions 25 228,101C3. Adjustments including - - - permanent writedowns - - C4. Transfers to trading portfolio - - C5. Other changes 237 748
D. Closing balances 215,697 241,968
Transfers to and/or from the investment securities portfolio were carried out in accordance with the Bank of Italy’scommunication of 12/6/01, CONSOB’s communication no.95001286 of 15/2/95, subsequently modified byCONSOB’s letter of 15/6/01, and the policy documents approved by the Board of Directors of Banca Carige.During 2003, in accordance with the provisions of the above-mentioned Board of Directors’ document, a part ofthe investment securities portfolio of Banca Carige was sold to provide liquidity for expansion in operationalcapacities via branch acquisitions (external growth). The sale of securities for 61,391 thousand produced a capitalgain of 2,494 thousand.
Change31/12/03 31/12/02 absolute %
2.3 TRADING SECURITIES 2,348,279 2,145,739 202,540 9.4
31/12/03 31/12/02Book Market Book Marketvalue value value value
1. Certificates of indebtedness 2,170,347 2,225,255 1,945,261 1,967,5671.1 Government securities 1,141,384 1,150,627 1,349,252 1,364,581– listed 1,139,235 1,148,461 1,346,977 1,362,288– unlisted 2,149 2,166 2,275 2,2931.2 Other securities 1,028,963 1,074,628 596,009 602,986– listed 839,299 882,259 419,695 425,176– unlisted 189,664 192,369 176,314 177,8102. Shares and equity securities 177,932 185,705 200,478 202,817– listed 175,612 183,132 161,213 163,459– unlisted 2,320 2,573 39,265 39,358Total 2,348,279 2,410,960 2,145,739 2,170,384
The difference between market value and book value represents potential non-recorded capital gains for the periodand amounts to 62,681 thousand euros, of which 45,112 thousand euros related to hedging forward transactions.

252
2.4 CHANGES IN TRADING SECURITIES31/12/03 31/12/02
A. Opening balances 2,145,739 2,340,547B. Increases 8,861,914 8,424,304
B1. Purchases 8,816,018 8,355,979 - Certificates of indebtedness 7,732,418 7,797,622 . Government securities 5,514,304 6,659,903 . other securities 2,218,114 1,137,719 - Shares and other equity securities 1,083,600 558,357B2. Writebacks and revaluations 1,650 1,085B3. Transfers from investment portfolio - - B4. Other changes 44,246 67,240
C. Decreases 8,659,374 8,619,112C1. Sales and redemptions 8,630,828 8,471,468 - Certificates of indebtedness 7,532,887 8,034,047 . Government securities 5,745,919 6,485,824 . other securities 1,786,968 1,548,223 - Shares and other equity securities 1,097,941 437,421C2. Adjustments 6,881 21,075C3. Transfers to investment portfolio - 100,116C4. Other changes 21,665 26,453
D. Closing balances 2,348,279 2,145,739

253
SECTION 3
EQUITY INVESTMENTS
Equity investments amount to 250,124 thousand euros and are analysed as follows:
31/12/03 31/12/02thousands of € % thousands of € %
– Equity investments (caption 70) (a) - carried at equity 59,361 23.7 75,992 29.7 (b) - others 18,163 7.3 27,808 10.8– Investments in Group companies (caption 80) (a) - carried at equity 172,600 69.0 152,385 59.5 (b) - others - - - - Total 250,124 100.0 256,185 100.03.1 SIGNIFICANT INVESTMENTS
Name (1) (2) (3) (4) (6) (7)(5.1) (5.2)
A. Companies included in the basis of consolidationA.1 Fully consolidated (a) 1. Banca CARIGE SpA Genoa 1 - - - - - XXX 2. Galeazzo Srl Genoa 1 3,849 68 A1.1 100.00 100.00 XXX 3. Columbus Carige Imm. SpA Genoa 1 25,095 505 A1.1 99.98 99.98 XXX
A1.2 0.02 0.02 XXX 4. Cassa di Risparmio di Savona SpA Savona 1 152,355 19,478 A1.1 95.90 95.90 XXX 5. Ligure leasing SpA Savona 1 7,756 15 A1.4 100.00 100.00 XXX 6. Immobiliare CARISA Srl Savona 1 1,806 -9 A1.4 100.00 100.00 XXX 7. Carige Asset Management S.G.R. SpA Genoa 1 5,132 -68 A1.1 99.50 99.50 XXX
B.2 0.50 0.50 XXX 8. Imm. Ettore Vernazza SpA (b) Genoa 1 5,134 890 A1.1 90.00 100.00 XXX 9. Centro Fiduciario SpA Genoa 1 967 122 A1.1 76.93 76.93 XXX
A1.4 20.00 20.00 XXX 10. Argo Finance One Srl Genoa 1 10 - A1.1 60.00 60.00 XXX 11. Banca del Monte di Lucca SpA Lucca 1 26,511 2,493 A1.1 54.00 54.00 XXXA.2 Proportional consolidationB. Companies accounted for under the equity method 1. Carige Assicurazioni SpA (c) (d) Milan 1 138,369 2,726 A1.1 89.18 90,82 124,420 2. Carige Vita Nuova SpA (d) (e) Genoa 1 51,913 3,810 A1.1 92.81 92.81 48,180 3. Assi 90 Srl (a) Genoa 1 1,770 945 B.1 37.50 37.50 XXX
B.2 22.50 22.50 4. AG Srl (a) Genoa 1 21 3 B.3 100.00 100.00 XXX 5. Assimilano Srl (a) Milan 1 63 -44 B.3 60.00 60.00 XXX 6. Savona 2000 Srl (a) Savona 1 70 40 B.3 40.00 40.00 XXX
B.4 40.00 40.00 7. Frankfurter Bankgesellschaft AG (f) Frankfurt 8 22,973 329 A1.1 47.50 47.50 10,912 8. Autostrada dei Fiori SpA (f) Savona 8 236,844 23,817 A1.1 16.62 16.62 48,449
A1.4 4.00 4.00 9. Recina Servizi Srl (g) Rome 8 1,183 873 B.3 25.00 25.00 XXXC. Other substantial participating interest (g) 1. Consorzio per il Giurista di Impresa Scrl Genoa 8 45 -28 A1.1 22.73 22.73 20 2. Didiass Srl Rome 8 -26 -47 B.3 9.00 9.00 XXX
B.4 6.00 6.00B.5 7.00 7.00
3. Assistars Srl Milan 8 50 17 B.3 34.17 34.17 XXX 4. BDA SpA Milan 8 427 - B.3 20.00 20.00 XXX 5. U.C. - Sport e Sicurezza Srl Milan 8 10 2 B.1 25.00 25.00 XXX
B.2 25.00 25.00 6. Atoma Srl Milan 8 12 - B.1 25.00 25.00 XXX
B.2 15.00 15.00
(5)
(a) Captions are taken from the Board of Directors' Report at 31/12/2003.(b) The company holds 10% of its own shares.(c) The percentages indicated does not include the subscription of 17,022 new shares carried out at the end of the year as the operationaccompanying the share capital increase had yet to be completed. The company owns 1.810% of own shares in portfolio.(d) Net equity and profit were calculated according to the companies’ financial statements as at 31/12/03 with value adjustments made whereappropriate on the basis of valuation at equity rather than cost of the insurance-related service companies Assi 90 Srl, AG Srl, Assimilano Srl,Savona 2000 Srl and Recina Servizi Srl. Consequently, an autonomous value for each of these companies is not stated in these consolidatedstatements.(e) The balance sheet value resulting from the application of the equity method was reduced by 24 thousand euros following the elision of theholding in Carige Asset Management SGR SpA performed on full consolidation.(f) Captions are taken from financial statement approved at 31/12/2003.(g) Captions are taken from financial statement approved at 31/12/2002.

254
Key(1) Head office (2) Type of participating interest (3) Net Assets
1 = controlling interest pursuant to art. 2359 c.c. par. 1 no. 1 (4) Gains/Losses(majority vote at Shareholders’ Annual General Meeting) (5) Type of participating interest2 = controlling interest pursuant to art. 2359 c.c. par 1 no. 2 (5.1) Holding(major influence at Shareholders’ Annual General Meeting) (5.2) Participating interest expressed as a percentage3 = controlling interest pursuant to art. 23 T.U. par. 2 no. 1 (6) Votes available at Shareholders’ Annual General4 = other forms of controlling interest Meeting5 = joint management pursuant to art. 26 par 1 of the “decreto” (7) Consolidated balance sheet value6 = joint management pursuant to art. 26 par 2 of the “decreto”7 = joint control8 = associated undertaking
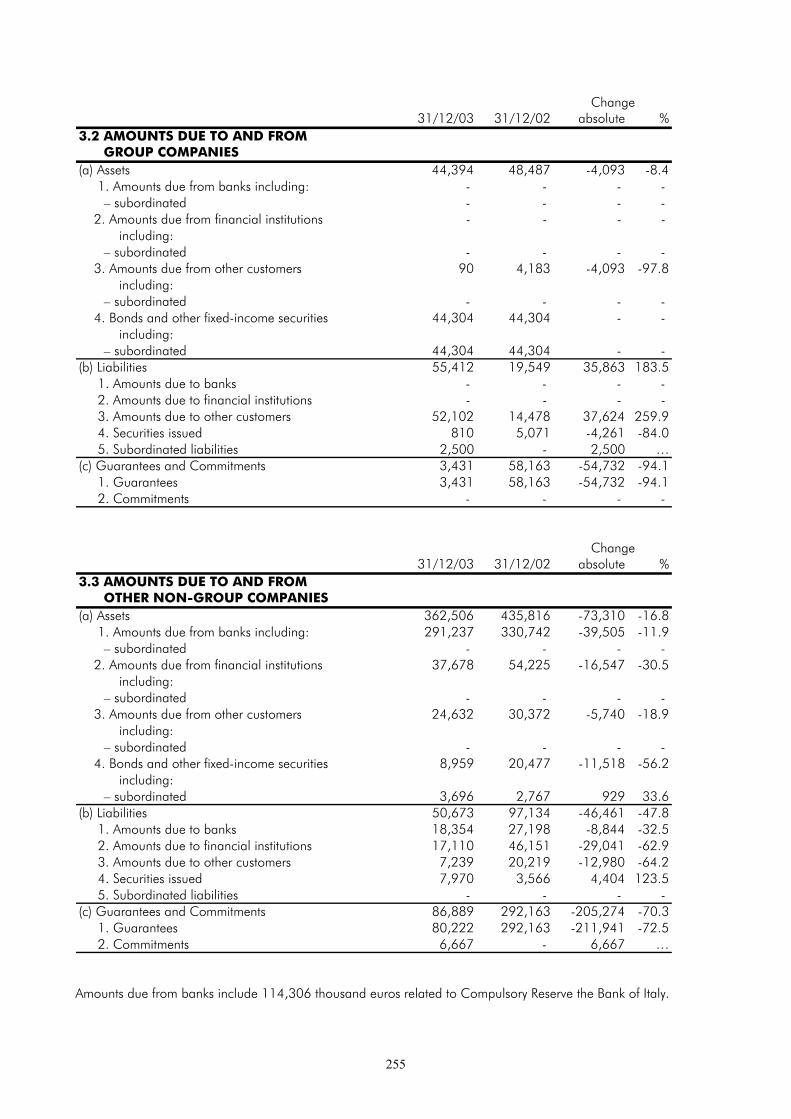
255
Change31/12/03 31/12/02 absolute %
3.2 AMOUNTS DUE TO AND FROM GROUP COMPANIES(a) Assets 44,394 48,487 -4,093 -8.4 1. Amounts due from banks including: - - - -
– subordinated - - - - 2. Amounts due from financial institutions - - - -
including:– subordinated - - - -
3. Amounts due from other customers 90 4,183 -4,093 -97.8 including:– subordinated - - - -
4. Bonds and other fixed-income securities 44,304 44,304 - - including:– subordinated 44,304 44,304 - -
(b) Liabilities 55,412 19,549 35,863 183.5 1. Amounts due to banks - - - - 2. Amounts due to financial institutions - - - - 3. Amounts due to other customers 52,102 14,478 37,624 259.9 4. Securities issued 810 5,071 -4,261 -84.0 5. Subordinated liabilities 2,500 - 2,500 …(c) Guarantees and Commitments 3,431 58,163 -54,732 -94.1 1. Guarantees 3,431 58,163 -54,732 -94.1 2. Commitments - - - -
Change31/12/03 31/12/02 absolute %
3.3 AMOUNTS DUE TO AND FROM OTHER NON-GROUP COMPANIES(a) Assets 362,506 435,816 -73,310 -16.8 1. Amounts due from banks including: 291,237 330,742 -39,505 -11.9
– subordinated - - - - 2. Amounts due from financial institutions 37,678 54,225 -16,547 -30.5
including:– subordinated - - - -
3. Amounts due from other customers 24,632 30,372 -5,740 -18.9 including:– subordinated - - - -
4. Bonds and other fixed-income securities 8,959 20,477 -11,518 -56.2 including:– subordinated 3,696 2,767 929 33.6
(b) Liabilities 50,673 97,134 -46,461 -47.8 1. Amounts due to banks 18,354 27,198 -8,844 -32.5 2. Amounts due to financial institutions 17,110 46,151 -29,041 -62.9 3. Amounts due to other customers 7,239 20,219 -12,980 -64.2 4. Securities issued 7,970 3,566 4,404 123.5 5. Subordinated liabilities - - - - (c) Guarantees and Commitments 86,889 292,163 -205,274 -70.3 1. Guarantees 80,222 292,163 -211,941 -72.5 2. Commitments 6,667 - 6,667 …
Amounts due from banks include 114,306 thousand euros related to Compulsory Reserve the Bank of Italy.

256
Change31/12/03 31/12/02 absolute %
3.4 CAPTION 70 "EQUITY INVESTMENTS" 77,524 103,800 -26,276 -25.3(a) in banks 18,162 18,833 -671 -3.6 1. listed 5,086 5,086 - - 2. unlisted 13,076 13,747 -671 -4.9(b) in financial institutions 6,875 25,728 -18,853 -73.3 1. listed - 151 -151 -100.0 2. unlisted 6,875 25,577 -18,702 -73.1(c) others 52,487 59,239 -6,752 -11.4 1. listed 723 723 - - 2. unlisted 51,764 58,516 -6,752 -11.5
Change31/12/03 31/12/02 absolute %
3.5 CAPTION 80 "INVESTMENTS IN GROUP COMPANIES" 172,600 152,385 20,215 13.3(a) in banks - - - - 1. listed - - - - 2. unlisted - - - - (b) in financial institutions - - - - 1. listed - - - - 2. unlisted - - - - (c) others 172,600 152,385 20,215 13.3 1. listed - - - - 2. unlisted 172,600 152,385 20,215 13.3
3.6 CHANGES IN PARTICIPATING INTERESTS
3.6.1 INVESTMENTS IN GROUP COMPANIES31/12/03 31/12/02
A. Opening balances 152,385 129,400B. Increases 23,963 24,377
B1. Purchases 20,001 20,010B2. Recoveries - - B3. Revaluations 3,633 4,037B4. Other changes 329 330
C. Decreases 3,748 1,392C1. Sales - - C2. Write-downs - - including: - permanent write-downs - - C3. Other changes 3,748 1,392
D. Closing balances 172,600 152,385E. Total revaluations - - F. Total write-downs - -

257
Details of all variations are given below:
PURCHASES
CARIGE ASSICURAZIONI SPASubscription of 17,022 new shares of a unitary nominal value of 982 euros in addition to a unitary premium of193 euros.(Variation in our share holding from 89.178% to 90.695%) 20,001
Total purchases 20,001
REVALUATIONS
INCREASES RELATED TO COMPANIES ACCOUNTED UNDER THE EQUITY METHOD
CARIGE ASSICURAZIONI SPA 1,127
CARIGE VITA NUOVA SPA 2,506
Total revaluations 3,633
OTHER INCREASES
CARIGE ASSICURAZIONI SPAAnnual instalment for the value reintegration of theholding following the acquisition of Levante Assicurazioniby Banca Carige
329
Total other increases 329
OTHER DECREASES
CARIGE VITA NUOVA SPAWriting off of dividend distributed to the Parent Company during the year. 1,830
CARIGE VITA NUOVA SPAWriting off of holding in Carige Asset Management S.G.R. SpA for fullyconsolidation
24
CARIGE ASSICURAZIONI SPAWriting off of dividend distributed to the Parent Company during the year 1,818
CARIGE ASSICURAZIONI SPAPositive difference arising from the rise in the Groupleader’s holding from 90.708% to 90.818%. Theincrease was generated by the subsidiary's purchase of afurther 129 own shares.
75
CARIGE ASSICURAZIONI SPAPositive variation arising with the subscription of thecapital increase
1
Total other decreases 3,748

258
3.6.2 OTHER PARTICIPATING INTERESTS31/12/03 31/12/02
A. Opening balances 103,799 97,356B. Increases 15,475 43,395
B1. Purchases 364 1,443B2. Recoveries - 98B3. Revaluations 5,032 37,285B4. Other changes 10,079 4,569
C. Decreases 41,750 36,952C1. Sales 36,479 13,763C2. Write-downs - 34 including: - permanent write-downs - 34C3. Other changes 5,271 23,154
D. Closing balances 77,524 103,799E. Total revaluations - 222F. Total write-downs 7,225 7,651
Details of all variations are given below:
PURCHASES
AREA 24 SPAPayment of residual 7/10 related to the subscription of 700 shares, nominal unit value 100 euros,made past year.(Our holding: 14%) 49
SOCIETA’ REGIONALE PER L’INTERNAZIONALIZZAZIONESOC.CONSORTILE PER AZIONIPayment of residual 7/10 related to the subscription of 150 shares, nominal unit value 1 euro,made past year(Our holding: 3%) 10
FILSE SPAPayment of 3/10 referred to the subscription of 1,904,358 new shares of a unitary nominal valueof 0.52 euros following the increase in share capital.(Our holding from 10.930% to 12.319%) 297
AGENZIA LUCCHESE PER L’ENERGIA E IL RECUPERODELLE RISORSE SRLCapital account payment.(Our holding: 6,59%) 8
Total purchases 364
REVALUATIONS
INCREASES RELATED TO COMPANIES ACCOUNTED UNDER THE EQUITY METHOD
FRANKFURTER BANKGESELLSCHAFT AG 160
AUTOSTRADA DEI FIORI SPA 4,872
Total revaluations 5,032

259
OTHER INCREASES
INTESA HOLDING ASSET MANAGEMENT SPAProfit made after the withdrawal from the Company 3,653
SOCIETA' DI COOPERAZIONE AGRICOLA SPAProfit made following the liquidation of company assets 21
EPTACONSORS SPAProfit on sale of 25,097,073 shares 2,615
FINCANTIERI SPAProfit on sale of 14,999,994 shares 3,586
SWIFTProfit made following liquidation of 5 quotas 5
BIPIELLE INVESTIMENTI SPAProfit on sale of 312,455 shares 199
Total other increases 10,079
SALES
INTESA HOLDING ASSET MANAGEMENT SPAThe Bank exercised the right of withdrawal following thechange of the company's business purpose.
4,917
EPTACONSORS SPASale of 25,097,073 shares for a total price of 19,040,400 euros.(Total release of holding) 19,040
SWIFTReimbursement of 5 quotas.(Our holding from 0.024% to 0.018%) 10
BIPIELLE INVESTIMENTI SPASale of 312,455 shares for a total price of 1,180,713 euros.(Total release of holding) 1,180
Total sales 36,479
EPTACONSORS SPADecrease arising from application of equity method with reference to the company's financial statements at31/12/2002 1,105
Writing off of the negative difference arising from application of the equity method following the release of theholding 205
Amount received from final sharing of assets of liquidation 21
Writing off of dividend distributed related to the Group participating interest 3,928
Amount received from partial sharing of shareholders' equity of the company 12
Total other decreases 5,271

260
SECTION 4
TANGIBLE AND INTANGIBLE FIXED ASSETS
Tangible and intangible fixed assets amount to 1,494,091 thousand euros and are analysed as follows:
31/12/03 31/12/02thousands of € % thousands of € %
– Tangible fixed assets (caption 120) 1,019,881 68.3 967,126 66.8– Intangible fixed assets (caption 110) 474,210 31.7 480,672 33.2Total 1,494,091 100.0 1,447,798 100.0
4.1 CHANGES IN TANGIBLE FIXED ASSETS31/12/03
Properties Furniture Leased Totaland fittings assets
A. Opening balances 327,130 25,725 614,271 967,126B. Increases 12,189 6,149 171,350 189,688
B1. Purchases 12,189 6,149 170,397 188,735B2. Recoveries - - - - B3. Revaluations - - - - B4. Other changes - - 953 953
C.Decreases 13,590 7,520 115,823 136,933C1. Sales 5,767 335 19,608 25,710C2. Depreciation and amortization 7,823 7,185 91,701 106,709 (a) amortization 7,823 7,185 91,701 106,709 (b) permanent write-downs - - - - C3. Other changes - - 4,514 4,514
D. Closing balances 325,729 24,354 669,798 1,019,881E. Total revaluations 4,530 - - 4,530F. Total depreciation and amortization 131,560 107,478 235,760 474,798
(a) amortization 131,560 107,478 235,760 474,798 (b) permanent write-downs - - - -
Item A includes 19,572 thousand euros resulting from positive difference arising from consolidation allocated totangible fixed assets.Item C2 includes depreciation related to the same allocated difference for 839 thousand euros.

261
31/12/02Properties Furniture Leased Total
and fittings assetsA. Opening balances 324,192 27,070 451,984 803,246B. Increases 30,977 6,171 310,301 347,449
B1. Purchases 27,240 6,171 309,265 342,676B2. Recoveries - - - - B3. Revaluations - - - - B4. Other changes 3,737 - 1,036 4,773
C.Decreases 28,039 7,516 148,014 183,569C1. Sales 20,550 129 65,444 86,123C2. Depreciation and amortization 7,489 7,307 81,443 96,239 (a) amortization 7,489 7,307 81,443 96,239 (b) permanent write-downs - - - - C3. Other changes - 80 1,127 1,207
D. Closing balances 327,130 25,725 614,271 967,126E. Total revaluations 4,533 - 7 4,540F. Total depreciation and amortization 116,390 110,811 184,131 411,332
(a) amortization 116,390 110,811 184,131 411,332 (b) permanent write-downs - - - -
4.2 CHANGES IN INTANGIBLE FIXED ASSETS31/12/03
Software Start-up Goodwill Other intangible Totalcharges fixed assets
A. Opening balances 19,300 1,058 450,799 9,515 480,672B. Increases 10,681 3,624 264 2,534 17,103
B1. Purchases 10,681 3,624 264 2,534 17,103B2. Recoveries - - - - - B3. Revaluations - - - - - B4. Other changes - - - - -
C.Decreases 9,170 1,414 8,671 4,310 23,565C1. Sales - - - - - C2. Depreciation and amortization 8,911 1,414 8,671 4,277 23,273 (a) amortization 8,911 1,414 8,671 4,277 23,273 (b) permanent write-downs - - - - - C3. Other changes 259 - - 33 292
D. Closing balances 20,811 3,268 442,392 7,739 474,210E. Total revaluations - - - - - F. Total depreciation and amortization 25,395 3,808 21,271 17,199 67,673
(a) amortization 25,395 3,808 21,271 17,199 67,673 (b) permanent write-downs - - - - -
31/12/02Software Start-up Goodwill Other intangible Total
charges fixed assetsA. Opening balances 17,238 3,149 330,913 6,901 358,201B. Increases 9,645 - 126,641 6,723 143,009
B1. Purchases 9,644 - 126,641 6,723 143,008B2. Recoveries - - - - - B3. Revaluations - - - - - B4. Other changes 1 - - - 1
C.Decreases 7,583 2,091 6,755 4,109 20,538C1. Sales - - - - - C2. Depreciation and amortization 7,583 2,091 6,133 4,075 19,882 (a) amortization 7,583 2,091 6,133 4,075 19,882 (b) permanent write-downs - - - - - C3. Other changes - - 622 34 656
D. Closing balances 19,300 1,058 450,799 9,515 480,672E. Total revaluations - - - - - F. Total depreciation and amortization 20,362 9,401 10,525 14,546 54,834
(a) amortization 20,362 9,401 10,525 14,546 54,834 (b) permanent write-downs - - - - -

262
SECTION 5
OTHER ASSETS
Other assets amount to 973,669 thousand euros and are analysed below:
31/12/03 31/12/02thousands of € % thousands of € %
– Other assets (caption 150) 864,654 88.8 809,174 90.0– Accrued income and prepaid expenses (caption 160) 109,015 11.2 90,308 10.0Total 973,669 100.0 899,482 100.0
Change31/12/03 31/12/02 absolute %
5.1 CAPTION 150 "OTHER ASSETS" 864,654 809,174 55,480 6.9– miscellaneous accounts receivable from branches 266,275 196,133 70,142 35.8– post-collection notes and other values 147,580 140,345 7,235 5.2– amounts in transit between branches 2,755 5,028 -2,273 -45.2– current account cheques drawn on other banks 54,478 46,212 8,266 17.9– premiums related to option transactions 38,721 27,327 11,394 41.7– amounts to be collected from customers 27,292 24,236 3,056 12.6– current account cheques drawn on the Bank 8,449 6,305 2,144 34.0– accounts relating to tax collection services 180 3,261 -3,081 -94.5– Bank guarantee deposits 346 537 -191 -35.6– off balance sheet revaluations 149 230 -81 -35.2– fiscal items: 169,719 176,175 -6,456 -3.7
tax advances 58,721 89,503 -30,782 -34.4with-holding taxes 85,797 55,143 30,654 55.6accounts receivable from the tax authorities 19,312 23,766 -4,454 -18.7tax advance on provisions to reserve fortermination indemnity (Law 140/97) 5,433 7,568 -2,135 -28.2taxes paid in advance 456 195 261 133.8
– others 148,710 183,385 -34,675 -18.9
The amount of 91,882 thousand euros paid as an advance for the purchase of a holding in Carinord 2 is recordedat item ‘others’.

263
Change31/12/03 31/12/02 absolute %
5.2 CAPTION 160 “ACCRUED INCOME AND PREPAID EXPENSES” 109,015 90,308 18,707 20.7Accrued income: 100,842 80,497 20,345 25.3– interest income on loans and advances to credit institutions 4,725 1,970 2,755 139.8– interest income on loans to customers 18,447 21,671 -3,224 -14.9– interest income on securities 33,751 19,506 14,245 73.0– differentials stemming from derivatives contracts 41,395 36,969 4,426 12.0– others 2,524 381 2,143 562.5Prepaid expenses: 8,173 9,811 -1,638 -16.7– premiums related to currency forward transactions 307 143 164 114.7– differentials stemming from derivatives contracts 10 - 10 - – discounts on issuing of securities 3,596 4,425 -829 -18.7– administrative charges 1,585 1,891 -306 -16.2– other transactions 2,675 3,352 -677 -20.2
Change31/12/03 31/12/02 absolute %
5.4 DISTRIBUTION OF SUBORDINATED ASSETS 201,011 222,430 -21,419 -9.6a) Loans and advances to credit institutions - - - - b) Loans and advances to customers 6,796 3,548 3,248 91.5c) Bonds and other fixed-income securities 194,215 218,882 -24,667 -11.3
Item c) ‘Bond and other fixed-income securities’ includes 65,690 thousand euros relating to the subscription ofclass Junior notes issued in relation to the securitisations carried out by Banca Carige in 2000 and 2001. Thesesecurities were inserted by the Bank into its investment securities portfolio. The item also includes 10,179 thousandeuros relating to the subscription of class Junior notes issued in relation to the securitisation carried out by Cassa diRisparmio di Savona in 2002.

264
SECTION 6
PAYABLES
Payables amount to 12,380,363 thousand euros and are analysed as follows:
31/12/03 31/12/02thousands of € % thousands of € %
– Amounts owed to credit institutions (caption 10) 1,006,049 8.1 1,466,421 12.2– Amounts owed to customers (caption 20) 6,861,171 55.4 6,900,768 57.4– Debts evidenced by certificates (caption 30) 4,512,775 36.5 3,657,445 30.4– Funds managed on behalf of third parties (caption 40) 368 - 310 0.0Total 12,380,363 100.0 12,024,944 100.0
Change31/12/03 31/12/02 absolute %
6.1 CAPTION 10 “AMOUNTS OWED TO CREDIT INSTITUTIONS” 1,006,049 1,466,421 -460,372 -31.4(a) repurchase agreements - - - -
Caption 10 ”Amounts owed to credit institutions” detail by technical form is the following:
Change31/12/03 31/12/02 absolute %
Deposits 611,966 1,148,414 -536,448 -46.7Current accounts 19,928 43,663 -23,735 -54.4Financing 130,798 130,110 688 0.5Long-term loans 243,245 143,975 99,270 68.9Repurchase agreements - - - …Other 112 259 -147 -56.8Total 1,006,049 1,466,421 -460,372 -31.4

265
Change31/12/03 31/12/02 absolute %
6.2 CAPTION 20 “AMOUNTS OWED TO CUSTOMERS” 6,861,171 6,900,768 -39,597 -0.6(a) repurchase agreements 254,063 644,930 -390,867 -60.6(b) loans of securities - - - -
Detail by technical form is as follows:
Change31/12/03 31/12/02 absolute %
Savings deposits 534,600 531,115 3,485 0.7Current accounts 6,066,532 5,720,039 346,493 6.1Funding from international organisations - 771 -771 -100.0Repurchase agreements 254,063 644,930 -390,867 -60.6Other 5,976 3,913 2,063 52.7Total 6,861,171 6,900,768 -39,597 -0.6
Caption 30 “Debts evidenced by certificates” is the following:
Change31/12/03 31/12/02 absolute %
Certificates of deposits 351,316 429,497 -78,181 -18.2Bonds certificates 4,073,476 3,146,656 926,820 29.5Own cheques in circulation 87,983 81,292 6,691 8.2Total 4,512,775 3,657,445 855,330 23.4
Caption 40 “Funds managed on behalf of third parties” (368 thousand euros) includes interest-bearing fundssupplied by the State and other public bodies for the financing of specific projects foreseen by relevant legislation;the lending transactions carried out on behalf of public bodies, exclusively at fixed remuneration, are stated atsection 12.

266
SECTION 7
RESERVES
Reserves, summarized in this section, amount to 557,005 thousand euros and are represented in the balance sheetas follows:
31/12/03 31/12/02thousands of € % thousands of € %
– Reserves for loan losses (caption 90) 19,997 3.6 14,644 2.7– Reserves for risks and charges (caption 80) 440,194 79.0 420,792 78.1– Reserve for termination indemnities (caption 70) 96,814 17.4 103,515 19.2Total 557,005 100.0 538,951 100.0
Change30/6/03 31/12/02 absolute %
7.1 CAPTION 90 "RESERVE FOR LOAN LOSSES" 19,997 14,644 5,353 36.6
This caption includes 1,237 thousand euros relating to third parties.
7.2 CHANGES IN THE "RESERVES FOR LOAN LOSSES" (CAPTION 90)31/12/03 31/12/02
A.Opening balances 14,644 6,708B. Increases 19,744 17,712
B1. Provisions 19,744 17,334B2. Other changes - 378
C Decreases 14,391 9,776C1. Utilizations 14,391 6,992C2. Other changes - 2,784
D Closing balances 19,997 14,644
Change31/12/03 31/12/02 absolute %
7.3 COMPOSITION OF CAPTION 80 (D) "OTHER RESERVES" 38,037 38,157 -120 -0.3Reserves for personnel charges 21,797 21,625 172 0.8Reserves for future charges 1,361 52 1,309 2,517.3Reserves for guarantees and commitments 4,124 4,551 -427 -9.4Reserves for in-house insurance scheme 1,570 1,563 7 0.0Reserves for finance lease transactions 3,368 1,240 2,128 171.6Reserves for legal proceedings 5,563 4,909 654 13.3Reserves for renegotiation loan building ex L. 113/99 - 2,835 -2,835 -100.0Other 254 1,382 -1,128 -81.6

267
CHANGES IN THE “RESERVES FOR TAXATION”(CAPTION 80 B)
31/12/03 31/12/02A. Opening balances 88,574 94,234B. Increases 84,159 80,402C. Decreases 65,886 86,062D. Closing balances 106,847 88,574
Total tax reserves exclude taxes payable on dividends distributed by the Group’s subsidiaries and those companiesconsolidated on the basis of the equity method.
Deffered tax: positive and negative effects
As foreseen by international accounting principles, Assets in the form of advanced payment of taxation andLiabilities for taxes payable have been calculated on the basis of tax rates in force at 31 december 2003 and whichapply for the period (5 yars) in which timing differences will cancel out.
7.4 CHANGES IN ASSETS IN THE FORM OF ADVANCED PAYMENT OF TAXATION a) recorded in the income statement with counter entry
1. Opening balances 14,237 2. Increases 13,237 2.1 Deferred taxation originating in the year 12,884 2.2 Other increases 353 3. Decreases 12,802 3.1 Deferred taxation written off in the year 12,797 3.2 Other decreases 5 4. Closing balances 14,672
Assets representing advance payment of taxation totalled thousand euros at 31/12/02; in the year these increasedby 435 thousand euros.
The main forms of taxes advanced during the year were:
- costs related to hospitality and entertaining related to 2003 are deductible for a third of the total over five yearsin five equal instalments;
- provisions for personnel charges will be tax deductible in the next business year;- provisions to reserves for loan losses exceeding the deductible instalment. In accordance with Bank of Italy instructions of 3/8/99, assets in the form of tax advanced relative to timingdifferences arising in 2003, which will be reversed in following years, were recorded at caption 240, “Income taxfor the year”; during 2003 this caption was increased by the reversal for assets in the form of advanced taxationrecorded in previous years.
7.4 CHANGES IN ASSETS IN THE FORM OF ADVANCED PAYMENT OF TAXATION a) recorded in the net value with counter entry
1. Opening balances 9,528 2. Increases - 2.1 Deferred taxation originating in the year - 2.2 Other increases - 3. Decreases 4,888 3.1 Deferred taxation written off in the year 4,888 3.2 Other decreases - 4. Closing balances 4,640

268
Deferred tax credits relating to net equity originate from the utilisation (49,822 thousand euros) on the part ofBanca Carige of the share premium reserve to cover four fifths of negative differences arising from securitisationcarried out in 2000.As a result, assets of 19,960,000 in the form of taxes advanced was recorded in the consolidated statements for2000 as counterpart in the share premium reserve.During the year one fifth of this negative differential (6,228 thousand euros) was recorded at the income statementpursuant to article 6, Law 130/99 as a result of provisions totalling 7,567 thousand euros to the share premiumreserve and the related writing off of 4,888 thousand euros in tax advanced (inclusive of differences stemming froma reduced corporation tax rate from 35% to 34%).
7.5 CHANGES IN LIABILITIES FOR TAXES PAYABLE a) recorded in the income statement with counter entry
1. Opening balances 4,387 2. Increases 6,283 2.1 Deferred taxation originating in the year 6,283 2.2 Other increases - 3. Decreases 1,663 3.1 Deferred taxation written off in the year 1,663 3.2 Other decreases - 4. Closing balances 9,007
With regards to timing differences liable to taxation, provisions for differed tax liability amounting to around 6,283thousand euros related to gains stemming from the release of strategic and non-strategic holdings and premiseswere recorded as in the past. The payment of this amount is subject to the relief offered by article 54 of theConsolidated Tax Law in the form of instalments.
Deferred tax liabilities written off in 2003 amounted to 1,663 thousand euros.
No provisions were made with regard to deferred tax liabilities on reserves benefiting from tax relief totalling60,513 thousand euros as distribution is not foreseen and there is little likelihood of the conditions requiringpayment arising.
CAPTION 80 (A) “RESERVES FOR PENSIONSAND SIMILAR COMMITMENTS”
31/12/03 31/12/02A. Opening balances 294,061 304,260B. Net change 1,249 -10,199C. Closing balances 295,310 294,061
The closing balance represents the total of in-house funds which are destined for purposes defined by the Group’sbanks; fund use is without legal personality.
CHANGES IN CAPTION 70"RESERVE FOR TERMINATION INDEMNITIES"
31/12/03 31/12/02A. Opening balances 103,515 89,611B. Increases 13,352 21,425C. Decreases 20,053 7,521D. Closing balances 96,814 103,515

269
SECTION 8
SUBSCRIBED CAPITAL, EQUITY RESERVES, RESERVES FOR GENERAL BANKING RISKSAND SUBORDINATED LIABILITIES
This section presents liabilities captions 100, 110, 130, 140, 150, 160, 170, 180, and 200 and assets captions90, 100 and 140.
31/12/03 31/12/02thousands of € % thousands of € %
– Capital stock (caption 150) 1,113,327 67.8 1,020,550 71.6– Additional paid-in capital (caption 160) 255,023 15.5 136,095 9.6– Reserves (caption 170) 127,752 7.8 135,981 9.5– Revaluation reserves (caption 180) 8,050 0.5 8,050 0.6– Reserves for general banking risks (caption 100) 100 - 5,165 0.4– Negative difference arising from application of the equity method (caption 130) 34,953 2.1 35,134 2.5– Minority interests (caption 140) 17,362 1.1 17,539 1.2– Net income (caption 200) 84,742 5.2 66,171 4.6Total 1,641,309 100.0 1,424,685 100.0– Subordinated loans (caption 110) 517,055 400,000– Positive difference arising from consolidation (caption 90) 87,538 93,236– Positive difference arising from application af the equity method (caption 100) 16,168 14,859– Own shares (caption 140) - 25,613
Change31/12/03 31/12/02 absolute %
CAPTION 150"CAPITAL STOCK" 1,113,327 1,020,550 92,777 9.1- ordinary shares 959,898 879,906 79,992 9.1 - saving shares 153,429 140,644 12,785 9.1
Share capital amounts to €1,113,326,839 in the form of 1,113,326,839 shares of a unitary nominal value of €1.
Changes recorded during the year are the result of a capital increase of €92,777,225 via the issue of 92,777,225shares with a nominal value of €1 each (of which 79,991,459 ordinary shares and 12,785,775 convertible shares)as deliberated by the Extraordinary Shareholders’ Meeting of 10th September 2003.
Change31/12/03 31/12/02 absolute %
CAPTION 160"ADDIONAL PAID-IN CAPITAL" 255,023 136,095 118,928 87.4
Changes recorded during the year result from:- an increase of €7,567 thousand in the form of provisions made to the reserve within the confines of thesecuritisation of non performing loans carried out in 2002 pursuant to Law 130/99, article 6, paragraph c. Inparticular, this change corresponds to the difference between the provision quota for the period, the reduced valueof the loans sold (€12,455 thousand) and related tax advances (€4,888 thousand);- an increase of €111,333 thousand relating to the increase of share capital to €1,111,326,839 via the issue of92,777,225 shares (nominal value:€1) at €2.20;- an increase of €28,000 relating to the sale of option rights not exercised during the share capital increase.
(*) Item refers to Banca Carige SpA.

270
Change31/12/03 31/12/02 absolute %
CAPTION 170"RESERVES" 127,752 135,981 -8,229 -6.1a) legal reserve 67,351 56,869 10,482 18.4b) reserve for purchase of treasury stock - 25,613 -25,613 …d) other reserves 60,401 53,499 6,902 12.9
Change31/12/03 31/12/02 absolute %
CAPTION 180"REVALUATION RESERVES" 8,050 8,050 - - Revaluation reserves pertaining to the Group 8,050 8,050 - -
Change31/12/03 31/12/02 absolute %
CAPTION 100"RESERVES FOR GENERAL BANKING RISKS" 100 5,165 5,065- 98.1-
The General banking risk fund (€ 5,165 thousand) was fully utilised by Banca Carige during the year.The increase of € 100 thousand corresponds to the Group’s quota in provisions made by Banca del Monte diLucca SpA. The quota attributable to minority shareholders is recorded at liabilities caption 140 of the consolidatedbalance sheet (‘minority interests’).
Change31/12/03 31/12/02 absolute %
CAPTION 130"NEGATIVE DIFFERENCE ARISING FROMAPPLICATION OF THE EQUITY METHOD" 34,953 35,134 -181 -0.5
Negative differences arising from the application of the equity method decreased by € 205 thousand following thesale of the Bank’s entire holding in Eptaconsors SpA. An increase of € 24 thousand resulted from the first-timeapplication of the equity method to holdings in Savona 2000 Srl and Recina Servizi Srl.
Change31/12/03 31/12/02 absolute %
CAPTION 140"MINORITY INTEREST" 17,362 17,539 -177 -1.0
Change31/12/03 31/12/02 absolute %
CAPTION 110"SUBORDINATED LOANS" 517,055 400,000 117,055 29.3
.

271
During the year Banca Carige and Banca del Monte di Lucca issued a subordinated loan each. The item is nowmade up by the following bonds:
Code Amount Currency Interest rate Maturity
XSO135565637 400,000 euro Euribor 3 months + 28/11/2011annual spread of 0.80
IT0003563035 102,055 euro 1,5% + 16% atmaturity
5/12/2013
IT0003499297 15,000 euro Euribor 6 months + 30/6/2013annual spread of 0.80for the first 5 yearsEuribor 6 months +annual spread of 1.40for the other 5 years
With regards to the first loan issue, reimbursement will be effected at maturity in one payment. The Bank can,however, anticipate repayment after the fifth year with Bank of Italy authorisation. In the eventuality of liquidation,the bonds will be repaid only after all other claims have been met.
The repayment ranking of the bond issue ‘Banca Carige 1.50% 2003-2013’ performed during the year in case ofthe Bank’s going into liquidation or receivership is as follows: the bonds will be repaid only after all other creditorssubordinated or otherwise have been repaid with the exception of those creditors with an equal or moreaccentuated degree of subordination. Further characteristics of the issue are as follows:- from 1st January 2006 until 31st October 2013 the bonds can be converted into shares of the Bank on a one-to-
one basis;- for those bonds for which no conversion right has been exercised as at 31st October, the principal shall be
repaid in one payment on 5th December 2013 with a 16% premium on the nominal value.
Change31/12/03 31/12/02 absolute %
CAPTION 200"NET INCOME" 84,742 66,171 18,571 28.1
The caption reflects gains generated by the fully consolidated subsidiares of 23,494 thousand euros.Profit destined to third parties for the year amounted to 2,030 thousand euros
Change31/12/03 31/12/02 absolute %
CAPTION 90 AND 100 "POSITIVE DIFFERENCEARISING FROM CONSOLIDATION AND FROMAPPLICATION OF THE EQUITY METHOD" 103,706 108,095 -4,389 -4.1Positive difference arising from consolidation 87,538 93,236 -5,698 -3.1Positive difference arising from the application ofthe equity method 16,168 14,859 1,309 8.8Increases resulting from fully consolidated subsidiaries amounted to 15 thousand euros.

272
Increases resulting from fully consolidated subsidiaries are as follows:
31/12/03 31/12/02Opening balance 93,236 94,197Decreases 5,698 5,558– Amortization for the period 5,698 5,557– Offsetting of negative consolidation differences arising from the
Bank's increased holding in Centro Fiduciario. - 1Increases - 4,597– positive variation arising from the Group's increased holding in Banca del Monte di Lucca from 51% to 54%. - 2,391– increase in positive consolidation difference referring to
Cassa di Risparmio di Savona following the recording in the Group leader'sfinancial statements of additional costs in proportion to holding. - 2,206
Closing balance 87,538 93,236
Positive difference arising from the application of the equity method are as follows:
31/12/03 31/12/02Opening balance 14,859 15,359Decreases 1,558 1,452– Amortization for the period 1,558 1,451– Reduced positive difference to Levante Norditalia Assicurazioni
subsequent to increase in holding from 87.014% to 89.178%. - 1Increases 2,867 952- Positive difference arising from the purchase of own shares on the part of
Carige Assicurazioni SpA 75- Positive difference arising from the first-time application of the equity method on
holdings in Assi 90 Srl, AG Srl and Assimilano Srl 2,791 952- Increase in Positive difference relating to Carige Assicurazioni SpA arising on
the subscription of the share capital Increase transaction still in progress as at'31/12/2003' 1
Closing balance 16,168 14,859
Change31/12/03 31/12/02 absolute %
CAPTION 140"OWN SHARES" - 25,613 -25,613 …
Banca Carige owns 227.92 own shares, equal to 44/50 of 259 non converted shares that are recorded for 426euro. The 12,950,000 shares retained by Cassa di Risparmio di Savona SpA were sold in the year realizing acapital gain of 11,374 thousand euros.The table below provides the details of the Bank’s total capital and prudential management requirements asrequested by the Bank of Italy in its letter of 14/12/98 relating to increased transparency of bank balance sheets.

273
Consolidated assets and capital adequacy requirements at 31/12/03.
CATEGORIES/VALUES 31/12/03 31/12/02A. Total capitalA.1 Tier 1 969,457 724,739A.2 Tier 2 526,081 371,048A.3 Deductions 182,644 180,385A.4 Total capital 1,312,894 915,402B. Prudential requirementsB.1 Credit risks 773,203 716,952B.2 Trading risks 87,662 57,512
including:– trading securities risks 87,662 57,512– exchange rate risks - -
B.3 Subordinated loans of third level - - B.4 Other prudential requirements 39,477 38,663B.5 Total prudential requirements 900,342 813,127C. Capital adequacy ratiosC.1 Risk-Weighted Assets (*) 11,254,275 10,164,088C.2 Tier 1% of RWA 8.61% 7.13%C.3 Total capital % of RWA 11.67% 9.01%
(*) Total prudential requiriments multiplied by the reciprocal minimum obligatory credit risk coefficent.

274
SECTION 9
OTHER LIABILITIES
Other liabilities amount to 822,522 thousand euros and are analysed as follows:
31/12/03 31/12/02thousands of € % thousands of € %
– Other liabilities (caption 50) 655,700 79.7 851,226 85.1– Accrued expenses and deferred income (caption 60) 166,822 20.3 149,127 14.9Total 822,522 100.0 1,000,353 100.0
Change31/12/03 31/12/02 absolute %
9.1 CAPTION 50 "OTHER LIABILITIES" 655,700 851,226 -195,526 -23.0– amounts due to customers 64,443 94,172 -29,729 -76.4– adjustment differential on discounted notes 178,227 253,844 -75,617 -29.8– miscellaneous accounts payable to branches 224,597 211,066 13,531 6.4– amounts in transit with branches 7,168 6,948 220 -62.6– amounts relating to securities transactions - 9,587 -9,587 -61.6– amounts due to tax authorities on behalf of third parties 14,903 20,586 -5,683 -61.6– beneficiaries of outstanding invoices 33,728 34,209 -481 -1.4– staff charges 15,374 13,962 1,412 10.1– amounts related to writedown on off-balance sheet transactions 5,301 7,362 -2,061 -61.6– premiums related to option transactions 5,607 2,675 2,932 -60.6– guarantee deposits from third parties 1,044 1,410 -366 -59.6– amounts relating to tax collection service counter entry to write down on dividends distributed by Cassa di Risparmio di Savona SpA in 1997 and 1998 499 699 -200 -59.6– accrued costs to be recognised 2,113 698 1,415 -59.6– other 102,696 194,008 -91,312 -47.1
The amount € 5,151 thousand paid as an advance to Cassa di Risparmio di Firenze SpA for the purchase of aholding in Carinord 2 is recorded at item ‘others’.
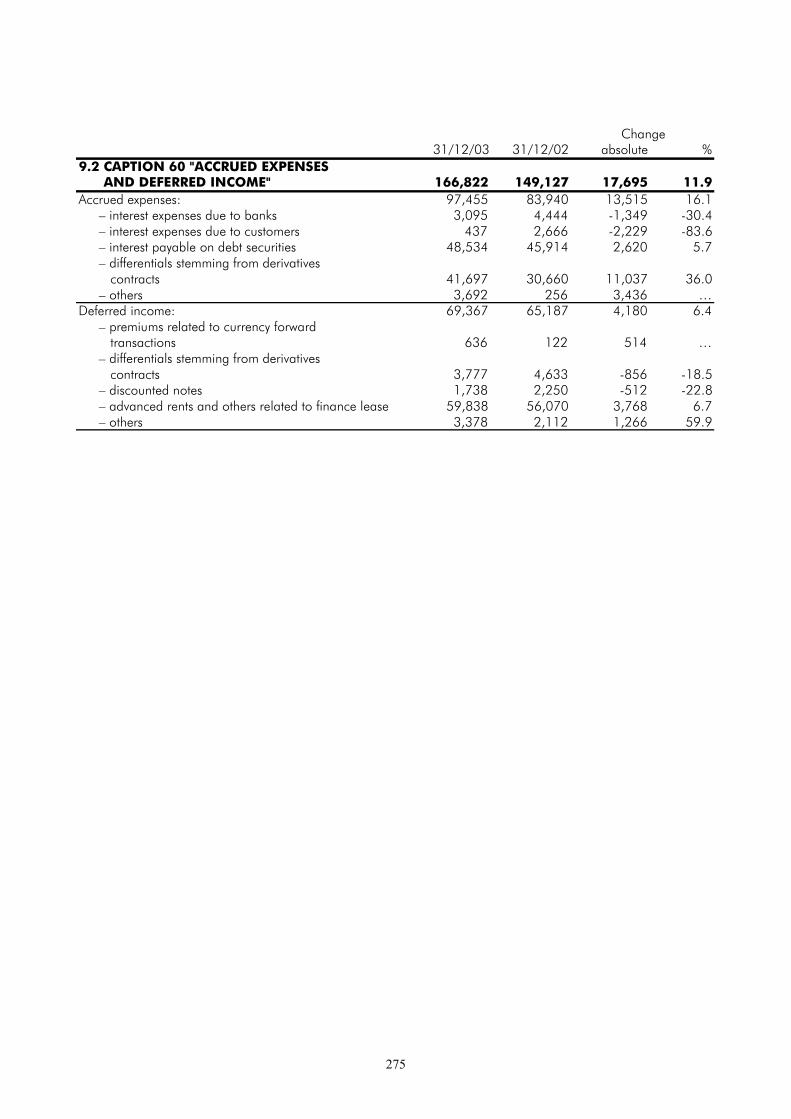
275
Change31/12/03 31/12/02 absolute %
9.2 CAPTION 60 "ACCRUED EXPENSES AND DEFERRED INCOME" 166,822 149,127 17,695 11.9Accrued expenses: 97,455 83,940 13,515 16.1
– interest expenses due to banks 3,095 4,444 -1,349 -30.4– interest expenses due to customers 437 2,666 -2,229 -83.6– interest payable on debt securities 48,534 45,914 2,620 5.7– differentials stemming from derivatives contracts 41,697 30,660 11,037 36.0– others 3,692 256 3,436 …
Deferred income: 69,367 65,187 4,180 6.4– premiums related to currency forward transactions 636 122 514 …– differentials stemming from derivatives contracts 3,777 4,633 -856 -18.5– discounted notes 1,738 2,250 -512 -22.8– advanced rents and others related to finance lease 59,838 56,070 3,768 6.7– others 3,378 2,112 1,266 59.9

276
SECTION 10
GUARANTEES AND COMMITMENTS
Guarantees and commitments amount to 2,326,102 thousand euros and are analysed below:
31/12/03 31/12/02thousands of € % thousands of € %
– Guarantees given (caption 10) 1,336,530 57.5 1,391,727 62.9– Commitments (caption 20) 989,572 42.5 820,908 37.1Total 2,326,102 100.0 2,212,635 100.0
Change31/12/03 31/12/02 absolute %
10.1 CAPTION 10 "GUARANTEES GIVEN" 1,336,530 1,391,727 -55,197 -4.0(a) commercial guarantees 1,233,281 1,281,370 -48,089 -3.8(b) financial guarantees 34,220 26,013 8,207 31.5(c) assets held in guarantee 69,029 84,344 -15,315 -Total 1,336,530 1,391,727 -55,197 -4.0Caption 10 is analysed below:– joint securities - 1,056 -1,056 …– sureties 1,204,061 1,252,001 -47,940 -3.8– documentary and non documentary credits 60,583 50,078 10,505 21.0– acceptances on behalf of third parties 2,858 4,249 -1,391 -32.7– bond sureties on behalf of third parties 69,027 84,343 -15,316 -18– other sureties on behalf of third parties 1 - 1 -
Credit commitments related to non-performing loans amount to 22,700 thousand euros.Reserve for guarantees and commitments, which amount to 4,124 thousand euros, cover all relevant risks.

277
Change31/12/03 31/12/02 absolute %
10.2 CAPTION 20 "COMMITMENTS" 989,572 820,908 168,664 20.5(a) Commitments to extend credit (certain to be called on) 462,116 394,593 67,523 17.1(b) Commitments to extend credit (not certain to be called on) 527,456 426,315 101,141 23.7Commitments are analysed as follows:– stipulated mortgages to be granted 393,440 303,636 89,804 29.6– purchases of securities to be settled 112,223 123,363 -11,140 -9.0– deposits to be made with banks 616 2,551 -1,935 -75.9– unused irrevocable lines of credit 143,389 77,199 66,190 85.7– commitments with Deposit Protection Fund Liabilities (FITD) 18,026 14,914 3,112 20.9– amounts to be granted to customers 14,010 823 13,187 …– derivatives contracts on credits 194,087 258,949 -64,862 -25.0– option on securities - 5,165 -5,165 …– stipulated finance lease transactions to be granted 15,800 29,427 -13,627 -46.3– investment shares and quotas to be received 97,981 4,881 93,100 …Total 989,572 820,908 168,664 20.5
The commitment of 91,882 thousand granted within the confines of the transaction for the purchase of Carinord 2is recorded at (a) 'certain to be called on'.
Change31/12/03 31/12/02 absolute %
10.3 ASSETS HELD TO GUARANTEE THE BANK’S LIABILITIES 217,970 504,384 -286,414 -56.8Securities held to guarantee:– advance from Bank of Italy 1,008 1,000 - …– bank drafts issued by Carige 26,478 20,440 6,038 29.5– repurchase agreements 190,484 482,944 -292,460 -60.6Total 217,970 504,384 -286,414 -56.8
Change31/12/03 31/12/02 absolute %
10.4 UNUSED LINES OF CREDIT BY THE BANK 141,633 265,002 -123,369 -46.6(a) central banks 114,306 163,109 -48,803 -29.9(b) other banks 27,327 101,893 -74,566 -73.2

278
10.5 FORWARD TRANSACTIONS31/12/03 31/12/02
Hedging Trading Other Hedging Trading Other1. Purchase/sale of: - 325,956 - 10,914 327,252 - 1.1 Securities - 140,145 - - 144,975 - – purchases - 112,223 - - 123,363 - – sales - 27,922 - - 21,612 - 1.2 Currency - 185,811 - 10,914 182,277 -
– currency against currency - - - - 11 - – purchases against euro - 45,560 - 10,051 42,992 - – sales against euro - 140,251 - 863 139,274 -
2. Deposits and loans - - 70,856 - - 38,735– to be made - - 16,210 - - 5,281– to be received - - 54,646 - - 33,454
3. Derivatives contracts 3,868,957 2,763,316 181,694 2,712,553 2,794,802 80,9233.1 With exchange of principal 274,227 125,636 102,171 263,559 65,562 -
(a) securities 116,997 15,980 102,171 106,329 6,616 - – purchases 300 - 10,329 988 - – sales 116,997 15,680 102,171 96,000 5,628 - (b) currency 157,230 109,656 - 157,230 58,946 - – currency against currency - - - - - - – purchases against euro 157,230 54,828 - 157,230 29,473 - – sales against euro - 54,828 - - 29,473 - (c) other instruments - - - - - - – purchases - - - - - - – sales - - - - - -
3.2 Without exchange of principal 3,594,730 2,637,680 79,523 2,448,994 2,729,240 80,923(a) currency - - - - - - – currency against currency - - - – purchases against euro - - - - - - – sales against euro - - - - - - (b) other instruments 3,594,730 2,637,680 79,523 2,448,994 2,729,240 80,923– purchases 1,391,324 1,345,481 - 1,140,215 1,418,855 - – sales 2,203,406 1,292,199 79,523 1,308,779 1,310,385 80,923
Total 3,868,957 3,089,272 252,550 2,723,467 3,122,054 119,658
With regards to derivatives contracts, the column ‘other transactions’ includes the notional value of options statedseparately from the related underlying structured bond issue of the Bank. In particular, in capital-exchangecontracts, the values recorded are those of the options implicitly sold to the subscribers of convertible bonds (intoordinary shares) issued during 2003 (see section 8).The notional value of options incorporated in assets or liabilities which allow either the Bank or the counterparty totransform, after a certain period of time, the interest rate stipulated in the contract from fixed to floating, or viceversa, was recorded at section 11.6 ‘Maturities of assets and liabilities’.
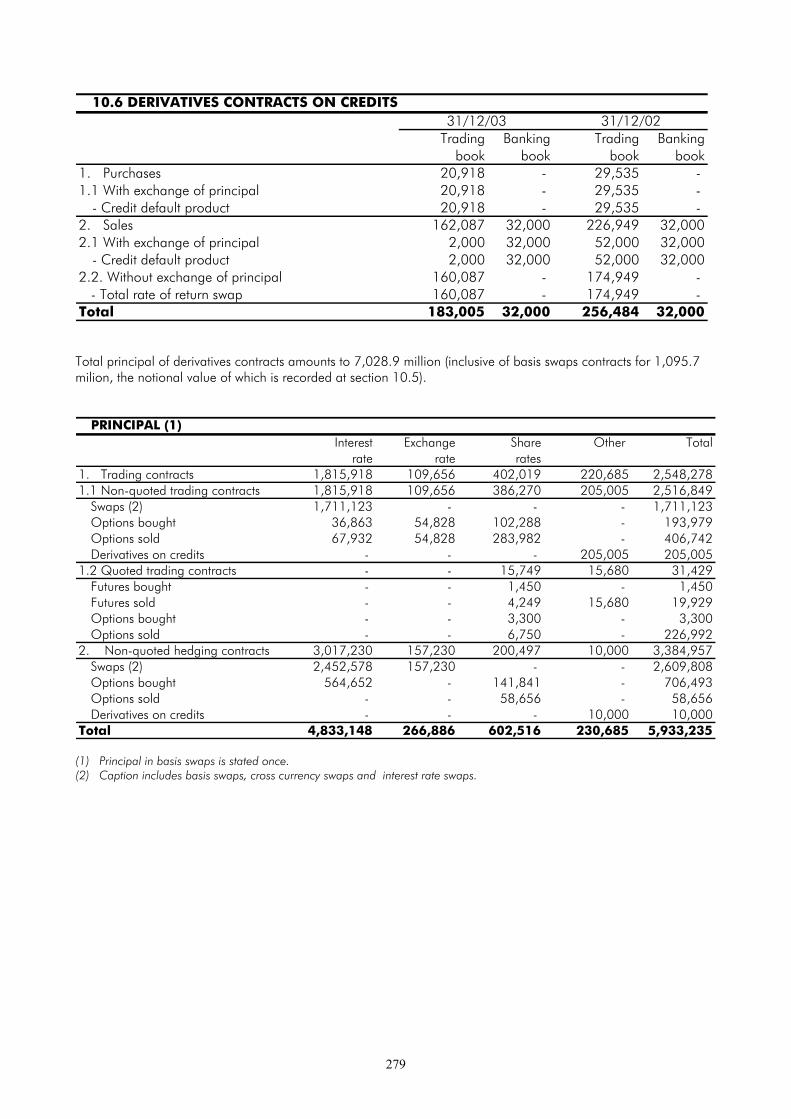
279
10.6 DERIVATIVES CONTRACTS ON CREDITS31/12/03 31/12/02
Trading Banking Trading Bankingbook book book book
1. Purchases 20,918 - 29,535 - 1.1 With exchange of principal 20,918 - 29,535 -
- Credit default product 20,918 - 29,535 - 2. Sales 162,087 32,000 226,949 32,0002.1 With exchange of principal 2,000 32,000 52,000 32,000
- Credit default product 2,000 32,000 52,000 32,0002.2. Without exchange of principal 160,087 - 174,949 - - Total rate of return swap 160,087 - 174,949 - Total 183,005 32,000 256,484 32,000
Total principal of derivatives contracts amounts to 7,028.9 million (inclusive of basis swaps contracts for 1,095.7milion, the notional value of which is recorded at section 10.5).
PRINCIPAL (1)Interest Exchange Share Other Total
rate rate rates1. Trading contracts 1,815,918 109,656 402,019 220,685 2,548,2781.1 Non-quoted trading contracts 1,815,918 109,656 386,270 205,005 2,516,849
Swaps (2) 1,711,123 - - - 1,711,123Options bought 36,863 54,828 102,288 - 193,979Options sold 67,932 54,828 283,982 - 406,742Derivatives on credits - - - 205,005 205,005
1.2 Quoted trading contracts - - 15,749 15,680 31,429Futures bought - - 1,450 - 1,450Futures sold - - 4,249 15,680 19,929Options bought - - 3,300 - 3,300Options sold - - 6,750 - 226,992
2. Non-quoted hedging contracts 3,017,230 157,230 200,497 10,000 3,384,957Swaps (2) 2,452,578 157,230 - - 2,609,808Options bought 564,652 - 141,841 - 706,493Options sold - - 58,656 - 58,656Derivatives on credits - - - 10,000 10,000
Total 4,833,148 266,886 602,516 230,685 5,933,235
(1) Principal in basis swaps is stated once.(2) Caption includes basis swaps, cross currency swaps and interest rate swaps.

280
PRINCIPAL IN HEDGING CONTRACTS (1)Swaps Options Options Derivatives Total
bought sold on credits1. Assets 1,381,254 400,493 58,656 10,000 1,850,403
Loans to customers 446,997 342,152 - - 789,149Trading securities 642,257 58,341 58,656 10,000 769,254Equity investments 292,000 - - - 292,000
2. Liabilities 1,156,680 306,000 - - 1,462,680Bonds 1,156,680 306,000 - - 1,462,680
3. Other (2) 71,874 - - - 71,874Total 2,609,808 706,493 58,656 10,000 3,384,957
(1) Principal in basis swaps is stated once.(2) Non-specific hedging contracts on interest-rate risk related to customer borrowing and lending.
PRINCIPAL IN CONTRACTS CLASSIFIED BY REMAINING CONTRACT LIFE(1)Up to 12 From 1 to 5 More than Total
months years 5 years1. Trading contracts 438,569 1,134,437 975,272 2,548,2781.1 Non-quoted trading contracts 407,440 1,134,137 975,272 2,516,849
Swaps 284,335 965,263 461,525 1,711,123Options bought 21,791 84,437 87,751 193,979Options sold 101,314 84,437 220,991 406,742Derivatives on credits - - 205,005 205,005
1.2 Quoted trading contracts 31,129 300 - 31,429Futures bought 1,450 - - 1,450Futures sold 19,929 - - 19,929Options bought 3,000 300 - 3,300Options sold 6,750 - - -
2. Non-quoted hedging contracts 553,769 1,529,620 1,301,568 3,384,957Swaps 546,269 1,181,794 881,745 2,609,808Options bought 7,500 279,170 419,823 706,493Options sold - 58,656 - 58,656Derivatives on credits - 10,000 - 10,000
Total 992,338 2,664,057 2,276,840 5,933,235
(1) Principal in basis swaps is stated once.
Derivatives business is carried out exclusively with primary banking and financial institutions and for this reasonprovisions for counterparty risk have not been made.At 31/12/2003, there were no unsettled contracts.Non-quoted contracts accounted for 99% of all derivatives contracts.

281
NON-QUOTED DERIVATIVES CONTRACTS (1)Banks Financial Others Total
bodies1. Principal 5,339,264 200,480 362,062 5,901,8062. Trading contracts (2)
Positive market value 15,358 416 4,130 19,904Negative market value 12,065 829 11,844 24,738Potential credit equivalent 31,145 3,086 27,292 61,523
3. Hedging contractsPositive market value 44,676 912 - 45,588Negative market value 91,301 14,014 - 105,315Potential credit equivalent 41,001 3,151 - 44,152
(1) Principal relative to basis swaps is stated once.(2) The trading contracts segment includes negative market values of 7.6 million euros relating to options incorporated intostructured bond issues of the Group offset by positive market values of the same amount in the hedging derivatives segment.
Derivatives-related capital losses of 124.6 million euros and capital gains of 65.8 million euros were not recordedin the income statement. In particular, capital losses and gains stemming from hedging contracts related to thetrading securities portfolio of 51.5 million euros and 0.9 million euros respectively, were not recorded (see section2.3); capital losses and gains stemming from hedging contracts related to bonds issued of 18.1 million euros and1.4 million euros respectively were also not recorded.
DEFERRED GAINS AND LOSSESLosses Gains
1. Trading contracts 24,121 20,2861.1 Non-quoted trading contracts 24,110 19,922
Swaps 7,888 9,849Options 15,500 8,427Derivatives on credits 722 1,646
1.2 Quoted trading contracts 11 364Futures - 268Options 11 96
2 Non-quoted hedging contracts 100,484 45,544Swaps 92,482 28,900Options 7,868 16,644Derivatives on credits 134 -
Total 124,605 65,830

282
SECTION 11
CONCENTRATION AND DISTRIBUTION OF ASSETS AND LIABILITIES
Breakdowns of loans related to lists 11.2, 11.3, 11.5, 11.6 and 11.7 of this section include leased assets, whichamount to 614,271 thousand euros and are exclusively connected to transactions with customers in euro.On this basis, loans to customers amount to 10,091,546 thousand euros and not to 9,421,748 thousand euros (ascaption 40 of assets).
11.1 SIGNIFICANT EXPOSURES31/12/03 31/12/02
(a) amount 150,000 540,537(b) number 1 4
Significant exposures are those identified on the basis of “major lines of credit” as defined by the Bank of Italy.
11.2 DISTRIBUTION OF LOANS AND ADVANCESTO CUSTOMERS, BY CATEGORY
31/12/03 31/12/02(a) Governments 502,116 509,334(b) Other public entities 596,570 553,722(c) Non-financial businesses 5,658,442 5,339,428(d) Financial institutions 374,126 651,694(e) Personal businesses 572,154 554,844(f) Other operators 2,388,138 1,751,826Total 10,091,546 9,360,848

283
11.3 DISTRIBUTION OF LOANS TO RESIDENT NON-FINANCIALBUSINESSES AND PERSONAL BUSINESSES
31/12/03 31/12/02(a) 1st branch of economic activity
Other market services 1,298,059Wholesale and retail trade, salvage and repairs 1,099,272
(b) 2nd branch of economic activityWholesale and retail trade, salvage and repairs 1,158,286 Building and construction 947,883
(c) 3rd branch of economic activityBuilding and construction 839,548 Other market services 883,841
(d) 4th branch of economic activityAir and sea transport 329,702 390,021
(e) 5th branch of economic activityHotel and catering services 311,667 303,808
(f) Other branches 2,061,517 2,133,554Total 5,998,779 5,758,379
11.4 DISTRIBUTION OF GUARANTEES GIVEN, BY CATEGORY OF COUNTERPART
31/12/03 31/12/02(a) Governments 1 1(b) Other public entities 13,592 6,794(c) Banks 136,034 161,757(d) Non-financial businesses 1,038,938 989,586(e) Financial institutions 94,065 163,689(f) Personal businesses 16,168 17,186(g) Other operators 37,732 52,714Total 1,336,530 1,391,727
11.5 GEOGRAPHIC DISTRIBUTION OF ASSETS AND LIABILITIES
31/12/03Caption/countries Italy Other EU Other Total
countries countries1. Assets 12,735,526 713,356 125,071 13,573,953
1.1 Due from banks 555,752 332,786 29,893 918,4311.2 Loans to customers 9,828,349 216,529 46,668 10,091,5461.3 Securities 2,351,425 164,041 48,510 2,563,976
2. Liabilities 11,826,461 823,010 247,947 12,897,4182.1 Due to banks 438,165 525,123 42,761 1,006,0492.2 Deposits from customers 6,758,182 87,871 15,118 6,861,1712.3 Securities issued 4,512,691 16 68 4,512,7752.4 Others 117,423 210,000 190,000 517,423
3. Guarantees and Commitments 2,243,549 26,596 55,957 2,326,102

284
31/12/02Caption/countries Italy Other EU Other Total
countries countries1. Assets 12,115,358 845,130 108,296 13,068,784
1.1 Due from banks 988,212 302,317 29,700 1,320,2291.2 Loans to customers 9,106,372 230,378 24,098 9,360,8481.3 Securities 2,020,774 312,435 54,498 2,387,707
2. Liabilities 11,213,281 952,751 258,912 12,424,9442.1 Due to banks 797,752 613,958 54,711 1,466,4212.2 Deposits from customers 6,807,957 78,793 14,018 6,900,7682.3 Securities issued 3,607,262 50,000 183 3,657,4452.4 Others 310 210,000 190,000 400,310
3. Guarantees and Commitments 1,910,140 284,570 17,925 2,212,635
Geographic distribution is analysed by reference to the counterparts’ country of residence.
31/12/03Repayable Up to Between 3 Between 1 and 5 Beyond 5 Unspecified
Captions/Residual life on demand 3 months and 12 years years duration Totalmonths fixed rate indexed rate fixed rate indexed rate
1. Assets 3,180,058 3,108,427 2,983,281 2,030,282 2,336,253 1,499,694 3,557,956 515,605 19,211,5561.1 Treasury bonds eligible
for refinancing 6,326 61,998 93,601 322,419 204,084 32,783 163,753 - 884,9641.2 Due from banks 351,524 390,380 36,899 762 - 983 10,000 127,883 918,4311.3 Loans to customers 2,150,004 798,029 1,204,665 463,415 1,670,721 675,869 2,741,121 387,722 10,091,5461.4 Bonds and other fixed
income securities 15,121 60,787 171,354 92,511 432,345 88,586 640,376 - 1,501,0801.5 Off-balance sheet
transactions 657,083 1,797,233 1,476,762 1,151,175 29,103 701,473 2,706 - 5,815,5352. Liabilities 7,189,731 3,239,093 1,671,693 1,580,899 1,979,380 1,321,108 1,730,649 32 18,712,5852.1 Due to banks 45,367 489,846 122,106 40,887 61,957 104,488 141,398 - 1,006,0492.2 Deposits from customers 6,601,160 247,911 11,695 373 - - - 32 6,861,1712.3 Securities issued 175,462 349,123 337,333 473,074 1,906,792 99,669 1,171,322 - 4,512,775
– bonds 71,831 185,156 192,086 460,156 1,893,256 99,669 1,171,322 - 4,073,476– certificates of deposits 15,648 163,967 145,247 12,918 13,536 - - - 351,316– other securities 87,983 - - - - - - - 87,983
2.4 Subordinated liabilities - - - - - 102,055 415,000 - 517,0552.5 Off-balance sheet -
transactions 367,742 2,152,213 1,200,559 1,066,565 10,631 1,014,896 2,929 - 5,815,535
Caption “repayable on demand” includes assets and liabilities with residual life of not more than 24 hours.Unspecified duration includes compulsory reserve, overdue loans and bad loans.Sub-captions 1.5 and 2.5 include the notional value of options incorporated in structured mortgaged loans andbond issues which allow either the Bank or the counterparty, after a certain period of time, to transform the interestrate stipulated in the contract from fixed to floating, or vice versa.
31/12/02Repayable Up to Between 3 Between 1 and 5 Beyond 5 Unspecified
Captions/Residual life on demand 3 months and 12 years years duration Totalmonths fixed rate indexed rate fixed rate indexed rate
1. Assets 3,328,323 2,927,695 3,012,775 1,381,631 2,182,168 1,434,046 2,595,720 450,247 17,312,6051.1 Treasury bonds eligible
for refinancing 6 37,868 148,538 51,980 80,158 1,192 107,900 - 427,6421.2 Due from banks 550,079 468,854 81,146 1,110 31,747 112 10,000 177,181 1,320,2291.3 Loans to customers 2,579,316 612,635 1,140,952 525,545 1,673,627 570,436 1,985,271 273,066 9,360,8481.4 Bonds and other fixed
income securities 11,039 43,783 612,486 108,287 396,618 104,548 482,826 - 1,759,5871.5 Off-balance sheet
transactions 187,883 1,764,555 1,029,653 694,709 18 757,758 9,723 - 4,444,2992. Liabilities 6,422,967 3,678,342 2,123,883 929,490 1,497,381 701,166 1,515,704 - 16,868,9332.1 Due to banks 70,201 997,950 189,185 19,715 41,034 132,303 16,033 - 1,466,4212.2 Deposits from customers 6,243,010 643,276 14,243 3 236 - - - 6,900,7682.3 Securities issued 109,690 228,318 378,209 391,743 1,456,097 8,089 1,085,299 - 3,657,445
– bonds 5,087 43,530 190,225 374,690 1,439,736 8,089 1,085,299 - 3,146,656– certificates of deposits 23,311 184,788 187,984 17,053 16,361 - - - 429,497– other securities 81,292 - - - - - - - 81,292
2.4 Subordinated liabilities - - - - - - 400,000 - 400,0002.5 Off-balance sheet
transactions 66 1,808,798 1,542,246 518,029 14 560,774 14,372 - 4,444,299

285
Change31/12/03 31/12/02 absolute %
11.7 ASSETS AND LIABILITIES DENOMINATED IN FOREIGN CURRENCY
a) Assets 446,198 564,425 -118,227 -20.91. Due from banks 75,445 91,500 31,242 34.12. Loans to customers 328,875 427,159 -111,584 -26.13. Securities 35,328 44,812 -21,747 -48.54. Participating interests 382 382 - - 5. Other 6,168 572 159 27.8
(b) Liabilities 457,270 654,626 -197,356 -30.11. Due to banks 245,314 414,720 -92,209 -22.22. Deposits from customers 11,960 78,340 33,886 43.33. Securities issued 199,996 161,566 18,779 11.64. Other - - - -
11. 8 SECURITISATION
Banca Carige carried out two securitisation operations: the first at the end of 2000 relating to non performingcredits; the second at the end of 2001 relating to performing credits (mortgages). The Group’s banking subsidiaryCassa di Risparmio di Savona securitised its bad loans portfolio at the end of 2002. Details are given below.
BANCA CARIGE’S SECURITISATION
a) Securitisation of bad loans
At the end of 2000 the Bank securitised without recourse a part of its bad loans portfolio. These loans were backedeither fully or in part by voluntary or legally-enforced guarantees (gross value of pro soluto credits: ITL 566.4 bn;book value: ITL 440.6 bn; sale price: ITL 320 bn).
As special purpose vehicle for the transaction, Argo Finance a subsidiary of the Carige Group, issued the followingthree types of bonds:
- Class A ‘Senior’ bonds amounting to 40 million €.- Class B ‘Mezzanine’ bonds amounting to 70 million €.- Class C ‘Junior’ bonds amounting to 56.5 million euros; fully subscribed by Banca Carige, this issue is fully
subordinate in principal and coupon payments to classes A and B.
The placement of the securities was carried out by Credit Suisse First Boston.
At 31st December 2003, of the three classes issued, Banca Carige held in its securities portfolio exclusively and fullythe class C ‘Junior’ bonds for a value of 56.5 million €. These securities were placed in the Bank’s investmentportfolio. No writedowns have been effected on the book value of these securities in the light of the positiveperformance of receipts. The securitised bad loans represent the underlying for all three classes of securities issued.
Risks for the Bank resulting from this transaction are represented by: the class C bonds both for principal andinterest; guarantees granted to holders of class A securities relating to interest payments; guarantees granted toholders of class B securities for both principal and interest; the credit line of 15 million € backing the class A and Bbond issues granted by Banca Carige to Argo Finance; a limited recourse mortgage bond loan of 69 million €; aninterest rate cap. The positive performance in repayment flows has meant that no writedowns were carried out.The credit line, which at 31/12/03 was unused, was recorded at balance sheet caption 20 ‘Guarantees’, whilst thelimited recourse mortgage, also unused, was recorded, as required by the Bank of Italy, at caption 10 ‘Guaranteesgiven’.
Banca Carige is the servicer for the transaction. Revenues on the credit portfolio at 30/12/03 amounted to 89.6million euros, of which 27.7 million euros collected in 2003. These amounts are in line with the repaymentschedule defined at the start of the transaction. Banca Carige bills Argo Finance One on a monthly and half-yearlybasis for the service activity it performs. The half-yearly accounts are inspected by the Bank’s auditors, KPMG SpA.

286
The service activity carried out by Banca Carige generated 1,110,0000 in commission revenues, 1,495,000 inreimbursed legal costs and 2,291,400 in interest received on the class C Junior bonds. On the basis of interest-ratetrends and conditions contained in the contract, no additional revenues were payable on the limited recoursemortgage.
As a result of the positive performance recorded by the repayment schedule, Fitch IBCA on 6/3/02 upgraded theclass A securities transaction from “AA” to “AAA”; on 13th December 2002 the same institute upgraded thetransaction relating to the class B securities from “AA-“ to “AA”.
The positive trend allowed for the full repayment of the class A securities (40 million) in addition to the repayment ofpart (20.9 million) of the capital relating to the class B securities. In January 2004 other 12.9 million of class Bsecurities were repaid.
The limited recourse mortgage bond loan, already reduced to 69 million in december 2003, was reduced to 51million at the beginning of 2004.
b) Securitisation of performing loans
At the end of 2001, Banca Carige securitised its performing mortgages in order to improve liquidity in the light ofconsiderable expansion in long-term lending to the family (mortgages, in particular).
A total of 13,858 mortgages was sold with a residual debt at 31/12/01, the date of ceding, on the part ofcustomers amounting to 511.5 million euros.
The portfolio subject to sale was identified on the basis of objective criteria foreseen by the relevant legislation (Law130/99).
In particular, the bundle of credits sold were mortgages granted to private customers for the purchase or renovationof property.
The bundle of credits ceded were as follows:
1) Floating rate, first recorded mortgages/landed property loans distributed to private individuals prior to31/7/2001;
2) mortgages with: a fixed repayment schedule with instalment due 31/12/2001; repayments in order withschedule via current account direct debit;
3) mortgages/landed property loans not classified either as bad loans or watchlists between 31/12/93 (exclusive)and 31/12/01 (inclusive).
The bundle of credits described above was sold on 31/12/01 to the special purpose vehicle Argo Mortgage, inwhich Banca Carige has a 5% indirect holding (535.5 million) via its subsidiary Columbus Carige Immobiliare (theregularity of the operation was evidenced by the signing of servicing, and guarantee and indemnity contracts in thetime prescribed).
The prices of the credits ceded were calculated as the sum of the following two components:
- a initial price of 511.5 million euros equivalent to the nominal value of the credits ceded;- a deferred price of 24.0 million euros calculated on the basis of profit extraction which, in particular, took
into account the excess spread after the transaction costs relating to each payment date, intrinsic risk levelsof the credits, possibility of anticipated re-payment of loan and subsequent loss of interest income. Thisspread was actualised using market rates at 31/12/01 on the basis of the duration of the transaction.
The payment of the first component of the price is linked to a securities issue, whilst the deferred price will be paidpro quota at each payment date in reference to the procedures foreseen in the contract and the payment prioritiesdefined in the transaction. Up to 2003 deferred-price account payments totalled 3.1 million.
The residual credit of 20.9 million related to the deferred price was recorded at item 40 Loans to Customers.

287
The securities issued are as follows:
Class Amount inmillions ofeuro
Rating byMoody’s/Fitch(***)
Expectedduration(*)
ContractualMaturity
Effectiveexpectedduration (*)
Euribor 3monthsmargin inbasis points(**)
Creditenhancement
A 478 Aaa/AAA March 2009 October 2036 4.3 years 26 8.0%B 22 Aa2/AA March 2009 October 2036 6.8 years 450 3.7%C 11.5 Baa2/BBB March 2009 October 2036 6.8 years 145 1.5%D 9.2 Not rated October 2036
(*) assuming Argo Mortgage exercises its call option in January 2009;(**) step up of applicable spread if call option is not exercised;(***) the rating was assigned by Moody’s and Fitch/IBCA on the basis of due diligence. The rating will bereviewed annually on the basis of collection flows and deviance from business plans.
The class A, B and C securities are quoted on the Luxembourg bond market and have been fully subscribedexclusively by European institutional investors, Italian included.
Class B and C securities were subscribed by Banca Carige. The class D issue was subscribed fully by Banca Carige.
Payment priority will be as follows:- the payment of senior expenses and swap interest rate, followed by:- the payment of coupon on class A securities at maturity dates prior to maturity at October 2003, followed
by:- the payment of coupon on class B securities on the basis of cumulative default ratio, followed by:- the payment of coupon on class C securitieswith residual available amounts at each payment date to be paid into a capital accumulation account.
From the October 2003 date of payment onwards, the order of priority is as follows:- the repayment of amortisation paid on class A securities, followed, on the basis of the cumulative default
ratio, by:- the payment of coupon on class B securities and the repayment of amortisation paid on class B securities,
followed by:- the payment of coupon on class C securities and the repayment of amortisation relating to the same
securities.
The repayment of principal and interest of class D securities is subordinate to the first three classes.
The role of servicer of the transaction was carried out on Argo Mortgage’s behalf by Banca Carige.
All proceeds relating to the securitised credits will be in the form of mortgage instalment payments made bymortgage borrowers at the counters of Banca Carige, the latter, as foreseen in the contractual documentationregulating the securitisation transaction, carrying out the role of both account bank and cash manager. Both rolesare compatible with the corporate service contract signed between Banca Carige and Argo Mortgage in that BancaCarige will perform the accounting duties on behalf of the special purpose vehicle.
During 2003, total revenues collected amounted to 86.7 million euros, of which 47.7 million euros in capitalinstalments, 19.2 million euros in interest instalments, 19.8 million in advanced repayments, interest and penaltycharges.
The performance in revenue collection is proof that the transaction is proceeding according to schedule.
The transaction will be monitored by the Bank of New York in its payment report and by Banca Carige in itsquarterly and investor reports, and certified by the independent auditors.

288
Banca Carige SpA provided the special purpose vehicle with the cash collateral foreseen by the transaction (quotaof the tranche of class D securities totalling 7.8 million) which during the year, as a result of the regular repaymentflows scheduled by the contract, reached the figure (10.7 million) projected in the contract.
The London offices of the Bank of New York will represent the bond holders as well as being agent and securitytrustee. The same bank’s Luxembourg offices will act as agent for Luxembourg.The Milan offices of BNP Paribas Security Services will be payment agent for the transaction.The arrangers of the transaction were CSFB and CDC IXIS.
The counterparty of the IRS contracts utilised by Argo Mortgage for cover against interest rate fluctuations latent inthe securitised credits is CDC IXIS.
CASSA DI RISPARMIO DI SAVONA’S SECURITISATION
At the end of 2002, Cassa di Risparmio di Savona securitised the entirety of its bad loans portfolio. The advantagesof this transaction can be summarised as follows:
- previously illiquid asset positions with low returns can now benefit from higher-yielding market interestrates;
- securitisation achieves qualitative improvements in the bank’s risk portfolio;- higher credit rating of the bank has cost benefits for the Banca Carige Group in its funding requirements
on international markets.
As stated above, the entirety of the bank’s bad loans were sold en bloc to the special purpose vehicle PriamarFinance (holdings on the part of Stitching Faro of Amsterdam and Banca Carige of, respectively, 95% and 5%). Thebad loans securitised were classified as such at 31/12/01 and were still effective at 11/12/02, backed either fullyor in part by voluntary or legally-enforced guarantees.
The portfolio subject to sale was identified on the basis of objective criteria foreseen by relevant legislation (Law130/99 and article 58, Law decree 385/93).
The credits sold (contract date: 23/12/02 with effect from 11.59 pm of 31/12/02) consisted of 1,085 debtpositions (equivalent to 2,238 sub-items).
The gross value of credits sold excluding previous reductions was calculated at 68.8 million. The corresponding netvalue was 33.7 million after previous writedowns. The sale price, fixed at 28 million, determined a loss onsecuritisation of 5.7 million.
All the loans securitised were denominated in euro and were granted to customers resident in Italy.
In terms of credit risk concentrations, with reference to the total gross exposure, sub-items up to 100,000 eurosaccount for 93% of total debt positions and 37% of the total loan amounts granted; six exposures exceed 2% of thetotal at 10,707,000 euros.
The total gross exposure is distributed by sector in the following way: non-financial businesses 48%; financialbusinesses 1%; family businesses 30%; others 21%.
All proceeds relating to the securitised credits will be collected at the counters of Banca Carige, the latter, asforeseen in the contractual documentation regulating the securitisation transaction, carrying out the role of bothaccount bank and cash manager. Both roles are compatible with the administrative service contract signed betweenBanca Carige and Priamar Finance in that Banca Carige will perform the accounting duties on behalf of the specialpurpose vehicle.
The role of servicer of the transaction was assigned to Banca Carige by Priamar Finance.
Priamar Finance is both assignee of the credits and issuer of the securities.
The London offices of the Bank of New York will represent the bond holders in addition to performing the duties ofcalculation agent, security trustee, and payment agent. The same bank’s Luxembourg offices will act as agent forLuxembourg.
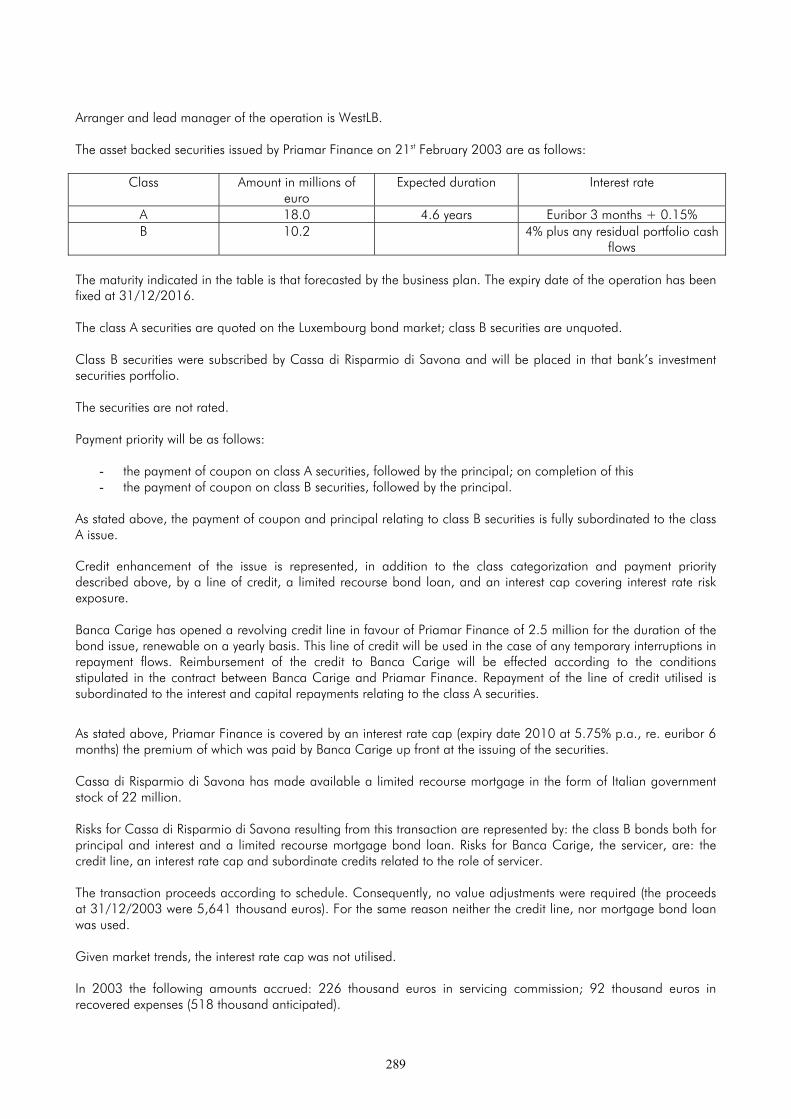
289
Arranger and lead manager of the operation is WestLB.
The asset backed securities issued by Priamar Finance on 21st February 2003 are as follows:
Class Amount in millions ofeuro
Expected duration Interest rate
A 18.0 4.6 years Euribor 3 months + 0.15%B 10.2 4% plus any residual portfolio cash
flows
The maturity indicated in the table is that forecasted by the business plan. The expiry date of the operation has beenfixed at 31/12/2016.
The class A securities are quoted on the Luxembourg bond market; class B securities are unquoted.
Class B securities were subscribed by Cassa di Risparmio di Savona and will be placed in that bank’s investmentsecurities portfolio.
The securities are not rated.
Payment priority will be as follows:
- the payment of coupon on class A securities, followed by the principal; on completion of this- the payment of coupon on class B securities, followed by the principal.
As stated above, the payment of coupon and principal relating to class B securities is fully subordinated to the classA issue.
Credit enhancement of the issue is represented, in addition to the class categorization and payment prioritydescribed above, by a line of credit, a limited recourse bond loan, and an interest cap covering interest rate riskexposure.
Banca Carige has opened a revolving credit line in favour of Priamar Finance of 2.5 million for the duration of thebond issue, renewable on a yearly basis. This line of credit will be used in the case of any temporary interruptions inrepayment flows. Reimbursement of the credit to Banca Carige will be effected according to the conditionsstipulated in the contract between Banca Carige and Priamar Finance. Repayment of the line of credit utilised issubordinated to the interest and capital repayments relating to the class A securities.
As stated above, Priamar Finance is covered by an interest rate cap (expiry date 2010 at 5.75% p.a., re. euribor 6months) the premium of which was paid by Banca Carige up front at the issuing of the securities.
Cassa di Risparmio di Savona has made available a limited recourse mortgage in the form of Italian governmentstock of 22 million.
Risks for Cassa di Risparmio di Savona resulting from this transaction are represented by: the class B bonds both forprincipal and interest and a limited recourse mortgage bond loan. Risks for Banca Carige, the servicer, are: thecredit line, an interest rate cap and subordinate credits related to the role of servicer.
The transaction proceeds according to schedule. Consequently, no value adjustments were required (the proceedsat 31/12/2003 were 5,641 thousand euros). For the same reason neither the credit line, nor mortgage bond loanwas used.
Given market trends, the interest rate cap was not utilised.
In 2003 the following amounts accrued: 226 thousand euros in servicing commission; 92 thousand euros inrecovered expenses (518 thousand anticipated).

290
c) Asset backed securities in portfolio at 31/12/03.
Within the trading securities portfolio at 31/12/03 are securities deriving from securitisation transactions carried outby other parties totalling 75,525 thousand euros. These securities can be classified as follows:
C1) ASSET BACKED SECURITIES IN PORTFOLIO AT 31/12/03 DERIVING FROM STRUCTUREDSECURITISED CREDITS CARRIED OUT BY OTHER PARTIESUnderlying Senior securities Mezzanine
SecuritiesJunior securities
(a) Mortgages 24,087 984 -(b) Corporate loans 3,476 3,967 -(c) Consumer credits 10,833 - -(d) Securities - - -(e) Various other credits 8,592 - -(f) Various other non-performing credits 17,895 5,691 -Total 64,883 10,642 -
Writedowns relating to the above carried out according to the accounting principles illustrated in section 1 of theexplanatory notes amounted to 231 thousand euros.Investments made in the form of these securities during 2003 are accounted for at income statement captions 10‘Interest income’ and 60 ‘Gains (losses) from financial transactions’ and are respectively 2,226 thousand euros(interest income) and 783 thousand euros (gains/losses on securities and foreign exchange and svalutation). Detailsare given in the table below:
EFFECTS ON INCOME STATEMENT 2003 STEMMING FROM ASSET BACKED SECURITIES INPORTFOLIO AT 31/12/03 DERIVING FROM STRUCTURED SECURITISED CREDITS CARRIED OUT BYOTHER PARTIESUnderlying Senior securities Mezzanine securities Junior securities
Interest Gains/Losses
Write-downs
Interest Gains/Losses
Write-downs
Interest Gains/Losses
Write-downs
a) Mortgages 496 8 - 35 - 17 - - -b) Corporate loans 211 -5 38 139 - 10 - - -c) consumer credits 311 4 125 - - - - - -d) securities - -560 - - - - - - 250e) various other credits 226 1 - - - - - - -f) various other non-performing credits
638 - 6 170 - 35 - - -
Total 1,882 -552 169 344 - 62 - - 250

291
C2) ASSET BACKED SECURITIES IN PORTFOLIO AT 31/12/03 DERIVING FROM STRUCTUREDSECURITISED CREDITS CARRIED OUT BY BANCA CARIGE GROUP COMPANIESUnderlying Senior securities Mezzanine
SecuritiesJunior securities
(a) Mortgages - 200 9,190(b) Corporate loans - - -(c) Consumer credits - - -(d) Securities - - -(e) Various other credits - - -(f) Various other non-performing credits - 1,393 66,679Total - 1,593 75,869
(1) Securities recorded in the investment securities portfolio of Banca Carige.
Writedowns relating to the above carried out according to the accounting principles illustrated in section 1 of theexplanatory notes.
Investments made in the form of these securities during 2003 are accounted for at income statement captions 10‘Interest income’ for 3,119 thousand euros (interest income). Details are given in the table below:
EFFECTS ON INCOME STATEMENT 2003 STEMMING FROM ASSET BACKED SECURITIES INPORTFOLIO AT 31/12/03 DERIVING FROM STRUCTURED SECURITISED CREDITS CARRIED OUT BYBANCA CARIGE GROUP COMPANIES
Underlying Senior securities Mezzanine securities Junior securities
Interest Gains/Losses
Write-downs
Interest Gains/Losses
Write-downs
Interest Gains/Losses
Write-downs
a) Mortgages - - - 6 - - 419 - -b) Corporate loans - - - - - - - - -c) consumer credits - - - - - - - - -d) securities - - - - - - - - -e) various other credits - - - - - - - - -f) various other non-performing credits
- - - 49 - - 2,645 - -
Total - - - 55 - - 3,064 - -
(1) Securities recorded in the investment securities portfolio of Banca Carige.

292
SECTION 12
ADMINISTRATION AND DEALING ON BEHALF OF THIRD PARTIES
Change31/12/03 31/12/02 absolute %
12.1 DEALING OF SECURITIESa) Purchases 848,935 246,637 602,298 …
1. Settled 847,456 232,269 615,187 …2. Unsettled 1,479 14,368 -12,889 -89.7
(b) Sales 863,375 579,739 283,636 48.91. Settled 858,144 578,884 279,260 48.22. Unsettled 5,231 855 4,376 …
The figures shown correspond to total market values of property included within administration and trading onbehalf of third parties.The caption includes wealth accumulation services on behalf of third parties pursuant to article 24, Legislativedecree 58/98 amounting to 41,169 thousand euros, including the sum managed by the Carige Open PensionFund set up in compliance with article 9, Legislative decree 124/93 for 38,970 thousand euros.The caption also includes € 70,942 thousand relating to guaranteed asset management products in which theclient purchased from the Bank an accessory put option as cover for the initial capital invested.
Change31/12/03 31/12/02 absolute %
12.2 PRIVATE BANKING 1,353,959 1,954,304 -600,345 -30.71. Securities issued by the Bank 38 5,080 -5,042 -99.32. Other securities 1,353,921 1,949,224 -595,303 -30.5
Change31/12/03 31/12/02 absolute %
12.3 CUSTODY AND ADMINISTRATION OF SECURITIES(a) third-party securities held in deposit 17,079,348 15,754,018 1,325,330 8.4
(private banking not included)1. Securities issued by Group companies 4,632,359 3,254,054 1,378,305 42.42. Other securities 12,446,989 12,499,964 -52,975 -0.4
(b) third-party securities depositedwith third-parties 15,593,807 14,037,144 1,556,663 11.1
(c) portfolio securities depositedwith third parties 2,030,337 1,184,597 845,740 71.4
Depositary bank-related securities in custody amounted to 2,540,637 thousand euros.

293
12.4 COLLECTION OF THIRD PARTY RECEIVABLES: DEBIT AND CREDIT ADJUSTMENTS
31/12/03 31/12/02(a) debit adjustments 919,405 940,346
1. current accounts 13,765 11,0942. bills portfolio 643,415 668,5923. cash 43,499 40,4234. other 218,726 220,237
(b) credit adjustments 1,096,147 1,193,9791. current accounts 9,127 9,0232. bills and other items for collection 1,086,938 1,184,8833. other 82 73
Change31/12/03 31/12/02 absolute %
12.5 OTHER TRANSACTIONS 877,277 1,086,481 -209,204 -19.3– Other banks’ share of pool operations 689,254 901,578 -212,324 -23.6– Total bills related to factoring transactions (“pro solvendo”) 173,267 166,916 6,351 3.8– Amounts managed on behalf of public bodies 14,756 17,987 -3,231 -18.0
12.6 INFORMATION CONCERNING STRUCTURED SECURITISED CREDITS
At the end of 2000, Banca Carige securitised a part of its bad loan portfolio pursuant to Law 130/99 incollaboration with the special purpose vehicle, Argo Finance One; as at 31/12/01, Argo Finance One was amember of the Banca Carige Group (Group holding: 60%).In relation to this transaction and in accordance with the Bank of Italy’s ruling (letter no. 6464 of 31st July 2001) thefollowing details are given below: information required regarding transactions carried out with Argo Finance One inthe form given in part D of the explanatory notes and the relative attachment to the financial statements of thetransferee and issuer of asset backed securities prepared in accordance to the Bank of Italy’s guidelines containedin note no. 3019 of 5th April 2000.
1. QUALITATIVE INFORMATION1.1 A description of the transaction and its progress
Date of transaction: 21st December 2000: with effect from 11.59 pm of 31st December 2000, the completion of thecontract regarding the purchase of the credits; 27th March 2001: the issue of securities financing the purchase.
Transferor: Banca Carige SpA with its head offices in Via Cassa di Risparmio 15, Genoa.
Credits transferred: Banca Carige agreed to transfer without recourse a part of its bad loans portfolio in accordancewith articles 1 and 4 of Law 130/99 backed either fully or in part by voluntary or legally-enforced guarantees at anagreed price of ITL 320 bn. The portfolio at the date of transfer amounted to ITL 566.4 bn, gross, corresponding toa book value for Banca Carige of 440.6 bn, net.
The portfolio subject to sale was identified on the basis of objective criteria foreseen by the relevant legislation (Law130/99).The credits sold were of the following types: a) landed property loans, b) lending of various forms backed byvoluntary and/or legally-enforced guarantees in the form of real estate in addition to non-mortgaged loans ofvarious types. Credits not transferred included syndicated loans, leasing, and credits below 25,822.84 €. (Lit. 50million).

294
The state of the transaction: the transaction, started in January 2001, is progressing according to schedule. Inparticular, collection flows at 31st December 2003 amounted to 89.6 million euros, 27.8 of which were collected in2003. The regular collection allowed for the entire repayment of the class A securities (40 million) and 20.9 millionof the class B securities issue.
1.2 The Parties involved
Purchaser of the credit: Argo Finance One, a company formed on 27th October 2000 in accordance to article 3 ofLaw 130/99 with its head offices in Via Cassa di Risparmio 15, Genoa. The company is enrolled with the Genoacompanies register and with the register of monetary financial institutions held by the Italian exchange office –Ufficio Italiano Cambi, as foreseen by article of 106 of the Italian consolidated banking Law, and enrolled in thespecial list of companies foreseen by the same Law (article 107).
Servicer: The transferor Banca Carige SpA is encharged with the collection of the credits ceded in addition to thepayment services foreseen by the servicing contract stipulated between Banca Carige and Argo Finance One forwhich it, Banca Carige, will receive commission and reimbursement of expenses incurred.
Representative of the Noteholders: The Bank of New York, London branch.
Collection account bank: Banca Carige SpA
Investment account bank/cash manager: Banca Carige SpA
Calculation agent/Paying agent: The Bank of New York, London branch
CAP Counterparty: Banca Carige SpA
Luxembourg agent: Kredietbank S.A. Luxemburgeoise
Administrative services provider: Banca Carige SpA
Transferor’s obligations: at the transfer date, Argo Finance One, as issuer, and Banca Carige SpA as transferor,stipulated a contract of guarantee and indemnity according to the terms of which the transferor provides the issuerwith specific guarantees in relation to the portfolio and accepts to bear any specific costs, expenses and liabilities ofthe issuer deriving from the purchase and holding of the portfolio.
1.3 The nature of the securities issued
Limited recourse asset backed securities: the notes issued by the SPV Argo Finance One on 27th march 2001 aremade up of floating-rate bonds with the following characteristics:
Class ACurrency: euroAmount: 40 million €Rate: floatingParameter: Euribor at 6 months + 0.60% p.a.Coupon: twice-yearlyDuration: 19 years, 3 months (maturity July 2020) average expected duration 1.89 years.Re-payment: re-payment related to recovery of underlying creditsRating: Moody’s: Aaa; Fitch-Ratings: AAListing: Luxembourg bond market
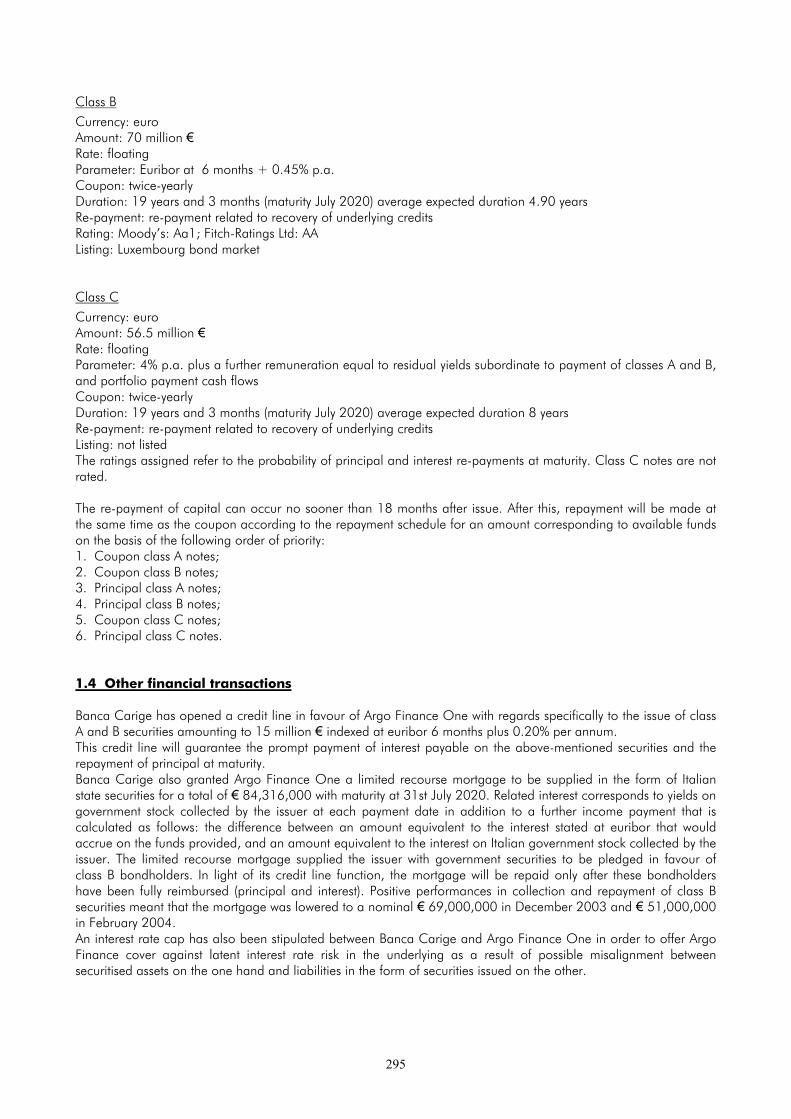
295
Class BCurrency: euroAmount: 70 million €Rate: floatingParameter: Euribor at 6 months + 0.45% p.a.Coupon: twice-yearlyDuration: 19 years and 3 months (maturity July 2020) average expected duration 4.90 yearsRe-payment: re-payment related to recovery of underlying creditsRating: Moody’s: Aa1; Fitch-Ratings Ltd: AAListing: Luxembourg bond market
Class CCurrency: euroAmount: 56.5 million €Rate: floatingParameter: 4% p.a. plus a further remuneration equal to residual yields subordinate to payment of classes A and B,and portfolio payment cash flowsCoupon: twice-yearlyDuration: 19 years and 3 months (maturity July 2020) average expected duration 8 yearsRe-payment: re-payment related to recovery of underlying creditsListing: not listedThe ratings assigned refer to the probability of principal and interest re-payments at maturity. Class C notes are notrated.
The re-payment of capital can occur no sooner than 18 months after issue. After this, repayment will be made atthe same time as the coupon according to the repayment schedule for an amount corresponding to available fundson the basis of the following order of priority:1. Coupon class A notes;2. Coupon class B notes;3. Principal class A notes;4. Principal class B notes;5. Coupon class C notes;6. Principal class C notes.
1.4 Other financial transactions
Banca Carige has opened a credit line in favour of Argo Finance One with regards specifically to the issue of classA and B securities amounting to 15 million € indexed at euribor 6 months plus 0.20% per annum.This credit line will guarantee the prompt payment of interest payable on the above-mentioned securities and therepayment of principal at maturity.Banca Carige also granted Argo Finance One a limited recourse mortgage to be supplied in the form of Italianstate securities for a total of € 84,316,000 with maturity at 31st July 2020. Related interest corresponds to yields ongovernment stock collected by the issuer at each payment date in addition to a further income payment that iscalculated as follows: the difference between an amount equivalent to the interest stated at euribor that wouldaccrue on the funds provided, and an amount equivalent to the interest on Italian government stock collected by theissuer. The limited recourse mortgage supplied the issuer with government securities to be pledged in favour ofclass B bondholders. In light of its credit line function, the mortgage will be repaid only after these bondholdershave been fully reimbursed (principal and interest). Positive performances in collection and repayment of class Bsecurities meant that the mortgage was lowered to a nominal € 69,000,000 in December 2003 and € 51,000,000in February 2004.An interest rate cap has also been stipulated between Banca Carige and Argo Finance One in order to offer ArgoFinance cover against latent interest rate risk in the underlying as a result of possible misalignment betweensecuritised assets on the one hand and liabilities in the form of securities issued on the other.

296
2. TRANSACTION AS AT 31ST DECEMBER 2003
Attachment 1 to the explanatory notes is summarised as follows:
Synthesis of securitised assets and securities issued
EuroTransaction as Transaction asat 31/12/03 at 31/12/02
ASSETSA. Assets securitised 103,306,739 120,229,844
- loans 103,306,739 120,229,844B. Use of available amounts stemming from securitisation 16,961,069 55,796,341
- debt securities - -- others 16,961,069 55,796,341 Available amounts in liquid form 16,073,810 54,780,920 Others 887,259 1,015,421
TOTAL ASSETS 120,267,808 176,026,185LIABILITIESC. Securities issued 150,568,706 166,500,000
- class A: - 40,000,000- class B: 49,068,706 70,000,000- class C: 56,500,000 56,500,000
D. Financing received - -E. Other liabilities 10,577,098 8,094,270
Balance 2001 (306,703) (1,738,619) Amounts payable to Banca Carige SpA 9,326,134 6,888,229 Other items 1,557,667 2,944,660
TOTAL LIABILITIES 116,145,804 174,594,270COSTSF. Interest charges payable on securities issued 4,131,048 6,748,647G. Transaction-related commissions and fees 2,653,517 3,162,653
- servicing 2,604,979 3,111,666- other services 48,538 50,987
H. Other charges 11,369,972 9,415,161- loan losses 936,798 254,828- expected losses on loans 10,197,586 8,954,321- other management charges 235,588 206,012
TOTAL COSTS 18,154,537 19,326,461PROCEEDSI. Interest generated by securitised assets 10,197,586 8,954,321L. Other proceeds 12,078,955 11,804,055
- interst income on securities 204,313 1,164,085- interest income from bank deposits 120,050 213,566- recoveries on loans (amounts collected) 11,754,592 10,426,404
TOTAL PROCEEDS 22,276,541 20,758,376
3. QUANTITATIVE INFORMATION
3.1 Credit–related flowsDetails given below relate to the situation of the securitised assets at 31/12/2003 and subsequent positive andnegative variations recorded during the year.

297
(in millions of euros)Amount of credits purchased at 31/12/2002 120.2Decreases related to collections for the year -27.7Decreases from losses -0.9Increases stemming from writebacks 11.7Increases stemming from interest on late payment 10.2Decreases for expected losses -10.2Balance at 31/12/2003 103.3
3.2 Cash flowsCash flows relating to amounts collected from securitised credits totalled 28.0 million euros in line with the paymentscheduled defined.
The table below illustrates the flows forecasted in the offering circular for the asset backed securities for the first 12years along with flows already collected.
(millions of euros)
2001 2002 2003 2004 2005 2006 2007 2008 2009 2010 2011 2012Foreseen 33.2 25.3 21.8 19.2 16.5 15.1 12.9 11.0 10.1 9.1 7.7 6.9Collected 33.8 28.0 27.8
As a result of the positive performance recorded by the repayment schedule, Fitch IBCA on 6/3/02 upgraded theclass A securities transaction from “AA” to “AAA”; on 13th December 2002 the same institute upgraded thetransaction relating to the class B securities from “AA-“ to “AA”.
Liabilities
There is no pre-defined payment schedule for Class A, B and C notes as this is directly dependant on the proceedsstemming from the credits sold.All classes have a July 2020 maturity.
3.3 Breakdown by location and risk concentrationAll the credits are denominated in euro and all the customers owing amounts are resident in Italy.The portfolio is made up by 1,271 customers owing amounts and includes 3,816 debt items.The composition of the portfolio at 31/12/03 is shown by subdivisions according to amounts owed. There are twocredit positions which singly account for more than 2% of the total portfolio. The three positions total 20.4 millioneuros.
Amounts owed in thousandeuros
Items Gross amounts inthousand euros at
31/12/03< 12.5 2,662 6,763
12.5 – 50 724 18,86250 – 125 299 23,086125 - 250 76 13,841250 – 750 40 16,926
> 750 15 23,829Total 3,816 103,307
4. TRANSACTION RELATED EVENTS Q1 2004
After 31st December 2003, the operation proceeded according to schedule.
The positive trend allowed for the full repayment of the class A securities (40 million) in addition to the repayment ofpart (12.9 million) of the capital relating to the class B securities.

298
SECTION 1
INTEREST
Change2003 2002 absolute %
1.1 CAPTION 10 "INTEREST INCOME AND SIMILAR REVENUES” 613,535 635,012 -21,477 -3.4(a) on deposits with banks 21,691 24,475 -2,784 -11.4 including: – deposits with central banks 3,167 4,593 -1,426 -31.0(b) on loans and advances to customers 494,103 486,147 7,956 1.6 including: – loans using funds managed on behalf of third parties 6 4 2 - (c) on certificates of indebtedness 96,379 123,716 -27,337 -22.1(d) other interest income 1,362 364 998 …(e) positive differentials on hedging transactions - 310 -310 …
Change2003 2002 absolute %
1.2 CAPTION 20 “INTEREST EXPENSE AND SIMILAR CHARGES” 238,334 280,157 -41,823 -14.9(a) on deposits from banks 28,156 34,088 -5,932 -17.4(b) on deposits from customers 59,470 78,702 -19,232 -24.4(c) on securities issued 122,287 130,240 -7,953 -6.1 including: – certificates of deposits 8,408 13,045 -4,637 -35.5(d) on funds managed on behalf of third parties 1 2 -1 -50.0(e) on subordinated liabilities 13,604 17,291 -3,687 -21.3(f) negative differentials on hedging transactions 14,816 19,834 -5,018 -25.3
Change2003 2002 absolute %
1.3 CAPTION 10 "INTEREST INCOME AND SIMILAR REVENUES”a) on foreign currency assets 10,010 14,940 -4,930 -33.0
Change2003 2002 absolute %
1.4 CAPTION 20 “INTEREST EXPENSE AND SIMILAR CHARGES”a) on foreign currency liabilities 21,461 36,181 -14,720 -40.7
PART CCONSOLIDATED INCOME
STATEMENT

299
SECTION 2
COMMISSION
Change2003 2002 absolute %
2.1 CAPTION 40 “COMMISSION INCOME” 204,447 184,235 20,212 11.0(a) guarantees given 8,166 6,224 1,942 31.2(b) credit risk derivatives 461 325 136 41.8(c) management, dealing and consultancy services: 75,361 72,480 2,881 4.0 1. securities dealing 1,889 1,505 384 25.5 2. foreign currency dealing 3,082 3,282 -200 -6.1 3. private banking 9,115 8,287 828 10.0
3.1 individuals 8,624 8,065 559 6.93.2 collective 491 222 269 ….
4. custody and administration of securities 2,505 2,721 -216 -7.9 5. depositary bank 2,454 2,387 67 2.8 6. placement of securities 42,851 43,062 -211 -0.5 6.1 placement of quotas in mutual funds 42,675 42,705 -30 -0.1 6.2 placement of other securities 176 357 -181 -50.7 7. acceptance of orders 4,578 4,834 -256 -5.3 8. Consultancy - - - - 9. distribution of third party products 8,887 6,402 2,485 38.8 9.1 private banking 7 26 -19 -73.1 a) individuals 4 26 -22 -84.6
b) collective 3 - 3 … 9.2 insurance products 4,411 2,734 1,677 61.3 9.3 other products 4,469 3,642 827 22.7(d) collection and payment services 42,480 38,136 4,344 11.4(e) servicing relating to securitisation 1,683 1,510 173 11.5(f) tax and rates collection - - - - (g) other services 76,296 65,560 10,736 16.4

300
Change2003 2002 absolute %
2.2 CAPTION 40 “COMMISSION INCOME”: “DISTRIBUTION CHANNELS OF PRODUCTS AND SERVICES(a) distribution at Carige branches 60,853 57,730 3,123 5.4 1. asset management 9,115 8,287 828 10.0 2. securities placement 42,851 43,041 -190 -0.4 3. services relating to third party products 8,887 6,402 2,485 38.8(b) distribution at outlets other than at head office 137 21 116 … 1. asset management 69 - - - 2. securities placement 55 21 34 … 3. services relating to third party products 13 - 13 …
Change2003 2002 absolute %
2.3 CAPTION 50 “COMMISSION EXPENSES” 16,351 13,705 2,646 19.3(a) guarantees received 1,188 532 656 123.3(b) credit risk derivatives - - - - (c) management and dealing services: 3,225 2,847 378 13.3 1. securities dealing 1,134 1,166 -32 -2.7 2. foreign currency dealing - - 0 … 3. private banking 394 295 99 33.6
3.1 own portfolio 266 2753.2 third party portfolio 128 20
4. custody and administration of securities 1,203 1,092 111 10.2 5. placement of securities 74 179 -105 -58.7 6. securities, products and services not delivered at the Bank’s head office 420 115 305 …(d) collection and payment services 9,838 8,832 1,006 11.4(e) other services 2,100 1,494 606 40.6

301
SECTION 3
GAINS FROM FINANCIAL TRANSACTIONS, NET
Change2003 2002 absolute %
3.1 CAPTION 60 “GAINS FROM FINANCIAL TRANSACTIONS, NET” 10,674 -5,844 16,518 …
2003Transactions
securities currency other A.1 Revaluations 1,556 - 2,581 A.2 Write-downs 7,103 - 864 B. Other gains and losses 8,928 3,265 2,311 Total 3,381 3,265 4,028 1. Government securities 3,743 2. Certificates of indebtedness 4,899 3. Shares and other equity securities -1,6844. Derivatives on securities as underlying -3,577
2002Transactions
securities currency other A.1 Revaluations 1,085 - 1,749 A.2 Write-downs 21,149 - 4,793 B. Other gains and losses 26,572 1,941 11,249- Total 6,508 1,941 14,293- 1. Government securities 9,051 2. Certificates of indebtedness 9,652 3. Shares and other equity securities -12,9554. Derivatives on securities as underlying 760

302
SECTION 4
ADMINISTRATIVE COSTS
Change2003 2002 absolute %
4.1 AVERAGE NUMBER OF EMPLOYEES, BY GRADE 4,225 4,104 121 2.9(a) managers 52 51 1 2.0(b) officials 344 322 22 6.8(c) other employees 3,829 3,731 98 2.6
Change2003 2002 absolute %
CAPTION 80 A"PERSONNEL" 268,412 232,748 35,664 15.3– wages and salaries 175,162 159,519 15,643 9.8– social security costs 49,179 44,633 4,546 10.2– termination indemnities 10,959 21,920 -10,961 -50.0– pensions and similar commitments 18,850 5,906 12,944 …– others 14,262 770 13,492 …
Change2003 2002 absolute %
CAPTION 80 B"OTHER ADMINISTRATIVE COSTS" 148,504 141,283 7,221 5.1Postage and telephone 14,883 14,854 29 0.2Maintenance of tangible and intangible fixed-assets 13,469 12,421 1,048 8.4Advertising, promotion and publishing 10,283 7,823 2,460 31.4Professional fees 9,777 9,197 580 6.3Lighting and heating 5,313 4,118 1,195 29.0Rental expenses 6,173 8,625 -2,452 -28.4Donations 4,741 3,884 857 22.1Travelling and transport 7,898 4,810 3,088 64.2Other banking services 4,944 4,323 621 14.4Printing and stationery 4,442 3,850 592 15.4Software maintenance 4,055 4,126 -71 -1.7Banking premises security services 3,556 3,686 -130 -3.5Hardware leasing charges 3,242 3,072 170 5.5Insurance premiums 2,933 3,080 -147 -4.8Office cleaning 2,924 4,799 -1,875 -39.1EDP processing with third parties 3,773 7,247 -3,474 -47.9Association fees 662 794 -132 -16.6Indirect taxes 31,064 28,580 2,484 8.7– stamp duty and stock exchange contracts 23,383 21,736 1,647 7.6– ”imposta sostitutiva” Presidential Decree 601/73 3,760 2,975 785 26.4– ICI (Municipal real estate tax) 1,817 1,754 63 3.6– local council taxes 1,517 1,487 30 2.0– taxes paid abroad 250 295 -45 -15.3– other indirect taxes 265 267 -2 -0.7– INVIM (tax on increased value on properties) 32 34 -2 -5.9– penalties for late tax rolls 40 32 8 25.0Others 14,372 11,994 2,378 19.8

303
SECTION 5
DEPRECIATION AND AMORTIZATION, PROVISIONS AND RECOVERIES
Change2003 2002 absolute %
CAPTION 90 "DEPRECIATION ANDAMORTIZATION OF INTANGIBLEAND TANGIBLE FIXED ASSETS” 137,238 123,129 14,109 11.5
Depreciation and amortization comprise the following:
Change2003 2002 absolute %
Tangible fixed assets– Properties 7,823 7,489 334 4.5– Furniture and fittings 986 1,027 -41 -4.0– Machinery and equipment 6,199 6,280 -81 -1.3– Leased assets 91,701 81,443 10,258 12.6Total (a) 106,709 96,239 10,470 10.9Intangible fixed assets (1)– Software 8,911 7,583 1,328 17.5– Installation costs 1,414 2,091 -677 -32.4– Goodwill 8,671 6,133 2,538 41.4– Goodwill arising from consolidation 5,698 5,557 141 2.5– Goodwill arising from application of equity method 1,558 1,451 107 7– Others 4,277 4,075 202 5.0Total (b) 30,529 26,890 3,639 13.5Total (a+b) 137,238 123,129 14,109 11.5
Change2003 2002 absolute %
CAPTION 100 "PROVISIONSFOR RISKS AND CHARGES” 4,209 3,273 936 28.6Provisions:– for in-house insurance scheme 500 714 -214 -30.0– for loan renegotiations L.133/99 - 667 -667 -100.0– others 3,709 1,892 1,817 96.0

304
Change2003 2002 absolute %
5.1 CAPTION 120 "PROVISIONS FOR LOAN LOSSES AND FOR GUARANTEES AND COMMITMENTS" 72,588 67,090 5,498 8.2(a) provisions for loan losses 72,317 67,082 5,235 7.8 including: – lump-sum allowances for country risks - - - … – other lump-sum allowances 7,452 5,852 1,600 27.3(b) provisions for guarantees and commitments 271 8 263 … including: – lump-sum allowances for country risks - - - - – other lump-sum allowances - - - -
Change2003 2002 absolute %
CAPTION 130 "RECOVERIES OF LOANS ANDREVERSALS OF PROVISIONS FORGUARANTEES AND COMMITMENTS" 11,295 13,264 -1,969 -14.8– bad loans -principal 2,722 3,631 -909 -25.0– watchlists - principal 1,152 1,543 -391 -25.3– interest - others 522 - 522 …– interest arrears on loans 1,012 1,262 -250 -19.8– credits written-off 5,181 6,123 -942 -15.4– interest credits related to tax collection services 8 9 -1 -11.1– country risks - 432 -432 …– provision for guarantees and commitments 698 264 434 …
Recoveries for which the reasons for previous provisions cease, either fully or in part, to apply.
Change2003 2002 absolute %
CAPTION 140“ADDITIONAL PROVISIONS FORLOAN LOSSES” 19,744 17,334 2,410 13.9
Change2003 2002 absolute %
CAPTION 150“WRITE-DOWNS TO FINANCIALFIXED ASSETS” 0 33 -33 …
Change2003 2002 absolute %
CAPTION 160“RECOVERIES OF FINANCIALFIXED ASSETS” - 99 -99 …
Change2003 2002 absolute %
CAPTION 230“CHANGES IN RESERVES FOR GENERAL BANKING RISKS" 5,065 - 5,065 …

305
SECTION 6
OTHER INCOME STATEMENT CAPTIONS
Change2003 2002 absolute %
6.1 CAPTION 70 “OTHER OPERATING INCOME” 167,518 157,806 9,712 6.2Leasing rents 123,219 113,410 9,809 8.6Amounts recovered from third parties 32,178 30,004 2,174 7.2 including: stamp duty recovered 3,059 20,156 -17,097 -84.8Rental income 5,159 4,959 200 4.0Repayments from leased assets 1,008 1,847 -839 -45.4Gains from transfer and revaluation of leased assets 699 489 210 42.9Gains from sale of credits 79 - 79 …Others 5,176 7,097 -1,921 -27.1
Change2003 2002 absolute %
6.2 CAPTION 110 “OTHER OPERATING EXPENSES” 9,199 11,101 -1,902 -17.1Recognised losses on leased assets sold 7,168 3,904 3,264 83.6Leasing charges 1,520 6,529 -5,009 -76.7Premiums paid on hedging options 251 200 51 25.5Other 260 468 -208 -44.4
Change2003 2002 absolute %
CAPTION 170 "PROFIT (LOSSES) ONINVESTMENTS CARRIED AT EQUITY" 10,030 8,512 1,518 17.8Eptaconsors SpA -1,307 - -1,307 …Levante Norditalia Assicurazioni SpA 2,768 2,337 431 18.4Carige Vita Nuova Assicurazioni SpA 3,536 2,029 1,507 74.3Bankenunion AG 161 5 156 …Autostrada dei Fiori SpA 4,872 4,141 731 17.7
Change2003 2002 absolute %
6.3 CAPTION 190 “EXTRAORDINARY INCOME" 43,121 23,339 19,782 84.8Surplus in reserves for taxation 3,028 1,983 1,045 52.7Gains from releases: holdings 10,079 4,541 5,538 …Gains from releases: furniture and premises 1,817 3,147 -1,330 -42.3Gains from sale of investment securities 2,494 1,824 670 36.7Adjustments stemming from consolidation 2 10 -8 -80.0Other 25,701 11,834 13,867 …

306
Change2003 2002 absolute %
6.4 CAPTION 200 “EXTRAORDINARY EXPENSES” 8,149 6,868 1,281 18.7Retirement incentives 4,177 237 3,940 …Losses from releases: furniture and premises 373 112 261 …Losses from releases: holdings - 140 -140 …Other 3,599 6,379 -2,780 -43.6
Change2003 2002 absolute %
CAPTION 240 “INCOME TAXES” 74,721 60,914 13,807 22.7Current tax expense 70,188 55,992 14,196 25.4Changes in taxes paid -87 5,633 -5,720 …Changes in deferred tax 4,620 -711 5,331 …Income tax for the year 74,721 60,914 13,807 22.7

307
SECTION 7
OTHER INFORMATION REGARDING THE INCOME STATEMENT
7.1 GEOGRAPHIC DISTRIBUTION OF REVENUES
Banca Carige prevalently works in Italy; the first branch outside Italy was opened in Nice (France) on 9/7/94.
2003
Captions Italy Other
countries Total
10 Interest income and similar revenue 610,448 3,087 613,535 30 Dividends and other revenues 18,536 - 18,536 40 Commission income 203,953 494 204,447 60 Gains from financial transactions, net 10,638 36 10,67470 Other operating income 167,478 40 167,518 Total 1,011,053 3,657 1,014,710
2002
Captions Italy Other
countries Total
10 Interest income and similar revenue 631,806 3,206 635,012 30 Dividends and other revenues 8,754 - 8,754 40 Commission income 183,728 507 184,235 60 Gains from financial transactions, net -5,855 11 -5,844 70 Other operating income 157,782 24 157,806 Total 976,215 3,748 979,963
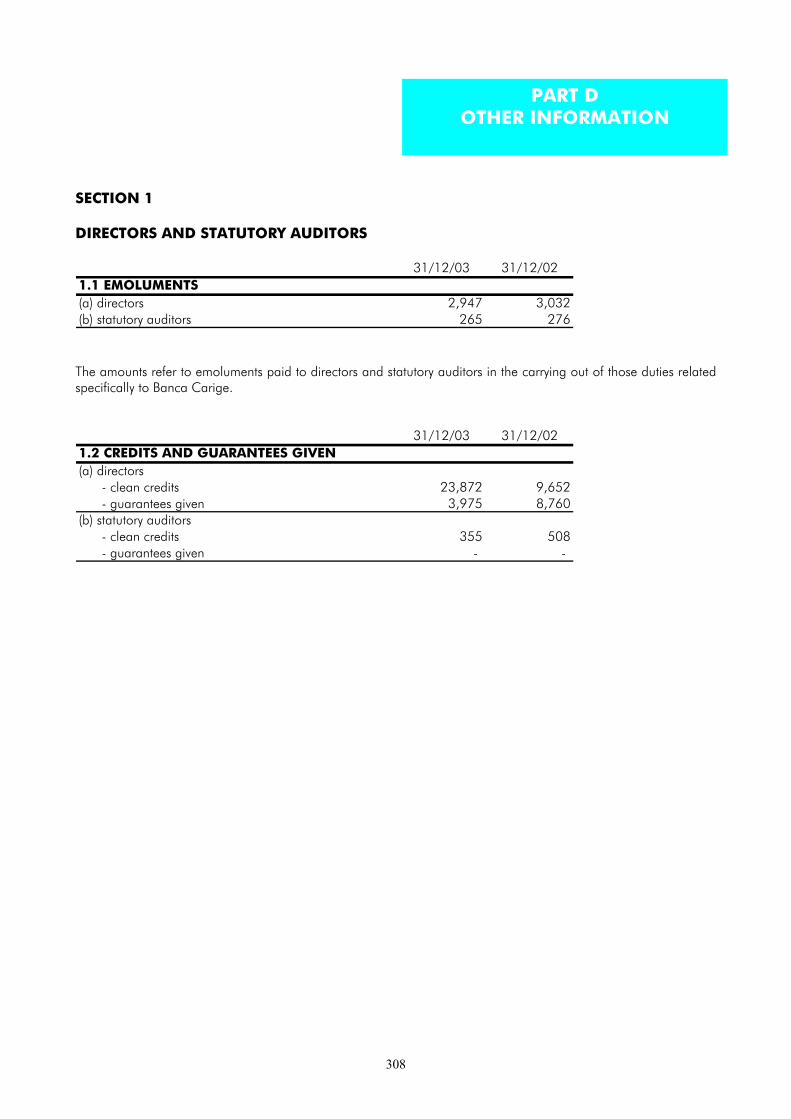
308
SECTION 1
DIRECTORS AND STATUTORY AUDITORS
31/12/03 31/12/021.1 EMOLUMENTS(a) directors 2,947 3,032(b) statutory auditors 265 276
The amounts refer to emoluments paid to directors and statutory auditors in the carrying out of those duties relatedspecifically to Banca Carige.
31/12/03 31/12/021.2 CREDITS AND GUARANTEES GIVEN(a) directors
- clean credits 23,872 9,652- guarantees given 3,975 8,760
(b) statutory auditors- clean credits 355 508- guarantees given - -
PART DOTHER INFORMATION

309
REPORT OF THE BOARDOF STATUTORY AUDITORS

310
REPORT OF THE BOARD OF STATUTORYAUDITORS ON THE BANCA CARIGE GROUP CONSOLIDATEDFINANCIAL STATEMENT AT 31/12/03
To the shareholders of Banca Carige SpA,
The Directors of Banca Carige SpA have prepared the Consolidated Financial Statements at 31/12/03 inaccordance with relevant legislation.
We carried out our supervisory duties according to the codes of best practice for statutory auditors of listedcompanies recommended by the Italian Council of Chartered Accountants.
These financial statements were audited by the Group’s auditors, Deloite & Touche SpA
In the course of our direct inspections and on the basis of information provided to us by the external auditors, wecan state that the consolidated financial statements of the Banca Carige Group have been prepared in accordancewith relevant regulations regarding the form and content of financial statements.
We confirm the existence of effective co-ordination in activities and information flows between the parent companyand its subsidiaries and associated companies.
In particular:− the accounting principles are in compliance with legislation and are suitable for the Group’s activities;− balance sheet and income statement figures are expressed in euro;− the area of consolidation conforms to the provisions of Legislative decree 87/92;− the methods of consolidation adopted are those foreseen by relevant legislation.
With reference to the methods of consolidation we can report that:
= the subsidiaries operating in banking and finance-related activities have been fully consolidated. Thefollowing companies were therefore fully consolidated: Galeazzo Srl; Columbus Carige Immobiliare SpA;Immobiliare Ettore Vernazza SpA; Carige Asset Management SpA (established during the year);Cassa diRisparmio di Savona SpA; Ligure Leasing SpA; Immobiliare Carisa S.r.l.; Centro Fiduciario CF SpA; ArgoFinance One S.r.l.; Banca del Monte di Lucca SpA;= holdings in the following companies were valuated according to the equity method: Carige Vita NuovaSpA, Carige Assicurazioni SpA; Frankfurhter Bankgesellschaft AG; Savona 2000 S.r.l.; Assimiliano S.r.l.;Autostrada dei Fiori SpA; Recina Servizi S.r.l..
= the insurance companies, Carige Assicurazioni and Carige Vita Nuova, albeit subsidiaries, were accountedfor under the equity method in the light of the nature of insurance-related activities and the characteristics ofinsurance companies’ balance sheets.= the consolidation-related transactions described in the Board of Directors’ Report conform to relevantlegislation.
The explanatory notes contain information which the banking industry is required to provide to Consob(communication no. 1011405 of 15th February 2001 adopted pursuant to article 114, Legislative decree 58/98).
We confirm that the Directors’ report for the year, which accompanies these consolidated statements, is inaccordance with the contents required by article 3, Legislative decree 87/92.
During the writing of this report, the Bank’s auditors, Deloitte & Touche SpA, informed us that their report willdeclare that these consolidated financial statements are clearly stated and give a true and fair view of the financialposition and results of the Banca Carige Group.

311
Accordingly, we release our Report on the consolidated financial statements of the Banca Carige Group as at andfor the year ended 31/12/2003.
Genoa, 9th April 2004 The Board of Statutory Auditors

312
REPORT OF THEINDEPENDENT AUDITORS


314
ATTACHMENTS

315
(thousands of euros)
Capitalstock
Additional paidin capital
Legal reserve
Other reserves
Shareholders' equity at 31/12/2002 1,020,550 136,095 56,869 53,499Allocation of 2002 net income - reserves 10,482 - 19,363 - dividends paid -
Allocation to reserve for dividends on own shares -
Increase of share capital 92,777
Increase of share premium reserve for share capital increase 111,361
Reintegration of share premium reserve following securitisation 7,567
Changes in reserve for the purchase of treasury stock 25,613Changes in reserve for the purchase of treasury stock
Reserve for the purchase of treasury stock
Changes in reserves for general banking risks
Changes in the reserves for loan losses
Changes in decreases in net equity
Increased value stemming from the application of the equity method and from the recording of sundry consolidation items 6522003 net incomeShareholders' equity at 31/12/2003 1,113,327 255,023 67,351 60,401
STATEMENT OF CHANGESIN CONSOLIDATED STOCKHOLDERS’ EQUITY

316
Reserve for the purchase of
treasury stock
Negative difference arising from the
application of the equity method
Reserve for general banking
risks
Revaluation reserve
Net income Reserves for loans
losses
Total
25,613 35,134 5,165 8,050 66,171 14,644 1,421,790
8,881 - - 75,052 - 75,052
-
92,777
111,361
7,567
25,613
- 25,613 - 25,613
-
- 5,065 - 5,065
5,353 5,353
- 181 - 181
65284,742 84,742
- 34,953 100 8,050 84,742 19,997 1,643,944