efolioew.files.wordpress.com … · Web viewWe used the same procedure but kept the sodium...
15
Holy Spinach! Measuring the Effect of Sodium Bicarbonate Concentration on the Rate of Photosynthesis
-
Upload
trinhduong -
Category
Documents
-
view
220 -
download
0
Transcript of efolioew.files.wordpress.com … · Web viewWe used the same procedure but kept the sodium...

Holy Spinach!
Emily Wessel
3/13/16
6th Hour
Measuring the Effect of Sodium Bicarbonate Concentration on the
Rate of Photosynthesis

Purpose
The purpose of this experiment was to explore the process of photosynthesis and the effect that sodium bicarbonate has on it. I chose this topic because photosynthesis is a very unique and amazing process. The fact that plants produce their own food is fascinating and I wanted to explore and see what affects it. Also, I love to garden. This experiment provides examples on what could happen if I watered my plants with sodium bicarbonate mixed in. Maybe it could help my garden grow. I got the idea from an experiment we did in my IB/AP Advanced Biology class. We used the same procedure but kept the sodium bicarbonate solution at 2g of sodium bicarbonate in 200mL of water. The independent variable for that experiment was the color of light. I was fascinated by the process and curious about what would happen to the rate of photosynthesis if I changed the amount of sodium bicarbonate.
Research Question
Does the concentration of sodium bicarbonate in water effect the rate of photosynthesis (time it takes to rise) on baby Spinacia oleracea (spinach)?
Background Information
When photosynthesis occurs the plant takes in carbon dioxide and water from the environment, that mixed with the light they absorb make up the reactants for photosynthesis. Leaf disks float due to the air spaces in them. When the air is removed from those spaces in the leaf disks and replaced with the solution of sodium bicarbonate and water, the overall density of the leaf disk increases which causes the disk to sink. The bicarbonate ion on the solution acts as the source of carbon for the reaction. As photosynthesis proceeds, oxygen is released as a byproduct into the interior of the leaf. This changes the buoyancy and causes the disk to rise. This means that the rate at which the disks are rising is an indirect net rate of photosynthesis.
Independent Variable
The amount of sodium bicarbinate(g) in 300mL of water.
Dependant Variable
The amount of time it takes for the disks to float to the top of the beaker (rate of photosynthesis)
Room Temperature (25°C)
Water Temperature (20°C) Type of spinach leaf (Spinacia oleracea ) Amount of Water (300mL) Distance of Light (6in) Light bulb type (white 75W) # of disks per trial (10) Type of baking soda (Arm and Hammer) Hole punch
Variables
Controlled Variabes

Hypothesis
As more sodium bicarbonate is added to the 300mL of water, the rate of photosynthesis will increase. This will happen because the equation for photosynthesis is 6CO2+6H2O+LightC6H12O6+6O2 with the sodium bicarbonate in the water and the CO2 easily available, the reaction will occur at a faster rate. As said in the “What is Photosynthesis?” article on livescience.com, the carbon dioxide from the environment around the plant is taken in and used for the independent reactions of photosynthesis. With that said, the “extra” carbon provided by the sodium bicarbonate will speed up the reaction process.
Materials
Stand 600mL beaker Glass bowl that fit over the beaker Water Spinach leaves Hole punch Syringes Baking soda Scale Measuring boat Spoon Stirring stick Light Lamps 70W white light bulbs Thermometer Timer

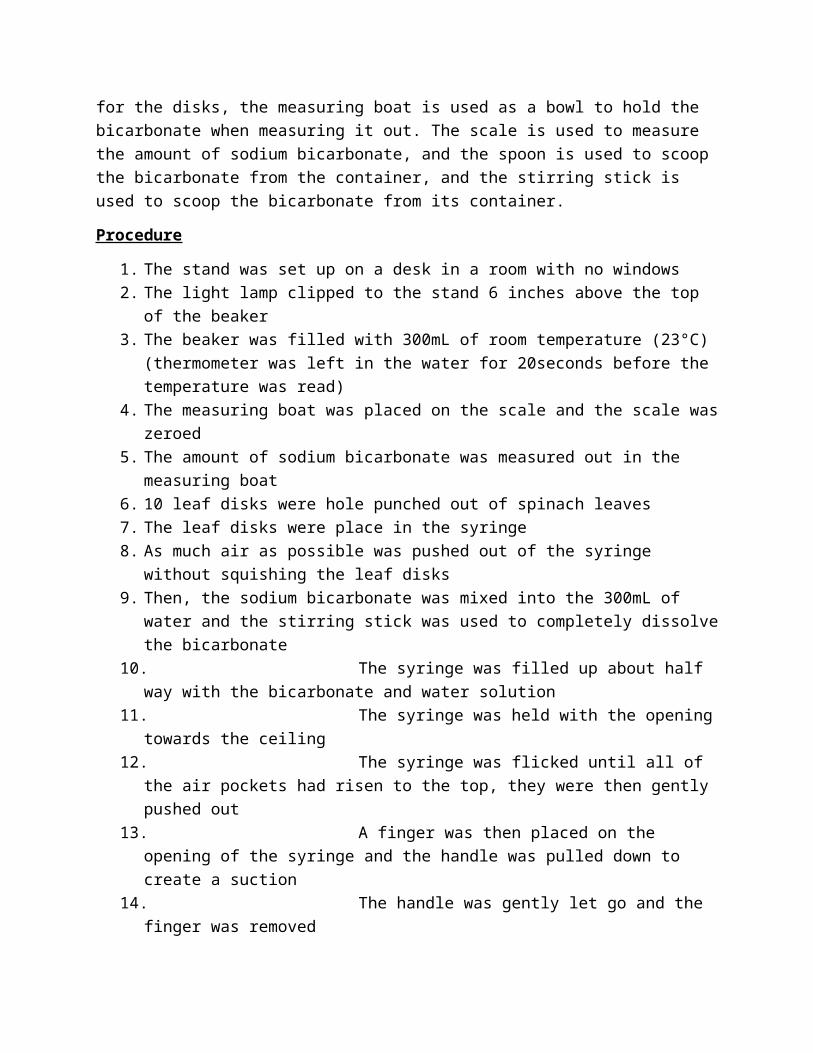
The stand is used to provide stability for the lamp and to hang it 6 inches above the beaker. The lamp and light bulb provide the light source so photosynthesis can occur. The beaker is used to hold the solution and for the experiment to take place in. The sodium bicarbonate (baking soda) acts as the source of carbon for the plant, the syringe is used to remove the air pockets in the disks and replace them with the water/bicarbonate solution. The hole punch is used to punch out the disks used in the experiment. The spinach leaves are the plants that are used for the disks, the measuring boat is used as a bowl to hold the bicarbonate when measuring it out. The scale is used to measure the amount of sodium bicarbonate, and the spoon is used to scoop the bicarbonate from the container, and the stirring stick is used to scoop the bicarbonate from its container.
Procedure
1. The stand was set up on a desk in a room with no windows 2. The light lamp clipped to the stand 6 inches above the top of the beaker3. The beaker was filled with 300mL of room temperature (23°C) (thermometer was left in
the water for 20seconds before the temperature was read)4. The measuring boat was placed on the scale and the scale was zeroed5. The amount of sodium bicarbonate was measured out in the measuring boat6. 10 leaf disks were hole punched out of spinach leaves7. The leaf disks were place in the syringe8. As much air as possible was pushed out of the syringe without squishing the leaf disks9. Then, the sodium bicarbonate was mixed into the 300mL of water and the stirring stick
was used to completely dissolve the bicarbonate10. The syringe was filled up about half way with the bicarbonate and water solution11. The syringe was held with the opening towards the ceiling12. The syringe was flicked until all of the air pockets had risen to the top, they were then
gently pushed out13. A finger was then placed on the opening of the syringe and the handle was pulled down
to create a suction14. The handle was gently let go and the finger was removed15. After that, steps 10-12 were repeated until all of the disks had sunk to the bottom of the
syringe16. The syringe was opened an the contents were dumped into the beaker containing the
solution17. All of the disks had sank to the bottom18. It they didn’t all sink, the procedure would have started over from step 519. After the disks sank, the glass bowl was placed on top of the beaker and the beaker was
placed under the lamp light20. The lamp was turned on and the room’s lights were turned off21. The number of disks that had risen were recorded in 1min time intervals using a timer
22. The water temperature was recorded 3 times during the experiment, before the experiment, after half of the disks had risen, and after all of the disks had risen.
23. Qualitative data was taken in the form of observation of the speed the first disk rose in every trial.
24. This procedure was repeated for every trial (0g, 1.5g, 3g, 4.5g, and 6g) there were 5 trials for every amount.
Raw Data
Time (min)(+/-2seconds)Trial 1 Trial 2 Trial 3 Trail 4 Trial 5
1 0.0 0.0 0.0 0.0 0.02 0.0 0.0 0.0 0.0 0.03 0.0 0.0 0.0 0.0 0.04 0.0 0.0 0.0 0.0 0.05 0.0 0.0 0.0 0.0 0.06 0.0 0.0 0.0 0.0 0.07 0.0 0.0 0.0 0.0 0.08 0.0 0.0 0.0 0.0 0.09 0.0 0.0 0.0 0.0 0.0
10 0.0 0.0 0.0 0.0 0.011 0.0 0.0 0.0 0.0 0.012 0.0 0.0 0.0 0.0 0.013 0.0 0.0 0.0 0.0 0.014 0.0 0.0 0.0 0.0 0.015 0.0 0.0 0.0 0.0 0.016 0.0 0.0 0.0 0.0 0.0
The number of disks floating over time in a solution of 0g of Sodium Bicarbinate in 300mL of water (+/-.5disks)
Number of Floating Disks(+/- .5disks)

Time (min)(+/-2 seconds)Trial 1 Trial 2 Trial 3 Trail 4 Trial 5
1 0.0 0.0 0.0 0.0 0.02 0.0 0.0 1.0 0.0 0.03 0.0 0.0 2.0 0.0 0.04 0.0 0.0 3.0 0.0 0.05 0.0 0.0 7.0 0.0 0.06 0.0 0.0 8.0 0.0 1.07 1.0 2.0 9.0 1.0 1.08 3.0 4.0 10.0 4.0 2.09 5.0 4.0 4.0 3.010 7.0 7.0 6.0 5.011 7.0 8.0 7.0 7.012 8.0 9.0 7.0 9.013 9.0 10.0 8.0 10.014 10.0 10.0 10.0 10.015 10.0 10.0 10.0 10.016 10.0 10.0 10.0 10.0
The number of disks floating over time in a solution of 1.5g of Sodium Bicarbinate in 300mL of water(+/-.5disks)
Number of Floating Disks(+/- .5disks)
Time (min)(+/-2seconds)Trial 1 Trial 2 Trial 3 Trail 4 Trial 5
1 0.0 0.0 0.0 0.0 0.02 0.0 0.0 0.0 0.0 0.03 0.0 0.0 0.0 0.0 0.04 0.0 0.0 1.0 0.0 0.05 3.0 0.0 2.0 0.0 0.06 5.0 1.0 6.0 1.0 0.07 7.0 3.0 7.0 2.0 1.08 8.0 4.0 7.0 4.0 2.09 9.0 5.0 8.0 6.0 5.0
10 9.0 6.0 9.0 8.0 6.011 10.0 7.0 10.0 8.0 8.012 10.0 8.0 10.0 8.0 8.013 10.0 10.0 10.0 9.0 8.014 10.0 10.0 10.0 10.0 9.015 10.0 10.0 10.0 10.0 10.016 10.0 10.0 10.0 10.0 10.0
The number of disks floating over time in a solution of 3g of Sodium Bicarbinate in 300mL of water(+/-.5disks)
Number of Floating Disks(+/- .5disks)

Time (min)(+/- 2seconds)Trial 1 Trial 2 Trial 3 Trail 4 Trial 5
1 0.0 0.0 0.0 0.0 0.02 0.0 0.0 0.0 0.0 0.03 0.0 0.0 0.0 0.0 0.04 0.0 0.0 0.0 0.0 0.05 0.0 0.0 0.0 0.0 0.06 0.0 0.0 0.0 0.0 0.07 0.0 0.0 0.0 0.0 1.08 0.0 0.0 0.0 0.0 3.09 0.0 3.0 6.0 1.0 5.010 4.0 5.0 7.0 4.0 7.011 5.0 7.0 8.0 6.0 8.012 7.0 8.0 10.0 7.0 8.013 10.0 9.0 10.0 9.0 8.014 10.0 10.0 10.0 10.0 9.015 10.0 10.0 10.0 10.0 10.016 10.0 10.0 10.0 10.0 10.0
Number of Floating Disks(+/- .5disks)
The number of disks floating over time in a solution of 4.5g of Sodium Bicarbinate in 300mL of water(+/- .5disks)
Time (min)(+/- 2seconds)Trial 1 Trial 2 Trial 3 Trail 4 Trial 5
1 0.0 0.0 4.0 0.0 0.02 0.0 0.0 4.0 0.0 0.03 0.0 0.0 5.0 0.0 0.04 0.0 0.0 5.0 0.0 0.05 0.0 0.0 5.0 0.0 0.06 1.0 1.0 5.0 0.0 0.07 2.0 1.0 5.0 1.0 1.08 3.0 2.0 7.0 2.0 1.09 5.0 3.0 9.0 4.0 4.010 5.0 5.0 9.0 6.0 8.011 5.0 7.0 10.0 6.0 8.012 7.0 8.0 7.0 9.013 7.0 9.0 8.0 10.014 9.0 10.0 8.0 10.015 9.0 10.0 10.0 10.016 10.0 10.0 10.0 10.0
The number of disks floating over time in a solution of 6g of Sodium Bicarbinate in 300mL of water(+/- .5disks)
Number of Floating Disks (+/- .5disks)

Verification of Control Qualitative Data
Before (°C) (+/-1°C) During (°C) (+/-1°C) After (°C) (+/-1°C)0g Trials
1 23 23 232 23 22 233 23 23 224 23 23 235 23 23 23
1.5g Trials1 23 23 232 23 23 233 23 22 234 23 23 245 22 23 23
3g Trials1 23 23 232 23 23 233 23 24 244 23 23 235 23 23 23
4.5g Trials1 23 24 232 23 23 233 23 23 234 23 24 235 23 23 23
6g Trials1 23 23 232 23 23 243 23 23 234 23 23 235 23 23 23
Water temperature throughout the experiment (+/-1°C)
0g ObservationTrial 1 N/ATrial 2 N/ATrial 3 N/ATrial 4 N/ATrial 5 N/A1.5gTrial 1 Very SlowlyTrial 2 SlowTrial 3 Very SlowlyTrial 4 Very SlowlyTrial 5 Slow3gTrial 1 Very QuicklyTrial 2 Very QuicklyTrial 3 Very QuicklyTrial 4 QuickTrial 5 Very Quickly4.5gTrial 1 QuickTrial 2 QuickTrial 3 QuickTrial 4 QuickTrial 5 Quick6gTrial 1 SlowTrial 2 QuickTrial 3 SlowTrial 4 QuickTrial 5 Quick
Observation of the speed of the first disk that rose

Processed Data
Sample Calculation:
6g solution average disks risen at 13 minutes:
Data:
Formula:
Calculation: (7+9+8+10)/4
=8.5
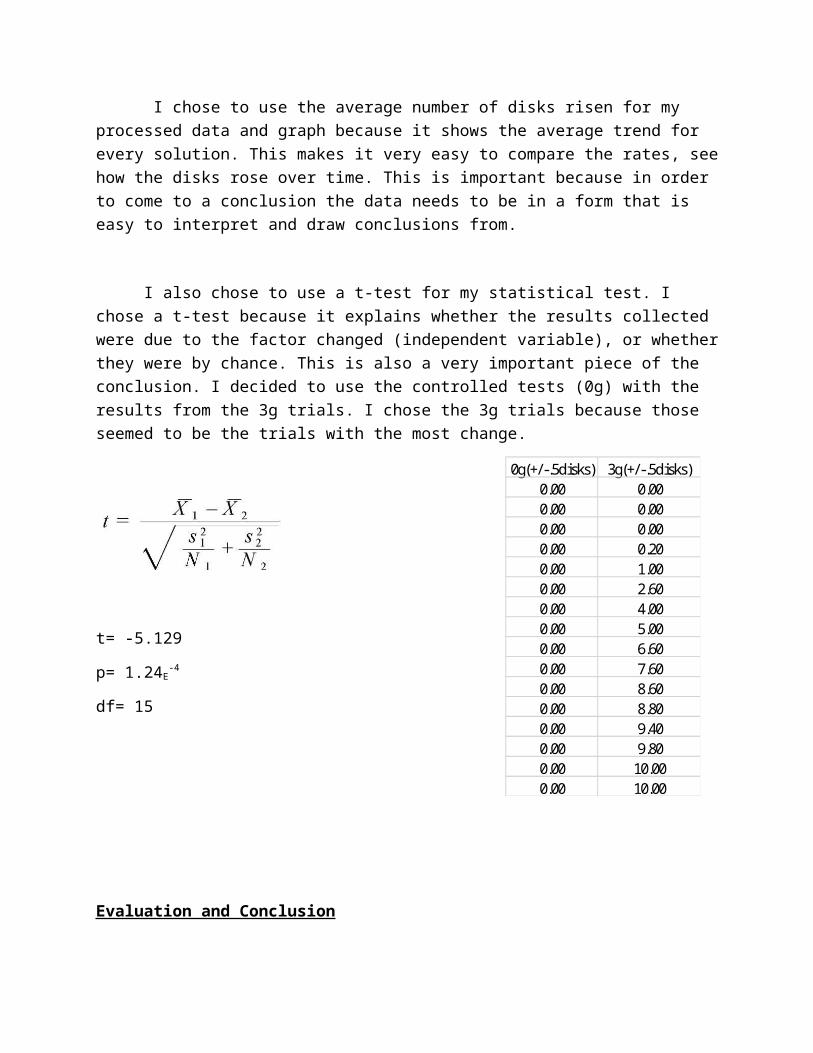
I chose to use the average number of disks risen for my processed data and graph because it shows the average trend for every solution. This makes it very easy to compare the rates, see how the disks rose over time. This is important because in order to come to a conclusion the data needs to be in a form that is easy to interpret and draw conclusions from.
Time Trial1 Trial2 Trial3 Trial4 Trial513 7 9 VOID 8 10
Time (min)(+/-2seconds) 0g(+/-.5disks) 1.5g(+/-.5disks) 3g(+/-.5disks) 4.5g(+/-.5disks) 6g(+/-.5disks)1 0.00 0.00 0.00 0.00 0.002 0.00 0.00 0.00 0.00 0.003 0.00 0.00 0.00 0.00 0.004 0.00 0.00 0.20 0.00 0.005 0.00 0.00 1.00 0.00 0.006 0.00 0.25 2.60 0.00 0.507 0.00 1.25 4.00 0.20 1.258 0.00 3.25 5.00 0.60 2.009 0.00 4.00 6.60 3.00 4.00
10 0.00 6.25 7.60 5.40 6.0011 0.00 7.25 8.60 6.80 6.5012 0.00 8.25 8.80 8.00 7.7513 0.00 9.25 9.40 9.20 8.5014 0.00 10.00 9.80 9.80 9.2515 0.00 10.00 10.00 10.00 9.7516 0.00 10.00 10.00 10.00 10.00
Average disks risen over time in different sodium bicarbinate solutions in 300mL of water (+/-.5disks)

I also chose to use a t-test for my statistical test. I chose a t-test because it explains whether the results collected were due to the factor changed (independent variable), or whether they were by chance. This is also a very important piece of the conclusion. I decided to use the controlled tests (0g) with the results from the 3g trials. I chose the 3g trials because those seemed to be the trials with the most change.
t= -5.129
p= 1.24E-4
df= 15
Evaluation and Conclusion
According to the t-test results, I am 99.9999% sure that the data I collected was due to the change in sodium bicarbonate concentration. With that said, my original hypothesis stating that the increase in the concentration of sodium bicarbonate in water will increase the rate of photosynthesis, or time it takes for the disks to rise, was refuted by the results obtained from my experiment. Based on the averages of the trials and the graph, the amount of baking soda that had the best effect was 3g in 300mL of water (a concentration of .01). The reason I believe this is because in the trials with 3g, the disks started rising well before they did in any of the other trials, and the amount of disks risen were higher with the 3g than the other trials for the majority of the time. Also, by looking at the white line (3g), you can see that that is the line that stands out from the rest. It increases faster and finishes before any of the other trials.
One of the sources that supports this conclusion is the book Competition Science Vision. In this book they say that there is not always an increase in the rate of photosynthesis, there can sometimes be an increase, but that is not always the case.
There were two trials during my experiment where I considered the data to contain outliers. These two trials were trial 3 in the 1.5g solution and trial 3 in the 6g solution. The reason I
0g(+/-.5disks) 3g(+/-.5disks)0.00 0.000.00 0.000.00 0.000.00 0.200.00 1.000.00 2.600.00 4.000.00 5.000.00 6.600.00 7.600.00 8.600.00 8.800.00 9.400.00 9.800.00 10.000.00 10.00

believe they were outliers is because the disks started to rise very early in the trial and all 10 disks had risen considerable fast. I believe that the reason for that was human error. Most likely I did not remove all of the air pockets in the leaf disks. The error bars on the graph are there to create a cushion for the data collected. There are possible sources for minor error throughout any experiment. The error bars show that the data point falls within the range of error.
Limitations of Experimental Design
Overall my experiments went well and were very efficient. The variables listed in the table (under controlled variables) were easy to control. The data came out with only two outliers, and all of the experiments showed a change and ran smoothly. The procedure was easy to follow and left little room for error.
However, not everything went right. I was running two trials at once. I do not think that this was a good idea because of a few reasons. Timing was one of them. Once I started one trial I would set up the next one, I used the same timer for both trials and that could have caused error. That would have been a human error. Also, there were two lamps on at the same time. This could have caused more light to hit one of the beakers based on the angle and position of the lamp, which would have caused a mishap in the data.
There were also random variables that were unpredictable. For example the thickness of the leaves, the size of the leaves, and genetic variation within the species. Every leaf had a different thickness, and they were not all the same size. Some of the leaves were a darker green, and some a lighter. All of these things can cause a change in data.
Suggestions for Improvement
The results of the experiment would be more precise and accurate if there were more controlled variables when it came to the test itself. All of the leaf disks did have the same diameter but they did not all have the same thickness. The difference in thickness differs from leaf to leaf, but that most likely had an effect on the density of the disk. This could have skewed the data. Also, some of the trials had all 10 disks from one leaf, and some had disks from 3 different leaves (depending on leaf size). If I were to redo the experiment I would take 10 different samples from 10 different leaves for the disks and used the same 10 leaves for every trial. That could fix the thickness as well. Also, with the timing situation, I would fix that by having a different timer for each trial that was going instead of using the same one. As for the lights shining on both beakers, I could fix that by placing a tall piece of cardboard between them to keep the light rays on a single beaker.
However, I feel that if I were to make all of these changes, even though they would improve the quality of the experiment, they would not alter the outcome of the data.
"Competition Science Vision." Google Books., Mar. 2003. Web. 21 Mar. 2016.
Vidyasagar, By Aparna. "What Is Photosynthesis?" LiveScience. TechMedia Network, 31 July 2015. Web. 21 Mar. 2016.