· Web viewThis stage of the analysis reflects a contrasting social scientific and ... artful, and...
8
New Views of Information An Alternative Event at CoLIS 8 Featuring original research and an exhibit by: Dr. Jenna Hartel; Karen Pollack & Rebecca Noone (research assistants) Faculty of Information, University of Toronto With commentary from a panel of invited experts: Dr. Jens-Erik Mai, Royal School of Library and Information Science, University of Copenhagen Dr. Pamela McKenzie, Faculty of Information and Media Studies, University of Western Ontario Dr. Michael Olsson, Faculty of Arts and Sciences, University of Technology (Sydney) And a hands-on activity with: CoLIS 8 attendees ABSTRACT For a century "information" has been theorized and defined by information scientists and yet its nature remains obscure and highly contested. This alternative event provides "new views" -- actual images -- of information that have emerged from an empirical research project. Employing a visual data-gathering method known as the draw-and-write technique, 137 research participants were asked “What is information?” and responded by drawing upon a 4" by 4" piece of paper, coined an information square or iSquare, for short. The drawings of information were analyzed using compositional and thematic analysis techniques adapted from precedent visual studies. The results of the research include the identification of the most common graphical representations used to express information, as well as three themes pertaining to the social, technological, and "informational" dimensions of information. This alternative event utilizes the iSquare study and its outcomes as a springboard to imagine and discuss the nature of information today. The title, "New Views of Information," has myriad referents: the diverse images of information displayed in the iSquares (Figure 1), the multidisciplinary perspectives of the invited experts on the panel, and the spontaneous discoveries of CoLIS attendees who participate and draw their own iSquare. Three separate elements are included: 1.Presentation/Panel (Monday, August 19, 11:00-12:30) [Includes an overview of the project; demonstration of the data-gathering method; 1
Transcript of · Web viewThis stage of the analysis reflects a contrasting social scientific and ... artful, and...

New Views of Information An Alternative Event at CoLIS 8
Featuring original research and an exhibit by: Dr. Jenna Hartel; Karen Pollack & Rebecca Noone (research assistants)
Faculty of Information, University of TorontoWith commentary from a panel of invited experts:
Dr. Jens-Erik Mai, Royal School of Library and Information Science, University of Copenhagen
Dr. Pamela McKenzie, Faculty of Information and Media Studies, University of Western Ontario
Dr. Michael Olsson, Faculty of Arts and Sciences, University of Technology (Sydney)And a hands-on activity with: CoLIS 8 attendees
ABSTRACTFor a century "information" has been theorized and defined by information scientists and yet its nature remains obscure and highly contested. This alternative event provides "new views" -- actual images -- of information that have emerged from an empirical research project. Employing a visual data-gathering method known as the draw-and-write technique, 137 research participants were asked “What is information?” and responded by drawing upon a 4" by 4" piece of paper, coined an information square or iSquare, for short. The drawings of information were analyzed using compositional and thematic analysis techniques adapted from precedent visual studies. The results of the research include the identification of the most common graphical representations used to express information, as well as three themes pertaining to the social, technological, and "informational" dimensions of information. This alternative event utilizes the iSquare study and its outcomes as a springboard to imagine and discuss the nature of information today. The title, "New Views of Information," has myriad referents: the diverse images of information displayed in the iSquares (Figure 1), the multidisciplinary perspectives of the invited experts on the panel, and the spontaneous discoveries of CoLIS attendees who participate and draw their own iSquare. Three separate elements are included:
1. Presentation/Panel (Monday, August 19, 11:00-12:30) [Includes an overview of the project; demonstration of the data-gathering method; comments from three invited experts; and audience discussion (90 minutes)]
2. iSquare Exhibit (Available throughout CoLIS) [An artful display of the original 137 iSquares]
3. Hands-on Activity (Available throughout CoLIS) [An opportunity for all to draw an iSquare and contribute to the iSquare Exhibit]
1

Figure 1. Sample iSquares from the study, drawn by students at the Faculty of Information, University of Toronto.
BACKGROUND A survey of the concept of information (Bates, 2010) in the Encyclopedia of Library and Information Science covers many propositions and each reflects the metatheoretical trends of its time. For instance, inspired by cybernetics, Parker posited information as “the pattern of organization of matter and energy” (1974, p. 10). Taking a cognitive view, Brookes defined information as “that which elicits a change in a knowledge structure” (1980, p. 131). As research into information became more diverse, historian Buckland argued for three major forms: information-as-process, information-as-knowledge, and information-as-thing (1991). Just recently, in a postmodern climate, Furner (2004) surprisingly called for an information studies without the concept of information. These statements and many others have enriched our understanding of information, yet have common shortcomings. First, they are generated by scholars and fail to capture a broad and everyday conception of information. Second, they are word-based, though information is part and parcel of a highly visual, multimedia society. Third, they are singular and fixed declarations, though change and perspectivism are markers of this era. The research project and associated conference panel, exhibit, and hands-on activity outlined here creatively engages the concept of information and offers a contemporary interpretation that is visual, egalitarian, and dynamically multi-perspective.METHODOLOGY: A VISUAL APPROACHThis original research employs an arts-based (McNiff, 2008), empirical, visual approach (Prosser & Loxley, 2008) and specifically the data gathering technique of drawing. Drawing is an effective means
to slow down response time, generate contemplation, and express things that may be difficult to put into words. Though an uncommon strategy in information science, drawing has been used to capture children’s perspective on food (Caraher, Baker, & Burns, 2004), celebrity (Gauntlet, 2005), health (Pridmore & Landsdown, 1997), and inclusive education (Prosser, 2007); and among adults has been employed in the study of teachers (Weber & Mitchell, 1995) and the experience of disease (Guillemin, 2004). A convenience sample of students at the Faculty of Information, University of Toronto was asked to answer the question “What is information?” in the form of a drawing. The activity occurred during 15 minutes of class time. Research assistants provided verbal and written instructions and supplied a 4” by 4” piece of white premium bond paper and a black pen. A pilot study occurred in summer 2011 to refine all features of the data gathering process, which was implemented without major changes during the fall of 2011. 137 iSquares were collected. Given the involvement of human subjects, the research design was approved by the Office of Research Ethics at the University of Toronto.
ANALYSIS & RESULTSThe iSquares were analyzed in two sequential stages using two different analytical techniques. The process involved many hours of viewing the iSquares one at a time, in thematic sets, and as a single collection (shown in Figure 2). Each stage of analysis was driven by a distinct research question.
2
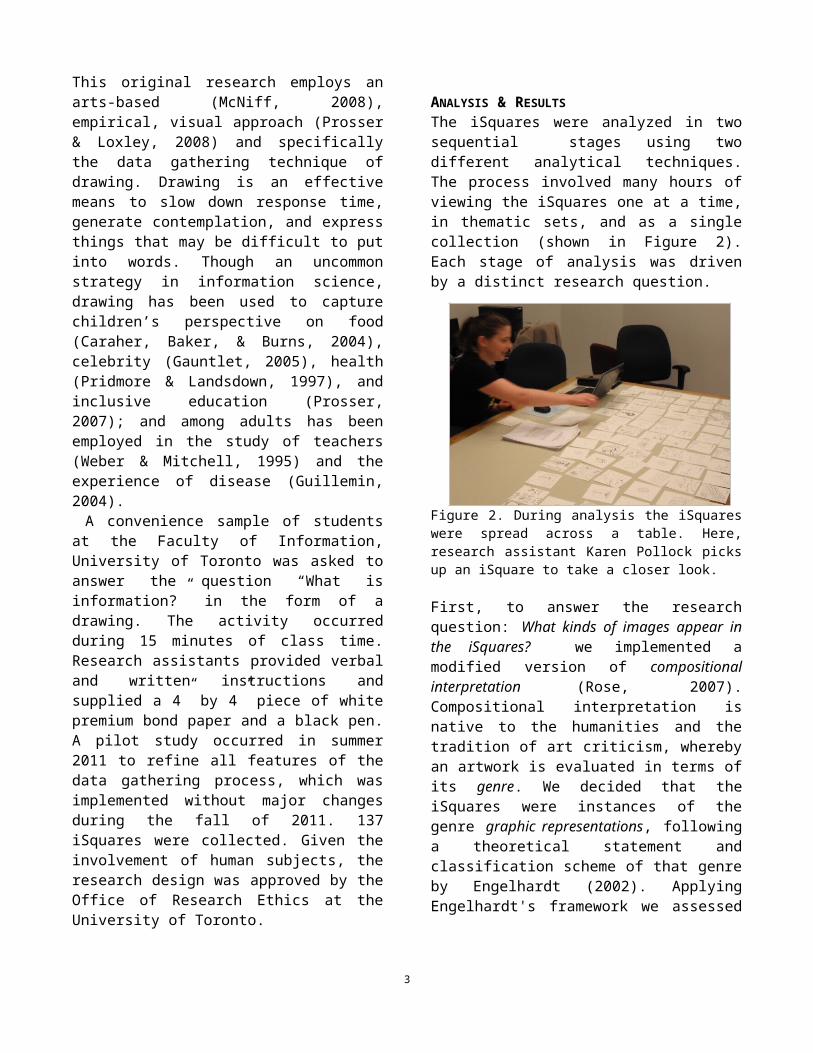
Figure 2. During analysis the iSquares were spread across a table. Here, research assistant Karen Pollock picks up an iSquare to take a closer look.
First, to answer the research question: What kinds of images appear in the iSquares? we implemented a modified version of compositional interpretation (Rose, 2007). Compositional interpretation is native to the humanities and the tradition of art criticism, whereby an artwork is evaluated in terms of its genre. We decided that the iSquares were instances of the genre graphic representations, following a theoretical statement and classification scheme of that genre by Engelhardt (2002). Applying Engelhardt's framework we assessed each iSquare as a: map, picture, statistical chart, time chart, link diagram, grouping diagram, table, symbol, written text, hybrid, or other.Our research subjects most often cast "information" as a picture, link diagram, or symbol. In our presentation we will introduce Engelhardt's framework of graphic representations. Then, the various graphical types appearing in the data will be qualified, quantified, and illustrated with exemplar iSquares. This stage of the analysis reflects the humanistic and arts-based sensibility within the study by engaging the iSquares as artworks that mirror the conventions of a genre.
Second, to answer the research question: What do the iSquares actually show? we applied a generic inductive approach known as "thematic analysis." In thematic analysis codes are invented to represent concepts that the researchers see in the data. In the study we named more than 100 codes and logged them in a spreadsheet. Examples of iSquare codes include: animal, arrow, book, box, brain, computer, document, eye, heart, key, light bulb, magnifying glass, money, network, path, people, plant, smiley fact, sun, text, thought bubble, tree, umbrella, and world. The codes were organized into logical themes and sub-themes related to the social, technological, and informational dimensions of information. For the presentation, the thematic analysis process will be described and then themes will be illustrated with exemplar iSquares. This stage of the analysis reflects a contrasting social scientific and positivist sensibility within the study.Overall, the project generated new views of information that are novel, accessible, artful, and memorable -- hallmarks of visual research (Weber, 2008). At the same time, the iSquares reflect several prior definitions of information by Parker (1974) Brookes (1980), Buckland (1999), and Furner (2004), showing their resonance with the intellectual history of information science.
3

PRESENTATION/PANELThis element features an overview of the study followed by critical commentary from three scholars in multiple disciplines.Presentation Topic
Presenter Duration
Overview of the Study and Results
Dr. Jenna Hartel 35 min.
Create an iSquare Panelists & Audience
10 min.
Commentary Dr. Jens-Erik Mai 5 min.Commentary Dr. Pamela
McKenzie5 min.
Commentary Dr. Michael Olsson
5 min.
Open Discussion Panelists & audience
30 min.
Total: 90 min.
QUALIFICATIONS AND CONTRIBUTIONS OF THE PRESENTATION/PANELDr. Jenna Hartel is an Assistant Professor at the Faculty of Information, University of Toronto, and the primary investigator of the project. Her research explores the nature of information in the pleasures of life through concatenated ethnographic research of serious leisure (Hartel, 2003, 2010). She is a practicing ethnographer and an advocate of the application of visual methods to the study of information (Hartel & Thomson, 2011). Dr. Hartel will moderate the session and present the Overview of the Study and Results.
Dr. Jens-Erik Mai is a Professor at the Royal School of Library and Information Science, University of Copenhagen (Denmark). He is interested in basic questions about the nature of information phenomena and has explored these from a variety of conceptual points (e.g. semiotics, cognitive work analysis, late-modernity, philosophy of language, trust) often with a focus on issues and questions in the organization of information. Dr. Mai has recently published "The Quality and Qualities of Information" in JASIS&T (Mai, 2013).
Dr. Pamela McKenzie, is Associate Dean and Associate Professor at the Faculty of Information and Media Studies of the University of Western Ontario (Canada). Her research concerns the social practices of informing. She is an authority on constructionist approaches for the study of information (McKenzie, 2005) and she was the co-editor of a special issue of Library Quarterly on discursive approaches. Dr. McKenzie is also an expert on qualitative and exploratory research designs and will bring methodological acumen to the panel. Dr. Michael Olsson is a senior lecturer in the Journalism, Information & Media Group at the University of Technology Sydney. He is an active researcher in the field of information behaviour/information practices research, with a particular interest in information/knowledge sharing through in academic, professional and artistic communities. His work is essentially interdisciplinary and has appeared in leading international research journals and conferences in a range of different fields, including information studies, communication and knowledge management. He is the author (Olsson, 2008) of the “Postmodernism” entry for The SAGE Encyclopedia of Qualitative Research Methods. ISQUARE EXHIBITAnother outcome of this research is an artwork, designed by research assistant Rebecca Noone. At CoLIS the 137 original drawings will be mounted as an exhibit to enliven the main conference venue. The sprawling, eclectic array of iSquares should make a striking impression. Lightweight metal panels will serve as a backdrop and each iSquare will be attached with a magnetic tab, which is intentionally impermanent. That way, viewers can remove an iSquare to see the creator’s profile. And, over the duration of the conference the drawings will be rearranged to highlight different themes from the findings, showing that there are
4

many answers to the question “What is information?” HANDS-ON ACTIVITY All CoLIS attendees will have an opportunity to participate in the research project. Adjacent to the exhibit will be a table with paper, pens, and instructions for creating and affixing an iSquare to the fascinating, growing amalgamation.
REFERENCESBates, M. J. (2010). Information. In M. J.
Bates, & M. N. Maack (Eds.), Encyclopedia of library and information science (3rd ed.,). New York: Taylor and Frances.
Brookes, B. (1980). The foundations of information science. Part 1: Philosophical aspects. Journal of Information Science, 2, 125-133.
Buckland, M. K. (1991). Information as thing. Journal of the American Society of Information Science, 42, 351-360.
Caraher, M., Baker, H., and Burns, M. (2004). Children’s views of cooking and food preparation. British Food Journal, 106(4), 255-273.
Cox, A. (2011). Students' experience of university space: An exploratory study. International Journal of Teaching and Learning in Higher Education, 23 (2), 197-207.
Engelhardt, Y. (2002). The Language of graphics: A Framework for the analysis of syntax and meaning in maps, charts and diagrams. Amsterdam: University of Amsterdam, Institute for Logic, Language and Computation.
Furner, J. (2004). Information studies without information. Library Trends, 52(3), 427-446.
Gauntlett, D. (2005). Moving experiences: Media effects and beyond. New Barnet, Herts: John Libbey.
Guillemin, M. (2004). Understanding Illness: Using drawings as a research method. Qualitative Health Research, 14(2), 272-289.
Hartel, J. (2003). The serious leisure frontier in library and information science: Hobby domains. Knowledge Organization, 30(3/4), 228-238.
Hartel, J. (2010). Hobby and leisure information and its user. In M. J. Bates,
5
& M. N. Maack (Eds.), Encyclopedia of Library and Information Science (3rd Edition). New York: Taylor and Francis.
Hartel, J., & Thomson, L. (2011). Visual approaches and photography for the study of immediate information space. Journal of the American Society for Information Science and Technology, 62(11), 2214-2224.
McKenzie, P. (2005). Interpretive Repertoires. In K. Fisher, S. Erdelez, & L. McKechnie (Eds.), Theories of Information Behavior: A Researcher’s Guide (pp. 221-224). Medford, NJ: Information Today.
McNiff, S. (2008). Arts-based research. In J. G. Knowles and A. L. Cole (Eds.), Handbook of the arts in qualitative research: Perspectives, methodologies, examples, and issues. (pp. 29-40). Thousand Oaks, CA: Sage.
Olsson, M. (2008). Postmodernism. In L. Given (Ed.), The SAGE encyclopedia of qualitative research methods. (pp. 656-660). Thousand Oaks, CA: SAGE Publications, Inc.
Parker, E. B. (1974). Information and society. In C. A. Cuadra & M.J. Bates (Eds.), Library and information service needs of the nation: Proceedings of a conference on the needs of occupational, ethnic, and other groups in the United States. (pp. 9-50). Sponsored by the National Commission on Libraries and information Science. Washington, DC: USGPO.
Pridmore, P. J. & Landsdown, R. G. (1997). Exploring children’s perceptions of health: Does drawing really break down barriers? Health Education Journal, 56, 219-230.
Prosser, J. (2007). Visual methods and the visual culture of schools. Visual Studies, 22(1), 13-30.
Prosser, J., & Loxley, A. (2008). Introducing visual methods (National Centre for Research Methods Review Paper). Retrieved from http://eprints.ncrm.ac.uk/420/1/MethodsReviewPaperNCRM-010.pdf
Rose, G. (2007) Visual methodologies: An Introduction to interpreting visual materials, 2nd ed. London: Sage.
Weber, S. (2008). Visual images in research. In J. G. Knowles and A. L Cole (Eds.), Handbook of the arts in qualitative research: Perspectives, methodologies, examples, and issues. (pp. 44-45). Thousand Oaks, CA: Sage.
Weber, S. & Mitchell, C. A. (1995). That’s funny you don’t look like a teacher: Interrogating images and identity in popular culture. Routledge: London.
6