€¦ · Web view2/16. 30 Churchill Place ... Later sections in chapter 5 attempt to address...
51
28 March 2018 Submission of comments on 'Reflection paper on statistical methodology for the comparative assessment of quality attributes in drug development' (EMA/CHMP/138502/2017) Comments from: Name of organisation or individual EFSPI and EFPIA Please note that these comments and the identity of the sender will be published unless a specific justified objection is received. When completed, this form should be sent to the European Medicines Agency electronically, in Word format (not PDF). 30 Churchill Place ● Canary Wharf ● London E14 5EU ● United Kingdom An agency of the European Union Telephone +44 (0)20 3660 6000 Facsimile +44 (0)20 3660 5555 Send a question via our website www.ema.europa.eu/contact © European Medicines Agency, 2022. Reproduction is authorised provided the source is acknowledged.
Transcript of €¦ · Web view2/16. 30 Churchill Place ... Later sections in chapter 5 attempt to address...

28 March 2018
Submission of comments on 'Reflection paper on statistical methodology for the comparative assessment of quality attributes in drug development' (EMA/CHMP/138502/2017)
Comments from:Name of organisation or individual
EFSPI and EFPIA
Please note that these comments and the identity of the sender will be published unless a specific justified objection is received.
When completed, this form should be sent to the European Medicines Agency electronically, in Word format (not PDF).
30 Churchill Place ● Canary Wharf ● London E14 5EU ● United Kingdom
An agency of the European UnionTelephone +44 (0)20 3660 6000 Facsimile +44 (0)20 3660 5555Send a question via our website www.ema.europa.eu/contact
© European Medicines Agency, 2023. Reproduction is authorised provided the source is acknowledged.

1. General commentsStakeholder number
(To be completed by the Agency)
General comment (if any) Outcome (if applicable)
(To be completed by the Agency)
Overall this is a highly needed paper that describes various concerns in comparative evaluations. It does a great job tying together many considerations across multiple modes of comparative assessment. This paper is needed, and we applaud the authors who took the time to bring all of these points together. It may be useful to differentiate amongst sections of the paper targeted towards statisticians and those towards scientists.
We also propose to include the concept that statistical approaches for comparing quality attributes for manufacturing changes and biosimilar evaluations should not be seen as the decisive method for final regulatory conclusions in the sense of pass/fail criteria. The final decisions should be made using all information and processes which ensure consistent clinical performance.
The document would benefit having clear definition of the objectives to be achieved for each of the three topics addressed. This should be define upfront and as a consequence the metrics and methodologies to achieve the objectives will also become more clear.
Objective of the evaluation: For biologicals, the drug product should be characterized by a large number of Quality Attributes (QA) and therefore the future capability, in several dimensions, of the new process, not the central locations, should be integrated as part of the assessment. For generic small molecules, this is well addressed in Section 4.3 and referenced documents. For biologicals, it is the process and its capability that should be evaluated, ie the risk of producing batches outside defendable limits is key in the evaluation.
2/45

Stakeholder number
(To be completed by the Agency)
General comment (if any) Outcome (if applicable)
(To be completed by the Agency)
It is not the new drug product per se that is evaluated. For small molecules, having proven the chemical structure is the same, it is the capability of the process to provide appropriate formulations that should be evaluated.For those reasons the proposed objective is to consider the overall capability of new processes and the metric proposed to measure the distance between old and new processes is the patient risk or the probability to produced batches of drug product outside the acceptance limits.
Acceptance limits and specificationsTo evaluate the capability of a new process it is required to have specifications or acceptance limits, existing or to be defined. For comparison pre-post change, the previous specifications or the previous control limits could be used as basis for evaluating the current and future capability of the new process. For biosimilar products, such pre-existing specifications or control limits based on a long history of production don’t exist and have be built and defended using a limited amount of material. In addition, new (bio)assays have to be developed and validated with new limits being established for those new (bio)assays. For a generic small molecule, the characterization of the new process capability requires a more limited number of QAs for which the specifications are often predefined (pharmacopeia) or imposed by various regulations and therefore agreed (eg f2>50 in dissolution).Given the proposed objective is to evaluate the patient risk, the limits to be used or defended for comparability pre-post change and biosimilars should rather apply to the individual batches and not on the parameters to be estimated such as the mean or the variance. Indeed, a patient will never receive a mean or a variance. These are nevertheless key, but intermediate, parameters to compute the patient risk.
Manufacture limits or clinically justified limitsIn the comparison pre/post change, it is clearly the manufacture limits (specifications, control limits) that
3/45

Stakeholder number
(To be completed by the Agency)
General comment (if any) Outcome (if applicable)
(To be completed by the Agency)
should be used. Those limits are intrinsically proven as clinically defendable. The drug product is already marketed and was approved originally based on this manufacturing process. For generic small molecules there are a number of regulations defining the limits of acceptance as reflecting the state of the art. For biosimilars, the new acceptance limits needs to be justified based on the totality of evidence provided by the biosimilar sponsor.. The strategy is then to assay a more or less extended number of batches of Reference product being on the market. Being on the market those batches are therefore considered as clinically acceptable and within the specifications of the reference product. The key question is then how to derive “similarity” limits based on a reduced number of batches of reference products to ensure that the patient risk is controlled. The other important consequence is that the limits that will be derived based on those reference batches will by definition be considered as clinically justified limits and might therefore become specifications for the future.
Limits for parameters or limits for individual batchesFor biologicals, in biosimilarity as well in manufacturing changes, the limits should be defined for the individual batches and not on the parameters (mean, variance) as in bioequivalence. For generic small molecules, on the contrary it is commonly agreed that the acceptance limits are based on the mean parameter (difference, ratio) because the central objective is to demonstrate the drug product is the same whilst the capability of the process will be guaranteed by manufacturing regulations and practices. Assessing the identity of the product and the capability of the process can be split into two separate steps for small molecules. One noticeable exception for small molecules is the dissolution testing since this is a property of the process (formulation) and therefore the capability of the process to make good batches is also critical. In the case of dissolution, specifications are either defined by regulations (eg pharmacopeia) or need to be defined by evaluation of the reference product.The proposal is to use the Tolerance Interval to define acceptance limits based on results obtain with
4/45

Stakeholder number
(To be completed by the Agency)
General comment (if any) Outcome (if applicable)
(To be completed by the Agency)
biosimilars. This approach is more statistically sound than using min-max or using the mean +- 3 SD. Of course, as indicated in the reflection paper, there is a minimal number of samples needed to compute a Tolerance interval that is not too wide. The recommended content and confidence values to be used for computing the tolerance intervals should also be justified and recommended.
Patient risk, Future batches and hypothesis testingHaving acceptance limits that are defined, computed or pre-existing, the key question is the statistical way to make a decision. One non-inferential option would be to use prediction interval and to assess if it’s fully included in the acceptance limits, the latter could be Tolerance interval. Of course the content of the prediction interval need also to be defined ). An alternative inferential approach based on Bayesian thinking is to compute the predictive probability that the new process will produce batches outside the acceptance limits with or without informative prior. For both approaches the overall operating characteristics should be evaluated and justified. The central hypothesis to be tested is not about one or several parameters but instead the predictive probability individual batches to fall within acceptance limits.Using the predictive distribution or the prediction interval, if applied cautiously, provides the option to evaluate the future capability of the new process and therefore have the decision making process based on the threshold to be defined. Note that the predictive distribution includes the uncertainty of the parameters estimates (mean, variance).
Comparative performance of approaches.One recommendation could be that the applicant defines its objective and show the OC curves of the proposed approach under a wide variety of scenarios. The central aspect of the comparison will be to ensure the patient risk will be controlled. The concept of Region of acceptance, which is the formal translation of the
5/45

Stakeholder number
(To be completed by the Agency)
General comment (if any) Outcome (if applicable)
(To be completed by the Agency)
objective, should explained in the case of biosimilar and comparison pre/post change manufacturing.
Bayesian approaches
For manufacturing changes, it is the new process and its future capability that should be evaluated, ie the risk of producing batches outside defendable limits is key in the evaluation. It is not the new drug product per se that is evaluated. For small molecules, having proven the chemical structure is the same, it is the capability of the process to provide appropriate formulations that should be evaluated.The proposed objective is to consider the overall capability of new processes and the metric proposed to measure the distance between old and new processes is the patient risk or the probability to produced batches of drug product outside the acceptance limits.With this practical objective in mind, Bayesian statistics could be one viable approach.Predictive distribution. With Bayesian statistics it is natural and easy to derive the predictive distribution given the data, meaning that it is possible to compute the predictive probability that new batches will be outside acceptance limits or specifications. This remains valid whether the prior distributions are informative or non informative. The predictive distribution is then more related to the very clinical objective: it allows to compute the predictive probability that a patient will get an appropriate drug product.Prior information. When evaluating a new process with respect to an old process, there are of course various sources of knowledge available that could be included as prior distribution in the Bayesian analysis of the data. These could be related to the precision of the (bio)assays used as well as related to production common sense.Small sample size for evaluation. Leveraging defendable prior information allows to make formal assessment of comparison using limited sample size as it is frequently the case with biologicals. This is an opportunity to envisage and operating characteristics should be well understood and established, including
6/45

Stakeholder number
(To be completed by the Agency)
General comment (if any) Outcome (if applicable)
(To be completed by the Agency)
sensitivity to priors.Handle multiplicity, comparison in many dimensions. One difficulty and challenge in the comparability evaluation is the multiplicity of QAs. In addition those many QAs are even highly correlated. The Bayesian modeling then becomes a natural choice since it can handle multiplicity easily and can even compute the joint probability of several QAs to be outside the acceptance limits whilst taking into account the dependencies.Assurance or power. As opposed to common current practice in frequentist statistics of power studies based on hypothesis testing by putting the density in one point (hypotheses), the purpose is to use full prior densities to evaluate the assurance as defined by O’Hagan. This approach is more robust since the power will be evaluated under a wide variety of hypotheses.A path to allow a Bayesian strategy including the way to evaluate the operating characteristics, the risks and the advantages should be envisaged,in future guidances.Propose to have three separate guidancesGiven the intrinsic difference between small molecules and biologics, and given pre-post change comparison and evaluation of a new drug product are obtained in different context (knowledge, data, history) we suggest that having three different guidances or three clearly different strategic recommendations would improve the readability and adequacy of methodologies.Additional specific points to consider are as follows:
More discussion/reflection on Bayesian methods would be helpful. These methods could overcome some of the limitations mentioned in the paper.
Recommend to replace “statistical methodologies” with “approaches for comparability” in the title of the paper. The term “statistical methodology” is misleading, there are three popular approaches for
7/45

Stakeholder number
(To be completed by the Agency)
General comment (if any) Outcome (if applicable)
(To be completed by the Agency)
assessing comparability, Graphical Assessment, Quality Range Method (QRM), and Two-One Sided Tests (TOST) also known as Equivalence Testing.
The problem of multivariate and multiplicity is not addressed at all whilst fundamental particularly when dealing with biological products.
Reference should be made on the ways the measurements are made for biologicals and the format of the assays. Reference should be made to ICH Q2 and USP 1232-33-34. Recommendations about the format of the assays to generate the reportable values should be referenced and mentioned.
Reference should also be made to regulations about the transfer of a process and its qualification. These are prescribed in other guidances and the reflection paper should mention those guidance and ensure compliance to it. The same applies for the transfer of bioassays and analytical methods.
Provide a discussion of comparative assessment of stability profiles (i.e. slopes) as this is also an important part of an overall similarity or comparability evaluation.
The material needs to be more accessible, e.g. use bulleted lists and tables of clear statements of issues and potential consequences with examples throughout. Use diagrams and plots of data where appropriate. Clearly state the issues instead of “dancing around them” or implying (lines 394-397 as one example). Section 5.2 and the appendix did this nicely and were the best laid out sections in the document. Bulleted lists/tables enable quick identification of key points without needing to spend hours re-reading prose to extract them.
“Quality level” is used several times in the paper. Please define. Quantitative, continuous data are sometimes overly rounded (for reporting purposes) or reported as
“<LOQ” which makes statistical evaluation challenging since the data become very discretized. Provide some thoughts on how to handle such situations.
8/45

Stakeholder number
(To be completed by the Agency)
General comment (if any) Outcome (if applicable)
(To be completed by the Agency)
The rationale for using equivalence testing in comparative assessment of QAs is not always clear among statisticians and practitioners. The reflection paper has a good discussion on the mechanisms of the equivalence approach (e.g. discussion on selecting the comparability criteria (goalpost), selecting different metrics, etc.); however, there is very little discussion on the statistical principles of equivalence testing. For example, in bioequivalence studies, one of the reasons to implement the equivalence approach is to protect against erroneously concluding no difference exists when in fact one exists. In addition, if the statistical assumptions are not met for equivalence testing, descriptive statistical methods should be considered. Adding more details on the rationale to use equivalence testing will help improve common understanding to facilitate consistent assessment by regulatory agencies.
A statistical inference may not be required for all QAs. Simple descriptive evaluations might be suitable for some QA .In the beginning of the document you reflect on different levels of rigor for different QAs (lines 178-180) but don’t seem to follow through on this throughout the remainder of the paper. Consider revisiting this point in this section.
Indicate that one should take all possible information into account given the limitations on data and sampling. For example, using stability data can help inform realistic estimates of within batch sources of variation and can help provide better estimates of batch mean at release than release data alone. Also the quality of assay development can make or break our ability to effectively assess process changes.
The paper states: “the simple rule that with an increasing amount of information available for the comparison (e.g. the number of batches), the quality of the resulting decision should improve.” This remark is certainly true but misses the fact that a large number of batches are not always the answer. It is better to have a smaller set of batches that truly reflect the true variation in the process than a large number of batches made in quick succession that may not reflect the full variation of the process (e.g. raw material batch changes).
9/45

Stakeholder number
(To be completed by the Agency)
General comment (if any) Outcome (if applicable)
(To be completed by the Agency)
Proposed change (if any): consider adding this aspect to the paper.What are the relationships between the “comparability” limits and the specifications? How should the specifications being determined after approval? It would be worth to give some indications particularly for biosimilars.
The reflection paper focuses solely on the statistical analysis for comparison evaluations, but it is important to view this data analysis in context. The science and engineering behind the proposed biosimilar or manufacturing change is critical to understanding whether the new product or change is appropriate. The comparative data is obtained and analysed to support the science and engineering principles/theory. The data analysis should not be the only evidence that the new product or change is appropriate.Proposed change: it would be helpful if the paper discussed this aspect of comparative data evaluation.
The paper does not provide any examples of appropriate data evaluations.Proposed change: consider including examples of appropriate data evaluations to demonstrate comparability.
The recommended strategy of this paper is lost in the detailed and lengthy discussion of the short comings of statistical analysis for comparative experiments.Proposed change: The recommendations, which are currently listed in the appendix, should be clearly identified near the start of the paper and then the rationale for the recommendation discussed after.
This paper provides general guidance for various statistical tools that could be used for comparative assessment of quality attributes in development (e.g. biosimilars, or pre/post manufacturing changes).
10/45

Stakeholder number
(To be completed by the Agency)
General comment (if any) Outcome (if applicable)
(To be completed by the Agency)
However, one of the major challenge in such comparison is the sample size. It'll be beneficial if authors could elaborate on ways to address the sample size challenges.It would be very helpful for both regulators and industry to develop some agreeable statistical standards for comparative assessment of QAs in drug development.Similar statistical challenge comes up while making changes to the analytical method during a drug's life cycle. It will be extremely helpful to have general guidance on the statistical approaches for the comparison of analytical method.The general writing style and some of the terminology (e.g. “settings”) was somewhat confusing.
We highly appreciate and strongly support this paper. It is a comprehensive summary of necessary aspects that are related to the comparison of QAs.
The reflection paper shall be understood as guidance for comparability.It reflects (line 109ff) “to which extend the implementation of inferential statistical methods can assist or even facilitate comparative evaluation of quality attributes data”, suggesting that more considerations on statistics shall be attributed in comparability assessments.
11/45

2. Specific comments on textLine number(s) of the relevant text
(e.g. Lines 20-23)
Stakeholder number
(To be completed by the Agency)
Comment and rationale; proposed changes
(If changes to the wording are suggested, they should be highlighted using 'track changes')
Outcome
(To be completed by the Agency)
71-76 The paper includes: “This paper however also discusses likely limitations hampering statistical inference, pointing towards meaningful – but expectedly less stringent – alternatives.”Proposed change: Please provide examples of what these “meaningful alternatives” would be.
82-84 The authors should be more clear about the exact meaning or objective of “comparison”. This can mean of lot different things and more in depth quality thinking in the definition of “comparison” have to be used. This is related to the general comment: define the objective of the “comparison” to be made.
94 Recommend improving the definition of inferential statistics. The paper gives the following definition, “Inferential statistical methods means quantifying uncertainties arising from the fact that claims (or decisions) are made on limited data stemming from a sample” (Line 94). Inferential statistics is about inferring population (or process) characteristics from a sample, e.g., inferring population mean from a sample mean. Uncertainty includes precision and bias, the assessment of bias due to poor experimental design or conduct is far more important than quantifying precision due to sampling, i.e., confidence interval. Only after the population is determined can the experimenter begin to investigate potential bias, systematic difference between the estimate and the population parameter, in the experiment (or sampling). In other words, one cannot evaluate whether the sample is representative until the population of interest is determined. With this definition, it is clear that statistical inference is meaningless without a discussion of the populations (or processes) of interest. Population is missing from the paper’s definition of statistical inference.
12/45

Line number(s) of the relevant text
(e.g. Lines 20-23)
Stakeholder number
(To be completed by the Agency)
Comment and rationale; proposed changes
(If changes to the wording are suggested, they should be highlighted using 'track changes')
Outcome
(To be completed by the Agency)
94-108 Recommend shifting the paper’s focus from statistical inference to proper design of comparability studies. One of the first topics in the paper is limitations of statistical inference. Statistical inference relies on identification of the population and characteristic of interest, experimental design (include sampling design) coupled with an appropriate statistical analysis method (all specified prospectively in a protocol), and good experimental conduct. The discussion regarding statistical inference in the Introduction (Lines 94-108) does not recognize these requirements of statistical inference. Later sections in chapter 5 attempt to address experimental design issues but are too brief, and lack clarity. The reader would benefit from a robust discussion of these prerequisites prior to addressing statistical inference.
101 Comment: delete the word “severe”Proposed change (if any):”…but often limitations exist…”
104 Comment: The meaning of ”classical” is unclear. Is it referring to frequentist approach versus Bayesian?Proposed change (if any): Clarification is to be provided.
105-108 Comment: Similarity can however be inferred if a similarity margin/range deemed acceptable is established prior based on knowledge from historical data and compared against new data. Assumption is that both processes are well controlled.
Proposed change (if any): It is recommended to revise the statement to specify when similarity can be inferred. A sampling plan should be developed that specifies statistical confidence to be applied.
111-112 The paper discusses the “non-representative nature” of the data that can be assessed in comparative experiments. Proposed change: suggest adding some discussion around this issue.
13/45

Line number(s) of the relevant text
(e.g. Lines 20-23)
Stakeholder number
(To be completed by the Agency)
Comment and rationale; proposed changes
(If changes to the wording are suggested, they should be highlighted using 'track changes')
Outcome
(To be completed by the Agency)
118-120 Comment: “Section 5 lists important fundamental methodological prerequisites which need to be considered when attempting to establish a statistical framework for decision making based on quality attributes data.” Could the authors clarify why this list should only apply when adopting a statistical framework for decision making based on quality attributes data. Surely such considerations should apply to any framework for assessing quality attributes data?
Proposed change (if any): “Section 5 lists important fundamental methodological prerequisites which need to be considered to establish the statistical framework for decision making based on quality attributes data.”
129-130 Comment:“The use of sample data for reasonable decision making usually requires statistical considerations”. – Only usually?Proposed change (if any):“The use of sample data for reasonable decision making requires statistical considerations”
145 Insert ICH-Q2164 Comment: Change “all of that terms.” to “those materials as well.”
Proposed change (if any): “…to equally apply to those materials as well.”
172-180 Recommend the use of 3 criticality levels.How should decision be made within each criticality level ?How should the decision be made between the criticality levels?
14/45

Line number(s) of the relevant text
(e.g. Lines 20-23)
Stakeholder number
(To be completed by the Agency)
Comment and rationale; proposed changes
(If changes to the wording are suggested, they should be highlighted using 'track changes')
Outcome
(To be completed by the Agency)
Different approaches or simply different level of risk/confidence that would be more consistent with the concept of criticality.How to deal with the multiplicity?
181-203 Comment: It is not just the manufacturing process that has to be consistent, but the entire system, which includes the analytical procedure, the transport, storage and preparation of test samples, reference standard qualification, etc.
187 Comment: word ‘constantly’ might be misinterpretedProposed change (if any): ‘regularly’
190-198 “Whenever it is mentioned that two products are compared, it is assumed that these products can be 'consistently' manufactured”How to evaluate consistency ? Should not the uncertainty about this assumption being part of the comparison strategy ie having enough batches to capture potential long term variation?Recommend removing the assumption of “consistently manufactured” Line 198. This is a simplifying assumption that some academic statisticians might appreciate. However, industrial statisticians know that this ignores reality and makes the succeeding sections of the paper of little value. Most process changes/transfers and biosimilars are made on products with long histories and large volumes. Retrospective analysis of quality attributes for these biopharmaceuticals will often show drifts and shifts, due to change in raw materials, cell thaws, intentional process changes, etc. and possibly composite process (mixture of two or more stable processes) due to manufacturing site differences. When the current manufacturing process is not so stable,
15/45

Line number(s) of the relevant text
(e.g. Lines 20-23)
Stakeholder number
(To be completed by the Agency)
Comment and rationale; proposed changes
(If changes to the wording are suggested, they should be highlighted using 'track changes')
Outcome
(To be completed by the Agency)
subjective decisions must be made in setting target ranges for the new process. Should only the most recent data be used? Or should all the data be used, i.e., what is the population of interest? Ignoring this common and important issue in the paper is not recommended.
188-193 Different understanding of “consistent manufacturing” in process manufacturing and “consistency” in the general linguistic usage is a source of misunderstanding between statisticians and process scientists/reviewers. Therefore we propose to include a clear definition of what is meant by “consistent manufacturing” for the scope of this reflection paper.
Proposed change:“Following this reasoning, it is evident that a specific manufacturing process is subject to (allowed) variation in itself. This reflection paper follows this understanding of a consistent manufacturing process, which is controlled to stay within acceptable ranges or limits, while other metrics (e.g., variance, mean value) can vary over time. Whenever it is mentioned that two products are compared, it is assumed that these products can be accordingly 'consistently' manufactured, guaranteed by adequate process-control measures.”
204-208 “Performing a comparison on the quality level based on samples taken from two manufacturing processes usually means that there is interest in drawing conclusions on similarity for the entirety of the material produced by the two manufacturing processes. Hence sample material
16/45

Line number(s) of the relevant text
(e.g. Lines 20-23)
Stakeholder number
(To be completed by the Agency)
Comment and rationale; proposed changes
(If changes to the wording are suggested, they should be highlighted using 'track changes')
Outcome
(To be completed by the Agency)
needs to be understood as ‘vehicle’ to estimate quality characteristics for the entirety of material produced in the past and the future, assuming consistency of the production processes as defined above.”This is a very important statement because it underline the fact that the objective is to compare processes, not only by looking at past material, but also for making inference about future material assuming consistency of process. This again advocate for 1) having better definition of the objectives and 2) for using Bayesian statistics that provides the predictive distribution.
208-211 Comment:“Therefore, the understanding that interest is not so much in the actual samples (e.g. batches) drawn, but in the underlying (actually unknown) data distributions of the entirety of the materials ever produced, is key to follow the considerations in this document.”This is a key point. Making a statement about the underlying distributions based on the samples is drawing an inference. Statistics is the only scientifically rational way of doing this.In addition, another key interest is the distribution of the future batches to be produced given the current and past batches. This is the central question: given batches produced with current/new process, will the process be able to produce material similar to reference material. The similarity assessment is included in a non-differentiated way the similarity of the material and ability of the process to be consistent.Proposed change (if any):
17/45

Line number(s) of the relevant text
(e.g. Lines 20-23)
Stakeholder number
(To be completed by the Agency)
Comment and rationale; proposed changes
(If changes to the wording are suggested, they should be highlighted using 'track changes')
Outcome
(To be completed by the Agency)
222-226 “the range of potentially suitable approaches and methods to carry out comparative data analyses might differ in the different settings described in the following. All settings mentioned below would merit from further reflections concerning the options and limitations of inferential statistical methodology which might be considered suitable for application in the situations described.”A proposal would be to ask to the applicant to make proposals upfront and to evaluate those statistical proposals using operating characteristics under various scenarios.
225 Another example of referring to the limitations of inferential statistical methodology but no alternative approaches are provided.
242 What is a difference in product quality ?252-254 Comment: This is not necessarily the case in early development where
even for the “pre-change” process only a few batches might be available.
254 “As a consequence, QAs' data from just a few ‘post-manufacturing-change’ batches are taken as single values and compared to 'data-ranges' describing the pre-change manufacturing condition.”We’re unclear what this means. Is it that multiple values are taken from a few post-manufacturing batches and these individual observations are compared to data ranges or is that a single value per batch is compared to the data range? If the latter, then is it made reference to the reportable value that is used to release a batch, and therefore in that case the sampling process to include in the reportable value should be defined and consistent for all batches to be included in the similarity
18/45

Line number(s) of the relevant text
(e.g. Lines 20-23)
Stakeholder number
(To be completed by the Agency)
Comment and rationale; proposed changes
(If changes to the wording are suggested, they should be highlighted using 'track changes')
Outcome
(To be completed by the Agency)
analysis, including for reference material.256-262 Recommend to introduce the term QRM in Lines 256 – 262.259 Recommend to replace “statistical methodologies” with “approaches for
comparability” in the title of the paper. The term “statistical methodology” is misleading, there are three popular approaches for assessing comparability, Graphical Assessment, Quality Range Method (QRM), and Two-One Sided Tests (TOST) also known as Equivalence Testing. When a protocol and acceptance criteria are set prospectively, the QRM method is objective, however it makes no inferential statistical claim (Line 259). The type of interval, tolerance interval, predictive interval, min-max, etc, used to set the range does not make the QRM an inferential statistical method, however all interval types provide objectivity if they are set prospectively.
299-302 Comment: Three approaches are suggested to demonstrate equivalency:
Demonstrating that already established QA acceptance ranges are met, by determining proportion of conforming or non-conforming.
Using historical data to established QA specification limits if not already set and then demonstrating new products meet these limits. In this case, each new lot is evaluated individually.
Last option would be equivalence using side by side QA testing of new vs old. Limitation with this method is statistical comparison of one lot to the next may cause the process to drift
19/45

Line number(s) of the relevant text
(e.g. Lines 20-23)
Stakeholder number
(To be completed by the Agency)
Comment and rationale; proposed changes
(If changes to the wording are suggested, they should be highlighted using 'track changes')
Outcome
(To be completed by the Agency)
further.
Proposed change (if any): May consider adding recommended approaches to demonstrate equivalency.
302-303 Comment: It is unclear to which methods “inferential statistical methods” refers to.
Proposed change (if any): Define or explain "inferential statistical methods"
360-361 Comment: This is understood to mean that the two distributions are assumed to be similar or some transformation will be required to fit the two distributions. Is that the case?Proposed change (if any): The assumptions are to be specified.
362-363 Comment: It should be emphasized that the statistical methodology covered under this section assumes several conditions, e.g. constant mean, independent and symmetrical data, distribution of the QA attributes to be normally distributed, comparing the mean of a quality attribute to understand location is applicable in a normally distributed data since this approach would not identify skewness of data. Location of the median may provide added information.Proposed change (if any): The assumptions for the statistical methodology are to be specified.
20/45

Line number(s) of the relevant text
(e.g. Lines 20-23)
Stakeholder number
(To be completed by the Agency)
Comment and rationale; proposed changes
(If changes to the wording are suggested, they should be highlighted using 'track changes')
Outcome
(To be completed by the Agency)
362-365 Comment: As Mean is sensitive to outliers, addressing the variance is critical.
Proposed change (if any): Suggestions about addressing the variance should be given.
371-372 Comment: Does this imply that the manufacturer knows and understands the underlying distributions of the two processes being compared? Identifying the distribution characteristic of a QA may imply the manufacturer have knowledge of the underlying distribution, which is usually not the case.
Proposed change (if any): Clarification is to be provided
406 “In statistical terminology, this corresponds to a 'one-sided' statistical test.” This statement is only true for a QA which is monotonically related to quality. For the majority of QAs, both excessively low and excessively high values of the QA would both indicate poor quality.
416 Comment: avoid that the reader sticks to this approach; there also exist equivalence testing procedures without the confidence interval approach
Proposed change (if any): ‘One classical way, but not the only, to carry
21/45

Line number(s) of the relevant text
(e.g. Lines 20-23)
Stakeholder number
(To be completed by the Agency)
Comment and rationale; proposed changes
(If changes to the wording are suggested, they should be highlighted using 'track changes')
Outcome
(To be completed by the Agency)
out equivalence testing’
418 Comment: reference ‘mentioned in 4.1.2’ is wrong, doesn’t exist. Probably 5.1 and/or 5.1.2 is meant.
Proposed change (if any): ‘mentioned in 5.1’
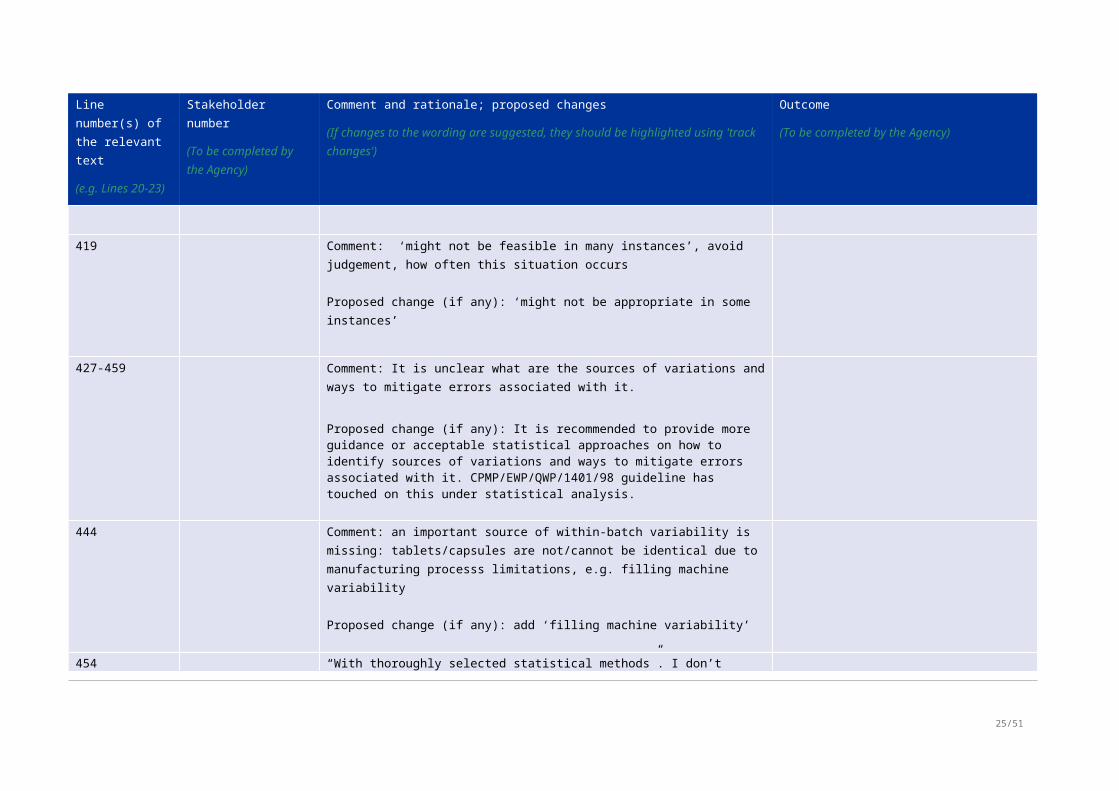
419 Comment: ‘might not be feasible in many instances’, avoid judgement, how often this situation occurs
Proposed change (if any): ‘might not be appropriate in some instances’
427-459 Comment: It is unclear what are the sources of variations and ways to mitigate errors associated with it.
Proposed change (if any): It is recommended to provide more guidance or acceptable statistical approaches on how to identify sources of variations and ways to mitigate errors associated with it. CPMP/EWP/QWP/1401/98 guideline has touched on this under statistical analysis.
444 Comment: an important source of within-batch variability is missing: tablets/capsules are not/cannot be identical due to manufacturing processs limitations, e.g. filling machine variability
22/45

Line number(s) of the relevant text
(e.g. Lines 20-23)
Stakeholder number
(To be completed by the Agency)
Comment and rationale; proposed changes
(If changes to the wording are suggested, they should be highlighted using 'track changes')
Outcome
(To be completed by the Agency)
Proposed change (if any): add ‘filling machine variability’
454 “With thoroughly selected statistical methods”. I don’t understand what is meant by “thoroughly”. Do the authors mean “appropriate”?
456-459 “Depending on the nature of the comparability task and the underlying objective, access to information describing the context of data collection for the QAs of interest may be limited. Such a limitation would hamper identification of potential sources of variability. In consequence, options for an inferential statistical analysis approach for the desired data comparison would be limited as well.”We don’t understand what this paragraph is trying to say.
466-470 Comment: More can be said about consecutive batches.Proposed change: add comments about the correlation of consecutive batches leading to poorly estimated (or poorly represented) batch variation. A plot may help. Also note the possibility that multiple drug product batches may be sourced from the same drug substance batch, which again leads to a correlative/sample representativeness issue. Examples like these (and more) are needed in the document.
472 Comment: add to end of sentence that we also need to capture variation.Proposed change: “…and to capture important sources of variation.”
473-477 “The non-random nature of samples used for the purpose to compare manufacturing processes, resulting in questionable 'representativeness',
23/45

Line number(s) of the relevant text
(e.g. Lines 20-23)
Stakeholder number
(To be completed by the Agency)
Comment and rationale; proposed changes
(If changes to the wording are suggested, they should be highlighted using 'track changes')
Outcome
(To be completed by the Agency)
needs to be understood as one frequently occurring limiting factor hampering the desired application of inferential statistical methodology. If representativeness cannot be assumed, any particular statistical model applied will fail to describe uncertainty in the desired manner, and the corresponding results have no inferential interpretation.”This statement is true. It also seems to imply the problem is restricted to statistical inference. It is not. Non-representativeness impacts more than just describing uncertainty. It impacts any attempt to draw inferences from the data, be that using a statistical methodology or otherwise. The problem does not magically disappear if you don’t do inferential statistics!
460-482 It is well known that the assumption of random sample is questionable, particularly for the Reference product in Biosimilar scenario. It is a slight or important issue but there is very little alternative option. If representativeness is not assumed then no statistics is possible and no inference is possible whatever the strategy.
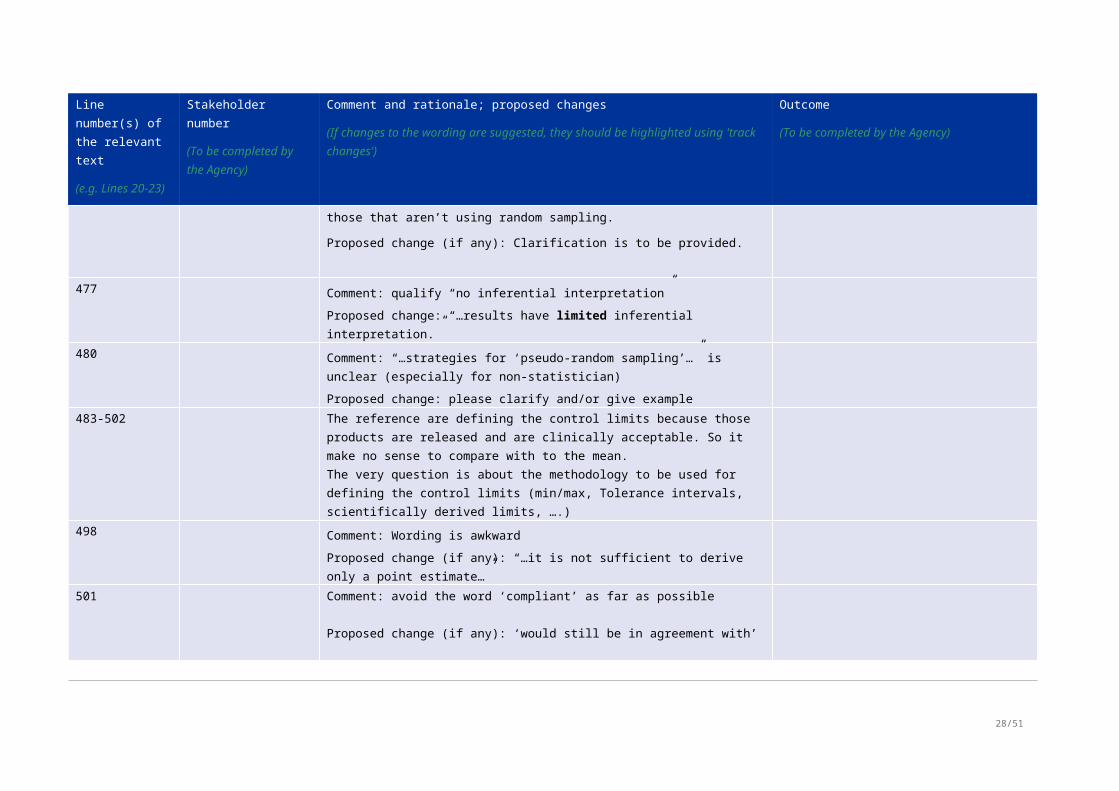
473-482 Comment: If random sampling isn’t possible, then the discussion about non-random sampling needs to be more directly presented. Here it seems that non-random sampling shouldn’t be used, but adequate or pseudo-random sampling is allowed. This sounds vague and can create a loophole for those that aren’t using random sampling.Proposed change (if any): Clarification is to be provided.
477 Comment: qualify “no inferential interpretation”
24/45
Line number(s) of the relevant text
(e.g. Lines 20-23)
Stakeholder number
(To be completed by the Agency)
Comment and rationale; proposed changes
(If changes to the wording are suggested, they should be highlighted using 'track changes')
Outcome
(To be completed by the Agency)
Proposed change: “…results have limited inferential interpretation.”480 Comment: “…strategies for ‘pseudo-random sampling’…” is unclear
(especially for non-statistician)Proposed change: please clarify and/or give example
483-502 The reference are defining the control limits because those products are released and are clinically acceptable. So it make no sense to compare with to the mean.The very question is about the methodology to be used for defining the control limits (min/max, Tolerance intervals, scientifically derived limits, ….)
498 Comment: Wording is awkwardProposed change (if any): “…it is not sufficient to derive only a point estimate…”
501 Comment: avoid the word ‘compliant’ as far as possible
Proposed change (if any): ‘would still be in agreement with’
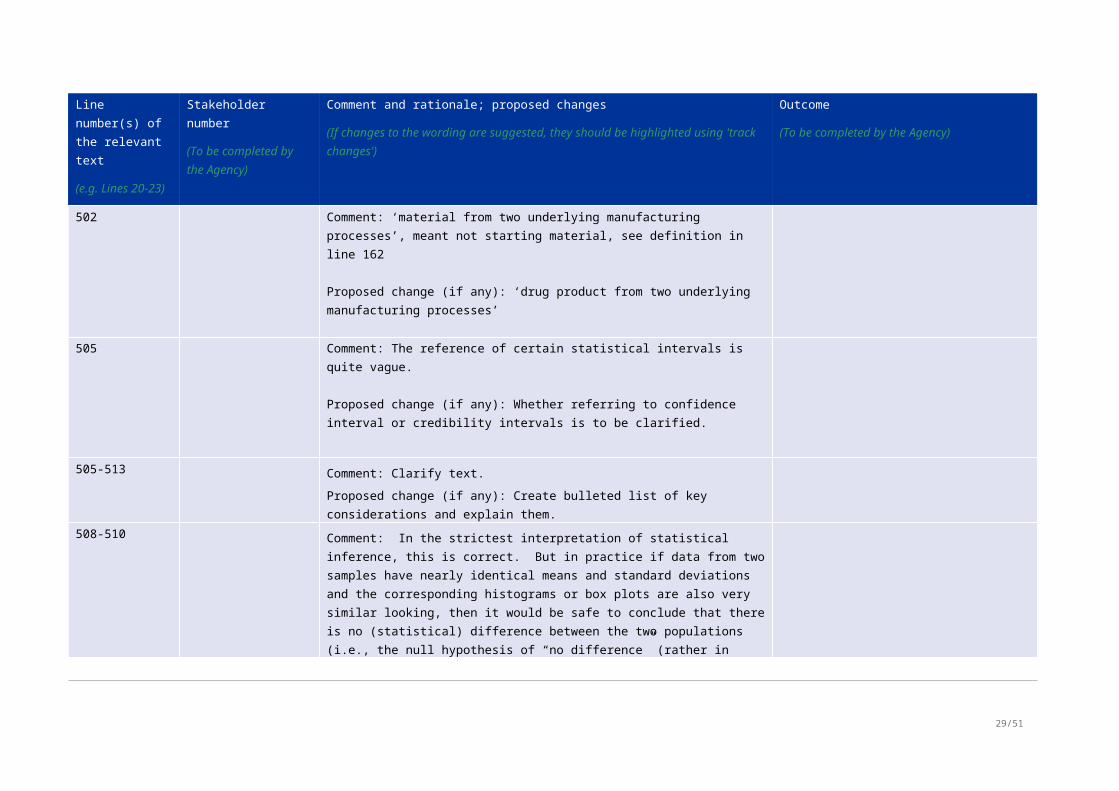
502 Comment: ‘material from two underlying manufacturing processes’, meant not starting material, see definition in line 162
Proposed change (if any): ‘drug product from two underlying manufacturing processes’
505 Comment: The reference of certain statistical intervals is quite vague.
25/45

Line number(s) of the relevant text
(e.g. Lines 20-23)
Stakeholder number
(To be completed by the Agency)
Comment and rationale; proposed changes
(If changes to the wording are suggested, they should be highlighted using 'track changes')
Outcome
(To be completed by the Agency)
Proposed change (if any): Whether referring to confidence interval or credibility intervals is to be clarified.
505-513 Comment: Clarify text.Proposed change (if any): Create bulleted list of key considerations and explain them.
508-510 Comment: In the strictest interpretation of statistical inference, this is correct. But in practice if data from two samples have nearly identical means and standard deviations and the corresponding histograms or box plots are also very similar looking, then it would be safe to conclude that there is no (statistical) difference between the two populations (i.e., the null hypothesis of “no difference” (rather in means or variances) is likely not going to be rejected).Proposed change (if any):
510-513 “In order to make full use of the inferential property of statistical intervals in the setting of comparative data analysis, it is essential that the objective of the comparison as well as the metric to characterise differences of underlying distributions is consciously chosen.” This is a very important point. If all the examples in the document use comparison of means of the distributions how does the document encourage conscious choice?
520-521 “In practice, comparability ranges are frequently established based on a statistical interval, e.g. the min-max range or a tolerance interval
26/45

Line number(s) of the relevant text
(e.g. Lines 20-23)
Stakeholder number
(To be completed by the Agency)
Comment and rationale; proposed changes
(If changes to the wording are suggested, they should be highlighted using 'track changes')
Outcome
(To be completed by the Agency)
calculated from characterisation data of the reference product.”It is not clear what was meant by a comparability range. Is this where one compares observed test product results against a range set based on the reference product. This is not the only way to use ranges when comparing test and reference.
524 Comment: Here, we want to point out, that the weaknesses of the Min/Max range is discussed, to which we agree upon, but on the other hand the EMA proposed us to show biosimilarity using this approach.
Proposed change (if any):
525-527 “In its fundamental property, a min-max range describes the observed data range in a sample (e.g. for a selected set of batches), and has no direct interpretation per se for the quantification of uncertainty concerning the location of the unknown data distribution(s).”In spite of what was said in Section 5.5, the authors seem to be assuming that the metric for comparison only relates to the central locations of the distributions. In fact what matters is to ensure that most if not all new material are within the range of the reference material. A patient doesn’t receive a mean material. The distribution of individual new batches or units compared to the range of reference material is at the heart of the question for biologicals.
525-537 “Of note, comparison of single batch data to a min-max range might be suitable in the context of batch-release (see Section 5.1.1).”Why do the authors think this?
27/45
Line number(s) of the relevant text
(e.g. Lines 20-23)
Stakeholder number
(To be completed by the Agency)
Comment and rationale; proposed changes
(If changes to the wording are suggested, they should be highlighted using 'track changes')
Outcome
(To be completed by the Agency)
529-533 Comment: It is also problematic when there are only a few reference batches available since then the min-max range is likely to be understated making it more likely that the test data will not fall within the range, even if there is truly no difference between the test and reference materials.Proposed change (if any):
538-559 The general remark about the Tolerance interval is valid, but the problem is not the Tolerance Interval but rather the way to use it for decision making. The overall idea is to ensure that i) limits for individual lots will be clinically justified or accepted, ii) that the patient’s risk is under control (few risk to receive a product out of clinically acceptable limits) and iii) that the producer risk is reasonable as well.So the best would be, as done for clinical trials, to ask the company to demonstrate the Operating Characteristics of their proposed methodology.Include a statement that Tests in 5.5.1 do not allow a simultaneous assessment of patient and producer risk. The Type I error rate “is the probability of declaring the drugs to be bioequivalent, when in fact they are not.” “This risk is sometimes referred to as patient risk.” [Burdick 2016]The Type II error rate “Risk 2: The probability that we do *not* conclude “The two products are equivalent” when the products are in fact equivalent is (1-power). Power is a function of the true difference in means and decreases as the true difference increases. This risk is sometimes referred to as producer’s (or sponsor’s) risk. “[Burdick 2016]
28/45
Line number(s) of the relevant text
(e.g. Lines 20-23)
Stakeholder number
(To be completed by the Agency)
Comment and rationale; proposed changes
(If changes to the wording are suggested, they should be highlighted using 'track changes')
Outcome
(To be completed by the Agency)
“Therefore, when assessing performance of tests, it is not enough to infer superiority of a test by having a low risk 2 probability, if risk 1 is not fixed. Or: “Comparison of power […] is only meaningful when Type 1 error rates are attained.” [Yang Burdick 2016].
Other than hypothesis based inferential statistics, these tests (TI & min-max based, line 538 ff) do not allow for a patient / producer risk comparison (see [Berger & Hsu 1996, Yang & Burdick 2016])
538-559, 573-576
Comment: this indictment of tolerance intervals or x-sigma intervals is severe especially when it seems prediction intervals are ok, or at least the criticism isn’t as severe. There is a point to your criticism in the context of making an inference of “no difference” if the data from the test materials fall within the interval, but the construction of such intervals is not meant as a mechanism for making such an inference. Instead, they are interpreted/used as descriptive measures much like they would be if they had been used to construct process control limits or specification limits. If the test and reference processes are similar, we would expect the test data to fall within the derived interval. For QAs that are deemed to be critical, this assessment would not be sufficient. For less critical QAs (i.e., those that would likely not have a major impact on safety or efficacy) this kind of assessment might be satisfactory.Proposed change: Perhaps a broader discussion about the concerns of intervals, in particular, how they are used for comparative assessments needs to be considered, again with clear considerations given in
29/45

Line number(s) of the relevant text
(e.g. Lines 20-23)
Stakeholder number
(To be completed by the Agency)
Comment and rationale; proposed changes
(If changes to the wording are suggested, they should be highlighted using 'track changes')
Outcome
(To be completed by the Agency)
bulleted lists or tables.529-559 Is this section assuming that the TI is calculated for the reference
distribution only and then individual observed samples values from the test distribution are compared against it? I think many of the criticisms of TIs in this section are based that assumption.The proposed alternative is to evaluate if the prediction interval on the new material if fully included within the tolerance interval computed based on the reference material.
540 Comment: The strengths and weaknesses of TI are discussed. Here, we recommend that in the introductory sentence a typical value for the proportion p (e.g. 99%) is used rather than the atypical 90%. The degree of confidence c (e.g. 95%) is reasonable, with an alpha being 5%. The coverage is more like 99% from people coming from the PI, or 99.73% coming from the k-sigma approach.
Proposed change (if any):use the proportion p (e.g. 99%) and confidence c (e.g. 95%) in the introductory sentence
538 + 554 Comment: We use the expression k-sigma (rather than x-sigma), when referring to an explicit value. …”is usually one of: 3, 4 or 6”. Please add 5; since it is widely used as well.
Proposed change (if any): Please add 5
30/45

Line number(s) of the relevant text
(e.g. Lines 20-23)
Stakeholder number
(To be completed by the Agency)
Comment and rationale; proposed changes
(If changes to the wording are suggested, they should be highlighted using 'track changes')
Outcome
(To be completed by the Agency)
545-547 Comment: Normality of a distribution can be checked with sufficient data available, does this statement imply where sufficient data is lacking?Proposed change (if any): Clarification is to be provided.
547-550 Comment: The text highlights the issue but does not provide specific guidance.Proposed change (if any): add “Probability and confidence levels should be set based on risks and included in a prior prepared sampling plan.”
558-559 “there are usually no options to overcome such fundamental methodological deficiencies by increasing the sample size for the computation of TIs.”We do not understand this. This suggest TI are inappropriate whatever the sample size which is counter intuitive given TI are in essence asymptotic intervals.It would be preferable to indicate that a minimum of reference batches should be used and that this minimum number being justified by means of operating characteristics
560 Unknown Correlation of originator samples lead to potential mis-estimation of variance and thus PI or CI: Elaborate on the level of correlation of the samples to address the relationship of the samples. (e.g. if different DS batches source one DP batch, or multiple DP batches are sourced from one DS batch) .The underlying relationships of the sample in the reference product are
31/45

Line number(s) of the relevant text
(e.g. Lines 20-23)
Stakeholder number
(To be completed by the Agency)
Comment and rationale; proposed changes
(If changes to the wording are suggested, they should be highlighted using 'track changes')
Outcome
(To be completed by the Agency)
not known to the applicant, potentially leading to misestimating of variance and thus intervals (see sections on PI and CI in 5.5.2, line 560).
574-576 “PIs can be derived for a single future observation, for a set of k future observations, but also for a parameter characterising the underlying distribution of future observations, e.g. for the mean of future observations.” We don’t think is correct. Prediction Intervals apply to random variables; Confidence Intervals apply to parameters. In the Bayesian framework, it is natural to compute the predictive distribution of future means that could be obtained for a specific design and sample size, given it’s a function of the predictive distribution of individual values. But there is not such thing as a predictive distribution for a parameter. There is however the posterior distribution of the parameter. In addition, what would be the value of having the predictive distribution of future means to be computed in the decision-making process?
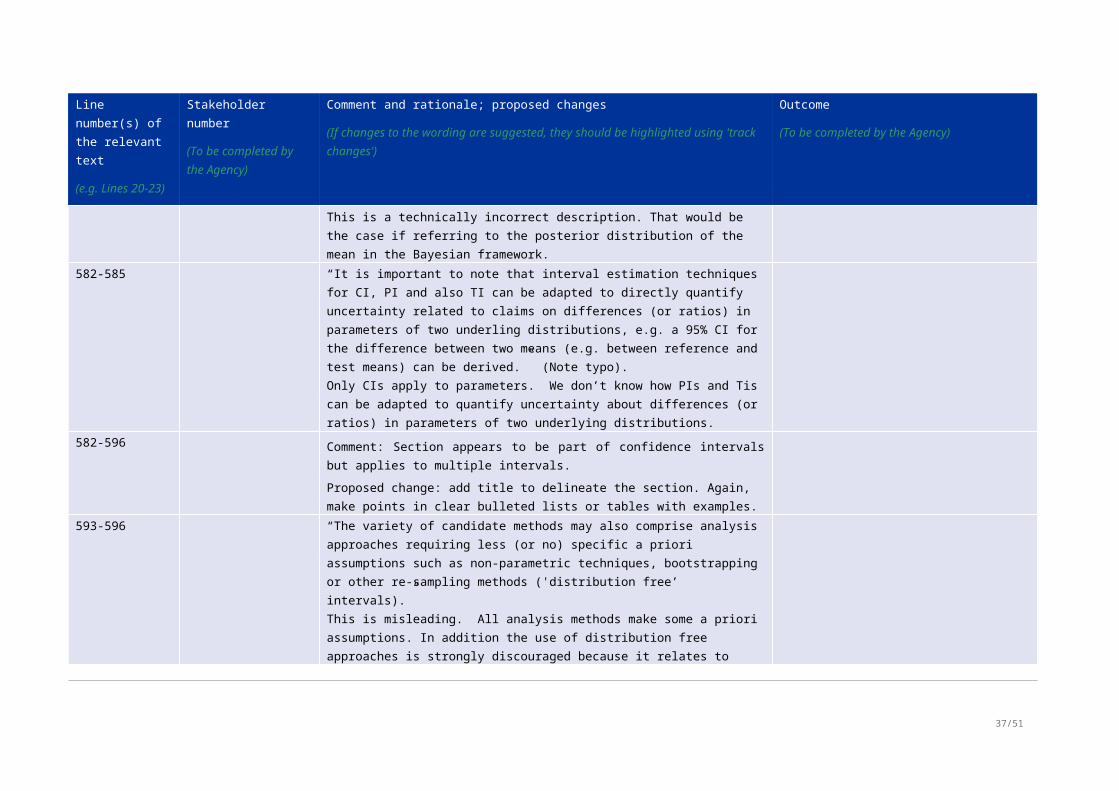
580-581 “CIs usually describe a data range which is assumed to cover a parameter (e.g. the mean) of the unknown distribution with a given probability.”This is a technically incorrect description. That would be the case if referring to the posterior distribution of the mean in the Bayesian framework.
582-585 “It is important to note that interval estimation techniques for CI, PI and also TI can be adapted to directly quantify uncertainty related to claims on differences (or ratios) in parameters of two underling distributions, e.g. a 95% CI for the difference between two means (e.g. between reference and test means) can be derived.” (Note typo).Only CIs apply to parameters. We don’t know how PIs and Tis can be
32/45

Line number(s) of the relevant text
(e.g. Lines 20-23)
Stakeholder number
(To be completed by the Agency)
Comment and rationale; proposed changes
(If changes to the wording are suggested, they should be highlighted using 'track changes')
Outcome
(To be completed by the Agency)
adapted to quantify uncertainty about differences (or ratios) in parameters of two underlying distributions.
582-596 Comment: Section appears to be part of confidence intervals but applies to multiple intervals.Proposed change: add title to delineate the section. Again, make points in clear bulleted lists or tables with examples.
593-596 “The variety of candidate methods may also comprise analysis approaches requiring less (or no) specific a priori assumptions such as non-parametric techniques, bootstrapping or other re-sampling methods ('distribution free’ intervals).”This is misleading. All analysis methods make some a priori assumptions. In addition the use of distribution free approaches is strongly discouraged because it relates to product that the patient will take, as opposed to comparing end-points in a clinical trials whose distribution is doubtful. We don’t see how distribution-free methods could provide guarantee to the patient about the quality of the product.
597-625 Comment: there are settings in which, for a particular QA, an acceptance criterion exists (e.g., in the EP), which could be utilized to help define the equivalence criterion. USP <1010> describes such an approach in the context of comparing assays but it can be adapted to other situations. In this setting, if the null hypothesis is rejected, the difference between the test and reference processes is deemed not so great so as to significantly increase the chance that the test process would produce OOS batches.
599-607 “Any inferential statistical comparison of QAs would require an a priori
33/45

Line number(s) of the relevant text
(e.g. Lines 20-23)
Stakeholder number
(To be completed by the Agency)
Comment and rationale; proposed changes
(If changes to the wording are suggested, they should be highlighted using 'track changes')
Outcome
(To be completed by the Agency)
definition of an acceptance range or a correspondingly defined acceptance criterion. The definition of an acceptance range is usually not resulting from the analysis of actual sample data (cf. to the TI example in Section 5.5). It is rather the result of separate considerations related to maximum allowed difference between the two (unknown) underlying data distributions for a specific QA of interest, which would still be compliant with a statement that the material from the two processes can be considered similar/equivalent/non-inferior. For a specific comparison task involving QAs, acceptance limits/ regions would need to be understood as an a priori fixed design element, and should hence conceptually be differentiated from statistical intervals derived from actual sample data.”These lines seem to contradict what the authors have written in Section 5.5
621-624 Comment: It is highly beneficial for both the industry and regulators to develop some agreeable statistical standards for product quality comparison purpose.
Proposed change (if any): Proposal for some agreeable statistical standards for product quality comparison purpose is to be provided.
622 Comment: the development of agreeable standards for scale-dependent methods (e.g. based on absolute difference of mean values) will be difficult/impossible. The development of agreeable standards for scale-independent methods (e.g. based on difference of mean values related
34/45

Line number(s) of the relevant text
(e.g. Lines 20-23)
Stakeholder number
(To be completed by the Agency)
Comment and rationale; proposed changes
(If changes to the wording are suggested, they should be highlighted using 'track changes')
Outcome
(To be completed by the Agency)
to the standard deviation) seems more promising (example: T²-test for equivalence for the comparison of dissolution profiles).
Proposed change (if any): add: ‘development of agreeable standards, which need to be independent of the measurement units, (i.e. …’
626-644 Comment: this is an important point but would be difficult to implement in practice since both the industry and the regulatory agencies tend to think on a per-QA basis. There is literature on this topic (mostly in the social sciences) that could be consulted.
637-639 Comment: Does the requirement of an a priori “success criterion” imply that some number of individual QA comparison failures is expected, given that Type-II error is not zero? This section could be interpreted differently – that all QA comparisons should be individually “successful,” though I don’t believe that was the intent here.
Proposed change (if any): The requirement of an a priori “success criterion” and its implications are to be specified.
637-640 “For the case that adequate statistical frameworks can be identified and applied for the comparison of more than 1 QA of interest, an a priori specified concept ('success criterion') seems necessary to describe the minimum requirement for a claim of similarity. Such a concept would need to be put in an analysis plan which is prepared prior to sampling and conduct of the comparison analyses.” Shouldn’t this be required regardless of the number of QAs and the method of analysis? There always will be more than 1 QA involved in such comparison.
35/45

Line number(s) of the relevant text
(e.g. Lines 20-23)
Stakeholder number
(To be completed by the Agency)
Comment and rationale; proposed changes
(If changes to the wording are suggested, they should be highlighted using 'track changes')
Outcome
(To be completed by the Agency)
645-647 Comment: It seems like a statement is being made about multiplicity here.Proposed change: If that is the intent make it clear and state it explicitly instead of implying.
645-648 Comment: It is not specified what would be considered an acceptable alpha value.Proposed change (if any): The guidance should include what would be considered an acceptable alpha value, in statistics an alpha value of 5% is considered acceptable risk.
645-651 “The overall risk of a false positive conclusion on equivalence (or non-inferiority) following an inferential statistical evaluation will strongly depend on the type-1-error specifications (alpha, significance level) in each separate QA data analysis. Only little guidance can be given regarding the choice of nominal alpha for the comparison of QAs' data. Generally, a priori considerations concerning the risk of a false positive conclusion on equivalence (or non-inferiority) on the quality level would become more important, the more this comparison is expected to carry pivotal evidence in the whole comparison task within a specific drug development. Some case-specific comments are provided in Section 6.”We think this potentially over focusses on Type I error. The reality is that the decision process has to balance risk of false positive, false negative and amount of resource required to generate the data.This highlight the need to get away from “equivalence testing” concept for this purpose but rather to focus on the predictive probability that a
36/45
Line number(s) of the relevant text
(e.g. Lines 20-23)
Stakeholder number
(To be completed by the Agency)
Comment and rationale; proposed changes
(If changes to the wording are suggested, they should be highlighted using 'track changes')
Outcome
(To be completed by the Agency)
patient may get units that could be out of the range that has been observed and approved for the reference material (consumer risk). Another proposal is to apply the quality rules and concept such as AQL and LTPD and to minimize both consumer risk and producer risks.
645-651 Comment: Alpha level is an important point.
Proposed change (if any): Multiplicity issues should be discussed as well as the range of alpha level values that are acceptable or alternatively unacceptable.
652-654 “In this context, power considerations might eventually also become relevant from a planning perspective, as sample size constraints (e.g. low batch numbers) and associated low power may lead to refrain from inferential statistical comparison.” So what are the authors suggesting take the place of a statistical comparison and in what way does it solve the problem of a high risk of making a bad decision?Another reading is that the authors suggest that combining observed data with prior knowledge might be more appropriate for decision making because the classical frequentist inference approach is likely to be underpowered. This clearly and strongly advocate to use Bayesian methods with informative priors. There are defendable prior with the reference material and inference either on parameters or units.
652-654 Comment: This may be beyond the intended scope of this reflection paper. However, it would be helpful to include a discussion on how to improve the power. If it can be shown from a statistical perspective that generating a larger sample size (e.g. additional batches) would improve
37/45

Line number(s) of the relevant text
(e.g. Lines 20-23)
Stakeholder number
(To be completed by the Agency)
Comment and rationale; proposed changes
(If changes to the wording are suggested, they should be highlighted using 'track changes')
Outcome
(To be completed by the Agency)
the reliability of the comparison, then manufacturing additional batches could be justified.
It is recognized that a sample size of 3 is limiting from an inferential statistical comparison perspective, but how much better is 4 batches or 5? At what point is there diminishing gains in statistical power? Is worth running 10 or 20 batches?
From a statistical perspective, how much better is a decision (on similarity) that is based on a sample size of 4 or 5 (or some other sample size) than a decision based on a sample size of 3? From a practical perspective, at what point do you get the most value from expanding the sample size?
Proposed change (if any): Suggest adding a discussion on how to improve the power.
652-654742-757
Comment: For life cycle manufacturing changes, the sample size constraints is always a reality. Prior to regulatory approvals, if large numbers of post-change batches are required simply for the purpose of a thorough statistical assessment, a sponsor would have to bear significant business risks.
Proposed change (if any): Suggest to develop a well-defined statistical approach for comparative
assessment of pre- and post-change QAs, which would be helpful for both regulators and industry
have the flexibility to use the data that is available, even if it is
38/45

Line number(s) of the relevant text
(e.g. Lines 20-23)
Stakeholder number
(To be completed by the Agency)
Comment and rationale; proposed changes
(If changes to the wording are suggested, they should be highlighted using 'track changes')
Outcome
(To be completed by the Agency)
limited.
668-670 “One of the options could be the comparison of means. However, in some other situations the comparative evaluation of the variability (e.g. variance) might need to be targeted.”We don’t find sentences of this type particularly helpful in guidance document. Since words like could and might are used the authors are effectively not offering any advice.This reflect the confusion about the parameters to be used and the lack of clear objective. The objective is to ensure the patient will not get units outside what has been proven as acceptable with the reference material. To obtain this predictive probability, then all parameters and their uncertainty matters.
670 Comment: “…in some other situations…” Example(s) of other situations would be helpfulProposed change: Provide example(s).
679-681 Comment: Observations may be taken on individual dosage forms or composites but if you are comparing test to reference or pre-change to post-change then the basic experimental unit must be the batch.Proposed change: consider comparing and contrasting the unit of observation vs. the experimental unit
682-684 “As representativeness of samples analysed is the key pre-requisite for a meaningful interpretation of results in inferential statistical methodology, efforts should be taken to adequately describe the chosen
39/45

Line number(s) of the relevant text
(e.g. Lines 20-23)
Stakeholder number
(To be completed by the Agency)
Comment and rationale; proposed changes
(If changes to the wording are suggested, they should be highlighted using 'track changes')
Outcome
(To be completed by the Agency)
sampling strategy.”This statement is true. It also seems to imply (by omission) that representativeness is not a key pre-requisite if you don’t use any inferential statistical methodology.
698 Proposed change: include ratio of variances as an example.698 Comment: add more example: standardized difference in means
Proposed change (if any): ‘difference in means, standardized difference in means, the ratio of means’
700 Comment: closing bracket is missing
Proposed change (if any): ‘such as the f2-function suggested for dissolution comparisons (…..)) or the Mahalanobis distance, which is also applicable for the comparison of dissolution profiles applying the T²-test for equivalence´. ´.
703-706 “One guiding principle for setting up the comparison plan is the simple rule that with an increasing amount of information available for the comparison (e.g. number of batches), the quality of the resulting decision should improve.”We like this statement a lot. Would non-statistical decision making approaches live up to this principle? We suspect not.
40/45

Line number(s) of the relevant text
(e.g. Lines 20-23)
Stakeholder number
(To be completed by the Agency)
Comment and rationale; proposed changes
(If changes to the wording are suggested, they should be highlighted using 'track changes')
Outcome
(To be completed by the Agency)
But we don’t see the added value of this comment and how it helps.716-719 Comment: What is meant by “data analysis”? For example, if data are
available on the reference product then that data could be used to define an equivalence margin using some approved approach (e.g., USP <1010>). The equivalence margin is defined against a fixed criterion chosen a priori (specification limits in the case of <1010>). There is no conflict, then, if that same reference data, along with the test data, are then used to construct a 90% confidence interval for the true mean difference for comparing to the equivalence interval.
723-725 “For example, if the ratio of means was chosen to investigate equivalence, a corresponding acceptance range should set (usually symmetrical) limits above and below the value 1.”Shouldn’t the acceptance limits be asymmetrical for ratios?In addition, the way to make the comparisons (ratio, difference, ….) should be linked to the very objective of comparison and this is not defined and proposed in this document.
726-731 Comment: False positives are critical and this requires more discussion. Based on inferential statistical methodology and by leaving the options open to the industry, there could be statistical plans designed that could force a desired outcome. This follows the discussion on retrospective data and “picking” the data that should be used for an analysis.
Proposed change (if any): Clarification is to be provided. More boundaries around the requirements for the statistical plan are to be included in the paper.
41/45

Line number(s) of the relevant text
(e.g. Lines 20-23)
Stakeholder number
(To be completed by the Agency)
Comment and rationale; proposed changes
(If changes to the wording are suggested, they should be highlighted using 'track changes')
Outcome
(To be completed by the Agency)
728-730 Comment: The text does not specify the level of type I error which is acceptable by Regulators.
Proposed change (if any): Text should at least specify the highest alpha level that cannot be overcome.
728-731 “From a regulatory perspective, it appears difficult to recommend a range for 'acceptable' type-1-error specifications, as the different settings described in Section 4 differ with regard to potential negative consequences of false positive conclusions on similarity.”We see this as a bit of a fudge. In the absence of guidance won’t the default of 0.05 be chosen?
737-739 Comment: The one sided/two-sided discussion is linked to the overall alpha level. Regardless the selected method (one sided/two-sided), the acceptable overall alpha level threshold is not specified.
Proposed change (if any): Text should specify the overall alpha level threshold that cannot be overcome.
747 Comment: Consecutive batches have a correlative issue tied to lack of representativeness.Proposed change: explain the correlative issue (see comments on 466-470 above; if addressed there, perhaps less need to address here)
42/45

Line number(s) of the relevant text
(e.g. Lines 20-23)
Stakeholder number
(To be completed by the Agency)
Comment and rationale; proposed changes
(If changes to the wording are suggested, they should be highlighted using 'track changes')
Outcome
(To be completed by the Agency)
764-766 Comment: Release specifications may not have been set via statistical methods. Some are based on industry guidelines, regulation or clinical requirements. “A clear description of the methods to derive those specifications” may not be possible aside from citing industry guidelines, regulations or a regulatory submission.
Proposed change (if any): Change “methods to derive” to “methods or rationale to establish”.
776-781 Comment: These two sentences are in conflict with the EMA biosimilar quality guideline because it claims that a biosimilar candidate in general cannot be considered as similar when its variability is smaller than the variability of the reference medicine. Actually it is highly ensuring if the biosimilar has a smaller variability than the reference product.
Proposed change: delete sentences from line 776-781
813-816 Comment: This could also apply to the situation where the test product comes in two or more forms (e.g., vials and syringes) or strengths. The “within-process” comparative assessment may not need to be as rigorous as the test vs reference assessment.
872-887 Comment: The discussion about f2 implies that this is not acceptable, yet there is no option or other example provided. This is an industry standard and if inferential statistics are to be considered as an alternative, then more guidance is required. Otherwise, there is the
43/45

Line number(s) of the relevant text
(e.g. Lines 20-23)
Stakeholder number
(To be completed by the Agency)
Comment and rationale; proposed changes
(If changes to the wording are suggested, they should be highlighted using 'track changes')
Outcome
(To be completed by the Agency)
possibility that no method will be used to compare dissolution other than means.
Proposed change (if any): Clarification is to be provided.866 Comment: clarify, instead of ‘deriving’
Proposed change (if any): ‘computing the estimated distance measure’
869 Comment: add Mahalanobis distance (T²-test for equivalence) as concrete alternative to f2-function. Remark: T²-test for equivalence is a really promising alternative to the f2-based methods, whereas so-called model-dependent approaches (fitting non-linear functions) are often not reasonably applicableBayesian approaches are also suiatbel for comparing dissolution profiles.Proposed change (if any): ‘other model-independent ‘distance metrics’ such as the Mahalanobis distance (T²-test for equivalence), Bayesian methods, as well as the …..’
887 Comment: mention the T²-test for equivalence as an example in which the +/- 10% requirement is already implemented
Proposed change (if any): add sentence: ‘One example where the +/- 10% requirement is implemented is the T²-test for equivalence’.
44/45

Line number(s) of the relevant text
(e.g. Lines 20-23)
Stakeholder number
(To be completed by the Agency)
Comment and rationale; proposed changes
(If changes to the wording are suggested, they should be highlighted using 'track changes')
Outcome
(To be completed by the Agency)
Give reference to the publication: ‘Highly variable dissolution profiles: Comparison of the T²-test for equivalence and f2-based methods’. PharmInd 78:4, 587-592. 2016
898-899 “Whenever a descriptive statistical comparison approach is mentioned as the only option for the analysis of available data, it should be clear to analysists and assessors that a sole samples’ description does usually not allow for further more general similarity claims concerning the entirety of the material produced by the (two) underlying manufacturing processes.”This is another fudge. If the underlying purpose is to make decisions as to whether two “products” are comparable based on some observed data, you are carrying out an inferential procedure even if you look at the summary descriptive statistics for the comparison.
946 Comment: # statement is unclearProposed change (if any): Provide more detail & specifics about what is meant by “reconsider the whole inferential statistical approach”
Please add more rows if needed.
45/45