© Rebecca Batalden, 2011 - conservancy.umn.edu · Rebecca Victoria Batalden IN PARTIAL FULFILLMENT...
119
Potential impacts of climate change on monarch butterflies, Danaus plexippus A DISSERTATION SUBMITTED TO THE FACULTY OF THE GRADUATE SCHOOL OF THE UNIVERSITY OF MINNESOTA BY Rebecca Victoria Batalden IN PARTIAL FULFILLMENT OF THE REQUIREMENTS FOR THE DEGREE OF DOCTOR OF PHILOSOPHY Dr. Karen S. Oberhauser, Advisor August 2011
-
Upload
hoangduong -
Category
Documents
-
view
217 -
download
0
Transcript of © Rebecca Batalden, 2011 - conservancy.umn.edu · Rebecca Victoria Batalden IN PARTIAL FULFILLMENT...

Potential impacts of climate change on monarch butterflies, Danaus plexippus
A DISSERTATION
SUBMITTED TO THE FACULTY OF THE GRADUATE SCHOOL
OF THE UNIVERSITY OF MINNESOTA
BY
Rebecca Victoria Batalden
IN PARTIAL FULFILLMENT OF THE REQUIREMENTS
FOR THE DEGREE OF
DOCTOR OF PHILOSOPHY
Dr. Karen S. Oberhauser, Advisor
August 2011

© Rebecca Batalden, 2011

i
ACKNOWLEDGEMENTS
I am incredibly grateful for the guidance, support and encouragement that my
advisor, Karen Oberhauser, has given me. Her constant backing—both financial and
intellectual—has far surpassed anything I could have expected. Thank you. I am also
grateful to my initial committee, Don Alstad, George Heimpel and Joe McFadden for
their help shaping the direction of my research, and to my new committee member, Ken
Kozak, for helping me finish my graduate degree.
Thank you to A. Townsend Peterson for the crash course in ecological niche
modeling. Thank you to all the MLMP volunteers throughout Texas who hosted my field
study. They were generous with their time, knowledge, milkweed and caterpillars. In
particular, Mary Kennedy lent me the use of her front porch to rear larvae and her yard
for large mating cages and insisted I stay in her spare room. Jolene Lushine and Sarah
Kempke provided assistance with the Texas field studies and many laughs along the road.
I am so thankful to everyone who makes up the Monarch Lab. You made my
graduate career so much fun that I didn’t want it to end! Thank you especially to Grant
Bowers. I never imagined I would laugh so hard while doing lab work. Thank you to all
the undergraduate and high school students that have passed through the lab.
My husband, Karl, provided unwavering support and love and made a terrific
weekend research assistant. My parents, Kirby and Jeanna Smith, always knew of my
limitless abilities and instilled in me the idea that I could do anything I wanted when I
grew up. And, finally, thank you to my daughter, Madeline, for providing that final push I
needed to finish.

ii
ABSTRACT
Monarch butterflies are believed to be vulnerable to the effects of climate change.
Ecological niche models predict current over-wintering sites in Mexico will be unsuitable
for monarchs in 40 to 50 years. Climate is likely to be equally or more important during
the summer. Here, I seek to predict the consequences of climate change for monarchs
during the summer breeding season and fall migration and determine their ability to cope
with these changes.
Using ecological niche modeling, I predicted a marked northward range shift
throughout the summer breeding season, necessitating movement before each summer
generation and a longer, faster migration. It is unclear whether monarchs can track
geographic changes to their ecological niche, and if not, they stand to loose up to half
their available breeding habitat.
If monarchs can withstand temperatures hotter than their current ecological niche,
their range shifts may not be as drastic. I assessed the lethal and sub-lethal impacts of
exposure to temperatures above their predicted ecological niche. Daytime temperatures of
38 and 40oC caused a slight increase in mortality, as well as difficulty pupating, smaller
adult size and a longer development time. Daytime temperatures of 42oC caused
substantially more mortality and no larvae survived exposure to 44oC. These results
suggest that the ecological niche models are accurate and monarchs could lose a
substantial amount of available breeding habitat.
To assess the monarch butterfly’s potential to cope with a changing climate and
adjust its migration, I aimed to identify any level of plasticity currently present in the

iii
migration. An introduced species of milkweed, Asclepias curassavica, present in Texas,
may be changing the monarchs’ breeding habits during its fall migration. Data from the
Monarch Larva Monitoring Project and field studies I conducted indicate that female
monarchs prefer the introduced milkweed to native milkweed particularly during the fall
migration. If monarchs are already changing their migration in response to this
environmental change, there may be the variability in monarch migratory and
reproductive behavior that could allow this species to adjust to future climate change.

iv
TABLE OF CONTENTS
Acknowledgements………………………………………………………………… i
Abstract…………………………………………………………………………….. ii
Table of Contents………………………………………………………………....... iv
List of Tables…………………………………………………………………...….. vi
List of Figures……………………………………………………………………… viii
Introduction………………………………………………………………………… 1
Chapter 1: Ecological Niches in Sequential Generations of Eastern North American
Monarch Butterflies (Lepidoptera: Danaidae): The Ecology of Migration
and Likely Climate Implications……………………..…………….….... 7
Summary..………………………………………………………………. 7
Introduction…………………………………………………………...... 7
Methods……………………………………………………………….... 9
Results………………………………………………………………….. 14
Discussion……………………………………………………………… 16
References……………………………………………………………… 19
Chapter 2: Lethal and sublethal effects of heat stress on monarch butterfly larvae.. 31
Summary………..………………………………………………………. 31
Introduction…………………………………………………………...… 31
Methods……………………………………………………………….… 34
Results…………………………………………………………………... 37
Discussion…………………………………………………………….... 42

v
References……………………………………………………………… 46
Chapter 3: Potential Changes to the Eastern North American Monarch Butterfly
Migration in Response to an Introduced Milkweed, Asclepias
curassavica……………………………………………………………. 69
Summary..……………………………………………………................ 69
Introduction…………………………………………………………….. 70
Methods…………………………………...…………………………… 73
Results………………………………………………………………….. 77
Discussion……………………………………………………………… 82
References……………………………………………………………… 87
Comprensive Bibliography……..………………………………………………… 101

vi
LIST OF TABLES
Table Page
1.1 Monarch Larval Monitoring Program data records in which one or more
monarch eggs were observed, and on which ecological niche models were
based.............................................................................................................. 23
1.2 Summary of interpredictivity tests among month-specific ecological
characteristics and geographic distributions of monarch butterflies……….. 24
2.1 Model results for the analysis of survival probability by treatment
temperature, timing and duration…………………………………………… 49
2.2 Model results for the analysis of probability of falling by treatment timing
and duration…………………………………………………………………. 50
2.3 Male and female adult mass and right wing length by treatment temperature 51
2.4 Model results for the analysis of development time by treatment
temperature, timing and duration……………………………………………. 52
2.5 Development time (days) for each stadium by each factorial combination
of treatment temperature, timing and duration………………………………. 53
2.6 Model results for the analysis of survival by treatment duration,
temperature and timing………………………………………………………. 55
2.7 Model results for the analysis of development time (degree days) by
treatment timing and duration………………………………………………... 56
2.8 Model results for the analysis of development time (degree days) by
treatment timing and duration………………………………………………... 57
2.9 Model results for the analysis of development time (degree days) by
treatment timing and duration………………………………………………... 58
3.1 Management practices at Texas MLMP sites with and without A.
curassavica…………………………………………………………………... 90
3.2 Model results for the analysis of normalized milkweed counts for
Texas sites with and without A. curassavica from 2001-2009……………..... 91
3.3 Model results for the analysis of the number of eggs per milkweed plant

vii
at MLMP sites in Texas…………………………………………………….... 92
3.4 Summary of milkweed quality from field study……………………………... 93

viii
LIST OF FIGURES
Figure Page
1.1 Example of predictivity among monthly ecological and geographic
distributions of monarch butterflies…………………...……………………... 25
1.2 Temperature and precipitation combinations across North America………… 27
1.3 Changed climate (2055) projections for monthly monarch butterfly
potential distributions……………………………………….………………... 28
1.4 Summary of area estimates for present and future monthly distributional
areas for monarch butterflies…………………………………….…………... 30
2.1 Probability of survival by treatment timing and duration for 38oC (1a),
40oC (1b) and 42
oC (1c)…………………………………………….………... 59
2.2 Probability pupa fell (and needed to be taped to container lid) by
treatment timing and duration………………………………………………... 61
2.3 Development time, measured in degree days, by treatment timing and
duration at 38oC (a) and 40
oC (b)…………………………..………………... 62
2.4 Probability of survival by duration (a) and by temperature and timing (b)….. 66
2.5 Development time (degree days) by treatment timing and duration at
nighttime temperatures of 30oC (a), 32
oC (b) and 34
oC (c)………………….. 67
3.1 Mean eggs density by week at MLMP sites in Minnesota, Wisconsin,
Iowa, Missouri, Illinois, Nebraska and Texas for all years combined,
1997-2009…………………………………………………………………..... 94
3.2 Normalized milkweed abundance by month at MLMP sites in Minnesota,
Wisconsin, Iowa, Missouri, Illinois, Nebraska and
Texas……………………………………………………………..…………... 95
3.3 Week of peak egg abundance after the first spring peak……………...……... 96
3.4 Normalized milkweed abundance in Texas……………………………...…... 97
3.5 Mean proportion of eggs per milkweed plant in Texas MLMP sites with
and without A. curassavica throughout the year……………………………... 98

2
3.6 Mean number of eggs per milkweed ramet across all sites surveyed and
mean number of eggs per milkweed ramet only at surveyed sites that
contained both native and A. curassavica milkweeds.……………………..... 99
3.7 Probability of mating by species of milkweed in the cage………………..... 100

1
INTRODUCTION
Several aspects of insect biology make it likely that their distributions will be
affected by global climate change. As poikilotherms, their physiology is directly affected
by external climatic conditions. Also, many insects are closely tied to host plants and will
thus be affected by vegetation shifts that accompany a changing climate (IPCC 1996,
Crowley 2000, Peñuelas 2002).
Holt (1990) describes three general expectations for species’ responses to climate
change: movement, adaptation, or extirpation. For the bulk of sedentary wild species,
ranges may take decades or centuries to shift noticeably. However, butterflies,
particularly highly mobile or migratory species, may be able to track their ecological
niche as the climate changes (Parmesan et al. 1999, Parmesan and Yohe 2003). Non-
migratory European butterflies exhibit evidence of a northward range expansion over the
last century (Parmesan et al. 1999). In the United States, the northern boundary of
Atalopedes campestris is now in Washington State, 420 miles north of where it was in
California 35 years ago (Crozier 2004). These, and range shifts documented in other taxa,
are best explained by anthropogenic climate change (Parmesan and Yohe 2003). Despite
the presence of suitable habitat at lower elevations, Edith’s checkerspot butterfly (E.
editha) populations shifted towards higher elevation in concert with changes in winter
snow levels (Parmesan 1996, 2003).
In addition to shifts in species’ distributions, climate change has already caused
changes to phenology. The date of first spring appearance is earlier for 26 of 35 species
of butterflies examined in the United Kingdom (Roy and Sparks 2000). In California,

2
seventy percent of 23 butterflies species advanced the timing of their first flight, with
warmer, drier winters driving the change (Forister and Shapiro 2003).
Monarch butterflies (Danaus plexippus) are ideal organisms for studying the
effects of climate change. These well-known insect migrants are climatically sensitive;
their migration and diapause are triggered by changes in temperatures, light levels, and
host plant quality associated with changing seasons (Goehring and Oberhauser 2002).
Monarchs tolerate some anthropogenic disturbance, because many of their host plants
(plants in the genus Asclepias (milkweed)) thrive in disturbed areas, such as along
roadsides, in ditches, and in agricultural fields (Oberhauser et al. 2001). This is
particularly true of A. syriaca, the most commonly utilized host plant. Also, the
distribution of monarchs is well known, thanks to a wealth of spatial and temporal data
that have been collected by citizen monitors and other observers.
Monarch butterflies cannot survive temperate winters, thus the eastern NA
population migrates each fall from wide-ranging summer breeding grounds in north-
central and north-eastern US and southern Canada to high-altitude forests of Central
Mexico (Brower 1995). The same butterflies fly from Mexico in the spring to the
southern US where they begin to breed. Their offspring continue northward, perhaps in
response to encroaching summer heat and a decrease in milkweed availability. Once in
their primary breeding range, there are two or three stationary generations before the fall
migration. Monarch populations in other areas exhibit a variety of migratory behaviors;
those in Central and South America, the West Indies, and Hawaii do not migrate, while
those in western NA and Australia migrate considerably shorter distances than the eastern

3
NA population (Ackery & Vane-Wright 1984, James 1993, Brower 1995, Altizer and
Oberhauser 2000).
Physiological differences exist between and within monarch populations. In the
eastern NA population, summer generations of butterflies fly singly, disperse randomly,
and reproduce soon after emerging as adults. In contrast, fall migrants are in a state of
reproductive diapause, do not search for mates, and possess fat stores to be used during
the six-month wintering period (Kammer 1971). Monarchs in Australia, and perhaps
California, with a truncated migration, do not go into diapause; rather, they have a
shortened period of reproductive dormancy called oligopause (James 1982). Non-
migrating populations do not exhibit diapause behavior.
Monarch butterflies are already believed to be vulnerable to the effects of climate
change. Oberhauser and Peterson (2003) modeled the effects of projected global climate
change on the over-wintering habitats of the eastern NA monarch population. According
to their ecological niche models, current over-wintering sites in Mexico will be
unsuitable for monarchs in 40 to 50 years. Already, a January 2002 winter storm marked
by extreme cold and precipitation caused the most severe winter kill of monarchs known,
with 70-80% mortality in two major over-wintering colonies (Brower et al. 2004), and a
storm of similar magnitude and effect occurred in 2004. The frequency of such storms is
predicted to increase with climate change (Oberhauser and Peterson 2003).
Climate is likely to be equally or more important during the summer breeding
season. Extensive rain or prolonged cool and cloudy conditions can reduce egg laying
and increase development time, while prolonged hot or dry spells can reduce adult
lifespan and fecundity. Zalucki and Rochester (2004) predicted large fluctuations in

4
monarch abundance in the eastern NA population due to the effects of climate on their
phenology and fecundity. Climate can also influence milkweed abundance and quality
(Zalucki and Rochester 2004). Milkweed quality deteriorates under high temperatures,
making it less attractive to egg-laying females and larvae (Zalucki and Kitching 1982).
Additional research is needed to further elucidate the consequences of climate
change for monarch butterflies during their migration and the summer breeding months.
Here, I assessed the potential impact of climate change to the geographic location and
abundance of monarch habitat. Using ecological niche modeling, I identified the current
niche characteristics of breeding monarchs and projected these models onto future
climate patterns, predicting necessary range shifts and possible habitat losses (Chapter 1).
As ecological niche models are based on occurrence data, I also conducted laboratory
experiments to identify lethal and sub-lethal effects of exposures to temperatures warmer
than the monarchs’ current niche (Chapter 2). If monarchs can withstand temperatures
outside of their predicted niche, habitat losses and range shifts predicted by niche models
may not be as severe. If monarchs are to cope with the predicted changes, some level of
plasticity needs to be present in their movement patterns. There is evidence that monarchs
are laying eggs in Texas as they migrate through on route to Mexico. Through field
surveys and experiments, I investigate the possible causes of fall breeding, specifically
the impact of an introduced species of milkweed (Chapter 3). As the fall breeding
monarchs are by definition not in diapause, as they are thought to be during the
migration, this may represent variation in the population that could allow the eastern NA
population to cope with habitat changes brought on by climate change. All together, this
work aims to estimate the potential impacts of climate change on the eastern NA monarch

5
population and the level of plasticity in their migration and breeding that could allow
them to cope with predicted changes.
REFERENCES
Ackery, P. R. and R. I. Vane-Wright. 1984. Milkweed butterflies: Their cladistics and
biology. Ithaca: Cornell University Press, Comstock Publishing Associates.
Altizer, S. M. and K. S. Oberhauser. 2000. Associations between host migration and the
prevalence of a protozoan parasite in natural populations of adult monarch
butterflies. Ecol. Entomol. 25: 125-39.
Brower, L. P. 1995. Understanding and misunderstanding the migration of the monarch
butterfly (Nymphalidae) in North America: 1857-1995. J. Lepid. Soc. 49:304-85.
Brower, L. P., D. R. Kust, E. Rendon-Salinas, E. G. Serrano, K. R. Kust, J. Miller, C.
Fernandez del Ray, and K. Pape. Catastrophic Winter Storm Mortality of
Monarch Butterflies in Mexico in January 2002. in Oberhauser, K. S. and M. J.
Solensky. 2004. Monarch Butterfly Biology and Conservation. Cornell University
Press.
Crowley, T. J. 2000. Causes of climate change over the past 1000 years. Science 289:
270-277.
Crozier, L. G. 2004. Field transplants reveal summer constraints on a butterfly range
expansion. Oecologia. 141: 148-157.
Forister M. L., Shapiro A. M. 2003. Climatic trends and advancing spring flight of
butterflies in lowland California. Glob. Change Biol. 9: 1130–35.
Goehring, L. and K. S. Oberhauser. 2002. Effects of photoperiod, temperature, and host
plant age on induction of reproductive diapause and development time in Danaus
plexippus. Ecol. Ent. 27: 674-685.
Holt, R. D. 1990. The microevolutionary consequences of climate change. Trends Ecol.
Evol 5: 311-315.
Intergovernmental Panel on Climate Change. 1996. in Climate Change 1995, Impacts,
Adaption and Mitigation of Climate Change: Scientific-Technical Analyses.
Cambridge Univ. Press, Cambridge U.K. pp. 171-189.
James, D. G. 1982. Ovarian dormancy in Danaus plexippus (L.) (Lepidoptera
Nymphalidae)—oligopause not diapause. J. Aust. Entomol. Soc. 21: 31-35.

6
James, D.G. 1993. Migration biology of monarchs in Australia. in Biology and
conservation of the monarch butterfly, eds. Malcolm, S. B. and M. P. Zalucki
(Natural History Museum of Los Angeles County, Los Angeles, CA), pp. 189-
200.
Kammer, A. E. 1971. Influence of acclimation temperature on the shivering behavior of
the butterfly Danaus plexippus (L.). Zeitschrift Fur Vergleichende Physiologie
72:364-369.
Oberhauser, K. S., M. D. Prysby, H. R. Mattila, D. E. Stanley-Horn, M. K. Sears, G.
Dively, E. Olson, J. M. Pleasants, W. F. Lam and R. L. Hellmich. 2001. Temporal
and spatial overlap between monarch larvae and corn pollen. Proc. Natl. Acad.
Sci. 98: 11913-11918.
Oberhauser, K. and A. T. Peterson. 2003. Modeling current and future potential wintering
distributions of eastern North American monarch butterflies. Proc. Natl. Acad.
Sci. 100: 14063-14068.
Parmesan C. 1996. Climate and species’ range. Nature 382: 765–66.
Parmesan, C., N. Ryrholm, C. Stefanescus, J. K. Hill, C. D. Thomas, H. Descimon, B.
Huntley, L. Kaila, J. Kullberg, T. Tammaru, et al. 1999. Poleward shifts in
geographical ranges of butterfly species associated with regional warming.
Nature. 399: 579-583.
Parmesan C. 2003. Butterflies as bio-indicators of climate change impacts. In Evolution
and Ecology Taking Flight: Butterflies as Model Systems, ed. C. L. Boggs, W. B.
Watt, P. R. Ehrlich, pp. 541–60. Chicago: Univ. Chicago Press.
Parmesan, C. and G. Yohe. 2003. A globally coherent fingerprint of climate change
impacts across natural systems. Nature 421: 37-42.
Peñuelas, J., I. Filella, and P. Comas. 2002. Changed plant and animal life cycles from
1952 to 2000 in the Mediterranean region. Global Change Biology 8: 531-544.
Roy D. B., T. H. Sparks. 2000. Phenology of British butterflies and climate change. Glob.
Change Biol. 6: 407–416.
Zalucki, M. P. and R. L. Kitching. 1982. Temporal and spatial variation of mortality in
field populations of Danaus plexippus L. and D. chrysippus L. larvae
(Lepidoptera: Nymphalidae) Oecologia 53: 201-207.
Zalucki, M. P. and W. A. Rochester. 2004. Spatial and temporal population dynamics of
monarchs down-under: lessons for North America, pp. 219-228. In K.
Oberhauser, and M. J. Solensky (eds.), Monarch Butterfly Biology and
Conservation. Cornell University Press, Ithaca, NY.

7
CHAPTER 1
Ecological Niches in Sequential Generations of Eastern North American Monarch
Butterflies (Lepidoptera: Danaidae): The Ecology of Migration and Likely Climate
Implications
SUMMARY
Eastern North American monarch butterflies (Danaus plexippus L.) show a series
of range shifts during their breeding season. Using ecological niche modeling, we studied
the environmental context of these shifts by identifying the ecological conditions that
monarchs use in successive summer months. Monarchs use a consistent ecological
regime through the summer, but these conditions contrast strikingly with those used
during the winter. Hence, monarchs exhibit niche-following among sequential breeding
generations, but niche-switching between the breeding and overwintering stages of their
annual cycle. We projected their breeding ecological niche onto monthly future climate
scenarios, which indicated northward shifts, particularly at the northern extreme of their
summer movements, over the next 50 years; if both monarchs and their milkweed host
plants cannot track these changing climates, monarchs could lose distributional area
during critical breeding months.
INTRODUCTION
Monarch butterflies (Danaus plexippus L.) are perhaps the best-known of
migratory insects. Because they cannot overwinter in temperate climates, the eastern
North American population migrates from broad summer breeding grounds in the United

8
States and Canada to small areas of high-altitude fir forest in central Mexico. The same
butterflies fly from Mexico to the southern United States in early spring, where they
begin breeding. Their offspring continue northward, perhaps because of increasing heat
and humidity and decreased host plant availability (Malcolm et al. 1987, 1993), and a
subsequent generation returns to Mexico in the following fall. The close ties between this
organism’s annual cycle and climatic conditions suggest that monarchs could be
impacted negatively by ongoing global climate change processes (Oberhauser and
Peterson 2003).
Zalucki and Rochester (2004) predicted large-scale fluctuations in abundance of
eastern North American monarchs resulting from effects of climate on phenology and
fecundity. Prolonged rainy, cloudy, and cool conditions can reduce egg-laying and
increase development time, whereas prolonged hot, dry spells can reduce adult lifespan
and fecundity (Zalucki 1981). Extended exposure to temperatures of !36oC can cause
significant larval mortality and developmental changes (Zalucki 1982, York and
Oberhauser 2002). Climate can also influence the abundance and quality of monarchs’
host plant; monarch larvae are specialist herbivores, feeding solely on plants in the genus
Asclepias (milkweeds), and milkweed quality for developing larvae deteriorates at high
temperatures (Zalucki and Kitching 1982).
Here, we assess seasonal variation in ecological niche characteristics of breeding
monarch butterfly populations, taking advantage of recent advances in assessing seasonal
niche variation (Joseph and Stockwell 2000, Martinez-Meyer et al. 2004, Nakazawa et al.
2004), to understand the constancy of monarchs’ ecological requirements through the
year. We then investigate likely effects of global climate change on these seasonal

9
patterns, projecting the present-day predictive models to future (2055) climate patterns to
outline future potential distributional areas and migratory shifts. Results are interpreted in
the context of the migratory behavior in the eastern North American monarch population,
emphasizing the unique nature of the annual migration and high-altitude tropical
overwintering behavior of these populations.
METHODS
Input data sets
Primary point-occurrence data for the eastern North American monarch
population were obtained from the Monarch Larva Monitoring Project (MLMP). MLMP
has recruited a cadre of volunteers to obtain date-specific occurrence data for immature
monarchs across 32 U.S. states and 2 Canadian provinces since 1997
(http://www.mlmp.org). The MLMP dataset describes spatial and temporal variation in
juvenile abundance and survival, as well as in productivity across different habitat types
(Prysby and Oberhauser 2004). For this analysis, we only used egg occurrence data;
similarly, for simplicity, we did not consider abundances, but rather focused on presences
at particular locations and times (Table 1).
Queen butterfly [Danaus gilippus Cramer (Lepidoptera: Nymphalidae)] eggs are
indistinguishable from monarch eggs, but queen butterfly larvae possess a third set of
tentacles not present in monarchs. As the ranges of these two species overlap in the
southern United States, some MLMP volunteers may report monarch egg presence when
they are actually seeing queen butterfly eggs. Hence, to verify data in the southern United
States, we identified instances in which eggs were observed in one week but no monarch

10
larvae were observed the following week. Without the confirmation of monarch larvae,
these observations could be due to the presence of queens. Volunteers at these five sites
(all in Texas) were contacted and asked to confirm their data; none reported sightings of
queen butterfly larvae near the time in question. Therefore, we assumed the observed
eggs were monarchs, and included this data in our models.
Ecological dimensions initially assessed included raster GIS data layers
describing 5 climatic and 4 topographic parameters (maximum, minimum, and mean
monthly temperatures; monthly solar radiation; monthly precipitation; elevation; slope;
aspect; and tendency to pool water). Ecological niches were characterized using climatic
variables for the period 1961-1990 (New et al. 1997), and topographic data were obtained
from the Hydro-1K dataset (http://edcdaac.usgs.gov/gtopo30/hydro). To permit efficient
computing, all present-day variables were resampled to 0.1° spatial resolution (~10 km).
Model development was limited to the area within 500 km of MLMP sampling points.
We excluded occurrence data for the resident population in southern Florida and
populations west of the Rocky Mountains, as their migratory habits (and perhaps their
ecological requirements) differ from those of the eastern population. We prepared month-
specific data sets of monarch occurrences and ecological variables for March through
September, as well as for the overwintering period (December-February). We performed
a jackknife manipulation, in which single data layers were omitted sequentially and
effects on omission error assessed, to identify data layers that did not contribute
positively to overall predictive success, following Peterson and Cohoon (1999).
To predict future potential distributions, we used two scenarios of HadCM2, a
general circulation model (Carson 1999) that has been used to create scenarios of future

11
climate conditions. The HHGSDX50 scenario assumes 0.5%/yr CO2 increase (IS92d),
and incorporates mitigating effects of sulphate aerosol forcing, making it a relatively
conservative estimate of climate change. The HHGGAX50 scenario assumes a 1%/yr
CO2 increase (IS92a) and does not allow for effects of sulfate aerosols, and so is more
extreme. As they are based on a 30 year average around 2055, our models do not take
into account potential effects of increased climate variability (El Niño events, in
particular) on species’ distributions. Because these future climate data are provided at a
very coarse spatial resolution of 2.5° " 3.75°, we calculated expected changes in
temperature (°C) and precipitation (mm) under each scenario from the relatively coarse
raw model results; these expected changes were applied to the original Intergovernmental
Panel on Climate Change current climate data layers to provide a final pixel resolution of
~30 " 30 km for future-climate data layers.
Niche models
We modeled month-specific ecological niches using a desktop implementation of
the Genetic Algorithm for Rule-set Prediction (GARP) (Stockwell 1992, Stockwell 1999,
Stockwell and Peters 1999, http://www.lifemapper.org/desktopgarp). GARP is a
machine-learning application that seeks non-random associations between point-
occurrence data and ecological information in the form of raster GIS data layers in an
iterative process of random rule generation, evaluation, perturbation, testing, and
incorporation or rejection. The resulting models identify portions of ecological space that
reflect the niche dimensions relevant to the geographic distributions of species. It should,
of course, be borne in mind that these models are correlative, and that niches almost

12
certainly vary in ecological dimensions not included in the present study. The approach
has been described in detail elsewhere (Soberón and Peterson 2005).
We developed ecological niche models for March through September (the month
on which a particular model is based is called the “focal month”) and projected each focal
month model onto climatic conditions for each other breeding month, the winter months
(December through February) and future climate scenarios for the focal month. We tested
the robustness of the model using projections in which the focal month was projected
onto itself and used to predict a random 50% of available occurrence points set aside for a
relatively independent test of model quality. Projections of the focal month onto each
other month indicated whether monarchs used the same ecological niches throughout the
summer breeding period. The changed-climate projections allowed us to predict where
acceptable breeding conditions might exist under future climates. Details for each of
these steps follow.
To optimize ecological niche model quality, we developed 100 replicate models
for each month-to-month comparison based on random 50-50 splits of available
occurrence points. Half of the occurrence points were used to build models; the others
were used to test them. Of these 100 models, we selected the 10 ‘best’ based on error
component distributions, (Anderson et al. 2003). This procedure is based on the
observations that (1) models vary in quality, (2) variation among models involves an
inverse relationship between error of omission (leaving out true distributional area) and
commission (including areas not actually inhabited), and (3) best models (as judged by
experts blind to error statistics) are clustered in a region of minimum omission of
independent test points (obtained from the 50-50 splits) and moderate area predicted

13
present (an axis related directly to commission error). The position of a particular model
in relation to the two error axes provides an assessment of the relative accuracy of each
model. To choose best subsets of models, we (1) eliminated all models that had >5%
omission error based on independent test points, (2) calculated the median area predicted
present among these low-omission models, and (3) identified models within the central
50% of the overall frequency distribution of area predicted present.
Ecological similarity among monthly ecological niche models was assessed
through interpredictivity calculations (Peterson et al. 1999, Peterson and Vieglais 2001,
Martínez-Meyer 2002), which are based on the premise that if two populations share
similar ecological niches, then the models for one will predict the distribution of the other
accurately, and vice versa. This approach involved projection of models for the focal
month onto the environmental data sets for each other month, and overlay of occurrence
data for the other months. Niche similarity was measured as the percentage of occurrence
data points falling within the prediction area of the model (Peterson and Vieglais 2001),
reported in a matrix, in which cell values summarize the percentage of occurrences
predicted correctly by one month’s model in each other month studied. To assess
statistical significance, we compared observed predictive success with the expected based
on random association between predictions and test points: the proportion of the study
area predicted by the model to be present or absent was multiplied by number of test
points that yielded random expectations (Peterson 2001, Peterson and Vieglais 2001).
Observed and expected numbers were compared using a one-tailed chi-squared test, with
1 degree of freedom (calculated in Microsoft Excel). (It should be noted that, lacking data
14
on absences of the species across the landscape, the more customary kappa and ROC
AUC statistics are not applicable.)
Future potential monthly distributional areas were estimated through methods
described in detail elsewhere (Araujo et al. 2005, Peterson et al. 2001, Peterson et al.
2002, Peterson 2003, Thomas et al. 2004). In brief, we projected the present-day, month-
specific ecological niche models onto future month-specific climate data, and averaged
the projections from the two future-climate scenarios. We summarized climate change
effects as (1) raw area predicted present before climate change, (2) raw area predicted
present after climate change, and (3) area of overlap between (1) and (2). (2) is equivalent
to a ‘universal dispersal’ assumption, whereas (3) is equivalent to a ‘no dispersal’
assumption (Thomas et al. 2004).
RESULTS
Initial jackknife manipulations of the climatic and topographic parameters found
that aspect, solar radiation and tendency to pool water did not contribute significantly to
model quality, so our models of present-day distributions were based on maximum,
minimum, and mean monthly temperatures; precipitation; elevation; and slope. This suite
of variables allowed highly accurate month-specific models, as assessed in predicting
independent test data sets (chi-squared values ranged from 4.2 to 211.9 for all 7 monthly
chi-squared tests, df = 1, all P < 0.05).
Predictivity among monthly ecological and geographic distributions was excellent
(Figure 1); coincidence between predictions and relatively independent test points was
considerably better than random expectations when models for focal months were used to

15
predict occurrence data from each other month (Table 2). Models for April, May, and
June predicted monarch distributions for every month significantly better than random
models. The July ecological niche model predicted independent test data sets well for
May through August, and August predicted April through August. March and September
were more erratic in their ability to predict other months, likely reflecting lower sample
sizes available for model-building and the fact that temperatures are more variable in
those two months. Hence, monarchs appear to be faithful ‘niche followers’ throughout
their breeding period.
Comparing ecological niches as modeled for the breeding (herein) and
overwintering stages (Oberhauser and Peterson 2003), however, reveals a niche shift
between the two seasons. The breeding season niche is characterized by warmer and
wetter conditions than monarchs occupy during the winter (Figure 2); this difference is
reflected in poor (no) coincidence between predictions from models based on breeding
sites and overwintering points. During the winter months, breeding niche conditions are
manifested in Atlantic coastal portions of Central America, as opposed to the central
Mexican highlands where monarchs overwinter (Oberhauser and Peterson 2003).
Projecting month-specific ecological niche models onto future climate scenarios
suggests complex effects of climate change on the seasonal potential geography of
monarchs (Figure 3). Early in the breeding season, monarchs could see an increase in the
area of ecologically suitable habitat, assuming that they can migrate more quickly and
somewhat longer distances. In June-August, however, ideal conditions shift northward
and separate more from the current range. The amount of suitable area available in the
present and future, based on different assumptions of dispersal ability (universal dispersal

16
or no dispersal assumption) is shown in Figure 4. This illustrates the complexities of
likely climate change effects on monarch seasonal geography.
DISCUSSION
Recent years have seen many applications of ecological niche modeling
approaches to questions of distributional biology of species. Applications have included
describing distributions, discovering new populations and species, describing historical
distributional shifts, predicting the geographic potential of species’ invasions, and
anticipating future distributional shifts in the face of changing conditions (Zalucki and
Rochester 1999, Guisan and Hofer 2003, Pearson and Dawson 2003, Thuiller et al. 2005,
Wiens and Graham 2005, Araújo and Guisan 2006, Araújo et al. 2006, Pearson et al.
2006, Thuiller et al. 2006). Although methodologies and thought frameworks are in the
process of rapid development, applications to seasonal biology are still few (Martínez-
Meyer et al. 2004, Nakazawa et al. 2004, Peterson et al. 2005). As such, this review of
seasonal ecology of monarchs represents an important addition to a growing literature.
The ability of ecological niche models to predict month-to-month distributional
dynamics demonstrates that sequential generations of breeding monarchs are effectively
‘niche followers’ across the changing ecological landscape of spring, summer and fall.
Some focal months were better able to predict seasonal shifts than others; causes may
include the smaller occurrence data sets available in March and September (Table 1), the
fact that monarchs are switching from migratory to breeding behavior, and the
accelerated rate at which seasonal climates change during these months. Because MLMP
volunteers do not always record absence data, input data from the beginning and end of

17
the breeding season may be less reliable. More generally, our monthly resolution may
provide a temporal scale too coarse for precise predictions, particularly in spring and fall,
when climates are changing more rapidly.
The lack of correspondence between the breeding season niche and the winter
niche used by monarch butterflies is evidence that monarchs switch niches as they
migrate to and from their wintering sites in central Mexico, even though their breeding
niche is available in other (albeit more distant) parts of Mexico and Central America
during the winter months. This result effectively combines the ‘niche follower’ and
‘niche switcher’ dichotomy of Nakazawa et al. (2004) within a single species—monarchs
follow a breeding-season niche from March-October, but spend the remainder of the year
under very different conditions.
Future-climate projections of month-specific ecological niche models predict
marked changes in the species’ seasonal potential distribution. Currently, monarchs
migrate from Mexican wintering grounds to breed in the southern United States, and their
offspring migrate into more northern areas. The current spatial manifestation of the niche
shifts northward during March-May, but remains relatively stationary in June-August
(Figure 1). With climate change, habitable areas are predicted to continue shifting
northward through July (Figure 3). The seasonal potential distribution then contracts in
August, perhaps necessitating relocation of all local populations of monarchs before
breeding. It is unclear whether monarchs will be able to adjust their seasonal movement
patterns to accommodate these changing conditions or what the consequence of lost
breeding locations will be.

18
Mobile species such as monarchs may be able to track the geographic distribution
of their breeding ecological niches seasonally as climates changes; evidence indicates
that some European butterflies have achieved such tracking (Parmesan et al. 1999, Hill et
al. 2003). Additionally, monarch diapause behavior and movement patterns have changed
as the species has expanded into new habitats (e.g., Zalucki and Rochester 1999). If
monarchs can indeed track the shifts in ecological niche conditions (universal dispersal
assumption), they stand to gain a significant amount of habitat (Figure 4). Currently, the
range of milkweed extends only 160 km into Canada, so it is absent from the regions of
Canada to which monarchs’ potential distributions are projected to shift (Woodson 1954).
Milkweed may not be able to colonize northward as rapidly as monarchs might require,
which may make these habitats nonetheless uninhabitable. Without such universal
dispersal potential (no dispersal assumption), monarchs could lose considerable potential
distributional area in June-August (Figure 4), the most critical breeding portion of the
annual cycle.1
1 ACKNOWLEDGEMENTS: We thank the MLMP volunteer monitors and trainers for their
work in collecting occurrence data, and Michelle Prysby, Michelle Solensky, and Jolene
Lushine for their help developing and coordinating the MLMP. This work was supported
by grants from the National Science Foundation (ESI-0104600 to KSO and DEB-
9711621 to ATP) and the Dayton and Wilkie Natural History Fund.

19
REFERENCES
Anderson, R. P., D. Lew, and A. T. Peterson. 2003. Evaluating predictive models of
species distributions: criteria for selecting optimal models. Ecol. Mod. 162: 211-
232.
Araújo, M. B., R. G. Pearson, W. Thuiller, and M. Erhard. 2005. Validation of species-
climate impact models under climate change. Glob. Change Biol. 11: 1504-1513.
Araújo, M. B., and A. Guisan. 2006. Five (or so) challenges for species distribution
modelling. J. Biogeogr. 33: 1677-1688.
Araújo, M. B., W. Thuiller, and R. G. Pearson. 2006. Climate warming and the decline
of amphibians and reptiles in Europe. J. Biogeogr. 33: 1712-1728.
Carson, D. J. 1999. Climate modelling: achievements and prospects. QJR Meteorol. Soc.
125: 1- 27.
Guisan, A., and U. Hofer. 2003. Predicting reptile distributions at the mesoscale: relation
to climate and topography. J. Biogeogr. 30: 1233-1243.
Hill, J. K., C. D. Thomas, and B. Huntley. 2003. Modelling present and potential future
ranges of European butterflies using climate response surfaces, pp. 149-167. In C.
L. Boggs, W. B. Watt, and P. R. Ehrlich (eds.), Butterflies Ecology and Evolution
Taking Flight. University of Chicago Press, Chicago, IL.
Joseph, L. and D. R. B. Stockwell. 2000. Temperature based models of the migration of
Swainson’s flycatcher Myiarchus swainsoni across South America: a new use for
museum specimens of migratory birds. Proc. Acad. Nat. Sci. Philad. 150: 293-
300.
Malcolm, S. B., B. J. Cockrell, and L. P. Brower. 1987. Monarch butterfly voltinism: effects
of temperature constraints at different latitudes. Oikos. 49: 77-82.
Malcolm, S. B., B. J. Cockrell, and L. P. Brower. 1993. Spring recolonization of eastern
North America by the monarch butterfly: successive brood or single sweep
migration?, pp. 253-267. In S. B. Malcolm and M. P. Zalucki (eds.), Biology and
Conservation of the Monarch Butterfly. Publications of the Los Angeles County
Museum of Natural History, Los Angeles, CA.
Martínez-Meyer, E. 2002. Evolutionary Trends in Ecological Niches of Species. Ph.D.
dissertation, University of Kansas, Lawrence.
Martínez-Meyer, E., A. T. Peterson, and A. G. Navarro-Sigüenza. 2004. Evolution of
seasonal ecological niches in the Passerina buntings (Aves: Cardinalidae). Proc.
R. Soc. Lond. B. 271: 1151-1157.

20
Nakazawa, Y., A. T. Peterson, E. Martínez-Meyer, and A. G. Navarro-Sigüenza. 2004.
Seasonal niches of neararctic-neotropical migratory birds: implications for the
evolution of migration. Auk. 121: 610-618.
New, M., M. Hulme and P. Jones. 1997. A 1961-1990 Mean Monthly Climatology of
Global Land Areas. Norwich, U.K. Climatic Research Unit, University of East
Anglia.
Oberhauser, K. and A. T. Peterson. 2003. Modeling current and future potential wintering
distributions of eastern North American monarch butterflies. Proc. Natl. Acad.
Sci. 100:14063-14068.
Parmesan, C., N. Ryrholm, C. Stefanescus, J. K. Hill, C. D. Thomas, H. Descimon, B.
Huntley, L. Kaila, J. Kullberg, T. Tammaru, et al. 1999. Poleward shifts in
geographical ranges of butterfly species associated with regional warming.
Nature. 399: 579-583.
Pearson, R. G., and T. P. Dawson. 2003. Predicting the impacts of climate change on the
distribution of species: are bioclimate envelope models useful? Global Ecol.
Biogeogr. 12: 361-371.
Pearson, R. G., C. Raxworthy, M. Nakamura, and A. T. Peterson. 2006. Predicting
species' distributions from small numbers of occurrence records: a test case using
cryptic geckos in Madagascar. J. Biogeogr. 34: 102-117.
Peterson, A.T. and K. C. Cohoon. 1999. Sensitivity of distributional prediction
algorithms to geographic data completeness. Ecol. Mod. 117: 159-164.
Peterson, A. T., J. Soberon, and V. Sanchez-Cordero. 1999. Conservatism of ecological
niches in evolutionary time. Science. 285: 1265-1267.
Peterson, A. T. 2001. Predicting species’ geographic distributions based on ecological
niche modeling. Condor. 103: 599-605.
Peterson, A. T., V. Sánchez-Cordero, J. Soberón, J. Bartley, R. H. Buddemeier and A. G.
Navarro-Sigüenza. 2001. Effects of global climate change on geographic
distributions of Mexican Cracidae. Ecol. Mod.. 144: 21-30.
Peterson, A. T. and D. A. Vieglais. 2001. Predicting species invasions using ecological
niche modeling: new approaches from bioinformatics attack a pressing problem.
BioScience 51: 363-371.
Peterson, A. T., M. A. Ortega-Huerta, J. Bartley, V. Sánchez-Cordero, J. Soberón, R. H.
Buddemeier, D. R. B. Stockwell. 2002. Future projections for Mexican faunas
under global climate change scenarios. Nature. 416: 626-629.

21
Peterson, A. T. 2003. Projected climate change effects on Rocky Mountain and Great
Plains birds: generalities of biodiversity consequences. Glob. Change Biol. 9:
647-655.
Peterson, A. T., C. Martínez-Campos, Y. Nakazawa, and E. Martínez-Meyer. 2005.
Time-specific ecological niche modeling predicts spatial dynamics of vector
insects and human dengue cases. Trans. R. Soc. Trop. Med. Hyg. 99: 647-655.
Prysby, M. D. and K. Oberhauser. 2004. Temporal and Geographic Variation in Monarch
Densities: citizen scientists document monarch population patterns, pp. 9-20. In K. S.
Oberhauser and M. J. Solensky (eds.), Monarch Butterfly Biology and Conservation.
Cornell University Press, Ithaca, NY.
Soberón, J. and A. T. Peterson. 2005. Interpretation of models of fundamental ecological
niches and species' distributional areas. Biodiversity Informatics. 2: 1-10.
Stockwell, D. R. B. 1992. Machine learning and the problem of prediction and explanation in
ecological modeling. Ph.D. dissertation, Australian National University, Canberra,
Australia.
Stockwell, D. R. B. 1999. Genetic algorithms II, pp. 123-144. in A. H. Fielding (ed.),
Machine learning methods for ecological applications. Bluwer Academic
Publishers, Boston, MA.
Stockwell, D. R. B. and D. P. Peters. 1999. The GARP modeling system: problems and
solutions to automated spatial prediction. Int. J. Geog. Inform. Sys. 13: 143-158.
Thomas, C. D., A. Cameron, R. E. Green, M. Bakkenes, L. J. Beaumont, Y. C.
Collingham, B. F. N. Erasmus, M. Ferreira de Siqueira, A. Grainger, L. Hannah,
L. Hughes, B. Huntley, A. S. Van Jaarsveld, G. E. Midgely, L. Miles, M. A.
Ortega-Huerta, A. T. Peterson, O. L. Phillips, and S. E. Williams. 2004.
Extinction risk from climate change. Nature. 427: 145-148.
Thuiller, W., D. M. Richardson, P. Pysek, G. F. Midgley, G. O. Hughes, and M. Rouget.
2005. Niche-based modelling as a tool for predicting the risk of alien plant
invasions at a global scale. Glob. Change Biol. 11: 2234-2250.
Thuiller, W., G. F. Midgely, G. O. Hughes, B. Bomhard, G. Drew, M. C. Rutherford, and
F. I. Woodward. 2006. Endemic species and ecosystem sensitivity to climate
change in Namibia. Glob. Change Biol. 12: 759-776.
Wiens, J. J. and C. H. Graham. 2005 Niche conservatism: integrating evolution, ecology,
and conservation biology. Annu. Rev. Ecol. Syst. 36: 519-539.
Woodson, R. E. 1954. The North American species of Asclepias. Ann. Mo. Bot. Gard.

22
York, H. A. and K. S. Oberhauser. 2002. Effects of duration and timing of heat stress on
Monarch Butterfly (Danaus plexippus) (Lepidoptera: Nymphalidae) development.
J. Kans. Entomol. Soc. 75: 290-298.
Zalucki, M. P. 1981. The effects of age and weather on egg laying in Danaus plexippus
L. (Lepidoptera: Danaidae). Res. Popul. Ecol. 23: 318-327.
Zalucki, M. P. 1982. Temperature and rate of development in Danaus plexippus L. and
D. chrysippus L. (Lepidoptera: Nymphalidae) J. Aust. Entomol. Soc. 21: 241-46.
Zalucki, M. P. and R. L. Kitching. 1982. Temporal and spatial variation of mortality in
field populations of Danaus plexippus L. and D. chrysippus L. larvae
(Lepidoptera: Nymphalidae) Oecologia 53: 201-207.
Zalucki, M. P. and W. A. Rochester. 1999. Estimating the effect of climate on the
distribution and abundance of the monarch butterfly, Danaus plexippus (L.): a tale
of two continents, pp. 151-163. In J. Hoth,, L. Merino, K. Oberhauser, I. Pisanty,
S. Price, and T. Wilkinson (eds.), The 1997 North American Conference on the
Monarch Butterfly. Commission for Environmental Cooperation, Montreal,
Canada.
Zalucki, M. P. and W. A. Rochester. 2004. Spatial and temporal population dynamics of
monarchs down-under: lessons for North America, pp. 219-228. In K.
Oberhauser, and M. J. Solensky (eds.), Monarch Butterfly Biology and
Conservation. Cornell University Press, Ithaca, NY.

23
Table 1.1: Monarch Larval Monitoring Program data records in which one or more
monarch eggs were observed, and on which ecological niche models were based. Number
of U.S. States indicates the approximate geographic extent of the monitoring data for that
particular month.
Month
Occurrences with
eggs present
Number of
monitoring events Number of U.S. States
March 24 49 2
April 47 125 6
May 130 318 18
June 595 1010 23
July 857 1335 24
August 677 1223 25
September 98 411 19

24
Table 1.2: Summary of interpredictivity tests among month-specific ecological
characteristics and geographic distributions of monarch butterflies. Columns are months
used to generate predictions (focal months); rows are months predicted. Cell contents are
percent correct prediction of independent test data by any of the 10 best-subsets models;
asterisks indicate predictions significantly (P < 0.05) better than random models (chi-
squared tests, df = 1).
Month predicting
Month
predicted
March April May June July August September
March 100* 100* 70* 40* 0 0 60*
April 100* 94* 94* 88* 19 81* 0
May 49 91* 100* 72* 54* 70* 47*
June 54 100* 96* 100* 89* 86* 0
July 65 100* 94* 96* 100* 79* 17*
August 89 100* 93* 96* 80* 100* 76*
September 97* 89* 91* 83* 0 46 100*

25
Fig. 1.1: Example of predictivity among monthly ecological and geographic distributions
of monarch butterflies: the ecological niche model based on June points used to predict
the geographic distribution of the species in March-September. Occurrence data from the
month being predicted are overlaid as dotted circles. Predictions are summarized as light
September
March April
May June
July August

26
gray = any of 10 best subsets models predicts presence, dark gray = >6 of 10 best subsets
models predict presence, and black = all 10 best subsets models predict presence.

27
Fig. 1.2: Temperature and precipitation combinations across North America (small gray
points, based on June conditions), showing sets of conditions predicted to be suitable for
monarchs based on ecological niche models based on June occurrence data (white
squares) and based on winter occurrence data of the Mexican overwintering populations
(black circles; from Oberhauser and Peterson 2003).
Figure 3:
0
2
4
6
8
10
12
14
16
0 5 10 15 20 25 30 35
Pre
cipit
atio
n (
cm)
Temperature (C)

28
September
March April
May June
July August

29
Fig. 1.3: Changed climate (2055) projections for monthly monarch butterfly potential
distributions. The present-day distribution is shown in medium gray, and the potential
future distribution is shown in light gray; areas of overlap between the two are shown in
dark gray. Occurrence points (present day) are plotted as white squares. The maps can be
interpreted as follows: medium gray + dark gray = present distribution, light gray + dark
gray = future distribution (universal dispersal assumption), and dark gray = future
distribution (no dispersal assumption).

30
Fig. 1.4: Summary of area estimates for present and future monthly distributional areas
for monarch butterflies. Present-day distributional area is shown in black. Projected
future potential distributional areas are shown in gray (universal dispersal assumption)
and white (no dispersal assumption).
0
50
100
150
200
250
300
350
400
450
500
March April May June July August September
Avai
lable
Are
a (m
illi
ons
of
ha)
Present distributional area
Future potential distributional
area (universal dispersal)
Future potential distributional
area (no dispersal)

31
CHAPTER 2
Lethal and Sublethal Effects of Heat Stress on Monarch Butterfly Larvae
SUMMARY
Ecological niche models predict a marked northward summer range shift for
eastern North American monarchs, necessitating a longer and faster migration unless
monarch larvae can withstand temperatures that are hotter than those in their current
habitat. Here, we assess the lethal and sub-lethal effects of exposure to temperatures
between 38 and 44oC at the first, third or fifth stadia for 1, 2, 4 or 6 days. Daytime
temperatures of 38 and 40oC caused a slight increase in mortality, as well as difficulty
pupating, smaller adult size and a longer development time. Daytime temperatures of
42oC caused substantially more mortality and no larvae survived exposure to 44
oC. We
also tested elevated nighttime temperatures of 30, 32 and 34oC. Mortality and
development time increased with increasing duration of exposure. Increased daytime and
nighttime temperatures cause higher mortality and negative sub-lethal effects suggesting
that monarchs may not be able to cope with warmer temperatures associated with the
onset of climate change.
INTRODUCTION
Monarch butterflies (Danaus plexippus) are well known insect migrants, with the
eastern North American population migrating up to 4500 km from as far north as
southern Canada to mountains in central Mexico each fall. They spend the winter
32
roosting in oyamel fir trees and begin to fly north in late February. En route, females lay
eggs in northern Mexico and the southern United States. The second generation leaves
the southern United States and spreads across much of the United States east of the
Rocky Mountains. There, two to three generations develop before they migrate again.
Monarchs are believed to be vulnerable to the effects of climate change in their
overwintering sites (Oberhauser and Peterson 2003, Zalucki and Rochester 2004), and
during the summer breeding season (Batalden et al. 2007), when extensive rain or
prolonged cool and cloudy conditions can reduce egg laying and increase development
time, and prolonged hot or dry spells can reduce adult lifespan and fecundity (Zalucki
1981, Masters et al. 1988, Masters 1993). Zalucki and Rochester (2004) predicted large
fluctuations in monarch abundance in the eastern North American population due to the
effects of climate on their phenology and fecundity. Climate can also influence milkweed
abundance and quality (Zalucki and Rochester 2004); for example, milkweed deteriorates
under high temperatures, making it less attractive to egg-laying females and larvae
(Zalucki and Kitching 1982).
Ecological niche models based on occurrence data obtained from the Monarch
Larva Monitoring Project (MLMP, Prysby and Oberhauser 2004) predict a marked
northward summer range shift for eastern North American monarchs, necessitating a
longer and faster migration (Batalden et al. 2007). MLMP data do not show monarch
presence above a monthly mean temperature of 30OC. Previous studies show that
continued exposure to temperatures of 36OC cause significant larval mortality, but single
or repeated 12-hour pulses of this extreme temperature cause development time to
increase without increasing mortality (Zalucki 1982, York and Oberhauser 2002). This

33
indicates the importance of low nighttime temperatures, yet observed climate change and
future predictions indicate increased frequency of higher nighttime lows (IPCC 2007). To
our knowledge, no studies have examined the lethal and sub-lethal impacts of
temperatures above 36OC or explored the effects of elevated nighttime temperatures on
monarch butterflies.
To cope with exposure to elevated temperatures, organisms synthesize heat shock
proteins (HSP) (Lindquist 1986). HSP are highly conserved proteins that serve as
molecular chaperones (Hartl 1996). Molecular chaperones recognize and bind to other
proteins as they are synthesizing and prevent misfolding due to high temperatures. Much
of what is known about HSP is due to lab experiments; in nature, movement and other
behaviors may enable organisms to avoid heat stress (Huey 1991).
There are three general expectations for species’ responses to climate change:
movement, adaptation, or extirpation (Holt 1990). Mobile species, such as monarchs,
may be able to track their ecological niches as the climate changes; there is evidence that
some European and Californian butterflies have done this (Parmesan et al. 1999,
Parmesan and Yohe 2003, Crozier 2004). According to ecological niche models,
monarchs will need to move northward prior to breeding in June and July, and south in
August (Batalden et. al. 2007). Currently, only the spring generation moves before
breeding; during the prime breeding months monarchs appear to remain in the same
geographic range (MLMP 2011). It is unclear whether the summer generations will
respond to poor conditions with movement. If, under a changed climate, an individual
monarch survives a stressful temperature regime as a larva, that adult might enjoy higher
fitness by relocating, perhaps moving north before breeding to ensure better offspring

34
survival. This occurs in the spring generation, but the mechanisms that prompt this
migration are unclear. If monarchs are to track their moving niche, they will need to
respond to different cues than those that signal their spring or fall migration (Goehring
and Oberhauser 2002, 2004).
Here, we assess the lethal and sub-lethal effects of exposure to temperatures
warmer than the monarchs’ current ecological niche (experiment 1). We also test the
effects of increased nighttime temperatures (experiment 2).
METHODS
In a series of two experiments, we investigated the lethal and sub-lethal impacts
of elevated temperatures on monarch survival and development. Experiment 1 focused on
daytime temperatures with the goal of determining the physiological limits of monarch
larvae development. Experiment 2 combined a tolerable daytime temperature with
increased nighttime temperatures. Tolerable was defined as no increased mortality
compared with control treatments, but an increase in sub-lethal impacts, determined in
experiment 1.
For both experiments, larvae were raised in Percival growth chambers to control
thermoperiod and photoperiod with a 12:12 hour thermophase:cryophase cycle schedule.
In experiment 1, individuals were kept in separate 500 ml deli containers with ventilation
holes in the lids throughout their development. In experiment 2, they were kept in petri
dishes through the fourth stadium, then moved to the deli containers to pupate. In all
experiments, control and non-treatment conditions were 30oC during the day and 25
oC at

35
night, with thermoperiod coinciding with photoperiod. Rearing tubs were cleaned and
larvae given fresh wild-collected milkweed (Asclepias syriaca) daily.
Experiment 1
Experiment 1 was completed in two sequential rounds due to space limitations:
round 1 temperatures were 38OC and 40
OC, and round 2, 42
OC and 44
OC. All
experimental larvae were offspring of wild-caught individuals, collected from the first
generation of monarchs in St. Paul, MN in June 2007.
Within hours of hatching from their eggs, individuals were placed in their rearing
containers and randomly assigned an experimental group. The experiment was a full
factorial design plus a comparison to the control conditions outlined above. We exposed
larvae, beginning at stadium 1, 3 or 5, to 12-hour pulses of 38OC, 40
OC, 42
OC, or 44
OC
over periods of 1, 2, 4, or 6 days. Sample sizes ranged from 17 to 20 for each treatment
group, including the control.
We checked each container daily to clean and feed larvae, tracking mortality and
development. Development time was measured in days and degree days (using 12oC as
the threshold temperature) (Zalucki 1982). We assessed two additional sub-lethal impacts
of heat exposure: the ability to pupate without falling, and adult size. If individuals fell
from the lids of their containers when they attempted to pupate, we used thread and tape
to affix the cremaster back to the lid; thus falling during pupation, which would usually
be lethal in the wild, was not in our experiment. Adult size was measured as mass and
wing length. We measured each individual’s mass the same day it eclosed, after the
wings dried. The right forewing length measurement is the distance from the base of the
wing to the apex.
36
Experiment 2
Experiment 2 was completed in three sequential rounds, due to space limitations.
Each round tested a different treatment temperature, which differed from control during
the day and night, rather than just day as in experiment 1. Daytime treatment temperature
was 38OC for all replications and 30
OC, 32
OC or 34
OC at night in rounds 1, 2, and 3,
respectively. We used the same factorial design for treatment timing and duration as in
experiment 1.
Larvae for round 1 were offspring of wild-caught individuals, collected from the
first generation of monarchs in St. Paul, MN and western Wisconsin in June 2008.
Rounds 2 and 3 individuals were offspring of first-generation lab-reared butterflies. We
measured the same lethal and sub-lethal indicators of heat stress as experiment 1.
We used logistic regression to test the effects of temperature, and timing and
duration of treatment on survival to adulthood. All factors were treated as categorical
variables, and model results are reported in logit scale. While every experiment included
a control group that was not exposed to extreme temperatures, the regression analyses did
not include the control groups, since their treatments included no values for the timing
and duration of treatment. When appropriate, we used Fisher’s exact test to compare
survival in the control group to other groups, and ANOVA models to compare the
continuous values of mass and winglength. All analyses were conducted in JMP v. 5.1.2.

37
RESULTS
Experiment 1
All monarchs exposed to 44OC died before adulthood and of 234 individuals
exposed to 42OC, only 16 survived to be adults (Figure 1c). Therefore, we were unable to
compare sub-lethal effects across treatments for these temperature regimes. Mortality did
not differ between control groups in rounds 1 and 2 (Fisher’s exact test, p = 1.00).
The logistic regression model shows two-way interactions between temperature
and timing of treatment, and between timing and duration (Table 1). Individuals exposed
in the third stadium were less likely to survive to adulthood, particularly after 6 days of
exposure, with 70 percent surviving at 38oC and 20 percent surviving at 40
oC (Figure 1
and Table 1). At 40oC, there was also an increase in mortality at the fifth stadium after 6
days of exposure with 53 percent surviving to adults. Across timing and duration values,
mortality increased for individuals exposed to 42oC, with 6.7 percent survival compared
to 82 and 72 percent in the 38oC and 40
oC groups respectively.
Out of 451 individuals that survived to pupate, 143 dropped from the lids of their
containers during or just after pupation. Under natural conditions, falling is likely to
result in death, either directly from the fall or from another source, such as predation.
Here, the distance to the floor of the container was small, and when we taped pupae by
their cremasters back onto the container lid, subsequent survival was 94 percent.
Consequently, this potentially lethal impact of exposure to heat stress was not accurately
represented in mortality estimates.
The proportion of individuals that fell during pupation did not depend on
temperature, but a logistic regression shows an interaction between the timing and

38
duration of treatment (Table 2). In particular, individuals exposed at the fifth stadium
were more likely to fall at durations of 4 or 6 days, with 58 and 72 percent falling,
respectively. If exposed for 1 or 2 days, the likelihood of falling was no more than control
(Figure 2). We determined if the effect of longer exposure to heat stress was due to the
fact that some larvae pupated while they were still in the heat treatment; a Pearson’s Chi-
Squared test showed no difference in pupation ability whether the individual pupated in
the treatment or after returning to control conditions (x2=0.218, d.f. = 1, 63, p = 0.64).
Individuals exposed during the third stadium also showed elevated risk of falling, with
33, 38 and 46 percent falling if exposed for 1, 2 or 4 days, respectively.
With increasing temperature, male and female mass decreased, and monarchs
exposed to temperatures above 38 were smaller than controls (Table 3). However, wing
length in the treatment groups did not differ from controls (Table 3). The duration and
timing of treatment did not affect adult size.
Development time to adult, measured in days and degree days, was higher in
nearly all treatments compared to control (Table 4 and Figure 3a, 3b; only results of the
analyses for degree days are shown). Within treatments, the number of days and degree
days increased with increasing temperature and duration, and decreased when exposure
began at the fifth stadium (Table 4). At 38oC, there was a jump in the number of degree
days required when exposure increased from 2 to 4 days during the first and third stadia,
whereas at 40oC, there was a more gradual increase in development time with exposure
duration (Figure 3a, 3b).
With exposure to elevated temperatures, individuals took more degree days to
develop, if we assume that development rates continue to increase with increasing

39
temperature. However, insects have developmental maxima as well as minima. Thus, we
recalculated degree days to exclude time exposed to elevated daytime temperatures,
essentially assuming that development ceased at 38 and 40oC. The degree day totals
reported in figures 3c and 3d and the central columns of Table 4 reflect all of the time
spent in control conditions, but only the 12 nighttime hours each day spent under
treatment conditions at 25oC. In the 38
oC treatment, individuals in the first and third
stadia exposed for 6 days and in the fifth stadium exposed for 4 or 6 days, spent fewer
degree days to develop than the control, suggesting that they continued to develop at this
temperature but only after prolonged exposure. When exposed to 40oC, only fifth instars
exposed for 4 or 6 days used significantly fewer adjusted degree days to develop than
control, suggesting that larvae were less able to develop during exposure at 40oC (Figure
3c, 3d, Table 4).
To further understand how the larvae develop under extreme heat, we tested
additional models of adjusted degree days. Rather than exclude time spent at treatment
temperatures completely, we recalculated degree day totals using values between 18 and
26oC in place of 38 or 40
oC, but all other temperature values for nighttime or control
treatments remained the same. When treatment temperatures are treated as 22oC,
individuals in the 38oC group use the same number of degree days to develop as the
control group (Figure 3e). Individuals in the 40oC group exposed as first instars for 6
days or as third instars for 4 days use significantly more degree days to develop than
control (Figure 3f). None of the adjusted degree day models we examined resulted in
degree day values for individuals in the 40oC group equal to the control group.

40
We determined when developmental lags occurred by tracking development time
by stadia. Individuals exposed during the first stadium, regardless of duration, took
longer to molt into the second stadium than control larvae (Table 5). At 38oC, regardless
of duration, the average development time in the second stadium was not significantly
different from control, even though individuals in the 4 or 6 days of exposure groups
were still exposed to elevated temperatures. At 40oC, the average development time
during the second stadium was longer than the control only for larvae exposed for 6 days
beginning in the first stadium. When individuals exposed during the first stadium reached
the third stadium, their development was largely on pace with the control treatment.
Exposure to 38oC during the third stadium did not slow development into the
fourth stadium, but at those exposed to 40oC took longer than control individuals to molt
into the fourth stadium (Table 5). Development time through the fourth stadium was not
significantly different from control, except for those exposed to 40oC for 4 and possibly 6
days.
For individuals entering the elevated temperature regimes at the fifth stadium,
38oC did not slow their development, but at 40
oC time during the fifth stadium was
higher than for the control group (Table 5). Only individuals exposed for 6 days,
regardless of temperature, showed longer development time through the pupa stage.
Sample sizes are low in the 42oC treatment group due to high mortality once the
treatment started, but there were both immediate and long-term effects of the heat
treatment on development for the larvae that survived the treatment (Table 5).

41
Experiment 2
Control mortality did not differ among rounds 1, 2 and 3, so our analysis includes
comparisons across all rounds (Pearson Chi-square = 1.875, d.f. = 2, 57, p = 0.39).
Control development time, however, was different across rounds, so we cannot compare
this response variable between rounds (R2 = 0.14, F ratio = 3.61, d.f. = 2, 45, p = 0.04).
Round 1 was conducted in mid-summer, while rounds 2 and 3 occurred into late fall, thus
milkweed quality may have contributed to the observed changes in development time.
We used a logistic regression to test the effects of temperature, timing and
duration of treatment on survival to adulthood. As in experiment 1, all factors were
treated as categorical variables. The resulting model shows a two-way interaction
between temperature and timing of exposure, and an effect of duration (Table 6). At
nighttime temperatures of 34oC, a particularly high level of mortality occurred in larvae
exposed during the first stadium, with only 3.8 percent surviving to adulthood (Figure
4b). Mortality also increased with increasing duration of exposure, with 72 percent and
68 percent surviving after 4 and 6 days of exposure respectively, compared to 81 percent
survival for the control group (Table 6 and Figure 4a).
Development time for individuals exposed to nighttime treatment temperature
30oC increased with increasing duration but did not differ across stadia (Figure 5a, Table
7). Development time differed for individuals exposed to 32 or 34oC with respect to
timing and duration of exposure (Figure 5b, c, Tables 8 and 9). Due to space limitations,
each temperature was tested in separate rounds, each with its own control. Development
times for controls across the three rounds were unequal, so we could not compare the
effect of temperature on development time.

42
DISCUSSION
Exposure to extremely hot temperatures caused increased mortality in monarch
larvae (Figure 1). Mortality increased slightly between 38oC and 40
oC and substantially
between 40oC and 42
oC, regardless of the timing or duration of exposure. This suggests a
physiological limit between 40 and 42oC. No larvae survived any exposure to 44
oC.
Individuals in the third stadium showed increased mortality, particularly at 40oC
when exposed for 6 days (Figure 1). If 42oC represents a physiological limit, this suggests
that the third stadium itself poses additional susceptibility to heat stress. York and
Oberhauser (2002) found mortality increases when third stadium individuals were
exposed to 12 hour pulses of 36oC. Even if an individual survived the initial exposure at
the third stadium, they were less able to pupate successfully (Figure 2). By this time, they
were in control conditions, so this indicates a long-term effect of exposure to high
temperatures.
Finally, individuals exposed at the fifth stadium for 6 days exhibit decreased
survivorship at 40oC (Figure 1). This effect could result when individuals attempt to
pupate while exposed to treatment conditions, or it could be the result of increased
physiological stress from preparing to pupate coupled with heat stress. Individuals
exposed to elevated temperatures during the fifth stadium for 4 or 6 days were also more
likely to fall as they pupated (Figure 2).
The long-term impacts of heat stress continue, even if an individual survives to
adulthood. Individuals exposed to increasing temperatures were lighter (Table 3). Small
size may result in decreased male mating success (Solensky and Oberhauser 2009) and
female fecundity (Oberhauser 1997). For the fall migrating generation, small size may

43
lead to decreased survivorship throughout the migration, winter and spring remigration
(Masters et al. 1988, Arango 1996, Van Hook 1996, Alonso-Mejia et al. 1997).
Overall development time increased with exposure to increasingly elevated
temperatures (Figure 3). As poikilotherms whose physiology is directly affected by
external climatic conditions, monarchs should exhibit decreased development time with
increasing temperatures. When individuals exposed to elevated temperatures take more
degree days to develop to adulthood than control, this suggests that these elevated
temperatures are negatively affecting their ability to develop.
When total degree days were recalculated to exclude daytime hours exposed to
elevated temperatures, for most treatment combinations the total degree days did not
differ from control, suggesting that their development stopped during exposure to
elevated temperatures. But, the model in which we assumed that no development
occurred during the heat treatment was less accurate for longer exposure times,
suggesting that after a certain amount of time under unfavorable conditions, they cannot
delay development or confine it to more favorable nighttime hours any longer (Figure 3c,
3d). Larvae exposed to 38oC in all stadia developed under hot conditions when exposed
for 6 days, but when exposed to 40oC only those exposed during the fifth stadium
developed in unfavorable conditions. The larvae may be able to gauge the risks of
delaying development against the risks of developing in increasingly elevated
temperatures, or they could be acclimating to the increased temperature.
When treatment temperatures were adjusted to calculate degree days, an adjusted
temperature of 22oC removed any significant differences in development time between
treatment and control individuals in the 38oC cohort. This indicates that when exposed to

44
daytime temperatures of 38oC, monarch larvae develop as slowly as if it were 22
oC. For
individuals exposed to 40oC during the day, no adjusted temperature completely removed
all significant differences between treatment and control individuals. Still, 22oC
eliminated most, leaving only first instars exposed for 6 days and third instars exposed
for 4 days with longer development times than control. This further indicates that
monarch larvae are particularly vulnerable to heat stress during these stadia.
By examining developmental gains throughout their life cycle, we determined that
developmental delays largely occurred only while an individual was exposed to heat
stress (Table 5). Once the immature monarch returned to control conditions, its
development time returned to normal pace. We observed first stadium larvae under the
shade of the container label and older larvae under leaves or under the filter papers at the
bottom of the container. Individuals also seemed to eat less, if at all, under treatment
conditions. These behaviors were recorded only anecdotally but suggest behavioral
changes in response to elevated temperatures that should be explored further. These
responses mimic immature monarch behavior under natural conditions, when larvae often
hide under leaves or even in leaf litter during the hottest part of the day (Michelle
Solensky, personal communication). Developmental delays resulting in additional time
spent as an immature could lead to an increased risk of predation during a particularly
vulnerable stage; the 24-hr mortality rate of first instar larvae is 40% (Alma DeAnda
2010) and less than 12% of eggs survive to the fifth instar (Oberhauser et al. 2001).
Increased nighttime temperatures also pose a risk to monarchs. York and
Oberhauser (2002) showed that monarchs exposed to a constant 36oC died before
adulthood, while single and repeated 12 hour pulses of 36oC show no increased mortality.

45
These findings, coupled our data showing survivorship up to 42oC when nighttime
temperatures were 25oC, indicates that a decrease in temperature at night is necessary to
cope with extreme temperatures. Nighttime temperatures up to 34oC did not lead to
increased mortality in other treatments of short duration (1 or 2 days), suggesting that any
decrease in temperature from daytime to nighttime is beneficial in the short term, as long
as nighttime temperatures drop below the 36oC threshold reported by York and
Oberhauser (2002) and Zalucki (1982). However, increased mortality occurred after 4 or
6 days of exposure to high nighttime temperatures (Figure 4).
Our findings indicate that, while monarchs can survive temperatures above the
previously assessed limit of 36oC (York and Oberhauser 2002), mortality estimates
should also consider other factors. Individuals exposed to elevated temperatures present a
decreased ability to pupate without falling, decreased adult mass, and increased
development time. There are serious effects of heat stress on monarch larvae making their
ability to cope with climate change in question.2
2 ACKNOWLEDGEMENTS: Thank you to Emily Nimmer and Grant Bowers for your help
rearing larvae. This work is supported by a grant from the National Science Foundation
(DBS-0710343).

46
REFERENCES
Alonso-Mejia, A., E. Rendon-Salinas, E. Montesinos-Patino and L. P. Brower. 1997. Use
of lipid reserves by monarch butterflies overwintering in Mexico: implications for
conservation. Ecological Applications. 7: 934-947.
Arango, N. V. 1996. Stabilizing Selection in Migratory Butterflies: A Comparative Study
of Queen and Monarch Butterflies. Masters thesis, Univ. of Florida (Gainesville).
Batalden, R., K. Oberhauser and A. T. Peterson. 2007. Ecological niches in sequential
generations of eastern North American monarch butterflies (Lepidoptera:
Danaidae): the ecology of migration and likely climate change implications. Env.
Ent. 36: 1365-1373.
Crozier, L. G. 2004. Field transplants reveal summer constraints on a butterfly range
expansion. Oecologia. 141: 148-157.
DeAnda, A. 2010. The effect and importance of natural enemies on immature monarch
(Danaus plexippus) populations. Masters thesis, Univ. of Minnesota (Twin
Cities).
Goehring, L. and K. S. Oberhauser. 2002. Effects of photoperiod, temperature, and host
plant age on induction of reproductive diapause and development time in Danaus
plexippus. Ecol. Ent. 27: 674-685.
Goehring, L. and K. S. Oberhauser. 2004. Environmental factors influencing postdiapause
reproductive development in monarch butterflies. in K. S. Oberhauser and M. J.
Solensky (eds.), Monarch Butterfly Biology and Conservation. Cornell University
Press, Ithaca, NY.
Hartl FU. 1996. Molecular chaperones in cellular protein folding. Nature 381: 571–80.
Holt, R. D. 1990. The microevolutionary consequences of climate change. Trends Ecol.
Evol 5: 311-315.
Huey RB. 1991. Physiological consequences of habitat selection. Am. Nat. 137: S91–
115.
IPCC. 2007. Climate Change 2007: The Physical Science Basis. Contribution of Working
Group I to the Fourth Assessment Report of the Intergovernmental Panel on
Climate Change. Solomon, S., D. Qin, M. Manning, Z. Chen, M. Marquis, K.B.
Averyt, M.Tignor and H.L. Miller (eds.). Cambridge University Press,
Cambridge, United Kingdom and New York, NY, USA.
Lindquist S. 1986. The heat-shock response. Annu. Rev. Biochem. 55: 1151–91

47
Masters, A. R., S. B. Malcolm and L. P. Brower. 1988. Monarch butterfly (Danaus
plexippus) thermoregulatory behavior and adaptations for overwintering in
Mexico. Ecology 69: 458-467.
Masters, A. R. 1993. Temperature and thermoregulation in the monarch butterfly. in S. B.
Malcolm and M. P. Zalucki (eds.), Biology and Conservation of the Monarch
Butterfly. Natural History Museum of Los Angeles County, Los Angeles,
California.
Monarch Larva Monitoring Project. 2011. www.mlmp.org.
Oberhauser, K. S. 1997. Fecundity, Lifespan and Egg Mass in Butterflies: Effects of
male-derived nutrients and females size. Func. Ecol. 11: 166-175.
Oberhauser, K. S., M. D. Prysby, H. R. Mattila, D. E. Stanley-Horn, M. K. Sears, G.
Dively, E. Olson, J. M. Pleasants, W. F. Lam and R. L. Hellmich. 2001. Temporal
and spatial overlap between monarch larvae and corn pollen. Proc. Natl. Acad.
Sci. 98: 11913-11918.
Oberhauser, K. and A. T. Peterson. 2003. Modeling current and future potential wintering
distributions of eastern North American monarch butterflies. Proc. Natl. Acad.
Sci. 100: 14063-14068.
Parmesan, C., N. Ryrholm, C. Stefanescus, J. K. Hill, C. D. Thomas, H. Descimon, B.
Huntley, L. Kaila, J. Kullberg, T. Tammaru, et al. 1999. Poleward shifts in
geographical ranges of butterfly species associated with regional warming.
Nature. 399: 579-583.
Parmesan, C. and G. Yohe. 2003. A globally coherent fingerprint of climate change
impacts across natural systems. Nature 421: 37-42.
Prysby, M. D. and K. Oberhauser. 2004. Temporal and Geographic Variation in Monarch
Densities: citizen scientists document monarch population patterns, pp. 9-20. in K. S.
Oberhauser and M. J. Solensky (eds.), Monarch Butterfly Biology and Conservation.
Cornell University Press, Ithaca, NY.
Solensky, M. J. and K. S. Oberhauser. 2009. Male monarch butterflies, Danaus
plexippus, adjust ejaculates in response to intensity of sperm competition. Anim.
Beh. 77: 465-472.
Van Hook, T. 1996. Monarch Butterfly Mating Ecology at a Mexican Overwintering
Site: Proximate causes of non-random mating. Ph.D. thesis, Univ. of Florida
(Gainesville).

48
York, H. A. and K. S. Oberhauser. 2002. Effects of duration and timing of heat stress on
Monarch Butterfly (Danaus plexippus) (Lepidoptera: Nymphalidae) development.
J. Kans. Entomol. Soc. 75: 290-298.
Zalucki, M. P. 1981. The effects of age and weather on egg laying in Danaus plexippus
L. (Lepidoptera: Danaidae). Res. Popul. Ecol. 23: 318-327.
Zalucki, M. P. 1982. Temperature and rate of development in Danaus plexippus L. and
D. chrysippus L. (Lepidoptera: Nymphalidae) J. Aust. Entomol. Soc. 21: 241-46.
Zalucki, M. P. and R. L. Kitching. 1982. Temporal and spatial variation of mortality in
field populations of Danaus plexippus L. and D. chrysippus L. larvae
(Lepidoptera: Nymphalidae) Oecologia 53: 201-207.
Zalucki, M. P. and W. A. Rochester. 2004. Spatial and temporal population dynamics of
monarchs down-under: lessons for North America, pp. 219-228. In K.
Oberhauser, and M. J. Solensky (eds.), Monarch Butterfly Biology and
Conservation. Cornell University Press, Ithaca, NY.

49
Table 2.1: Model results for the analysis of survival probability by treatment temperature,
timing and duration. Corresponds to Figure 2.1.
Term Estimate Std Error ChiSquare Prob>ChiSq
Intercept 0.11 0.12 0.83 0.36
Temperature(40) 1.05 0.16 42.27 <0.0001
Temperature(42) -3.02 0.22 183.06 <0.0001
Stadium(3) -0.11 0.17 0.40 0.53
Stadium(5) 0.11 0.18 0.42 0.52
Duration(2) 0.43 0.23 3.53 0.06
Duration(4) 0.01 0.20 0.00 0.95
Duration(6) -0.98 0.20 24.37 <0.0001
Temperature(40)*Stadium(3) -0.54 0.22 6.02 0.01
Temperature(40)*Stadium(5) 0.40 0.24 2.74 0.10
Temperature(42)*Stadium(3) 0.12 0.31 0.14 0.71
Temperature(42)*Stadium(5) -0.28 0.34 0.70 0.40
Stadium(3)*Duration(2) -0.60 0.30 4.09 0.04
Stadium(3)*Duration(4) 0.61 0.28 4.56 0.03
Stadium(3)*Duration(6) -0.75 0.29 6.86 0.01
Stadium(5)*Duration(2) 1.03 0.37 7.81 0.01
Stadium(5)*Duration(4) -0.32 0.29 1.22 0.27
Stadium(5)*Duration(6) -0.06 0.28 0.05 0.83

50
Table 2.2: Model results for the analysis of probability of falling by treatment timing and
duration. Corresponds to Figure 2.2.
Term Estimate Std Error ChiSquare Prob>ChiSq
Intercept -0.71 0.12 36.79 <.0001
Temperature(40) -0.12 0.11 1.01 0.31
Stadium(3) 0.14 0.16 0.69 0.41
Stadium(5) 0.40 0.16 6.16 0.01
Duration(2) -0.15 0.19 0.58 0.45
Duration(4) 0.26 0.19 1.81 0.18
Duration(6) 0.27 0.22 1.50 0.22
Stadium(3)*Duration(2) 0.23 0.27 0.74 0.39
Stadium(3)*Duration(4) 0.15 0.26 0.31 0.58
Stadium(3)*Duration(6) -0.85 0.32 6.89 0.01
Stadium(5)*Duration(2) -0.68 0.27 6.16 0.01
Stadium(5)*Duration(4) 0.39 0.26 2.20 0.14
Stadium(5)*Duration(6) 0.99 0.30 10.96 0.001

51
Table 2.3: Male and female adult mass and right wing length by treatment temperature.
Different letters indicate treatments that are significantly different from one another
(p<0.05).
Variable Treatment
Male mass
(grams)
(SE)
Female
mass
(grams)
(SE)
Male RWL
(mm) (SE)
Female
RWL (mm)
(SE)
38 0.59
(0.006)a
0.55
(0.007)a
52.40
(0.22)a
51.99
(0.23)a
40 0.57
(0.007)b
0.52
(0.007)b
51.67
(0.24)b
51.23
(0.24)b
42 0.52
(0.025)c
0.49
(0.023)b
49.98
(0.86)b
50.81
(0.83)ab
Temperature
(oC)
44 - - - -
Control - 0.61 (0.02)a 0.57
(0.02)a
51.24
(0.64)ab
51.27
(0.55)ab

52
Table 2.4: Model results for the analysis of development time (growing degree days and adjusted growing degree days) by
treatment temperature, timing and duration. Corresponds to Figure 2.3.
Development Time (Degree Days)
Adjusted Development Time (no
heat) Adjusted Development Time (22oC)
Term Estimate
Std
Error t Ratio Prob>t Estimate
Std
Error t Ratio Prob>t Estimate
Std
Error t Ratio Prob>t
Intercept 339.43 0.70 481.90 0.00 295.50 0.70 424.76 0.00 305.75 0.70 439.49 0.00
Treatment(40) 5.15 0.70 7.32 <0.0001 3.59 0.70 5.15 <0.0001 3.59 0.70 5.15 <0.0001
Stadium (3) 0.66 1.06 0.62 0.53 0.71 1.04 0.68 0.50 0.71 1.04 0.68 0.50
Stadium (5) -6.74 0.97 -6.96 <0.0001 -6.69 0.96 -6.99 <0.0001 -6.69 0.96 -6.99 <0.0001
Duration(2) -11.53 1.17 -9.86 <0.0001 5.40 1.15 4.68 <0.0001 5.15 1.15 4.46 <0.0001
Duration(4) 6.08 1.16 5.23 <0.0001 -3.99 1.15 -3.47 0.00 5.76 1.15 5.01 <0.0001
Duration(6) 26.18 1.36 19.22 <0.0001 -10.88 1.35 -8.09 <0.0001 8.87 1.35 6.59 <0.0001
Treatment(40)*Stadium(3) 0.41 1.06 0.39 0.70 0.36 1.04 0.34 0.73 0.36 1.04 0.34 0.73
Treatment(40)*Stadium(5) -0.39 0.97 -0.40 0.69 -0.45 0.96 -0.47 0.64 -0.45 0.96 -0.47 0.64
Treatment(40)*Duration(2) 0.64 1.17 0.54 0.59 1.21 1.15 1.04 0.30 1.21 1.15 1.04 0.30
Treatment(40)*Duration(4) -0.82 1.16 -0.70 0.48 -1.25 1.15 -1.09 0.28 -1.25 1.15 -1.09 0.28
Treatment(40)*Duration(6) 5.74 1.36 4.22 <0.0001 4.31 1.35 3.21 0.00 4.31 1.35 3.21 0.00
Stadium(3)*Duration(2) -2.24 1.73 -1.29 0.20 -2.29 1.71 -1.34 0.18 -2.29 1.71 -1.34 0.18
Stadium(3)*Duration(4) 6.73 1.66 4.05 <0.0001 6.68 1.64 4.07 <0.0001 6.68 1.64 4.07 <0.0001
Stadium(3)*Duration(6) 0.35 2.17 0.16 0.87 0.29 2.14 0.14 0.89 0.29 2.14 0.14 0.89
Stadium(5)*Duration(2) 3.79 1.60 2.37 0.02 3.74 1.58 2.36 0.02 3.74 1.58 2.36 0.02
Stadium(5)*Duration(4) -4.54 1.64 -2.77 0.006 -4.60 1.62 -2.84 0.00 -4.60 1.62 -2.84 0.00
Stadium(5)*Duration(6) -3.62 1.82 -1.99 0.047 -3.68 1.80 -2.05 0.04 -3.68 1.80 -2.05 0.04
Treatment(40)*Stadium(3)*Duration(2) 2.98 1.73 1.72 0.087 3.03 1.71 1.77 0.08 3.03 1.71 1.77 0.08
Treatment(40)*Stadium(3)*Duration(4) 0.62 1.66 0.37 0.71 0.68 1.64 0.41 0.68 0.68 1.64 0.41 0.68
Treatment(40)*Stadium(3)*Duration(6) -3.05 2.17 -1.41 0.16 -3.00 2.14 -1.40 0.16 -3.00 2.14 -1.40 0.16
Treatment(40)*Stadium(5)*Duration(2) -0.28 1.60 -0.17 0.86 -0.22 1.58 -0.14 0.89 -0.22 1.58 -0.14 0.89
Treatment(40)*Stadium(5)*Duration(4) 0.95 1.64 0.58 0.56 1.01 1.62 0.62 0.53 1.01 1.62 0.62 0.53
Treatment(40)*Stadium(5)*Duration(6) -3.80 1.82 -2.09 0.038 -3.74 1.80 -2.08 0.04 -3.74 1.80 -2.08 0.04
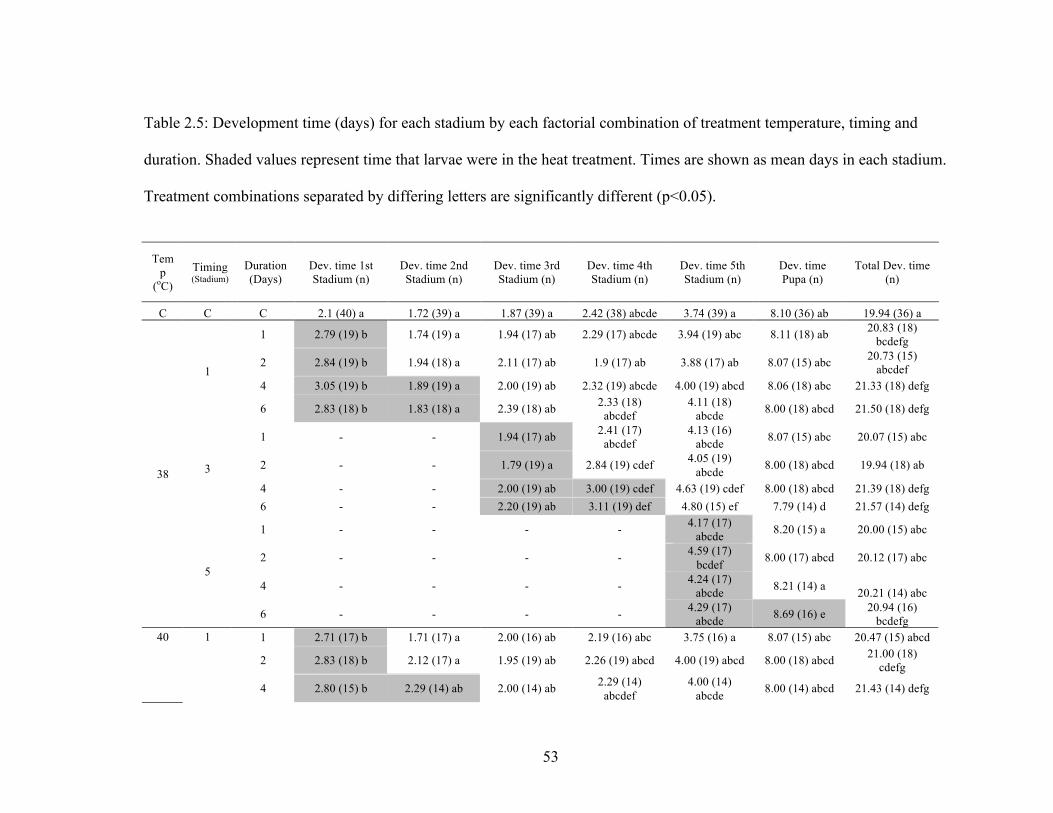
53
Table 2.5: Development time (days) for each stadium by each factorial combination of treatment temperature, timing and
duration. Shaded values represent time that larvae were in the heat treatment. Times are shown as mean days in each stadium.
Treatment combinations separated by differing letters are significantly different (p<0.05).
Tem
p
(oC)
Timing (Stadium)
Duration
(Days)
Dev. time 1st
Stadium (n)
Dev. time 2nd
Stadium (n)
Dev. time 3rd
Stadium (n)
Dev. time 4th
Stadium (n)
Dev. time 5th
Stadium (n)
Dev. time
Pupa (n)
Total Dev. time
(n)
C C C 2.1 (40) a 1.72 (39) a 1.87 (39) a 2.42 (38) abcde 3.74 (39) a 8.10 (36) ab 19.94 (36) a
1 2.79 (19) b 1.74 (19) a 1.94 (17) ab 2.29 (17) abcde 3.94 (19) abc 8.11 (18) ab 20.83 (18)
bcdefg
2 2.84 (19) b 1.94 (18) a 2.11 (17) ab 1.9 (17) ab 3.88 (17) ab 8.07 (15) abc 20.73 (15)
abcdef
4 3.05 (19) b 1.89 (19) a 2.00 (19) ab 2.32 (19) abcde 4.00 (19) abcd 8.06 (18) abc 21.33 (18) defg
1
6 2.83 (18) b 1.83 (18) a 2.39 (18) ab 2.33 (18)
abcdef
4.11 (18)
abcde 8.00 (18) abcd 21.50 (18) defg
1 - - 1.94 (17) ab 2.41 (17)
abcdef
4.13 (16)
abcde 8.07 (15) abc 20.07 (15) abc
2 - - 1.79 (19) a 2.84 (19) cdef 4.05 (19)
abcde 8.00 (18) abcd 19.94 (18) ab
4 - - 2.00 (19) ab 3.00 (19) cdef 4.63 (19) cdef 8.00 (18) abcd 21.39 (18) defg
3
6 - - 2.20 (19) ab 3.11 (19) def 4.80 (15) ef 7.79 (14) d 21.57 (14) defg
1 - - - - 4.17 (17)
abcde 8.20 (15) a 20.00 (15) abc
2 - - - - 4.59 (17)
bcdef 8.00 (17) abcd 20.12 (17) abc
4 - - - - 4.24 (17)
abcde 8.21 (14) a
20.21 (14) abc
38
5
6 - - - - 4.29 (17)
abcde 8.69 (16) e
20.94 (16)
bcdefg
1 2.71 (17) b 1.71 (17) a 2.00 (16) ab 2.19 (16) abc 3.75 (16) a 8.07 (15) abc 20.47 (15) abcd
2 2.83 (18) b 2.12 (17) a 1.95 (19) ab 2.26 (19) abcd 4.00 (19) abcd 8.00 (18) abcd 21.00 (18)
cdefg
40 1
4 2.80 (15) b 2.29 (14) ab 2.00 (14) ab 2.29 (14)
abcdef
4.00 (14)
abcde 8.00 (14) abcd 21.43 (14) defg

54
6 2.84 (19) b 2.89 (18) b 2.69 (15) b
2.67 (15)
abcdef
4.13 (15)
abcde 8.00 (15) abcd 23.40 (15) h
1 - - 2.61 (17) b 1.82 (17) a 4.12 (17)
abcde 8.20 (15) a 19.93 (15) ab
2 - - 2.53 (13) ab 2.77 (13)
abcdef
4.00 (12)
abcde 8.18 (11) a
21.00 (11)
bcdefg
4 - - 2.61 (19) b 3.21 (19) f 4.22 (18)
abcde 7.88 (17) bcd 21.82 (17) g
3
6 - - 2.59 (13) b 3.23 (13) ef 4.67 (6)
abcdef 7.75 (4) bcd 22.25 (4) efgh
1 - - - - 4.56 (18)
bcdef 8.18 (17) a 20.24 (17) abc
2 - - - - 5.05 (20) f 7.85 (20) cd 20.65 (20)
abcde
4 - - - - 5.21 (19) f 8.00 (17) abcd 20.59 (17)
abcde
5
6 - - - - 5.31 (13) f 8.67 (12) e 21.42 (12) defg
1 3.80 (5) b 1.80 (5) ab 2.20 (5) ab 1.8 (5) abcdef 4.80 (5)
abcdef 8.00 (4) abcd 22.50 (4) gh
2 5.00 (1) 1.00 (1) 2.00 (1) 2.00 (1) 5.00 (1) 8.00 (1) 23.00 (1)
4 - - - - - - -
1
6 - - - - - - -
1 - - 2.60 (5) ab 3.20 (5) bcdef 4.20 (5)
abcdef 7.8 (5) bcd
22.2 (5) fgh
2 - - 3.00 (1) 5.00 (1) 3.00 (1) 8.00 (1) 23.00 (1)
4 - - - - - - -
3
6 - - - - - - -
1 - - - - 3.50 (2) 8.00 (2) 20.50 (2)
2 - - - - 5.33 (3) def 7.67 (3) cd 21.00 (3)
abcdefg
4 - - - - - - -
42
5
6 - - - - - - -

55
Table 2.6: Model results for the analysis of survival by treatment duration, temperature
and timing (temperatures indicate nighttime temperature; for all treatments day time
temperature = 38OC). Corresponds to Figure 2.4.
Term Estimate
Std
Error ChiSquare Prob>ChiSq
Intercept 1.13 0.13 79.52 <0.0001
Temperature(32) 0.47 0.16 9.06 0.0026
Temperature(34) -1.07 0.19 30.06 <0.0001
Stadium(3) 0.49 0.16 9.13 <0.0025
Stadium(5) 0.82 0.17 23.53 <0.0001
Duration(2) 0.57 0.22 6.68 0.0097
Duration(4) -0.57 0.18 10.33 0.0013
Duration(6) -0.78 0.18 19.86 <0.0001
Temperature(32)*Stadium(3) -0.88 0.21 17.34 <0.0001
Temperature(32)*Stadium(5) -0.53 0.22 5.61 0.018
Temperature(34)*Stadium(3) 0.80 0.24 10.66 0.0011
Temperature(34)*Stadium(5) 1.41 0.27 28.24 <0.0001
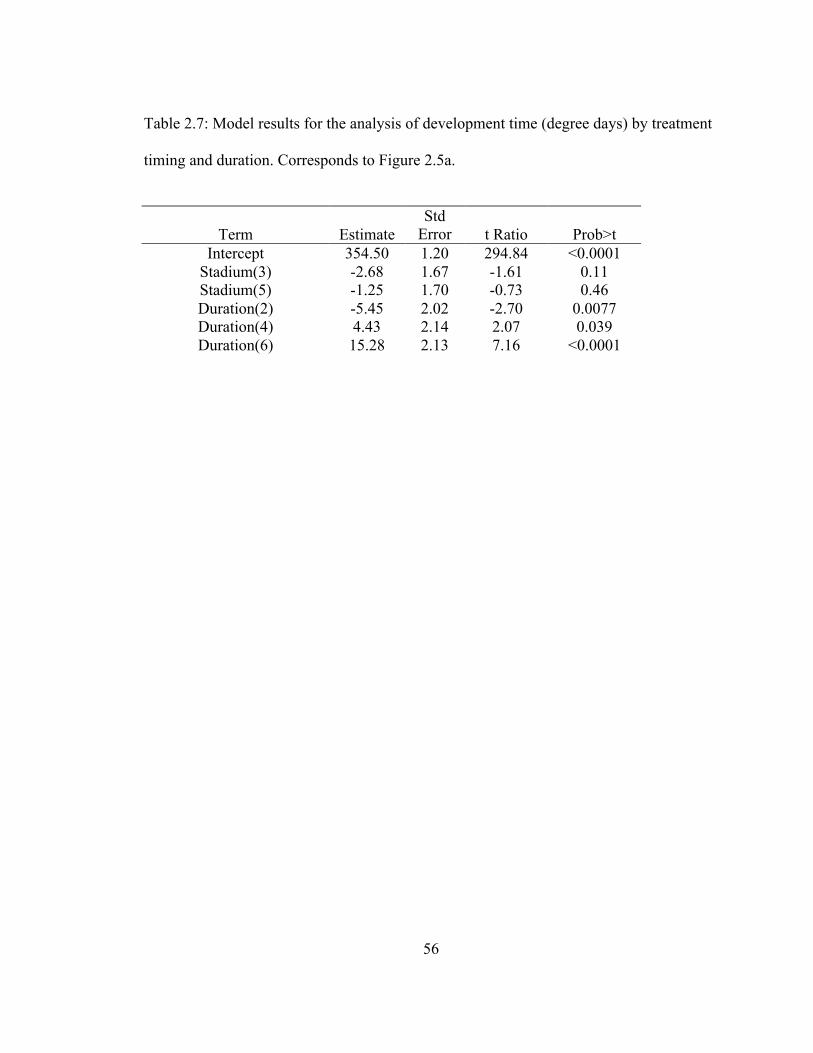
56
Table 2.7: Model results for the analysis of development time (degree days) by treatment
timing and duration. Corresponds to Figure 2.5a.
Term Estimate
Std
Error t Ratio Prob>t
Intercept 354.50 1.20 294.84 <0.0001
Stadium(3) -2.68 1.67 -1.61 0.11
Stadium(5) -1.25 1.70 -0.73 0.46
Duration(2) -5.45 2.02 -2.70 0.0077
Duration(4) 4.43 2.14 2.07 0.039
Duration(6) 15.28 2.13 7.16 <0.0001

57
Table 2.8: Model results for the analysis of development time (degree days) by treatment
timing and duration. Corresponds to Figure 2.5b.
Term Estimate Std Error t Ratio Prob>t
Intercept 348.84 1.13 309.68 <0.0001
Stadium(3) 0.19 1.65 0.12 0.91
Stadium(5) -1.38 1.56 -0.89 0.38
Duration(2) -10.17 1.84 -5.52 <0.0001
Duration(4) 6.01 1.95 3.08 0.0024
Duration(6) 21.15 2.14 9.88 <0.0001
Stadium(3)*Duration(2) -2.45 2.62 -0.93 0.35
Stadium(3)*Duration(4) 8.72 2.80 3.11 0.0022
Stadium(3)*Duration(6) -5.50 3.30 -1.67 0.0974
Stadium(5)*Duration(2) 7.29 2.57 2.84 0.0051
Stadium(5)*Duration(4) -6.24 2.75 -2.27 0.025
Stadium(5)*Duration(6) -2.67 2.83 -0.94 0.35

58
Table 2.9: Model results for the analysis of development time (degree days) by treatment
timing and duration. Corresponds to Figure 2.5c.
Term Estimate Std Error t Ratio Prob>t
Intercept 360.23 1.98 181.93 <0.0001
Stadium(3) 7.19 1.98 3.63 0.0005
Duration(2) -13.67 3.25 -4.21 <0.0001
Duration(4) -0.080 3.57 -0.02 0.98
Duration(6) 38.02 3.64 10.45 <0.0001
Stadium(3)*Duration(2) -0.92 3.25 -0.28 0.78
Stadium(3)*Duration(4) -7.84 3.57 -2.20 0.03
Stadium(3)*Duration(6) 10.67 3.64 2.93 0.0042

59
Figure 2.1a
Figure 2.1b
0!
0.2!
0.4!
0.6!
0.8!
1!
1.2!
First! Third! Fifth! Control!
Surv
ival
(pro
port
ion)!
Timing of Treatment at 38oC (Stadium)!
1 Day!
2 Days!
4 Days!
6 Days!
Control!
0!
0.2!
0.4!
0.6!
0.8!
1!
1.2!
First! Third! Fifth! Control!
Surv
ival
(pro
port
ion)!
Timing of Treatment at 40oC (Stadium)!
1 Day!
2 Days!
4 Days!
6 Days!
Control!
*
**
*

60
Figure 2.1c
Figure 2.1: Probability of survival by treatment timing and duration for 38oC (1a), 40
oC
(1b) and 42oC (1c) (R
2=0.46, d.f.=17, x
2=444.76, p<0.0001). * and ** indicates treatment
combination is significantly different from control with p<0.05 and p<0.01, respectively.
0!
0.2!
0.4!
0.6!
0.8!
1!
First! Third! Fifth! Control!
Surv
ival
(pro
port
ion)!
Timing of Treatment at 42oC (Stadium)!
1 Day!
2 Days!
4 Days!
6 Days!
Control!
**
**
**
**
**
**

61
Figure 2.2: Probability pupa fell (and needed to be taped to container lid) by treatment
timing and duration (R2 = 0.0895, x
2 = 45.50, d.f. = 12, p-value < 0.0001). * indicates
treatment combination is significantly different from control with p<0.05.
0!
0.2!
0.4!
0.6!
0.8!
1!
1! 3! 5! Control!
Pupa
that
fel
l (p
roport
ion)!
Timing of Treatment (Stadium)!
1 Day!
2 Days!
4 Days!
6 Days!
Control!
*
*
*
*
*

62
Figure 2.3a
Figure 2.3b
300!
320!
340!
360!
380!
400!
First! Third! Fifth! Control!
Dev
elopm
ent
Tim
e (D
egre
e D
ays)!
Timing of Treatment at 38oC (Stadium)!
1 Day!
2 Days!
4 Days!
6 Days!
Control!
300!
320!
340!
360!
380!
400!
First! Third! Fifth! Control!
Dev
elopm
ent
Tim
e (D
egre
e D
ays)!
Timing of Treatment at 40oC (Stadium)!
1 Day!
2 Days!
4 Days!
6 Days!
Control!
*
*
*
*
*
*
*
*
*
* *
*
*
*
*
*
*
*
*
*
*
*

63
*
Figure 2.3c
Figure 2.3d
240!
260!
280!
300!
320!
340!
First! Third! Fifth! Control!
Adju
sted
Dev
elopm
ent
Tim
e--n
o h
eat
(Deg
ree
Day
s)!
Timing of Treatment at 38oC (Stadium)!
1 Day!
2 Days!
4 Days !
6 Days!
Control!
240!
260!
280!
300!
320!
340!
First! Third! Fifth! Control!
Adju
sted
Dev
elopm
ent
Tim
e--n
o h
eat
(Deg
ree
Day
s)!
Timing of Treatment at 40oC (Stadium)!
1 Day!
2 Days!
4 Days !
6 Days!
Control!
* * *
*
* *

64
Figure 2.3e
Figure 2.3f
250!
270!
290!
310!
330!
350!
1! 3! 5! Control!
Adju
sted
Dev
elopm
ent
Tim
e--2
2oC
(D
egre
e D
ays)!
Timing of Treatment at 38oC (Stadium)!
1 Day!
2 Days!
4 Days!
6 Days!
Control!
250!
270!
290!
310!
330!
350!
1! 3! 5! Control!
Adju
sted
Dev
elopm
ent
Tim
e--2
2oC
(D
egre
e D
ays)!
Timing of Treatment at 40oC (Stadium)!
1 Day!
2 Days!
4 Days!
6 Days!
Control!
!!!!!!!!!!"!
##!!!!!!!!!!!!!!!!!!!!!!!!!!"!

65
Figure 2.3: Development time, measured in degree days, by treatment timing and
duration at 38oC (a) and 40
oC (b) (F = 36.19, d.f. = 23, 347, p-value = <0.0001). Adjusted
development time, measured by not including time spent at elevated temperatures, by
treatment timing and duration at 38oC (c) and 40
oC (d) (F = 13.42, d.f. = 23, 347, p-value
= <0.0001). Adjusted development time, calculated by substituting 22oC for both
elevated temperatures of 38oC and 40
oC, by treatment timing and duration at 38
oC (e) and
40oC (f) (F = 19.62, d.f. = 23, 347, p-value = <0.0001). * indicates treatment combination
is significantly different from control with p<0.05.

66
Figure 2.4a
Figure 2.4b
Figure 2.4: Probability of survival by duration (a) and by temperature and timing (b)
(R2=0.315, d.f.=11, x
2=252.63, p<0.0001). * and ** indicates treatment combination is
significantly different from control with p<0.05 and p<0.01, respectively.
0!
0.2!
0.4!
0.6!
0.8!
1!
1! 2! 4! 6! Control!
Surv
ival
(pro
port
ion)!
Duration of Treatment (Days)!
0!
0.2!
0.4!
0.6!
0.8!
1!
30! 32! 34! Control!
Surv
ival
(pro
port
ion)!
Treatment Temperature (oC)!
First!
Third!
Fifth!
Control!
*
*
**

67
Figure 2.5a
Figure 2.5b
300!
320!
340!
360!
380!
400!
First! Third! Fifth! Control!
Dev
elopm
ent
Tim
e (D
egre
e D
ays)!
Timing of Treatment at 30oC (Stadium)!
1 Day!
2 Days!
4 Days!
6 Days!
Control!
300!
320!
340!
360!
380!
400!
First! Third! Fifth! Control!
Dev
elopm
ent
Tim
e (D
egre
e D
ays)!
Timing of Treatment at 32oC (Stadium)!
1 Day!
2 Days!
4 Days!
6 Days!
Control!
*
*
*
*
*
*
*
*
*
* *
*
*
* *

68
Figure 2.5c
Figure 2.5: Development time (degree days) by treatment timing and duration at
nighttime temperatures of 30oC (a) (F=17.83, d.f.=5, 185, p<0.0001), 32
oC (b) (F=17.61,
d.f.=11.182, p<0.0001) and 34oC (c) (F=20.79, d.f.=7, 93, p<0.0001). Daytime
temperatures for all treatments were 38oC.
300!
320!
340!
360!
380!
400!
420!
Third! Fifth! Control!
Dev
elopm
ent
Tim
e (D
egre
e D
ays)!
Timing of Treatment at 34oC (Stadium)!
1 Day!
2 Days!
4 Days!
6 Days!
Control!
!!!!!!!!!!!!!!!!!!!!!!!!!!"!
!!!!!!!!!!!!!!!!!!!!!!!!!!!!!!!"!
!!!!!!!!!"!
!!!!!!!!!!!!!!!!!!!!"!!!!!!!!!!!
!!!!!!!!!!!"!

69
CHAPTER 3
Potential Changes to the Eastern North American Monarch Butterfly Migration in
Response to an Introduced Milkweed, Asclepias curassavica
SUMMARY
Climate change threatens the monarch butterfly migration; hotter summers may
necessitate a longer and faster migration and the overwintering grounds in Mexico may
become unsuitable. To assess the monarch butterfly’s potential to cope with a changing
climate and adjust its migration, I aimed to identify any level of plasticity currently
present in the migration. The Monarch Larva Monitoring Project (MLMP), a citizen-
science program, indicates eggs and larvae present in Texas in the fall when monarchs
are migrating supposedly in a state of reproductive arrest, diapause. Here, I investigate
whether some monarchs are breaking diapause in Texas in response to an introduced
milkweed, Asclepias curassavica, or whether some are failing to enter diapause in their
natal grounds and are migrating while reproducing. I analyzed MLMP data throughout
the monarch migration flyway, surveyed native and introduced milkweeds in Texas and
exposed migratory butterflies to native and introduced milkweeds to assess their
reproductive response. MLMP data show a correlation between latitude and a second
peak in eggs, suggesting that monarchs could be laying eggs as they travel south,
supporting the hypothesis that some butterflies are not in diapause while migrating.
MLMP data and my field studies also suggest that the introduced milkweed is in better

70
health and preferred by egg-laying females in the fall, indicating that it could be
influencing migrating females. The reproductive response experiment suggested that only
a small proportion of the population may be responding the changing milkweed cues, but
as the entire population funnels through Texas on its way to the overwintering habitat,
any perturbations here could have population wide effects. This research indicates that
there is variability in monarch migratory and reproductive behavior that could allow this
species to adjust to future climate change.
INTRODUCTION
Each fall, monarch butterflies undertake one of the most well-known insect
migrations. As they fly up to 4500 km from their breeding grounds throughout eastern
North America to their overwintering habitat in Mexico, most butterflies are thought to
be in a state of reproductive diapause (Brower 1985, 1995). They will remain in this
juvenile state throughout the winter, until they travel north in the spring to lay eggs in the
southern United States. Being in diapause allows individuals to conserve as much energy
as possible and to survive the long migration and winter (Herman 1981, Herman and
Tatar 2001), and allows them to put off reproduction until conditions are favorable.
The monarch migration is threatened by climate change. Current over-wintering
sites in Mexico are predicted to be unsuitable for monarchs in 50 years (Oberhauser and
Peterson 2003). Already, a January 2002 winter storm marked by extreme cold and
precipitation caused the most severe winter kill of monarchs known, with 70-80%
mortality in two major over-wintering colonies (Brower et al. 2004), and the frequency of

71
such storms is predicted to increase with climate change (Oberhauser and Peterson 2003).
Ecological niche models predict severe northward shifts in the location of summer
breeding habitat, especially during July and August, when the population is probably
increasing in size prior to the fall migration (Batalden et al. 2007). This will necessitate a
longer and faster migration, and with the availability of overwintering sites in a changed
climate in question, the Eastern North American monarch population is likely to need
some level of plasticity in their migration to ensure their survival.
There is some evidence that monarchs are capable of changing their migration
patterns and distributions over relatively short time-scales (Vane-Wright 1991).
Monarchs extended their range in the mid-19th
century to islands in the South Pacific and
arrived on Australia’s east coast around 1871 (Vane-Wright 1991, Zalucki and Clarke
2004, Clarke and Zalucki 2004). Until recently, many monarchs in Australia migrated to
avoid hot and dry summers (Dingle et al. 2000). Now increased irrigation from suburban
sprinklers allows milkweed to persist throughout the summers, and some monarchs in
Perth and Adelaide no longer migrate (Zalucki and Rochester 1999).
A similar phenomenon could be occurring in Texas. Monarchs are thought to be
absent throughout the summer and winter, yet Urquhart (1987) documented fall
reproduction in the southern United States and recent citizen-science monitoring efforts
show adults, eggs and larvae present in the fall and winter after being absent through
most of the summer (Prysby and Oberhauser 2004, Howard et al. 2010). Two non-
exclusive hypotheses could explain this fall breeding behavior. First, some monarchs may
fail to enter diapause in their natal grounds and lay eggs as they migrate southward, as

72
they do as they move northward during the spring migration. Calvert (1999) suggests this
scenario to explain the presence of eggs in the fall. Migratory behavior and diapause are
not always coupled (Perez and Taylor 2004, Zhu et al. 2009), allowing for the first
hypothesis. Second, some monarchs could be breaking diapause in response to
environmental cues as they migrate. Many gardens and parks in Texas contain Asclepias
curassavica, a species of milkweed native to Mexico, but not Texas. Because these
gardens are often watered and fertilized throughout the hot Texas summer, this
introduced milkweed persists into the fall, remaining healthy and possibly attractive to
migrating monarchs. This newly-available fall milkweed could provide environmental
cues that prompt some individuals to reproduce. Here, I investigate these two hypotheses
and attempt to determine whether this fall Texas generation continues the migration to
Mexico or remains to overwinter in Texas. Whether these fall reproducing monarchs
represent a shift due to an already changing climate or due to changes in biotic cues, this
behavior could indicate a level of plasticity in the monarch migration that will allow them
to cope with further environmental perturbations.
There is a third scenario where some monarchs are staying in Texas throughout
the summer, continuing to breed into the fall. However, since I am most interested in
changes to the fall migration, I will focus on individuals who are migrating and the two
hypotheses outlined above.
To test the first hypothesis that some monarchs are laying eggs as they migrate, I
used data from the Monarch Larva Monitoring Program (MLMP) to examine seasonal
patterns of egg densities and milkweed abundance across states along their migratory

73
route. To test the second hypothesis that introduced milkweed is affecting monarch fall
breeding, I also used MLMP data, coupled with a field study in Texas, to compare egg
densities, milkweed health and immature survival at MLMP sites with and without
Asclepias curassavica. Finally, I conducted experiments to assess adult and immature
monarch responses to milkweed quality and availability in Texas during the fall
migration, and to determine if monarchs stay in Texas through the winter or continue the
migration to Mexico.
METHODS
MLMP Data
MLMP methods are described elsewhere (Prysby and Oberhauser 2004,
www.mlmp.org). Those most relevant to this study are the methods for assessing egg
densities; volunteers survey a random selection of milkweed each week at a site of their
choosing (or survey all of their milkweed on smaller sites) and record the numbers of
eggs or larvae by stadium observed on these plants. Monitoring sites include gardens with
planted milkweed, natural areas, restored prairies, and other areas such as roadside
ditches. While they do not record the species of milkweed on which each monarch is
observed, they do report the species of milkweeds available at their site. They also report
management practices (fertilizing, weeding, and planting).
I used MLMP data to identify peak weeks of egg density (weeks that are preceded
and followed by multiple weeks of lower values) in three regions in the monarchs’ central
flyway (Howard and Davis 2009): northern, middle, and southern. I calculated weekly

74
regional egg densities by dividing the total number of eggs observed by MLMP
volunteers in a given region in a given week by the number of milkweed plants surveyed.
In most cases, these values are summed across years. I excluded weeks within regions if
fewer than three monitoring events occurred over all years. I identified peak weeks of egg
density across the following states, chosen because they represent the monarch’s central
flyway and have many MLMP monitoring sites: MN, WI, IA (northern region), IL, MO,
NE (middle region), and TX (southern region). Typically, when monarchs first arrive in
an area, egg density is very high, probably due to limited milkweed availability. This
marks the beginning of the first generation, and a second peak signals the second
generation (or second and third generation combined in the Upper Midwestern US). This
second peak in the Upper Midwestern US has been used as a general indicator of
monarch population size (Karen Oberhauser, personal communication). With the
exception of sites in TX, I only used MLMP site/year combinations when there were
continuous data from the monarchs’ spring arrival until the second peak, ensuring that I
was analyzing a true peak and not an artifact of erratic monitoring. However, in TX many
volunteers fail to monitor in the hot summer months, so this criterion would exclude most
sites. MLMP data from a typical TX monitoring location show a high first peak in the
spring, tapering off into nothing throughout the summer, then another peak in the fall. I
only included sites in TX that monitored at least one week before and after the fall peak,
again to ensure that I was analyzing a true peak in monarch abundance.
I also used MLMP data to estimate the change in relative availability of native
milkweed species and the introduced A. curassavica over the course of a season in Texas.

75
I identified 11 Texas sites that were monitored at minimum from April through
November in a single year. I calculated the mean number of plants examined per
monitoring session at each site for the entire year and the mean number examined per
session in each month, and divided the monthly mean by the yearly mean to obtain
relativized values. I then compared the relative abundance of milkweed on sites that did
and did not have A. curassavica to determine if these sites had relatively more milkweed
at different times over the course of the year.
Field Study
The methods I used followed closely the methods for MLMP volunteers. I
surveyed 14 sites in fall 2007, all within 230 km of San Antonio, Texas. I assessed
monarch egg and larval densities on every milkweed plant at each site. I recorded a
condition rating for each plant with categorical values of 1 = <5, 2 = 5-40, 3 = 41-80, and
4 = 81-100 percent yellowed or dying leaves. I estimated herbivory damage for each
monitored plant with another categorical scale of 1 = 0, 2 = <5, 3 = 5-25, and 4 = >25
percent eaten leaves. I also measured plant height and the immediate milkweed density
for each plant (the number of milkweeds within a square meter).
I collected all monarch eggs and larvae observed on native and non-native
milkweed, and reared them outdoors in a shady spot in a residential yard near San
Antonio, Texas. Larvae were grouped by collection site and placed in either a deli
container (500 ml) with a ventilated lid, a large plastic bin (6 l) with a mesh top or a mesh
cage (0.67 x 0.67 x 0.67 m), depending on the age and number of individuals per group.
Larvae were fed leaves from collected and purchased A. curassavica plants. When they

76
emerged as adults, the monarchs were shipped overnight to Minnesota. Immediately upon
arrival, I placed them in mesh cages in a greenhouse with 16-hours of light per day to
assess their reproductive status. If males mated, they were considered reproductive.
Males that did not mate were considered to be in diapause. If females mated and
subsequently laid eggs, they were considered reproductive. Those that did not lay eggs
were to be dissected to determine if their ovaries contained developed oocytes. They had
ad libitum access to sponges soaked with 20% honey-water while they were in the mating
cages.
Assessing diapause maintenance in fall monarchs
I raised approximately 500 monarchs from eggs laid by wild-caught individuals
captured in St. Paul, MN in summer 2007. They were reared outdoors in mid-
September—early-October in wooden and mesh cages (0.3 x 0.5 x 0.7 m) with about 50
individuals per cage. Every day, larvae received fresh cuttings of common milkweed, and
their cages were cleaned. Their outdoor location exposed them to the decreasing daylight
and fluctuating temperatures known to induce diapause (Goehring and Oberhauser 2002).
They emerged as adults between October 8 and October 15th
and were either carried by
plane or shipped overnight to Texas. On October 15th
, I collected 253 roosting adults
from a stand of trees located approximately 250 km west of San Antonio, Texas.
Monarchs were given unique numbers on their hind wings with sharpie markers so that I
could distinguish individuals.
The MN-reared and wild-caught butterflies were randomly placed in one of four 2
x 2 x 2 m mesh cages (approximately 150 individuals per cage, with equal numbers of

77
males and females). One cage contained no milkweed, a second contained wild-growing
native milkweed A. asperula, a third contained wild-growing A. oenotheroides, and the
last contained a non-native milkweed A. curassavica purchased from a local organic
nursery. All cages contained established native Texas grasses and were clustered within
approximately 20 square feet of one another. Butterflies had ad libitum access to sponges
filled with 20% honey-water and remained in the cages for 11 days. I measured their
reproductive status as described above.
All analyses were conducted in JMP v. 5.1.2.
RESULTS
Phenological patterns
Monarchs’ arrival in the spring is marked by a large influx of eggs in each region
(Figure 1). While MLMP volunteers only measure milkweed density once per season, the
number of plants they monitor provides an index of the number of plants available in
their site, and early milkweed abundance is low relative to later abundance (Figure 2).
Thus, the high per plant densities in the spring probably reflect low milkweed abundance
rather than high monarch abundance (Figure 1). Monarchs arrive in the south in March
and lay eggs, with a spring peak in egg density in mid-March. The low values in the
south from April through August show that monarchs are largely gone during these
months, (except in sites with the introduced A. curassavica, see below). The adults that
result from the southern eggs fly northward, laying eggs in the mid-region and then the
northern region. Monarchs are largely gone from the middle region through June and

78
July. In the northern part of the flyway, a second peak in egg density follows closely on
the first, indicating a second generation (or combined second and third generation, Figure
1). At lower latitudes (the middle and southern part of the flyway) another peak often
follows the period during the hottest part of the summer where few or no eggs are
observed (Figure 1).
The timing of the second generation of eggs across MN, WI, IA, MO, NE, IL and
TX is correlated with latitude (Figure 3). Around 45 degrees latitude (MN and WI), the
second peak of eggs occurs, on average, at week 29, the last week in July. At 38 degrees
latitude (MO), the second peak occurs in week 32, the second week in August. At some
MLMP sites, these eggs are laid after a period of absence, suggesting that they are
offspring from monarchs arriving from the north. Finally, in TX (30 degrees latitude), the
second peak of eggs occurs at during week 39, the second week in September. Again,
these eggs appear after a period of absence, and some volunteers report eggs through
December, suggesting that multiple fall generations are produced at some sites (Figure 1).
The higher proportion of eggs per plant after week 45 suggests limited milkweed supply
(Figure 2), much like in the spring.
Phenological patterns of milkweed
A. curassavica is more likely to be in sites that were planted, regularly fertilized
and weeded (Table 1). Interviews with MLMP volunteers suggest that native milkweed
senesces during the summer and only returns in the fall during years with sufficient
rainfall, while A. curassavica in maintained areas is green throughout the growing
season. The relative abundance of milkweed in sites with and without A. curassavica

79
across the season shows strikingly different patterns. Milkweed abundance in sites with
only native species peaks in the spring but remains low through the fall, while milkweed
abundance increases in abundance through May and then remains relatively stable
throughout the fall in sites with A. curassavica (Figure 4, see month by A.c interactions
in Table 2). The ratio of monthly mean milkweed numbers to yearly mean milkweed is
also predicted by the previous month’s precipitation (Table 2). In particular, fall 2008 and
2009 were extremely wet in Texas; the effects of these wet years are illustrated in Figure
4, where data for sites without A. curassavica in 2008-2009 and 2001-2007 are separated.
In August 2008, San Antonio, the nearest large city to sites analyzed for milkweed
quantity, received 4.98 inches of rain. The following month, there was a significant spike
in native milkweed counts, blurring the distinction between relativized native and non-
native milkweed abundance. In October 2009, San Antonio received 11.9 inches of rain
and the following November saw a similar increase in native milkweed.
Effects of milkweed species on monarch phenology and survival
The type of milkweed in a site affected monarch use of the site. MLMP
volunteers reported more eggs per plant at Texas sites with A. curassavica than at sites
without this introduced milkweed, however, this effect depends on month (Table 3). In
March, when monarchs typically are returning from overwintering in Mexico, there is no
preference for MLMP sites with A. curassavica (Figure 5). Beginning in April, when
monarchs typically leave the southern United States, MLMP data show significantly
more eggs per milkweed plant at sites with A. curassavica for the remainder of the year
(p<0.05). The number of eggs per plant at sites without tropical milkweed declines from

80
0.66 in March to 0.13 in April and remains significantly lower than the March value
throughout the year (p<0.05). The number of eggs per plant at sites with tropical
milkweed is never significantly different from the March value (p>0.05) (Figure 5).
Across all of the sites that I surveyed in the fall of 2007, I found an average of
1.09 eggs per A. curassavica plant and an average of 0.016 eggs per native milkweed
plant (Figure 6). A. curassavica was in significantly better condition than the native
milkweeds, with average condition ratings of 1.24 and 2.09 respectively (Table 4). There
was no difference in the amount of herbivory damage, indicating that neither milkweed
was preferred earlier in the season or by other insects. A. curassavica plants surveyed
were considerably taller than the native species and thus contained more leaf area. This
difference could explain the additional eggs found on each plant, but the significant
difference in egg counts remained when weighted by plant height (p<0.0001). A.
curassavica also occurs in higher density (Table 4). With the introduced milkweed being
denser and in better condition, A. curassavica presence could simply attract more
monarchs to these MLMP sites. However, two of the sites I surveyed contained both
introduced and native milkweeds; in these sites there were more eggs on A. curassavica
than native milkweed, indicating that females are choosing not just the sites but the plants
themselves (Figure 6). Additionally, females did not lay more eggs on native milkweed in
sites where A. curassavica also occurred than at sites with only native milkweed
(R2=0.0038, F1,127=0.49, p=0.49).

81
Reproductive condition of fall migrants
The probability of mating did not differ between the MN-raised monarchs and
monarchs collected roosting in Texas with 2 out of 119 wild and 9 out of 167 MN male
monarchs mated, respectively (Pearsons chi-square=2.58, d.f.=1, 284, p=0.11). Also, the
number of days until a monarch mated did not depend on butterfly origin with wild-
caught butterflies mating an average of 4.5 days (range 4-5 days), and MN butterflies an
average of 5.25 days (range 3-8 days) after being put into the cage (t-test, t=-0.59, d.f.= 9,
p=0.57). Given these data, I assumed no difference in reproductive state at the start of this
experiment, with both cohorts being in diapause and migratory. In addition, during the
experiment most butterflies congregated in the southwest corner of the mating cages.
They did not track the sun throughout the day, as non-migratory summer butterflies do
(personal observations), but stayed in this corner. I did not quantify movement, but
observed that these butterflies rarely flew around the cage, or landed on the milkweed or
other plants, as I have observed in summer cage experiments.
No monarchs mated in the cage without milkweed or in the cage with A. asperula,
but 6 of 77 and 5 of 90 of the males mated in the cages with A. curassavica, and A.
oenotheroides respectively. Examining all four cages separately, there were significant
differences in the probability of mating between the four cages (Pearson chi-
square=17.06, d.f.=3, 581, p=0.0007), but no significant differences between the
probability of mating in the cage with A. curassavica and A. oenotheroides (Pearson chi-
square=0.213, d.f.=1, 336, p=0.64) (Figure 7).

82
None of the 57 wild-caught monarchs reared in outdoor conditions in Texas and
mailed to Minnesota mated in a greenhouse cage with extended daylight conditions.
DISCUSSION
There is clearly reproduction by monarchs moving into Texas in the fall (Calvert
1999, Prysby and Oberhauser 2004), but this analysis, using data from the MLMP,
provides the first quantification of the degree to which this occurs, and its correlation
with the presence of non-native milkweed. This is a departure from the traditional model
of the monarchs’ fall migration, in which monarchs are thought to be in reproductive
diapause through the migration and winter only to mate and lay eggs in the spring
(Brower 1995).
Two hypotheses could explain breeding during the fall migration. First, a subset
of the eastern North American migratory monarch population may migrate south in a
reproductive, non-diapause state. The timing of monarch arrival in the Mexican
overwintering sites, and the fact that the vast majority of monarchs that arrive Mexico are
in reproductive diapause (Herman 1981, Herman and Tatar 2001) demonstrate that most
migratory monarchs are in diapause. However, migratory behavior is not necessarily
linked to diapause (Perez and Taylor 2004, Zhu et al. 2009), so some butterflies could lay
eggs along the migratory route as they do during the spring migration. Figure 3 shows a
wave of eggs (and thus reproductive monarchs) moving south from mid-July through
mid-September, supporting this hypothesis. The individuals laying these eggs could

83
represent a level of plasticity that could allow this population of monarchs to cope with
additional pressures of climate change.
Data from the mating cages suggest that monarchs are capable of breaking
diapause during the fall migration, and provide some insights into the cues that trigger
diapause development and the degree to which this occurs. It is very likely that the MN-
reared and wild-caught butterflies in the mating cages were in diapause and migratory at
the start of the experiment, given the 4-5 days until they started mating and their
clustering behavior in the southwest corner of the cages. The observed mating is likely to
be in response to milkweed presence, as there was no mating observed in the cage
without milkweed (Figure 8). Goehring and Oberhauser (2004) showed that the presence
of milkweed can hasten diapause development at the end of the overwintering period, and
these findings suggest that this may be an effective cue in the fall as well.
MLMP data and my survey data indicate a preference for A. curassavica during
the fall, and it is possible that the presence of this species is more likely to trigger
diapause development. However, A. oenotheroides had a similar effect, complicating this
interpretation (Figure 8). There are inherent limitations of my experimental design. The
conditions in the mating cages deviate from those a monarch would normally encounter;
the butterflies were held in close proximity to host plant for an extended period of time.
Typically, a monarch in diapause would be likely to contact host plants during brief
encounters. Additionally, MLMP data suggest that fewer native milkweed plants are
available in the fall than in the spring (Figure 4) and the field data show that A.
curassavica plants are in better condition than native species (Table 4), making it less

84
probable that a migratory monarch encounters a native host plant in good condition.
Thus, simply by being available and healthy enough to be included in this experiment, the
native plants in these cages were by definition in better condition than typical native
plants in the fall. More work is needed to further quantify the role A. curassavica might
play in diapause development; at minimum, these data suggest that the presence of
healthy milkweed is correlated with mating behavior.
The fact that such a low proportion of individuals mated in the mating cage
experiment (Figure 7) suggests that a small proportion of the population responds to the
presence of this cue, but because all butterflies on their way to the Mexican
overwintering grounds move through this region, any environmental perturbations here
could have population wide effects.
MLMP data and my field data show further differences between A. curassavica
and native species. A. curassavica had more eggs per milkweed plant (Figures 5 and 6).
Monarchs could be choosing to lay eggs on this introduced milkweed because it is in
better condition than native species (Table 4). Also, MLMP sites with A. curassavica are
more likely to be planted, fertilized and weeded (Table 1). In my surveys, I encountered
several instances of MLMP volunteers protecting their A. curassavica plants and the
monarchs feeding on them. One volunteer kept her plants in pots so she could bring them
inside if it got too cold. Another had tied several fallen pupae onto the sturdy stems of A.
curassavica plants. With this care, the A. curassavica plants grow much taller than the
native plants (Table 4) and more closely resemble a large shrub. Thus, it appears that

85
monarchs choose to lay more eggs on this introduced milkweed species, it remains in
better condition through the fall, and it could be affecting monarchs’ fall migration.
The offspring of these fall breeding individuals could 1) enter a state of
reproductive diapause and join the wintering population in Mexico, 2) remain in the
southern U. S. in reproductive diapause, or 3) breed in the southern U. S. It is likely that
all three of these outcomes are occurring. The fact that none of the individuals reared
outdoors in Texas in the fall mated in a Minnesota greenhouse suggests that they were at
the very least in diapause, and while this does not guarantee their migratory status, it
seems likely at least some of them would continue the journey to Mexico. Indeed,
observers in Mexico report that there is often a second influx of individuals in December
(Eduardo Rendon, personal communication). Additional work should be done to analyze
the effect that these individuals’ late start has on their survival until spring, but Monarch
Watch data suggests that the later a monarch is tagged in the fall, the less likely it is to be
recovered in Mexico (O. Taylor, personal communication).
We do know that monarchs can remain in the southern U. S. throughout the
winter; observers in Virginia Beach, VA tagged a wild monarch on 25 September 2005
and recovered the same individual on 2 March 2006 (Journey North 2011). It is highly
unlikely that a breeding individual could live long, so this individual was probably in
diapause. Additionally, Howard et al. (2010) documented overlap of immature and adult
monarchs along the Gulf Coast and up to the Georgia-South Carolina border, but only
adult monarchs on the South Carolina, North Carolina, and south Virginia coasts. This
suggests (but does not prove) that at least some of these individuals were in diapause.
86
The presence of immature monarchs in Texas and along the Gulf Coat every
month throughout the winter (Howard et al. 2010 and Figure 1) demonstrates that at least
some of the offspring of fall breeding individuals remain in this region and reproduce.
This strategy, and thus the presence of A. curassavica, could present a significant threat
to individuals in some years. A. curassavica cannot tolerate freezing temperatures; the
plant may remain viable underground and grow again under favorable conditions, but any
foliage exposed to a freeze will senesce. Thus, even if a monarch larva survived the
freeze itself, it would not have milkweed to eat. The average low temperature in January
in Dallas is 32.7 degrees Fahrenheit; San Antonio, 39.8 degrees Fahrenheit; and Houston,
42.9 degrees Fahrenheit (Office of the Texas State Climatologist). With these average
lows, a freeze could occur in a significant portion of winters, making monarch survival
unlikely.
Further work is needed to determine the degree to which monarchs migrating
southward in the fall, and the offspring of those southward migrants that reproduce,
respond to environmental cues. This research suggests that there is variability in monarch
migratory and reproductive behavior that may be affected by climate and milkweed
quality and presence. This variability is likely to have individual fitness consequences,
and could also indicate a level of plasticity within the monarch migratory population that
could allow this species to adjust to future environmental perturbations, including climate
change. 3
3 ACKNOWLEDGEMENS: Thank you to the MLMP volunteer monitors and trainers for their
work in collecting occurrence data. In particular, thank you to the MLMP volunteers in

87
REFERENCES
Batalden, R., K. Oberhauser and A. T. Peterson. 2007. Ecological niches in sequential
generations of eastern North American monarch butterflies (Lepidoptera:
Danaidae): the ecology of migration and likely climate change implications. Env.
Ent. 36: 1365-1373.
Brower, L. P. 1985. New perspectives on the migration biology of the monarch butterfly,
Danaus plexippus L. in M. A. Rankin (ed.), Migration: Mechanisms and Adaptive
Sgnificance. Contrib. Univ. Texas Marine Science.
Brower, L. P. 1995. Understanding and misunderstanding the migration of the monarch
butterfly (Nymphalidae) in North America: 1857-1995. J. Lepid. Soc. 49:304-85.
Brower, L. P., D. R. Kust, E. Rendon-Salinas, E. G. Serrano, K. R. Kust, J. Miller, C.
Fernandez del Ray, and K. Pape. Catastrophic Winter Storm Mortality of
Monarch Butterflies in Mexico in January 2002. in Oberhauser, K. S. and M. J.
Solensky. 2004. Monarch Butterfly Biology and Conservation. Cornell University
Press.
Calvert, W. H. 1999. Patterns in the spatial and temporal use of Texas milkweeds
(Asclepiadaceae) by the monarch butterfly (Danaus plexippus L.) during fall,
1996. J. Lep. Soc. 53: 37-44.
Clarke, A. R. and M. P. Zalucki. 2004. Monarchs in Australia: on the winds of a storm?
Bio. Inv. 6: 123-127.
Dingle, H., W.A. Rochester and M.P. Zalucki. 2000. Relationships among climate,
latitude and migration: Australian butterflies are not temperate-zone birds.
Oecologia 124:196-207.
Goehring, L. and K. S. Oberhauser. 2002. Effects of photoperiod, temperature, and host
plant age on induction of reproductive diapause and development time in Danaus
plexippus. Ecol. Ent. 27: 674-685.
Texas who spent many hours showing me their milkweed. Mary Kennedy hosted the
mating cage experiments and reared larvae for me. Thank you research assistants Jolene
Lushine and Sarah Kempke. This work was supported by a grant from the National
Science Foundation (DBS-0710343) and the Dayton and Wilkie Natural History Fund.

88
Goehring, L. and K. S. Oberhauser. 2004. Environmental factors influencing postdiapause
reproductive development in monarch butterflies. in K. S. Oberhauser and M. J.
Solensky (eds.), Monarch Butterfly Biology and Conservation. Cornell University
Press, Ithaca, NY.
Herman, W. S. 1981. Studies on the adult reproductive diapause of the monarch butterfly,
Danaus plexippus. Biol. Bull. 160:89-106.
Herman, W. S. and M. Tatar. 2001. Juvenile hormone regulation of longevity in the
migratory monarch butterfly. Proc. R. Soc. Lond. B 268: 2509-2514.
Howard, E. and A. K. Davis. 2009. The fall migration flyways of monarch butterflies in
eastern North America revealed by citizen scientists. J. Insect Conserv. 13: 279-
286.
Howard, E., H. Aschen, A. K. Davis. 2010. Citizen science observations of monarch
butterfly overwintering in the southern United States. Psyche. Vol. 10, Article ID
689301, 6 pages.
Journey North: A Global Study of Wildlife Migration. 2011.
http://www.learner.org/jnorth/.
Monarch Larva Monitoring Project. 2011. www.mlmp.org.
Oberhauser, K. and A. T. Peterson. 2003. Modeling current and future potential wintering
distributions of eastern North American monarch butterflies. Proc. Natl. Acad.
Sci. 100: 14063-14068.
Office of Texas State Climatologist, Texas A&M University. http://atmo.tamu.edu/osc/.
Perez, S. M. and O. R. Taylor. 2004. Monarch butterflies’ migratory behavior persists despite
changes in environmental conditions, pp. 85-88. in K. S. Oberhauser and M. J.
Solensky (eds.), Monarch Butterfly Biology and Conservation. Cornell University
Press, Ithaca, NY.
Prysby, M. D. and K. Oberhauser. 2004. Temporal and Geographic Variation in Monarch
Densities: citizen scientists document monarch population patterns, pp. 9-20. in K. S.
Oberhauser and M. J. Solensky (eds.), Monarch Butterfly Biology and Conservation.
Cornell University Press, Ithaca, NY.
Urquart, F. A. 1987. The Monarch Butterfly: International Traveler. Nelson-Hall,
Chicago, IL.

89
Vane-Wright, R. I. 1991. The Columbus hypothesis: an explanation for the dramatic 19th
century range expansion of the monarch butterfly. in S. B Malcolm and M. P.
Zalucki (eds.), Biology and Conservation of the Monarch Butterfly. Natural
History Museum of Los Angeles County, CA.
Zalucki, M. P. and A. R. Clarke. 2004. Monarchs across the Pacific: the Columbus
hypothesis revisted. Bio. Jour. Linn. Soc. 82: 111-121.
Zalucki, M. P. and W. A. Rochester. 1999. Estimating the effect of climate on the
distribution and abundance of the monarch butterfly, Danaus plexippus (L.): a tale
of two continents, pp. 151-163. In J. Hoth,, L. Merino, K. Oberhauser, I. Pisanty,
S. Price, and T. Wilkinson (eds.), The 1997 North American Conference on the
Monarch Butterfly. Commission for Environmental Cooperation, Montreal,
Canada.
Zhu, H., R. J. Gegear, A. Casselman, S. Kanginakudru and S. M. Reppert. 2009. Defining
behavioral and molecular differences between summer and migratory monarch
butterflies. BMC Bio 7: 14.

90
Table 3.1: Management practices at Texas MLMP sites with and without A. curassavica.
Percent
Planted
Percent
Fertilized
Percent
Weeded
Sample
Size
Sites with A.
curassavica 0.88 0.38 0.67 24
Sites without A.
curassavica 0.15 0.04 0.19 26

91
Table 3.2: Model results for the analysis of normalized milkweed counts for Texas sites
with and without A. curassavica from 2001-2009. Corresponds to Figure 3.4.
Term Estimate Std Error t Ratio P-value
Intercept 0.79 0.06 12.80 <.0001
Prev. Month
Precip. 0.05 0.01 4.13 <.0001
No A. c. -0.07 0.05 -1.33 0.19
Month 3 -0.47 0.25 -1.86 0.06
Month 4 0.14 0.16 0.87 0.39
Month 5 0.66 0.12 5.39 <.0001
Month 6 0.45 0.12 3.68 <.0001
Month 7 0.12 0.12 1.02 0.31
Month 8 -0.24 0.14 -1.77 0.08
Month 9 0.00 0.12 -0.02 0.98
Month 10 -0.07 0.14 -0.50 0.61
Month 11 -0.27 0.14 -1.93 0.06
No A. c. *
Month3 0.13 0.25 0.53 0.60
No A. c. *
Month4 0.38 0.16 2.39 0.02
No A. c. *
Month5 0.48 0.12 3.95 <.0001
No A. c. *
Month6 0.34 0.12 2.78 0.01
No A. c. *
Month7 -0.10 0.12 -0.85 0.40
No A. c. *
Month8 -0.33 0.14 -2.40 0.02
No A. c. *
Month9 -0.44 0.12 -3.59 <.0001
No A. c. *
Month10 -0.10 0.14 -0.70 0.48
No A. c. *
Month11 -0.15 0.14 -1.09 0.28

92
Table 3.3: Model results for the analysis of the number of eggs per milkweed plant at
MLMP sites in Texas. Corresponds to figure 3.5.
Term Estimate Std Error t Ratio p-value
Intercept 0.28 0.025 11.30 <0.0001
No A. c. -0.16 0.025 -6.60 <0.0001
Month 4 0.0050 0.056 0.09 0.93
Month 5 0.0084 0.054 0.16 0.88
Month 6 -0.11 0.060 -1.84 0.067
Month 7 -0.13 0.066 -2.04 0.042
Month 8 -0.13 0.067 -1.94 0.052
Month 9 -0.03 0.062 -0.54 0.59
Month 10 -0.04 0.064 -0.55 0.58
Month 11 0.10 0.08 1.25 0.21
Month 12 -0.009 0.13 -0.97 0.94
No A. c. *
Month 4 0.0059 0.056 0.11 0.92
No A. c. *
Month 5 -0.11 0.054 -2.08 0.04
No A. c. *
Month 6 0.022 0.060 0.37 0.71
No A. c. *
Month 7 0.038 0.066 0.57 0.57
No A. c. *
Month 8 0.080 0.067 1.19 0.24
No A. c. *
Month 9 0.069 0.062 1.11 0.27
No A. c. *
Month 10 -0.00031 0.064 0.00 0.99
No A. c. *
Month 11 -0.21 0.082 -2.55 0.011
No A. c. *
Month 12 -0.097 0.13 -0.77 0.44

93
Table 3.4: Summary of milkweed quality from field study. Average condition rating of A.
curassavica is significantly better than native milkweed (F1,172=24.14, p<0.0001).
Average herbivory rating does not differ between A. curassavica and native milkweed
(F1,172=0.15, p=0.70). The average height for A. curassavica is taller than the average
height for native milkweed (F1,172=339.27, p<0.0001). A. curassavica has a higher
average density than native milkweed (F1,172=9.47, p=0.0024).
Average
Condition
Rating (se)
Average
Herbivory
Rating (se)
Height
(cm) (se)
Density
(#milkweeds/m2)
(se)
Sample
Size
Native
Milkweed
2.09
(0.09) a
2.34
(0.10) a
27.22
(1.59) a
2.55
(0.27) a 129
A.
curassavica
1.24
(0.15) b
2.27
(0.17) a
84.69
(2.69) b
4.16
(0.45) b 45

94
Figure 3.1: Mean eggs density by week at MLMP sites in Minnesota, Wisconsin and
Iowa (North, 215 sites), Missouri, Illinois and Nebraska (Mid, 17 sites) and Texas (South,
52 sites) for all years combined, 1997-2009. Tick marks are weeks 10-52, but labeled as
month for easier reference. Text boxes below refer only to the egg densities in TX.
Weeks 10-16 show the arrival of overwintering monarchs to lay their eggs in the south, a
few monarchs persist throughout the hot, dry summers, and others return in the fall
around week 38. The high egg densities in the south late in the year are likely due to low
milkweed abundance.
0
0.1
0.2
0.3
0.4
0.5
0.6
0.7
0.8
Mea
n p
roport
ion o
f eg
gs
per
mil
kw
eed r
amet
Month
North
Mid
South
Few eggs in
hot summer
!""#$%&'($)*$$
+&%%$,'"-&./#$
0123.($$
+&%%$$
"1.1-&/'3.$

95
Figure 3.2: Normalized milkweed abundance by month at MLMP sites in Minnesota,
Wisconsin and Iowa (North), Missouri, Illinois and Nebraska (Mid) and Texas (South).
0
0.2
0.4
0.6
0.8
1
1.2
1.4
1.6
1 2 3 4 5 6 7 8 9 10 11 12
Mea
n m
onth
ly m
ilkw
eed c
ount/
mea
n y
earl
y
mil
kw
eed c
ount
Month
North
Mid
South
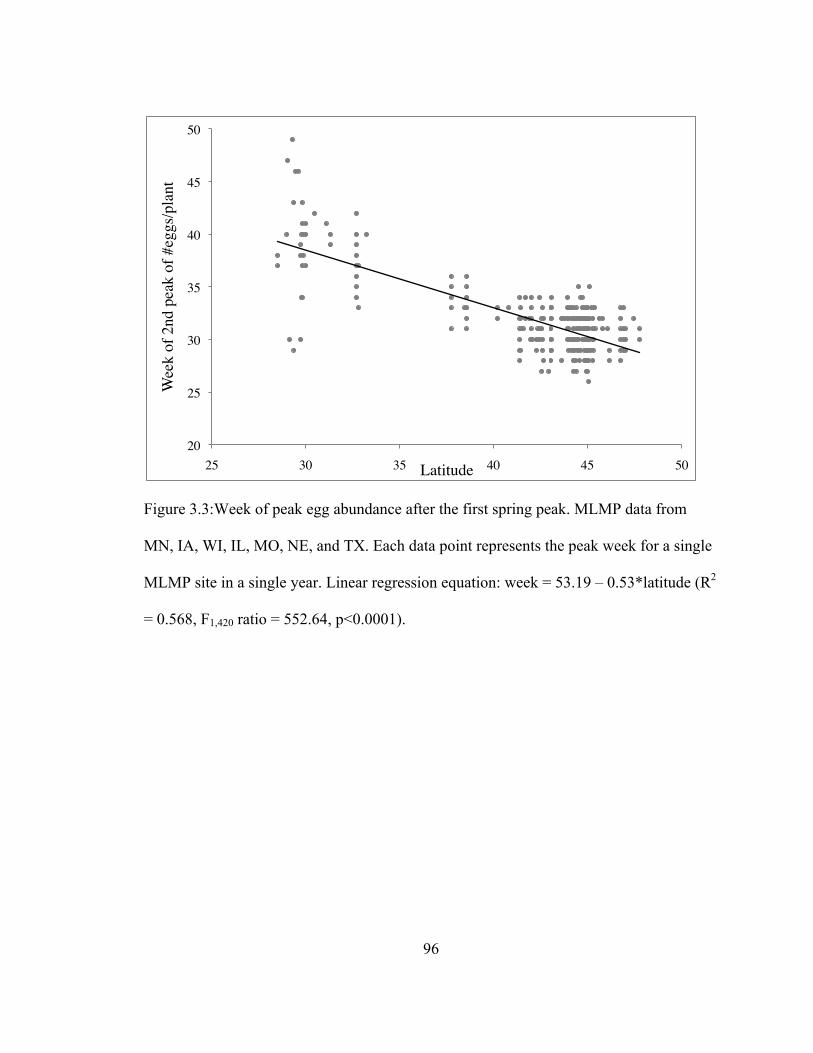
96
Figure 3.3:Week of peak egg abundance after the first spring peak. MLMP data from
MN, IA, WI, IL, MO, NE, and TX. Each data point represents the peak week for a single
MLMP site in a single year. Linear regression equation: week = 53.19 – 0.53*latitude (R2
= 0.568, F1,420 ratio = 552.64, p<0.0001).
20!
25!
30!
35!
40!
45!
50!
25! 30! 35! 40! 45! 50!
Wee
k o
f 2nd p
eak o
f #eg
gs/
pla
nt!
Latitude!

97
Figure 3.4: Normalized milkweed abundance in Texas. Ratio of mean monthly milkweed
counts to mean yearly milkweed counts in sites, across months and in the presence and
absence of A. curassavica (R2 = 0.633, F20, 159 = 11.96, p<0.001). Also shown are sites
without A. curassavica from 2001-2007 and from 2008-2009, as precipitation was
markedly higher in years 2008 and 2009. Error bars are standard error.
0
0.5
1
1.5
2
2.5
2 3 4 5 6 7 8 9 10 11 12
Mea
n M
onth
ly M
ilkw
eed/M
ean Y
earl
y M
ilkw
eed
Month
Sites without A. curassavica (2001-2009)
Sites without A. curassavica (2001-2007)
Sites without A. curassavica (2008-2009)
Sites with A. curassavica (2001-2009)

98
Figure 3.5: Mean proportion of eggs per milkweed plant in Texas MLMP sites with and
without A. curassavica throughout the year. Month and A. curassavica presence
correlated with egg density (R2 = 0.095, F19, 1155 ratio = 6.38, p < 0.0001). Error bars
represent standard error.
0
0.2
0.4
0.6
0.8
1
1.2
3 4 5 6 7 8 9 10 11 12
Mea
n p
roport
ion o
f eg
gs
per
mil
kw
eed r
amet
Month
Sites without A. curassavica
Sites with A. curassavica

99
Figure 3.6: Grey bars indicate mean number of eggs per milkweed ramet across all sites
surveyed. (F1, 172 = 22.99, p < 0.0001) Black bars indicate mean number of eggs per
milkweed ramet only at surveyed sites that contained both native and A. curassavica
milkweeds. (F1, 61 = 6.77, p = 0.01) Error bars are standard error.
0
0.2
0.4
0.6
0.8
1
1.2
1.4
Native A. curassavica
Mea
n p
roport
ion o
f eg
gs
per
mil
kw
eed
ram
et
All surveyed sites
Sites with Native and A.c.

100
Figure 3.7: Probability of mating by species of milkweed in the cage. Pearson chi-square
= 17.06, d.f. = 3, 581, p = 0.0007. Error bars are binomial confidence intervals.
0!
0.01!
0.02!
0.03!
0.04!
0.05!
0.06!
0.07!
0.08!
None! A. asperula! A. oenotheroides! A. curassavica!
Pro
bab
ilty
of
Mat
ing!
Milkweed Species!

101
COMPREHENSIVE BIBLIOGRAPHY
Ackery, P. R. and R. I. Vane-Wright. 1984. Milkweed butterflies: Their cladistics and
biology. Ithaca: Cornell University Press, Comstock Publishing Associates.
Alonso-Mejia, A., E. Rendon-Salinas, E. Montesinos-Patino and L. P. Brower. 1997. Use
of lipid reserves by monarch butterflies overwintering in Mexico: implications for
conservation. Ecological Applications. 7: 934-947.
Altizer, S. M. and K. S. Oberhauser. 2000. Associations between host migration and the
prevalence of a protozoan parasite in natural populations of adult monarch
butterflies. Ecol. Entomol. 25: 125-39.
Anderson, R. P., D. Lew, and A. T. Peterson. 2003. Evaluating predictive models of
species distributions: criteria for selecting optimal models. Ecol. Mod. 162: 211-
232.
Arango, N. V. 1996. Stabilizing Selection in Migratory Butterflies: A Comparative Study
of Queen and Monarch Butterflies. Masters thesis, Univ. of Florida (Gainesville).
Araújo, M. B., R. G. Pearson, W. Thuiller, and M. Erhard. 2005. Validation of species-
climate impact models under climate change. Glob. Change Biol. 11: 1504-1513.
Araújo, M. B., and A. Guisan. 2006. Five (or so) challenges for species distribution
modelling. J. Biogeogr. 33: 1677-1688.
Araújo, M. B., W. Thuiller, and R. G. Pearson. 2006. Climate warming and the decline
of amphibians and reptiles in Europe. J. Biogeogr. 33: 1712-1728.
Batalden, R., K. Oberhauser and A. T. Peterson. 2007. Ecological niches in sequential
generations of eastern North American monarch butterflies (Lepidoptera:
Danaidae): the ecology of migration and likely climate change implications. Env.
Ent. 36: 1365-1373.
Brower, L. P. 1985. New perspectives on the migration biology of the monarch butterfly,
Danaus plexippus L. in M. A. Rankin (ed.), Migration: Mechanisms and Adaptive
Sgnificance. Contrib. Univ. Texas Marine Science.
Brower, L. P. 1995. Understanding and misunderstanding the migration of the monarch
butterfly (Nymphalidae) in North America: 1857-1995. J. Lepid. Soc. 49:304-85.
Brower, L. P., D. R. Kust, E. Rendon-Salinas, E. G. Serrano, K. R. Kust, J. Miller, C.
Fernandez del Ray, and K. Pape. Catastrophic Winter Storm Mortality of
Monarch Butterflies in Mexico in January 2002. in Oberhauser, K. S. and M. J.

102
Solensky. 2004. Monarch Butterfly Biology and Conservation. Cornell University
Press.
Calvert, W. H. 1999. Patterns in the spatial and temporal use of Texas milkweeds
(Asclepiadaceae) by the monarch butterfly (Danaus plexippus L.) during fall,
1996. J. Lep. Soc. 53: 37-44.
Clarke, A. R. and M. P. Zalucki. 2004. Monarchs in Australia: on the winds of a storm?
Bio. Inv. 6: 123-127.
Carson, D. J. 1999. Climate modelling: achievements and prospects. QJR Meteorol. Soc.
125: 1- 27.
Crowley, T. J. 2000. Causes of climate change over the past 1000 years. Science 289:
270-277.
Crozier, L. G. 2004. Field transplants reveal summer constraints on a butterfly range
expansion. Oecologia. 141: 148-157.
DeAnda, A. 2010. The effect and importance of natural enemies on immature monarch
(Danaus plexippus) populations. Masters thesis, Univ. of Minnesota (Twin
Cities).
Dingle, H., W.A. Rochester and M.P. Zalucki. 2000. Relationships among climate,
latitude and migration: Australian butterflies are not temperate-zone birds.
Oecologia 124:196-207.
Forister M. L., Shapiro A. M. 2003. Climatic trends and advancing spring flight of
butterflies in lowland California. Glob. Change Biol. 9: 1130–35.
Goehring, L. and K. S. Oberhauser. 2002. Effects of photoperiod, temperature, and host
plant age on induction of reproductive diapause and development time in Danaus
plexippus. Ecol. Ent. 27: 674-685.
Goehring, L. and K. S. Oberhauser. 2004. Environmental factors influencing postdiapause
reproductive development in monarch butterflies. in K. S. Oberhauser and M. J.
Solensky (eds.), Monarch Butterfly Biology and Conservation. Cornell University
Press, Ithaca, NY.
Guisan, A., and U. Hofer. 2003. Predicting reptile distributions at the mesoscale: relation
to climate and topography. J. Biogeogr. 30: 1233-1243.
Hartl FU. 1996. Molecular chaperones in cellular protein folding. Nature 381: 571–80.

103
Herman, W. S. 1981. Studies on the adult reproductive diapause of the monarch butterfly,
Danaus plexippus. Biol. Bull. 160:89-106.
Herman, W. S. and M. Tatar. 2001. Juvenile hormone regulation of longevity in the
migratory monarch butterfly. Proc. R. Soc. Lond. B 268: 2509-2514.
Hill, J. K., C. D. Thomas, and B. Huntley. 2003. Modelling present and potential future
ranges of European butterflies using climate response surfaces, pp. 149-167. In C.
L. Boggs, W. B. Watt, and P. R. Ehrlich (eds.), Butterflies Ecology and Evolution
Taking Flight. University of Chicago Press, Chicago, IL.
Holt, R. D. 1990. The microevolutionary consequences of climate change. Trends Ecol.
Evol 5: 311-315.
Howard, E. and A. K. Davis. 2009. The fall migration flyways of monarch butterflies in
eastern North America revealed by citizen scientists. J. Insect Conserv. 13: 279-
286.
Howard, E., H. Aschen, A. K. Davis. 2010. Citizen science observations of monarch
butterfly overwintering in the southern United States. Psyche. Vol. 10, Article ID
689301, 6 pages.
Huey RB. 1991. Physiological consequences of habitat selection. Am. Nat. 137: S91–
115.
Intergovernmental Panel on Climate Change. 1996. in Climate Change 1995, Impacts,
Adaption and Mitigation of Climate Change: Scientific-Technical Analyses.
Cambridge Univ. Press, Cambridge U.K. pp. 171-189.
IPCC. 2007. Climate Change 2007: The Physical Science Basis. Contribution of Working
Group I to the Fourth Assessment Report of the Intergovernmental Panel on
Climate Change. Solomon, S., D. Qin, M. Manning, Z. Chen, M. Marquis, K.B.
Averyt, M.Tignor and H.L. Miller (eds.). Cambridge University Press,
Cambridge, United Kingdom and New York, NY, USA.
James, D. G. 1982. Ovarian dormancy in Danaus plexippus (L.) (Lepidoptera
Nymphalidae)—oligopause not diapause. J. Aust. Entomol. Soc. 21: 31-35.
James, D.G. 1993. Migration biology of monarchs in Australia. in Biology and
conservation of the monarch butterfly, eds. Malcolm, S. B. and M. P. Zalucki
(Natural History Museum of Los Angeles County, Los Angeles, CA), pp. 189-
200.

104
Joseph, L. and D. R. B. Stockwell. 2000. Temperature based models of the migration of
Swainson’s flycatcher Myiarchus swainsoni across South America: a new use for
museum specimens of migratory birds. Proc. Acad. Nat. Sci. Philad. 150: 293-
300.
Journey North: A Global Study of Wildlife Migration. 2011.
http://www.learner.org/jnorth/.
Kammer, A. E. 1971. Influence of acclimation temperature on the shivering behavior of
the butterfly Danaus plexippus (L.). Zeitschrift Fur Vergleichende Physiologie
72:364-369.
Lindquist S. 1986. The heat-shock response. Annu. Rev. Biochem. 55: 1151–91
Malcolm, S. B., B. J. Cockrell, and L. P. Brower. 1987. Monarch butterfly voltinism: effects
of temperature constraints at different latitudes. Oikos. 49: 77-82.
Malcolm, S. B., B. J. Cockrell, and L. P. Brower. 1993. Spring recolonization of eastern
North America by the monarch butterfly: successive brood or single sweep
migration?, pp. 253-267. In S. B. Malcolm and M. P. Zalucki (eds.), Biology and
Conservation of the Monarch Butterfly. Publications of the Los Angeles County
Museum of Natural History, Los Angeles, CA.
Martínez-Meyer, E. 2002. Evolutionary Trends in Ecological Niches of Species. Ph.D.
dissertation, University of Kansas, Lawrence.
Martínez-Meyer, E., A. T. Peterson, and A. G. Navarro-Sigüenza. 2004. Evolution of
seasonal ecological niches in the Passerina buntings (Aves: Cardinalidae). Proc.
R. Soc. Lond. B. 271: 1151-1157.
Masters, A. R., S. B. Malcolm and L. P. Brower. 1988. Monarch butterfly (Danaus
plexippus) thermoregulatory behavior and adaptations for overwintering in
Mexico. Ecology 69: 458-467.
Masters, A. R. 1993. Temperature and thermoregulation in the monarch butterfly. in S. B.
Malcolm and M. P. Zalucki (eds.), Biology and Conservation of the Monarch
Butterfly. Natural History Museum of Los Angeles County, Los Angeles,
California.
Monarch Larva Monitoring Project. 2011. www.mlmp.org.
Nakazawa, Y., A. T. Peterson, E. Martínez-Meyer, and A. G. Navarro-Sigüenza. 2004.
Seasonal niches of neararctic-neotropical migratory birds: implications for the
evolution of migration. Auk. 121: 610-618.

105
New, M., M. Hulme and P. Jones. 1997. A 1961-1990 Mean Monthly Climatology of
Global Land Areas. Norwich, U.K. Climatic Research Unit, University of East
Anglia.
Oberhauser, K. S. 1997. Fecundity, Lifespan and Egg Mass in Butterflies: Effects of
male-derived nutrients and females size. Func. Ecol. 11: 166-175.
Oberhauser, K. S., M. D. Prysby, H. R. Mattila, D. E. Stanley-Horn, M. K. Sears, G.
Dively, E. Olson, J. M. Pleasants, W. F. Lam and R. L. Hellmich. 2001. Temporal
and spatial overlap between monarch larvae and corn pollen. Proc. Natl. Acad.
Sci. 98: 11913-11918.
Oberhauser, K. and A. T. Peterson. 2003. Modeling current and future potential wintering
distributions of eastern North American monarch butterflies. Proc. Natl. Acad.
Sci. 100:14063-14068.
Office of Texas State Climatologist, Texas A&M University. http://atmo.tamu.edu/osc/.
Parmesan C. 1996. Climate and species’ range. Nature 382: 765–66.
Parmesan, C., N. Ryrholm, C. Stefanescus, J. K. Hill, C. D. Thomas, H. Descimon, B.
Huntley, L. Kaila, J. Kullberg, T. Tammaru, et al. 1999. Poleward shifts in
geographical ranges of butterfly species associated with regional warming.
Nature. 399: 579-583.
Parmesan C. 2003. Butterflies as bio-indicators of climate change impacts. In Evolution
and Ecology Taking Flight: Butterflies as Model Systems, ed. C. L. Boggs, W. B.
Watt, P. R. Ehrlich, pp. 541–60. Chicago: Univ. Chicago Press.
Parmesan, C. and G. Yohe. 2003. A globally coherent fingerprint of climate change
impacts across natural systems. Nature 421: 37-42.
Pearson, R. G., and T. P. Dawson. 2003. Predicting the impacts of climate change on the
distribution of species: are bioclimate envelope models useful? Global Ecol.
Biogeogr. 12: 361-371.
Pearson, R. G., C. Raxworthy, M. Nakamura, and A. T. Peterson. 2006. Predicting
species' distributions from small numbers of occurrence records: a test case using
cryptic geckos in Madagascar. J. Biogeogr. 34: 102-117.
Peñuelas, J., I. Filella, and P. Comas. 2002. Changed plant and animal life cycles from
1952 to 2000 in the Mediterranean region. Global Change Biology 8: 531-544.

106
Perez, S. M. and O. R. Taylor. 2004. Monarch butterflies’ migratory behavior persists despite
changes in environmental conditions, pp. 85-88. in K. S. Oberhauser and M. J.
Solensky (eds.), Monarch Butterfly Biology and Conservation. Cornell University
Press, Ithaca, NY.
Peterson, A.T. and K. C. Cohoon. 1999. Sensitivity of distributional prediction
algorithms to geographic data completeness. Ecol. Mod. 117: 159-164.
Peterson, A. T., J. Soberon, and V. Sanchez-Cordero. 1999. Conservatism of ecological
niches in evolutionary time. Science. 285: 1265-1267.
Peterson, A. T. 2001. Predicting species’ geographic distributions based on ecological
niche modeling. Condor. 103: 599-605.
Peterson, A. T., V. Sánchez-Cordero, J. Soberón, J. Bartley, R. H. Buddemeier and A. G.
Navarro-Sigüenza. 2001. Effects of global climate change on geographic
distributions of Mexican Cracidae. Ecol. Mod.. 144: 21-30.
Peterson, A. T. and D. A. Vieglais. 2001. Predicting species invasions using ecological
niche modeling: new approaches from bioinformatics attack a pressing problem.
BioScience 51: 363-371.
Peterson, A. T., M. A. Ortega-Huerta, J. Bartley, V. Sánchez-Cordero, J. Soberón, R. H.
Buddemeier, D. R. B. Stockwell. 2002. Future projections for Mexican faunas
under global climate change scenarios. Nature. 416: 626-629.
Peterson, A. T. 2003. Projected climate change effects on Rocky Mountain and Great
Plains birds: generalities of biodiversity consequences. Glob. Change Biol. 9:
647-655.
Peterson, A. T., C. Martínez-Campos, Y. Nakazawa, and E. Martínez-Meyer. 2005.
Time-specific ecological niche modeling predicts spatial dynamics of vector
insects and human dengue cases. Trans. R. Soc. Trop. Med. Hyg. 99: 647-655.
Prysby, M. D. and K. Oberhauser. 2004. Temporal and Geographic Variation in Monarch
Densities: citizen scientists document monarch population patterns, pp. 9-20. In K. S.
Oberhauser and M. J. Solensky (eds.), Monarch Butterfly Biology and Conservation.
Cornell University Press, Ithaca, NY.
Roy D. B., T. H. Sparks. 2000. Phenology of British butterflies and climate change. Glob.
Change Biol. 6: 407–416.
Soberón, J. and A. T. Peterson. 2005. Interpretation of models of fundamental ecological
niches and species' distributional areas. Biodiversity Informatics. 2: 1-10.

107
Solensky, M. J. and K. S. Oberhauser. 2009. Male monarch butterflies, Danaus
plexippus, adjust ejaculates in response to intensity of sperm competition. Anim.
Beh. 77: 465-472.
Stockwell, D. R. B. 1992. Machine learning and the problem of prediction and explanation in
ecological modeling. Ph.D. dissertation, Australian National University, Canberra,
Australia.
Stockwell, D. R. B. 1999. Genetic algorithms II, pp. 123-144. in A. H. Fielding (ed.),
Machine learning methods for ecological applications. Bluwer Academic
Publishers, Boston, MA.
Stockwell, D. R. B. and D. P. Peters. 1999. The GARP modeling system: problems and
solutions to automated spatial prediction. Int. J. Geog. Inform. Sys. 13: 143-158.
Thomas, C. D., A. Cameron, R. E. Green, M. Bakkenes, L. J. Beaumont, Y. C.
Collingham, B. F. N. Erasmus, M. Ferreira de Siqueira, A. Grainger, L. Hannah,
L. Hughes, B. Huntley, A. S. Van Jaarsveld, G. E. Midgely, L. Miles, M. A.
Ortega-Huerta, A. T. Peterson, O. L. Phillips, and S. E. Williams. 2004.
Extinction risk from climate change. Nature. 427: 145-148.
Thuiller, W., D. M. Richardson, P. Pysek, G. F. Midgley, G. O. Hughes, and M. Rouget.
2005. Niche-based modelling as a tool for predicting the risk of alien plant
invasions at a global scale. Glob. Change Biol. 11: 2234-2250.
Thuiller, W., G. F. Midgely, G. O. Hughes, B. Bomhard, G. Drew, M. C. Rutherford, and
F. I. Woodward. 2006. Endemic species and ecosystem sensitivity to climate
change in Namibia. Glob. Change Biol. 12: 759-776.
Urquart, F. A. 1987. The Monarch Butterfly: International Traveler. Nelson-Hall,
Chicago, IL.
Van Hook, T. 1996. Monarch Butterfly Mating Ecology at a Mexican Overwintering
Site: Proximate causes of non-random mating. Ph.D. thesis, Univ. of Florida
(Gainesville).
Vane-Wright, R. I. 1991. The Columbus hypothesis: an explanation for the dramatic 19th
century range expansion of the monarch butterfly. in S. B Malcolm and M. P.
Zalucki (eds.), Biology and Conservation of the Monarch Butterfly. Natural
History Museum of Los Angeles County, CA.
Wiens, J. J. and C. H. Graham. 2005 Niche conservatism: integrating evolution, ecology,
and conservation biology. Annu. Rev. Ecol. Syst. 36: 519-539.

108
Woodson, R. E. 1954. The North American species of Asclepias. Ann. Mo. Bot. Gard.
York, H. A. and K. S. Oberhauser. 2002. Effects of duration and timing of heat stress on
Monarch Butterfly (Danaus plexippus) (Lepidoptera: Nymphalidae) development.
J. Kans. Entomol. Soc. 75: 290-298.
Zalucki, M. P. 1981. The effects of age and weather on egg laying in Danaus plexippus
L. (Lepidoptera: Danaidae). Res. Popul. Ecol. 23: 318-327.
Zalucki, M. P. 1982. Temperature and rate of development in Danaus plexippus L. and
D. chrysippus L. (Lepidoptera: Nymphalidae) J. Aust. Entomol. Soc. 21: 241-46.
Zalucki, M. P. and R. L. Kitching. 1982. Temporal and spatial variation of mortality in
field populations of Danaus plexippus L. and D. chrysippus L. larvae
(Lepidoptera: Nymphalidae) Oecologia 53: 201-207.
Zalucki, M. P. and A. R. Clarke. 2004. Monarchs across the Pacific: the Columbus
hypothesis revisted. Bio. Jour. Linn. Soc. 82: 111-121.
Zalucki, M. P. and W. A. Rochester. 1999. Estimating the effect of climate on the
distribution and abundance of the monarch butterfly, Danaus plexippus (L.): a tale
of two continents, pp. 151-163. In J. Hoth,, L. Merino, K. Oberhauser, I. Pisanty,
S. Price, and T. Wilkinson (eds.), The 1997 North American Conference on the
Monarch Butterfly. Commission for Environmental Cooperation, Montreal,
Canada.
Zalucki, M. P. and W. A. Rochester. 2004. Spatial and temporal population dynamics of
monarchs down-under: lessons for North America, pp. 219-228. In K.
Oberhauser, and M. J. Solensky (eds.), Monarch Butterfly Biology and
Conservation. Cornell University Press, Ithaca, NY.
Zhu, H., R. J. Gegear, A. Casselman, S. Kanginakudru and S. M. Reppert. 2009. Defining
behavioral and molecular differences between summer and migratory monarch
butterflies. BMC Bio 7: 14.