© Natalya Brown 2008 ECON 3066 Economic Development Comparative Development Lecture 2: Differences...
60
© Natalya Brown 2008 ECON 3066 Economic Developme nt Comparative Development Lecture 2: Differences and Commonalities among Developing Countries
-
Upload
kimberly-brown -
Category
Documents
-
view
219 -
download
4
Transcript of © Natalya Brown 2008 ECON 3066 Economic Development Comparative Development Lecture 2: Differences...
© Natalya Brown 2008
ECON 3066Economic
Development
Comparative Development
Lecture 2: Differences and Commonalities among Developing Countries
© Natalya Brown 2008
LECTURE 2: Comparative Development Comparative Development
• Overview:– Defining the Developing World– Structural Diversity of Developing Economies– Common Characteristics of Developing Nations– Developing Countries today versus Developed
Countries in their Early Stages– Are Living Standards Converging?

© Natalya Brown 2008
LECTURE 2: Comparative Development
Defining the Developing World
• Per Capita Income– The World Bank uses Gross National Income (GNI)
per capita to classify economies into the following categories:
• Low Income Countries (LICs)• Lower Middle Income Countries (LMCs)• Upper Middle Income Countries (UMCs)• High Income OECD countries• Other High Income CountriesOECD – Organization of Economic Cooperation and
Development

© Natalya Brown 2008
LECTURE 2: Comparative Development
Defining the Developing World (cont’d)
• Those countries that fall into the LIC, LMC and UMC categories are considered developing countries. Some High Income countries would also be considered developing due to their high levels of inequality, limited industry, etc.
• Geographical Classification: sub-Saharan Africa, North Africa and the Middle East, Asia (excluding Japan), Latin America and the Caribbean, the transition countries of Eastern Europe and Central Asia, including the former Soviet Union.
© Natalya Brown 2008
LECTURE 2:
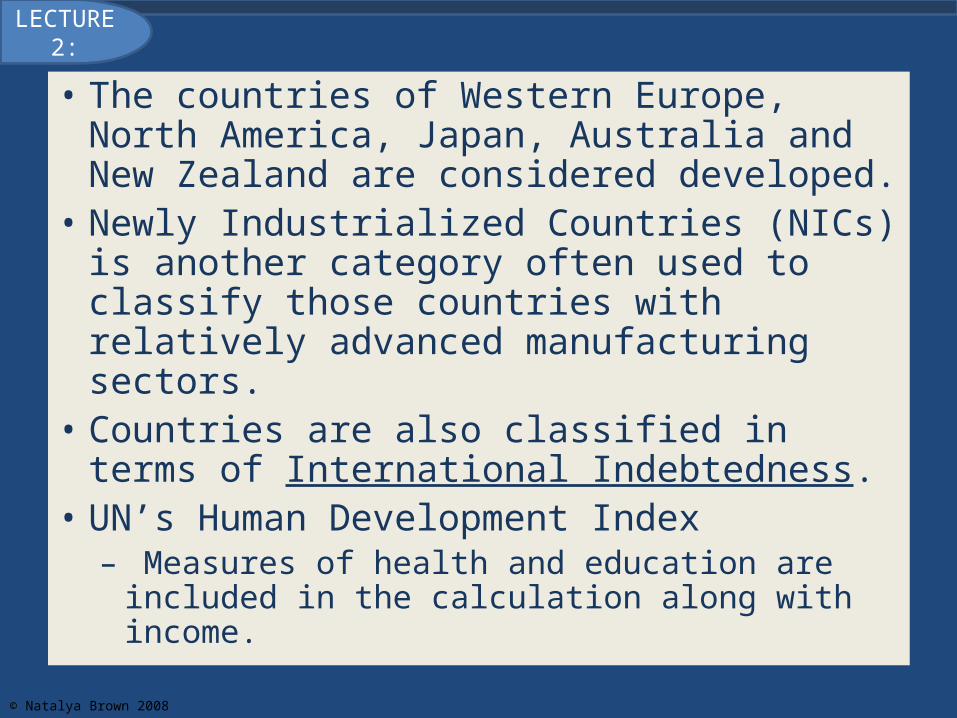
• The countries of Western Europe, North America, Japan, Australia and New Zealand are considered developed.
• Newly Industrialized Countries (NICs) is another category often used to classify those countries with relatively advanced manufacturing sectors.
• Countries are also classified in terms of International Indebtedness.
• UN’s Human Development Index– Measures of health and education are included in
the calculation along with income.

© Natalya Brown 2008
LECTURE 2:
• It is important to note the wide income range among the countries of the developing world.
• These countries have shared goals such as:– Reduction of poverty, inequality and
unemployment– Provision of minimum levels of education, health
care, housing and food– Broadening of social and economic opportunities– Forging a cohesive nation-state
© Natalya Brown 2008
LECTURE 2:
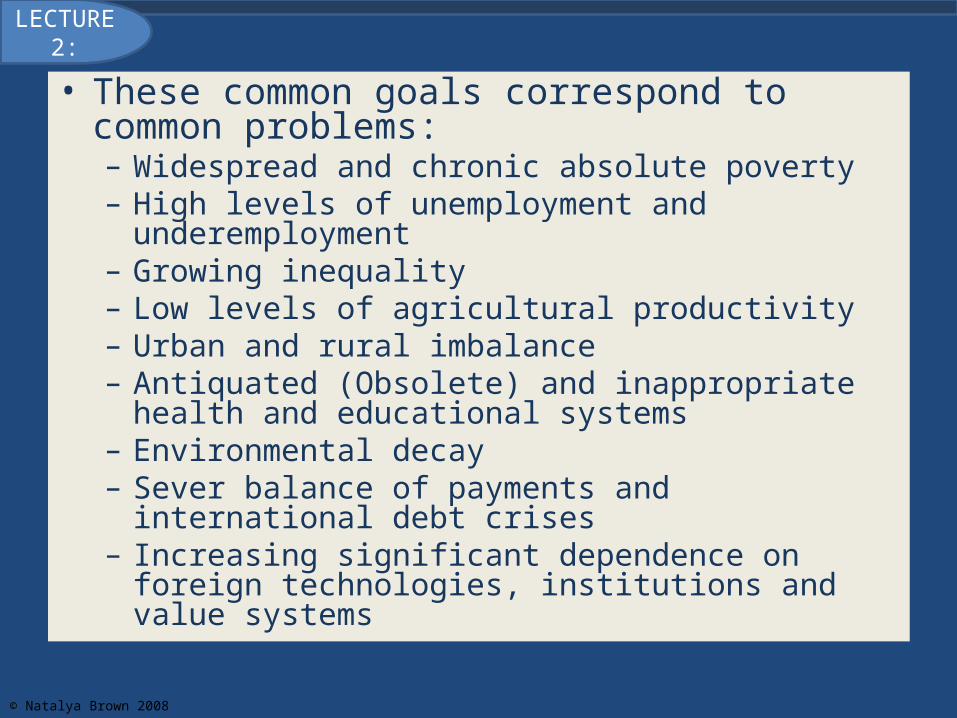
• These common goals correspond to common problems:– Widespread and chronic absolute poverty– High levels of unemployment and underemployment– Growing inequality– Low levels of agricultural productivity– Urban and rural imbalance– Antiquated (Obsolete) and inappropriate health and
educational systems– Environmental decay– Sever balance of payments and international debt crises– Increasing significant dependence on foreign technologies,
institutions and value systems

© Natalya Brown 2008
LECTURE 2: Comparative Development
Structural Diversity of Developing Countries
1. Size and Income Level: physical size, size of population and level of national income per capita are important determinants of economic potential.
• Advantages of size: • Diverse Resource Endowment• Large Potential Markets• More local sources for materials and products
• Disadvantages of size:• Difficulties in administrative control and national cohesion• Increase likelihood of regional imbalances
• No relationship between size and per capita income or size and the degree of inequality.

© Natalya Brown 2008
LECTURE 2:
Five Most and Least Populated Countries and Their PPP Per Capita GDP, 2003
Most Populous Population (millions) GDP per Capita (US$)China 1,314 5,003
India 1,095 2,892
United States 298 37,562
Indonesia 245 3,361
Brazil 188 7,790
Least Populous Population (thousands) GDP per Capita (US$)St. Kitts and Nevis 39 12,404
Dominica 69 5,448
Antigua and Barbuda 69 10,294
Seychelles 82 10,232
Kiribati 105 567

© Natalya Brown 2008
LECTURE 2:
2. Historical Background• Former Colonies – educational, political and
social systems are often modeled on their former colonial rulers. • Colonial rulers introduced private property, personal
taxation and the requirement that taxes be paid in money rather than kind, shattering pre-existing social orders and exposing local communities to potential exploitation.
• Varying degree of local involvement in colonial governance also separates some developing countries.

© Natalya Brown 2008
LECTURE 2:
3. Physical and Human Resources• Physical Resources – land, minerals and other raw
materials. Large physical endowments help but they are not a guarantee for development.
• Coastal economies vs. landlocked economies• Temperate Zone vs. Tropical Zone
• Human Resources – numbers of people and their level of skill. Other key factors include:
• Cultural outlooks and attitudes toward work• Access to information• Flexibility to change and innovation• Desire for self-improvement• Quality of Public Administration

© Natalya Brown 2008
LECTURE 2:
4. Ethnic and Religious Composition• Noted acceleration in ethnic, tribal and religious
conflict since the end of the Cold War.• The greater the ethnic and religious diversity of a
country, the greater potential for instability. Economists often point to the development success stories of relatively homogenous societies like Taiwan and Singapore.
• Diversity need not lead to inequality and turmoil.

© Natalya Brown 2008
LECTURE 2:
5. Mixture of the Economy and Civil Society• Most developing countries have mixed economic
systems – both public and private ownership and use of resources. The mix varies across developing countries.
• There is also variations in the degree of foreign ownership in the private sector.
• There has been a recent shift of emphasis from public sector activities and state-run enterprises to privatization in many LDCs.
• The appropriate development policies will depend on the mix of private and public sector ownership and activities.

© Natalya Brown 2008
LECTURE 2:
Mixture and Civil Societies (cont’d)– The degree of corruption also varies– The role of non-governmental organizations
(NGOs) is also important to the development process:
• Social Problem-Solving• Targeted Public Goods Provision• Trust and Credibility• Expanding Social Inclusion

© Natalya Brown 2008
LECTURE 2:
6. Industrial Structure• The majority of developing countries are
agrarian in their social, economic and cultural outlook.
• The relative importance of the agricultural, manufacturing and service sectors varies widely across LDCs.
• Industrial Sectors• Primary: agriculture, forestry and fishing• Secondary: Manufacturing• Tertiary: Commerce, Finance, transport and services.
© Natalya Brown 2008
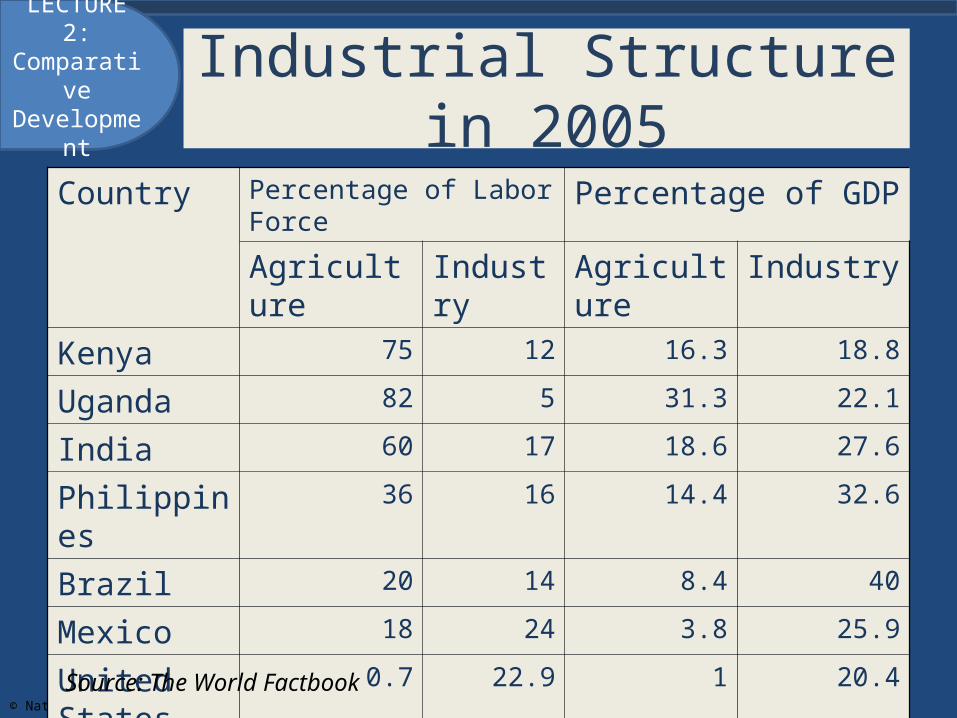
LECTURE 2: Comparative Development Industrial Structure in 2005
Country Percentage of Labor Force Percentage of GDPAgriculture Industry Agriculture Industry
Kenya 75 12 16.3 18.8
Uganda 82 5 31.3 22.1
India 60 17 18.6 27.6
Philippines 36 16 14.4 32.6
Brazil 20 14 8.4 40
Mexico 18 24 3.8 25.9
United States
0.7 22.9 1 20.4
Source: The World Factbook

© Natalya Brown 2008
LECTURE 2:
7. External Dependence – Dependence on foreign economic, social and
political forces is related to size, resource endowment and political history and is substantial for most developing countries.
– Dependence on:• Foreign investment and trade• Importation of foreign capital-intensive technologies of
production• International transmission of systems of education and
governance.

© Natalya Brown 2008
LECTURE 2:
8. Political Structure, Power and Interest Groups– The distribution of power among military, industrialists,
land owners, high-level civil servants, money lenders and so on, varies across countries
– Social and economic change requires either the support of the ruling elite or that the power of the elites be offset by more powerful democratic forces.
– The success of economic and social development hinges on the ability of social, political legal and economic institutions to change.

© Natalya Brown 2008
LECTURE 2: Comparative Development
Annual Growth Rates of GDP per Capita (%)
Country 1975-2003 1990-2003
Kenya 0.2 -0.6Uganda 2.6 3.9India 3.3 4.0Philippines 0.3 1.2Brazil 0.8 1.2Mexico 0.9 1.4Haiti -2.3 -2.8China 8.2 8.5

© Natalya Brown 2008
LECTURE 2: Comparative Development Human Development Index
Index number between 0 and 1, combining income, health and education measures.
• High human development 0.895 • Medium human development 0.718 • Low human development 0.486
© Natalya Brown 2008
LECTURE 2: Comparative Development
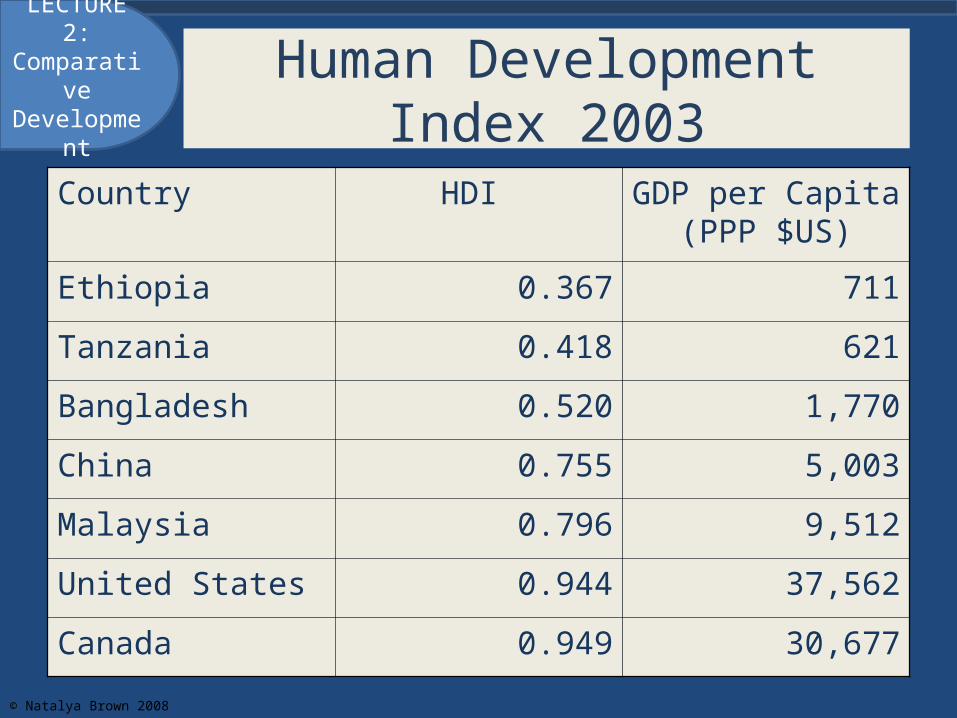
Human Development Index 2003
Country HDI GDP per Capita (PPP $US)
Ethiopia 0.367 711
Tanzania 0.418 621
Bangladesh 0.520 1,770
China 0.755 5,003
Malaysia 0.796 9,512
United States 0.944 37,562
Canada 0.949 30,677
© Natalya Brown 2008
LECTURE 2:
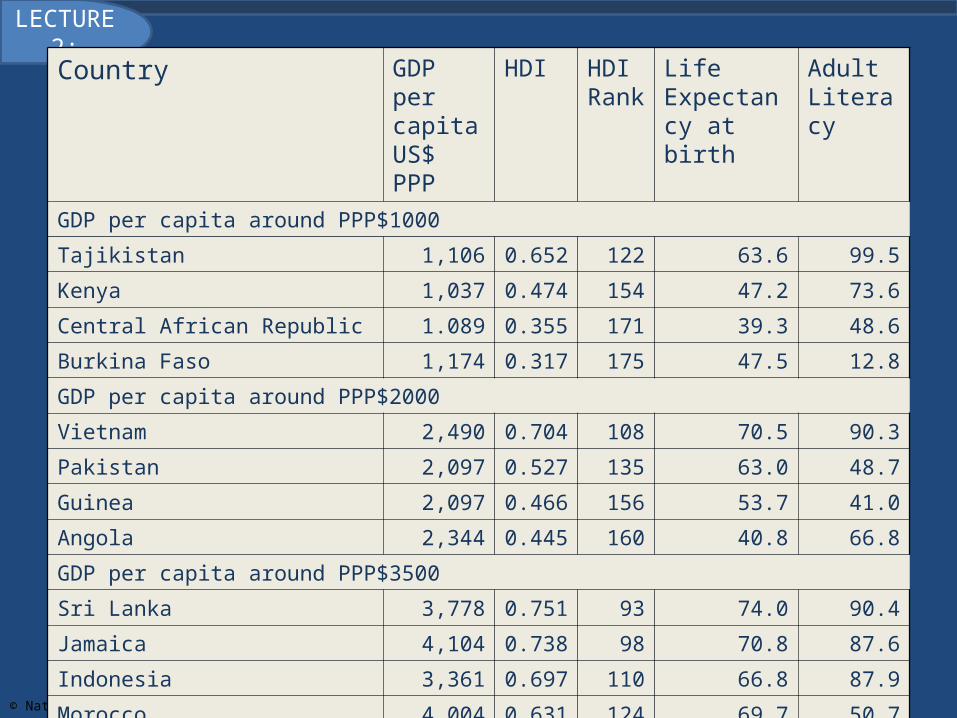
Country GDP per capita US$ PPP
HDI HDI Rank
Life Expectancy at birth
Adult Literacy
GDP per capita around PPP$1000
Tajikistan 1,106 0.652 122 63.6 99.5
Kenya 1,037 0.474 154 47.2 73.6
Central African Republic 1.089 0.355 171 39.3 48.6
Burkina Faso 1,174 0.317 175 47.5 12.8
GDP per capita around PPP$2000
Vietnam 2,490 0.704 108 70.5 90.3
Pakistan 2,097 0.527 135 63.0 48.7
Guinea 2,097 0.466 156 53.7 41.0
Angola 2,344 0.445 160 40.8 66.8
GDP per capita around PPP$3500
Sri Lanka 3,778 0.751 93 74.0 90.4
Jamaica 4,104 0.738 98 70.8 87.6
Indonesia 3,361 0.697 110 66.8 87.9
Morocco 4,004 0.631 124 69.7 50.7

© Natalya Brown 2008
LECTURE 2: Comparative Development Common Characteristics
1. Low Levels of Living2. Low Levels of Productivity3. High Rates of Population Growth and Dependency
Burdens4. Dependence on Agricultural Production and
Primary-Product Exports5. Imperfect Markets and Incomplete Information6. Dependence and Vulnerability in International
Relations

© Natalya Brown 2008
LECTURE 2:
1. Low Levels of Living• Low Incomes measured by either Gross
Domestic Product (GDP) per capita or Gross National Income (GNI) per capita• GDP – the total value for final use of output produced
by an economy, by both residents and nonresidents. • GNI – total domestic and foreign value added claimed
by a countries residents without making depreciation deductions for the country’s capital stock.GNI = GDP + (income residents receive from abroad – payments
made to nonresidents)

© Natalya Brown 2008
LECTURE 2:
Low Levels of Living (cont’d)– In 2002, over 80% of the world’s income was
produced by 15% of the world’s population.– When comparing GNI and GDP across countries
using exchange rates, one must be careful. Conversion through exchange rates often does not reflect differences in domestic purchasing power.
• Purchasing Power Parity (PPP)– uses a common set of international prices for all good and services produced and valuing goods in all countries in US prices.
© Natalya Brown 2008
LECTURE 2:
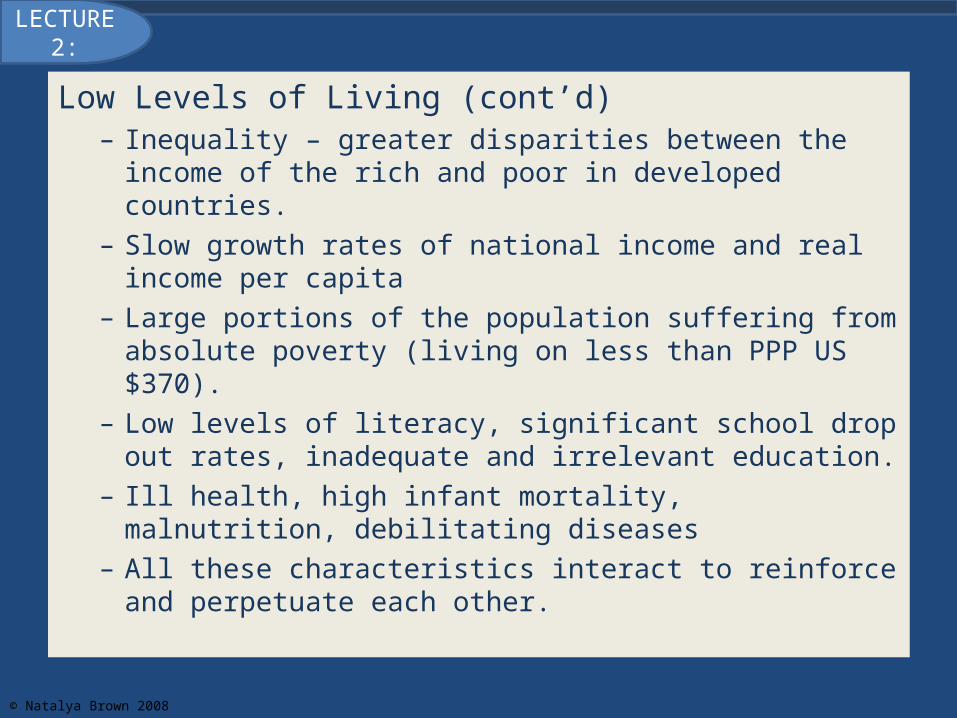
Low Levels of Living (cont’d)– Inequality – greater disparities between the income of the
rich and poor in developed countries.– Slow growth rates of national income and real income per
capita– Large portions of the population suffering from absolute
poverty (living on less than PPP US $370).– Low levels of literacy, significant school drop out rates,
inadequate and irrelevant education.– Ill health, high infant mortality, malnutrition, debilitating
diseases– All these characteristics interact to reinforce and
perpetuate each other.
© Natalya Brown 2008
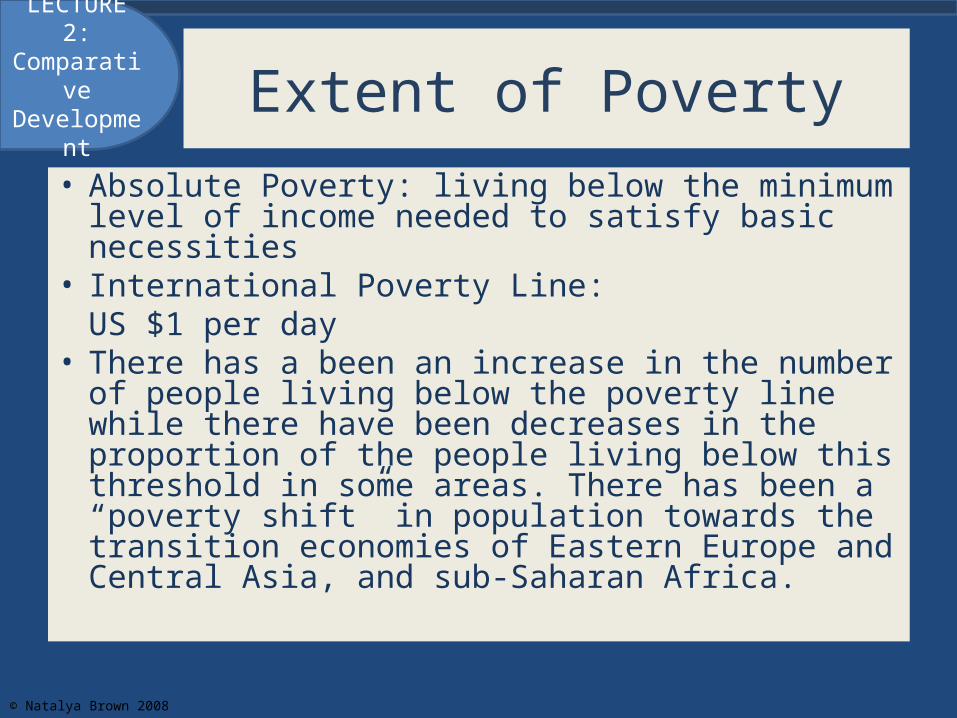
LECTURE 2: Comparative Development Extent of Poverty
• Absolute Poverty: living below the minimum level of income needed to satisfy basic necessities
• International Poverty Line:US $1 per day
• There has a been an increase in the number of people living below the poverty line while there have been decreases in the proportion of the people living below this threshold in some areas. There has been a “poverty shift” in population towards the transition economies of Eastern Europe and Central Asia, and sub-Saharan Africa.

© Natalya Brown 2008
LECTURE 2: Comparative Development Purchasing Power Parity
• PPP is defined as the number of units of a foreign country’s currency required to purchase the identical quantity of good and services in the local market as would US$1 buy in the United States.
• If domestic prices in LDCs are low, then measures of GNI per capita will be lower than those using PPP and will exaggerate differences.
• Example: China’s GDP in 2002, was US$960 according to exchange rate conversion but using PPP it was US$4,520.

© Natalya Brown 2008
LECTURE 2: Comparative Development
Growth Rates of Real GNI Per Capita
Country 1980-1990 1990-2000
Kenya 0.3 -0.3
Uganda 0.8 4.1
India 3.2 4.2
Philippines -1.5 1.0
Brazil 0.6 1.5
Mexico -0.9 1.5

© Natalya Brown 2008
LECTURE 2: Comparative Development Human Development Index
• UNDP’s measure of socioeconomic development that attempts to rank all countries on a scale of 0 (low) to 1 (high) of human development based on three indicators of development.– Knowledge: measured by a weighted average of adult
literacy (2/3) and mean years of schooling (1/3)– Longevity: measured by life expectancy at birth– Standard of Living: measured by real per capita income
adjusted for differences in purchasing power parity.• These three measures are combined into a formula
to calculate the score.

© Natalya Brown 2008
LECTURE 2: Comparative Development HDI (cont’d)
• Country Categories:– Low Human Development: 0.0 to 0.499– Medium Human Development: 0.50 to 0.799– High Human Development: 0.80 to 1.0

© Natalya Brown 2008
LECTURE 2: Comparative Development Calculating HDI
• Income Index (I.I.)I.I. = [log(Y) – log(100)]
log (40,000) –log(100)where Y is the country’s PPP income per capita$100 is considered the “lower goalpost” for income.
• Life Expectancy Index (L.E.I.)L.E.I. = X – 25
85-25where X is the country’s life expectancy at birth.

© Natalya Brown 2008
LECTURE 2: Comparative Development Calculating HDI
• Adult Literacy Index (A.L.I.) • Gross Enrollment Index (G.E.I.) • Education Index (E.I.):
E.I. = (2/3)(A.E.I.) + (1/3)(G.E.I.)
HDI=(1/3)(I.I.) + (1/3)(L.E.I.) + (1/3)(E.I.)

© Natalya Brown 2008
LECTURE 2: Comparative Development
Human Development Index 2003
Country HDI GDP per Capita (PPP $US)
Ethiopia 0.367 711
Tanzania 0.418 621
Bangladesh 0.520 1,770
China 0.755 5,003
Malaysia 0.796 9,512
United States 0.944 37,562
Canada 0.949 30,677

© Natalya Brown 2008
LECTURE 2:Country GDP per capita US$ PPP
HDI HDI Rank
Life Expectancy at birth
Adult Literacy
GDP per capita around PPP$1000
Tajikistan 1,106 0.652 122 63.6 99.5
Kenya 1,037 0.474 154 47.2 73.6
Central African Republic 1.089 0.355 171 39.3 48.6
Burkina Faso 1,174 0.317 175 47.5 12.8
GDP per capita around PPP$2000
Vietnam 2,490 0.704 108 70.5 90.3
Pakistan 2,097 0.527 135 63.0 48.7
Guinea 2,097 0.466 156 53.7 41.0
Angola 2,344 0.445 160 40.8 66.8
GDP per capita around PPP$3500
Sri Lanka 3,778 0.751 93 74.0 90.4
Jamaica 4,104 0.738 98 70.8 87.6
Indonesia 3,361 0.697 110 66.8 87.9
Morocco 4,004 0.631 124 69.7 50.7

© Natalya Brown 2008
LECTURE 2: Comparative Development Issues with HDI
• Shows that at a low level of income a country can do much better than might be expected and that substantial income gains can still accomplish very little human development.
• Gross enrollment often overstates the amount of schooling.
• Weighting of components• Quality of measures: e.g. schooling

© Natalya Brown 2008
LECTURE 2: Comparative Development Common Characteristics (cont’d)
2. Low Levels of Productivity• LDCs are characterized by low levels of labor productivity not just in
physical abilities but also in– Managerial competence– Access to information– Worker motivation– Institutional flexibility
• These low levels are due in great part to the lack of complementary factors of production such as physical capital and managerial experience.

© Natalya Brown 2008
LECTURE 2:
• Policies that encourage domestic and foreign investment in physical and human capital would go a long way in improving a country’s development potential.
• Other policies include:– Land reform– Corporate Tax incentives– Credit and Banking reform– Independent, efficient and honest administrative services– Restructuring of educational and training programs
• The development success stories of the four Asian Tigers – Hong Kong, Singapore, South Korea, Taiwan – has often been attributed to the quality of their human resources
• There is an obvious link between health, nutrition and labour productivity – mutually reinforcing interactions between low living levels and low productivity - vicious cycle.

© Natalya Brown 2008
LECTURE 2:
3. High Rates of Population Growth and Dependency Burdens
• There are significant differences in birth and death rates between the developing and developed world.
Crude Birthrate = Yearly # of Live Births per
1000 population
Death Rate = Yearly # of Death per 1000 population

© Natalya Brown 2008
LECTURE 2:
• 20 per 1000 population seems to be the “dividing line” with the majority of developing countries with birthrates exceeding and no developed countries with birthrates above this.
• While the death rate is also higher in developing countries, the difference is less than is the case with birthrates.
• Put together developing countries are experiencing higher rates of population growth.

© Natalya Brown 2008
LECTURE 2:
• Demographic differences– As an implication of high LDC birthrates, children under 15 compose
almost 40% of the total population in many developing countries. Compare this to 20% in developed nations.
– This means that the active labour force must support proportionally almost twice as many children as it does in richer countries.
• Dependency Burden– This is the population of children and elderly– The dependency burden is as high as 45% in some developing
countries. On average it is a third of the population in developing countries.
– 90% of the dependency burden in developing countries are children as compared to 66% in the developed world.
– Later we will discuss the implications of population growth for economic development.
© Natalya Brown 2008
LECTURE 2:
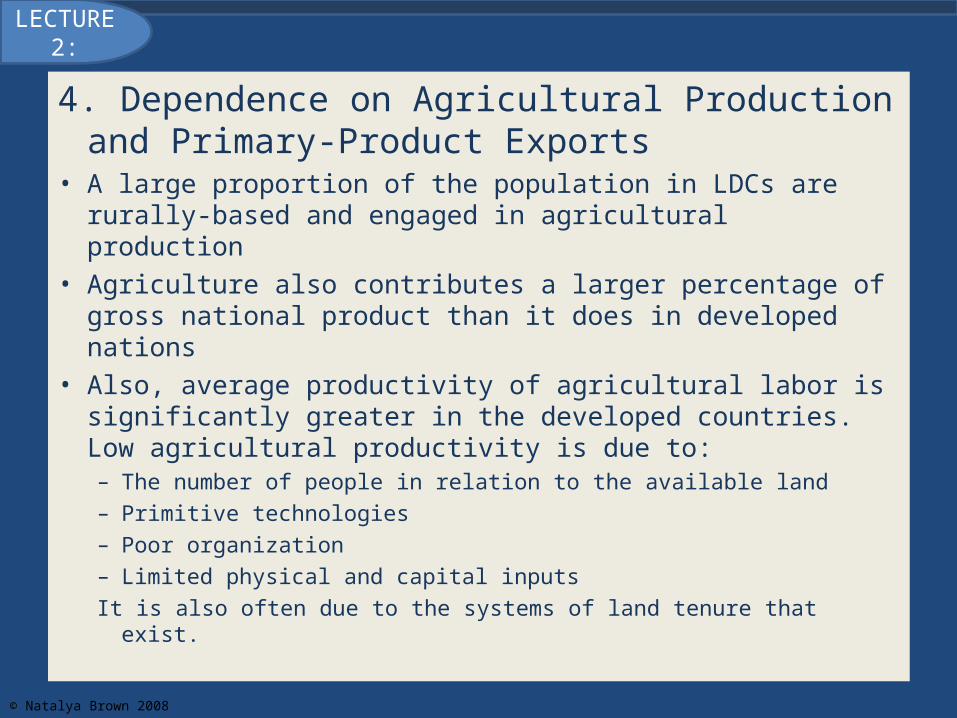
4. Dependence on Agricultural Production and Primary-Product Exports
• A large proportion of the population in LDCs are rurally-based and engaged in agricultural production
• Agriculture also contributes a larger percentage of gross national product than it does in developed nations
• Also, average productivity of agricultural labor is significantly greater in the developed countries. Low agricultural productivity is due to:– The number of people in relation to the available land– Primitive technologies– Poor organization– Limited physical and capital inputsIt is also often due to the systems of land tenure that exist.

© Natalya Brown 2008
LECTURE 2:
• Why is there such a high concentration of the population of developing countries in agriculture?– At low incomes peoples first priorities are food, clothing and shelter.
• Comparative Dependence on Primary Goods– Primary Goods: agricultural products, fuel, forestry and raw materials– Most LDC economies are still oriented towards the production of
primary goods, and these goods form their main exports– Primary good exports account for a significant portion of foreign
exchange earnings – foreign exchange that is needed in order to finance development projects. Unfortunately most of the foreign exchange earned by exports has been used to pay interest on foreign debt by many LDCs.
– Many non-oil producing LDCs have also experienced slow export growth and declining prices for much of their simple manufactures (e.g. textiles and garments).

© Natalya Brown 2008
LECTURE 2:
5. Imperfect Markets and Incomplete Information• The benefits of market economies and market-friendly policies depend
heavily on the existence of institutional, cultural, and legal prerequisites that we take for ranted in industrial societies. These institutions are often absent or weak in LDCs. What is needed:– A legal system that enforces contracts and defends property rights– A stable and trustworthy currency– Reliable infrastructure and utilities– Well-developed system of banking and insurance– Formal credit markets that assign financial resources based on profitability and
enforce rules of payment– Market information for consumers, producers, as well as information about
creditworthiness for lenders.– Norms of behaviour that facilitated long-term business relationships

© Natalya Brown 2008
LECTURE 2:
Markets in LDCs are often highly imperfect– Economies of scale and thin markets– Widespread externalities– Prevalence of common property
Information is limited and costly to obtainresulting in misallocation of resources.

© Natalya Brown 2008
LECTURE 2:
6. Dependence and Vulnerability in International Relations
• There exists a highly unequal distribution of economic and political power between rich and poor nations. The dominant power of rich nations is manifested in– their ability to dictate the patterns of international trade
and the agreements regulating it– their power to set the terms by which technology, foreign
aid, and private capital are transferred to developing countries
– the transfer of developed world values, attitudes, institutions and standards of behaviour.
– inappropriate educational structures, curricula– the formation of Western-style trade unions
© Natalya Brown 2008
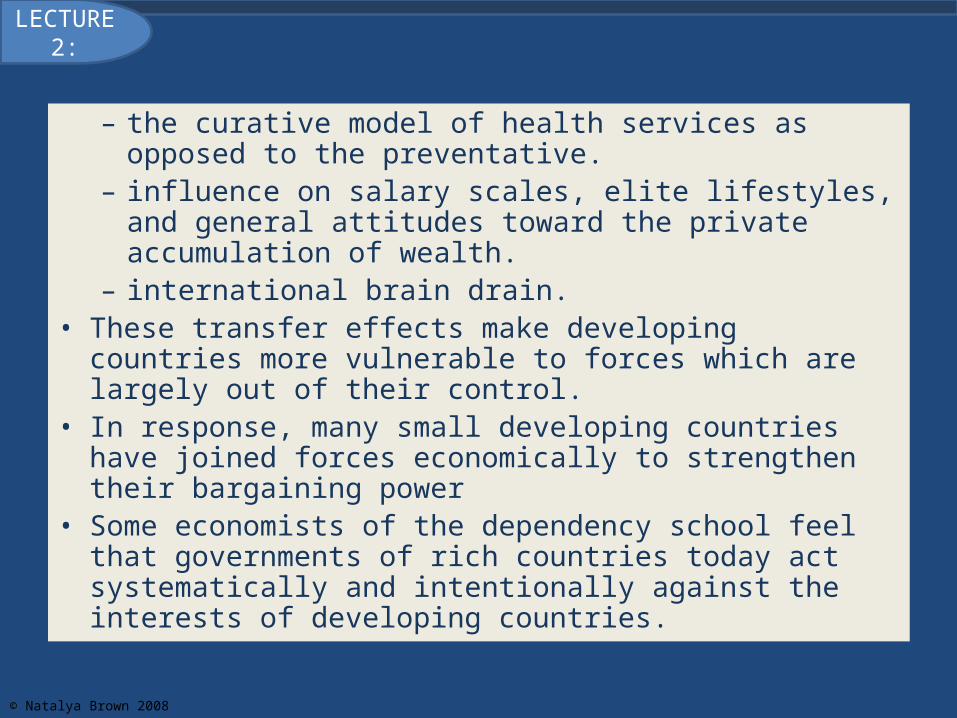
LECTURE 2:
– the curative model of health services as opposed to the preventative.
– influence on salary scales, elite lifestyles, and general attitudes toward the private accumulation of wealth.
– international brain drain.• These transfer effects make developing countries more
vulnerable to forces which are largely out of their control.• In response, many small developing countries have joined
forces economically to strengthen their bargaining power• Some economists of the dependency school feel that
governments of rich countries today act systematically and intentionally against the interests of developing countries.

© Natalya Brown 2008
LECTURE 2: Comparative Development
Developing Countries of Today vs. Developed Countries in Their Early Stages
Differences in Initial Conditions:1. Physical and human resource endowment2. Relative per capita incomes and levels of GDP3. Climate4. Population size, distribution and growth5. International Migration6. International trade benefits7. Basic scientific and technological R&D capabilities8. Stability and flexibility of political and social institutions9. Efficacy of domestic economic institutions

© Natalya Brown 2008
LECTURE 2: Comparative Development Resource Endowments
• Most LDCs are less endowed with natural resources than the currently developed countries were at the time they began their modern growth. For those with natural resources, it is often the case that the countries lack the capital equipment needed to exploit their natural resources.
• Knowledge/Idea/Ingenuity Gap– No such human resource gap existed for the now
developed countries on the eve of their industrialization.

© Natalya Brown 2008
LECTURE 2: Comparative Development Relative Incomes
• LDCs on average have lower levels of real GDP per capita than the developed countries of today had in the 19th century.
• Today’s developed countries were also in a more relatively favorable position – they were economically in advance of the rest of the world at the beginning of their modern growth. Contrast that with the developing countries today who are in a relatively weaker economic position.

© Natalya Brown 2008
LECTURE 2: Comparative Development Climate
• Climatic Differences– Is it a coincidence that the most successful countries are
located in the temperate zone and that most of the developing world is located in the tropical and sub-tropical zones?
– Differences in climatic conditions cannot be ignored. They affect
• Soil quality and the rate of depreciation of natural resources• Productivity of crops and the health of livestock• Worker health, motivation, productivity and efficiency

© Natalya Brown 2008
LECTURE 2: Comparative Development
Population Size, Distribution and Growth
• Before and during their early stages of growth, developed countries experienced a slow rise in population growth, then growth rates increased in response to industrialization. However growth rates were never at the levels currently being experienced by the developing countries of today.
• Also, these large and rapidly growing populations are often concentrated geographically. LDCs today have higher person-to-land ratios than the European countries did in their early stages.
© Natalya Brown 2008
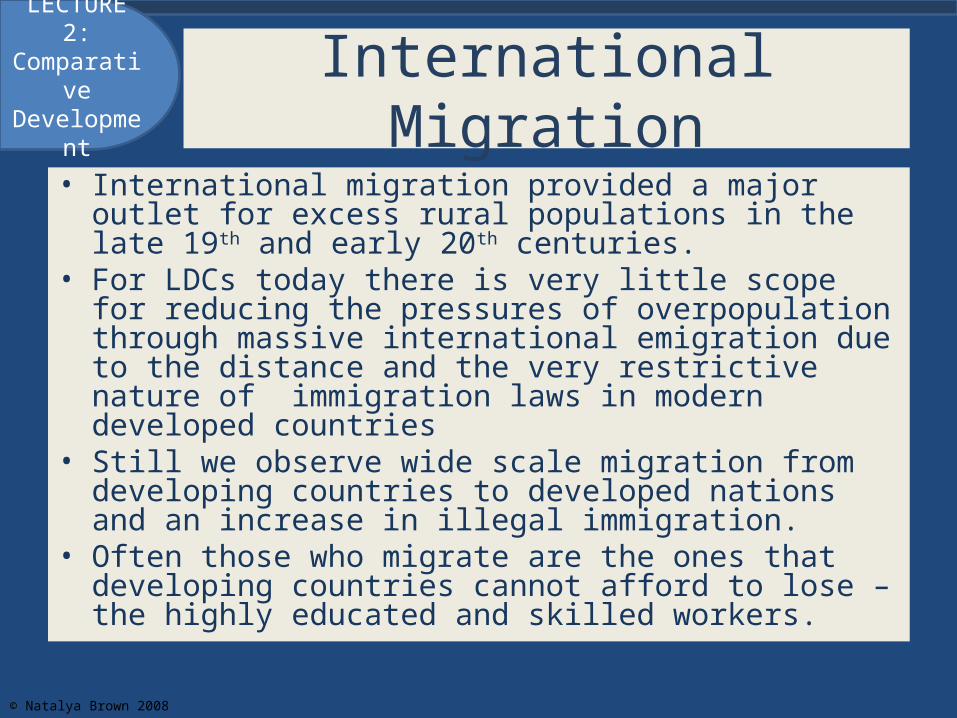
LECTURE 2: Comparative Development International Migration
• International migration provided a major outlet for excess rural populations in the late 19th and early 20th centuries.
• For LDCs today there is very little scope for reducing the pressures of overpopulation through massive international emigration due to the distance and the very restrictive nature of immigration laws in modern developed countries
• Still we observe wide scale migration from developing countries to developed nations and an increase in illegal immigration.
• Often those who migrate are the ones that developing countries cannot afford to lose – the highly educated and skilled workers.

© Natalya Brown 2008
LECTURE 2: Comparative Development Trade Benefits
• International free trade was the engine of growth for many of today’s advanced economies.– Expanding export markets and growing local demand
encouraged the development of large scale manufacturing– Political stability enabled foreign borrowing at low interest
rates. – Free trade, free capital movements, relatively unrestricted
international migration of surplus labour
© Natalya Brown 2008
LECTURE 2:
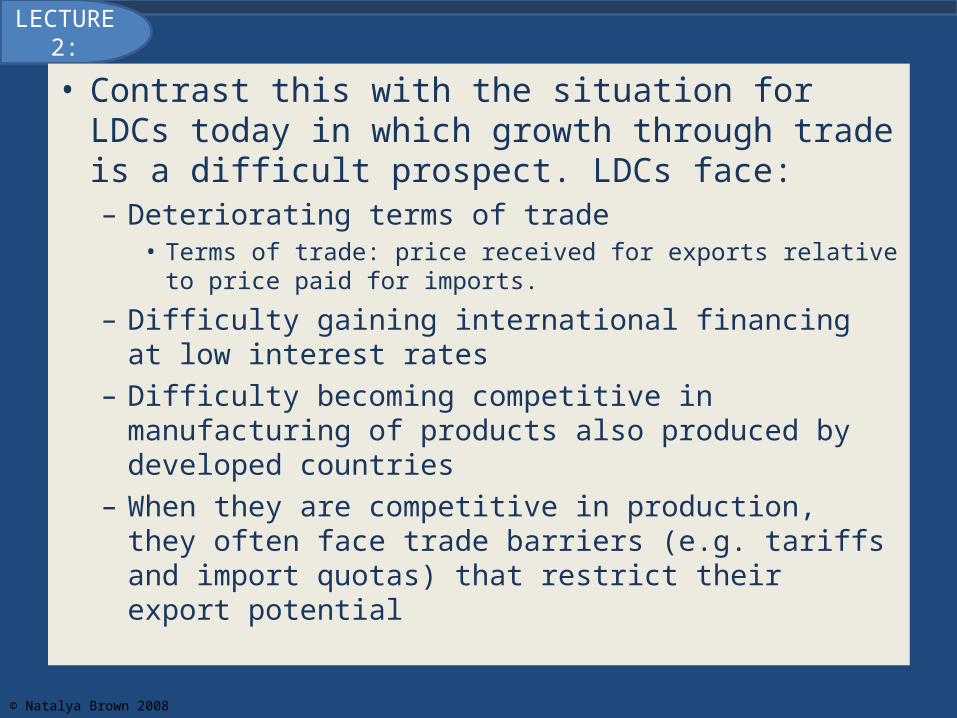
• Contrast this with the situation for LDCs today in which growth through trade is a difficult prospect. LDCs face:– Deteriorating terms of trade
• Terms of trade: price received for exports relative to price paid for imports.
– Difficulty gaining international financing at low interest rates
– Difficulty becoming competitive in manufacturing of products also produced by developed countries
– When they are competitive in production, they often face trade barriers (e.g. tariffs and import quotas) that restrict their export potential

© Natalya Brown 2008
LECTURE 2: Comparative Development R&D Capabilities
• Over 90% of the world’s R&D expenditures originate in the developed world.
• Research funds are also channeled towards solving the economic problems of developed countries.
• Poor countries are interested in simple products and design that make use of their abundant labour force and save capital, focusing production for smaller markets. They often lack the financial resources and know-how to conduct R&D that is tailored to their own economic interests.
• Internal economic dualism• The developed countries of today were technologically
advanced relative to the rest of the world.

© Natalya Brown 2008
LECTURE 2: Comparative Development
Political and Social Institutions
• Well before their industrial revolutions, the now developed countries were independent consolidated nation-states able to pursue national policies on a basis of consensus toward modernization
• Many LDCs gained political independence recently and have yet to become consolidated nation-states. They still need to develop stable and flexible political institutions consolidated with broad public support.
• Research has shown that:– Growth is more influenced by the stability of the regime than by its
type– The transition from dictatorship to democracy may slow down growth
but that stable democracies experience higher growth rates than dictatorships.

© Natalya Brown 2008
LECTURE 2: Comparative Development
Domestic Economic Institutions
• The quality of institutions in terms of transparency, ease and speed of conflict resolution mechanisms, the provision of property rights were of a higher calibre for the developing countries in their early stages.
• Often systems put in place by colonizers were established to help them maintain their own dominance and to extract resources rather than to encourage economic development.

© Natalya Brown 2008
LECTURE 2: Comparative Development Convergence
• Are living standards converging between the developed and developing world?
• Arguments for “catching up”:– Technology transfer: LDCs don’t have to reinvent the wheel but can
benefit from the technological innovation of developed countries– Factor accumulation: the impact of additional capital on output should
be higher in developing countries – law of diminishing marginal product.
• Actual evidence of convergence is hard to find and there is some evidence that the poor countries are growing more slowly.
• Also as we have seen, initial growth conditions are not the same.

© Natalya Brown 2008
LECTURE 2: Comparative Development Key Points
• Even within development countries there exist significant structural differences that have played a key role in their development progress
• Despite these differences, developing countries face similar challenges.
• While developing countries can learn from the growth experience of today’s developed countries in their early stages, initial growth conditions are not the same and so the growth strategies that were appropriate then are not directly applicable.
• There is little evidence of convergence in the living levels of the richest and poorest nations.