![Alanis Morisette - That I Would Be Good [Transcription]](https://static.fdocuments.us/doc/165x107/577ce47d1a28abf1038e7753/alanis-morisette-that-i-would-be-good-transcription.jpg)
-IKONOS, ETM, MODIS NDVI: comparison -Jeff Morisette, MODLAND, SSAI -Positive Systems for...
24
- IKONOS, ETM, MODIS NDVI: comparison - Jeff Morisette, MODLAND, SSAI - Positive Systems for Appalachian Transect - Rob Sohlberb, MODLAND, UMd - Report from Stennis Space Center on SDP validation activities - Mary Pagnutti, SSC - One Ikonos DEM/Stereo Pair for Barton Bendish site - J. Peter Muller, MODLAND, ULC NASA’s: Science Data Purchase
-
Upload
nigel-payne -
Category
Documents
-
view
220 -
download
0
Transcript of -IKONOS, ETM, MODIS NDVI: comparison -Jeff Morisette, MODLAND, SSAI -Positive Systems for...

- IKONOS, ETM, MODIS NDVI: comparison- Jeff Morisette, MODLAND, SSAI
- Positive Systems for Appalachian Transect- Rob Sohlberb, MODLAND, UMd
- Report from Stennis Space Center on SDP validation activities
- Mary Pagnutti, SSC
- One Ikonos DEM/Stereo Pair for Barton Bendish site- J. Peter Muller, MODLAND, ULC
NASA’s: Science Data Purchase
NASA’s: Science Data Purchase
One approach to scalingOne approach to scaling
Comparing ETM+, IKONOS, and MODIS NDVI products
Framed in the context of statistical hypothesis testing
J. Morisette
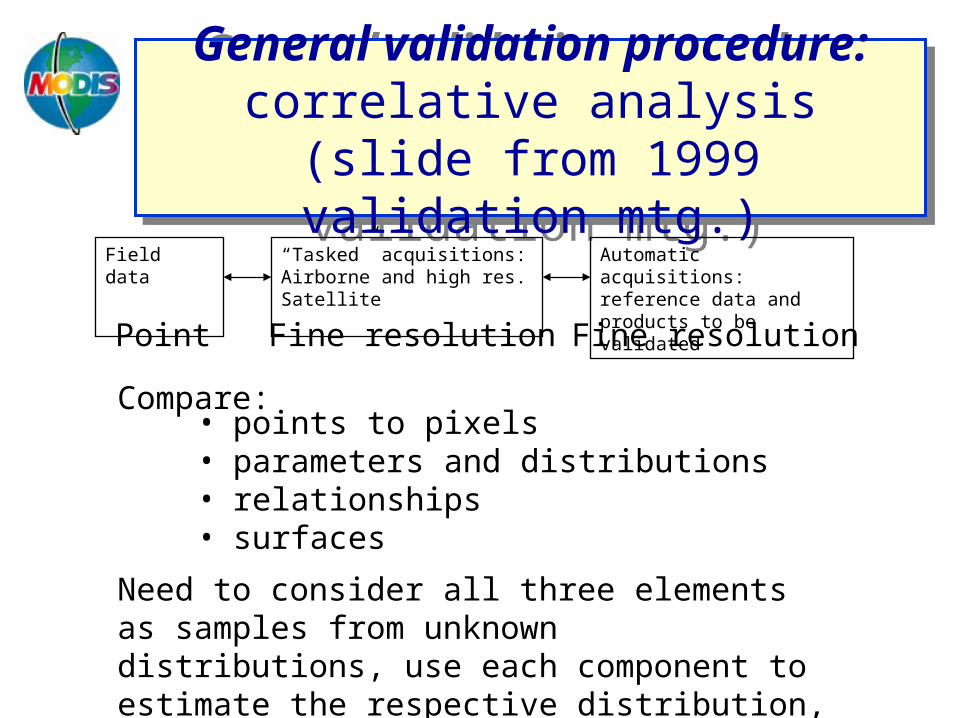
General validation procedure: correlative analysis
(slide from 1999 validation mtg.)
General validation procedure: correlative analysis
(slide from 1999 validation mtg.)Field data
“Tasked” acquisitions:Airborne and high res. Satellite
Automatic acquisitions:reference data and products to be validated
Compare:
Need to consider all three elements as samples from unknown distributions, use each component to estimate the respective distribution, and compare distributions
• points to pixels• parameters and distributions• relationships • surfaces
Point Fine resolution Fine resolution

0
0.05
0.1
0.15
0.2
0.25
0.3
0.35
0.4
0.45
500 600 700 800 900 1000 1100
Spectral Bands, Red and NIR
Spectral Bands, Red and NIR
Difference may be important: Gitelson and Kaufman, 1998; Bo-Cai Gao, 2000; which compared MODIS to AVHRR and found large differences in NDVI
*ASD spectrum from grass area near GSFC
AVHRR
IKONOS
ETM+
MODIS
grass reflectance*
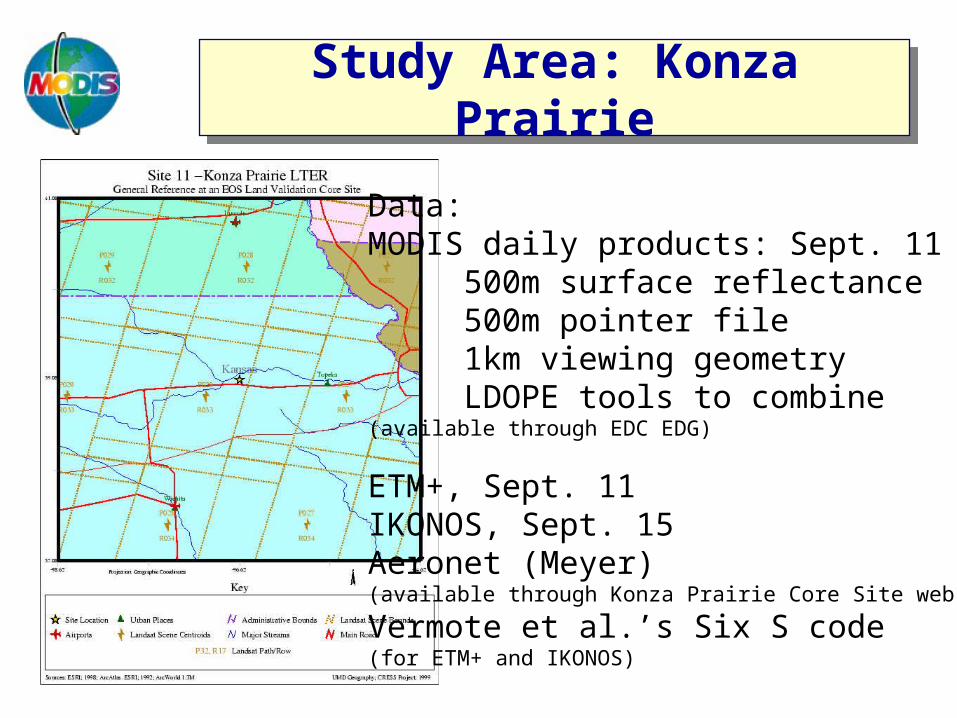
Study Area: Konza Prairie
Study Area: Konza Prairie
Data:MODIS daily products: Sept. 11
500m surface reflectance500m pointer file1km viewing geometryLDOPE tools to combine
(available through EDC EDG)
ETM+, Sept. 11IKONOS, Sept. 15Aeronet (Meyer)(available through Konza Prairie Core Site web page)
Vermote et al.’s Six S code(for ETM+ and IKONOS)
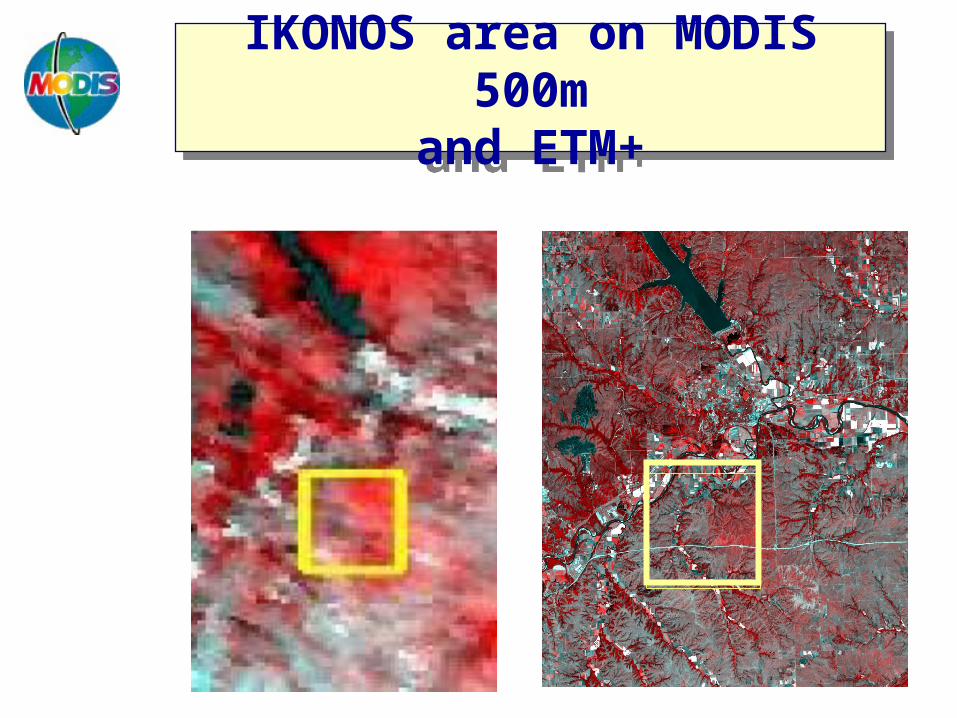
IKONOS area on MODIS 500m
and ETM+
IKONOS area on MODIS 500m
and ETM+
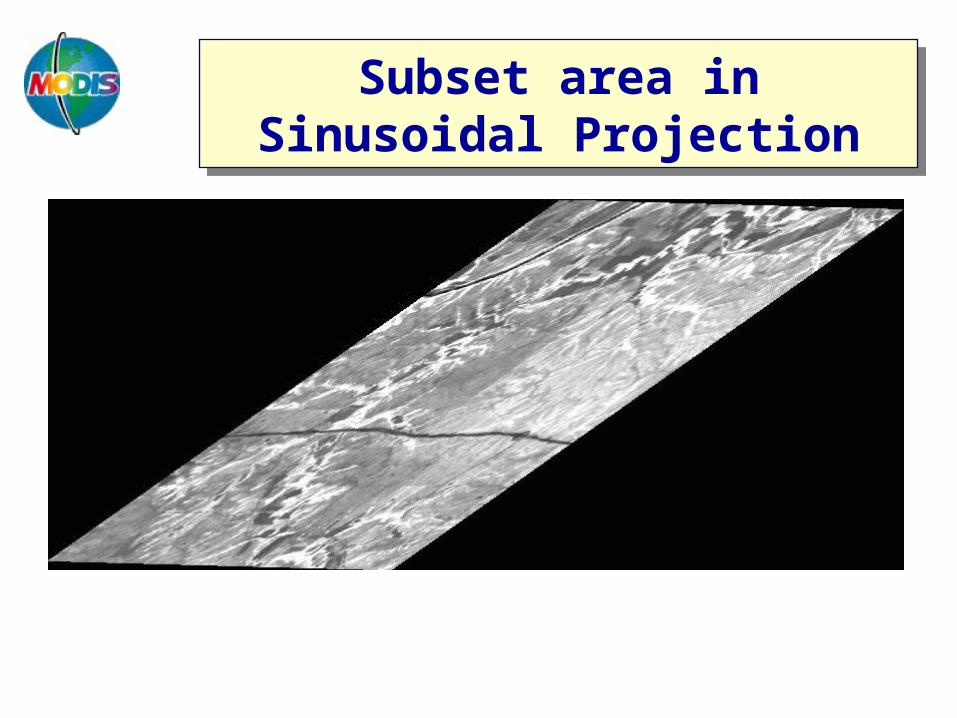
Subset area in Sinusoidal Projection
Subset area in Sinusoidal Projection
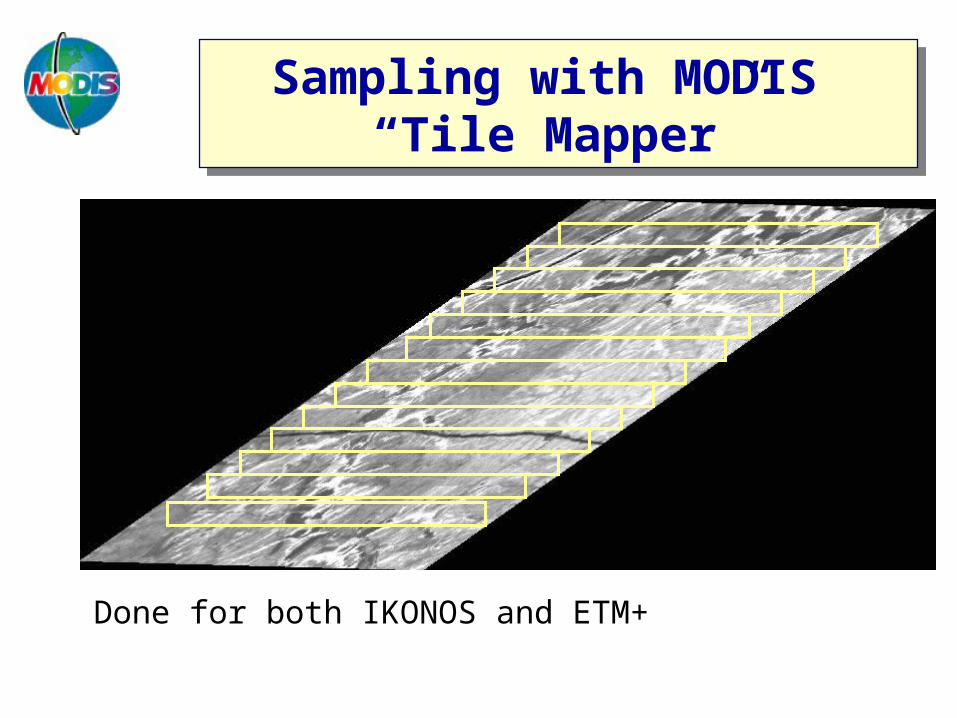
Sampling with MODIS “Tile Mapper”
Sampling with MODIS “Tile Mapper”
Done for both IKONOS and ETM+
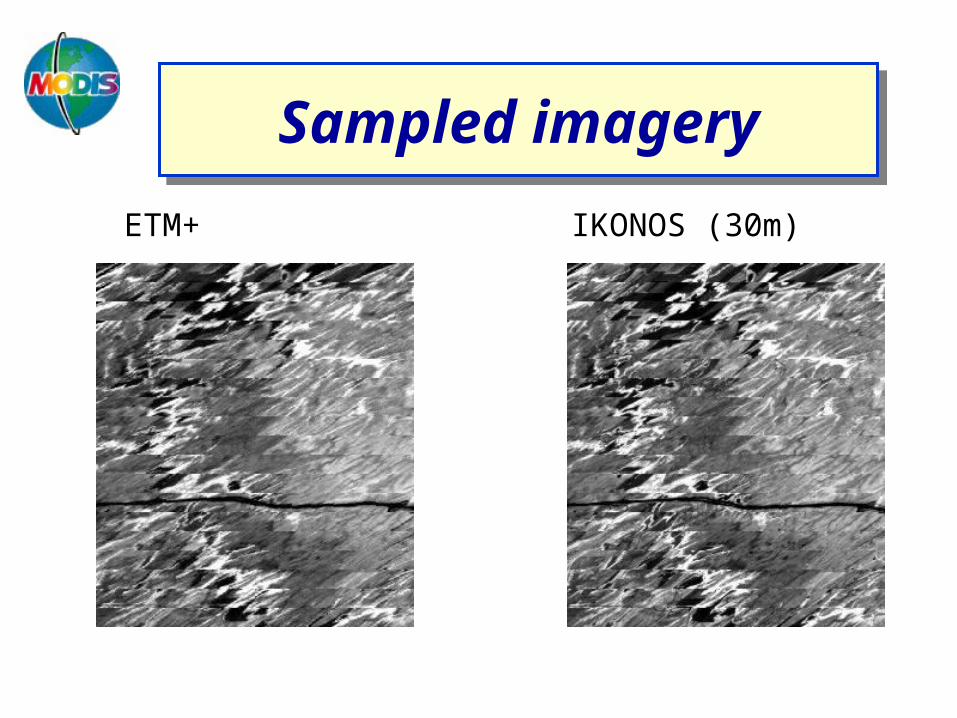
Sampled imagerySampled imagery
IKONOS (30m)ETM+
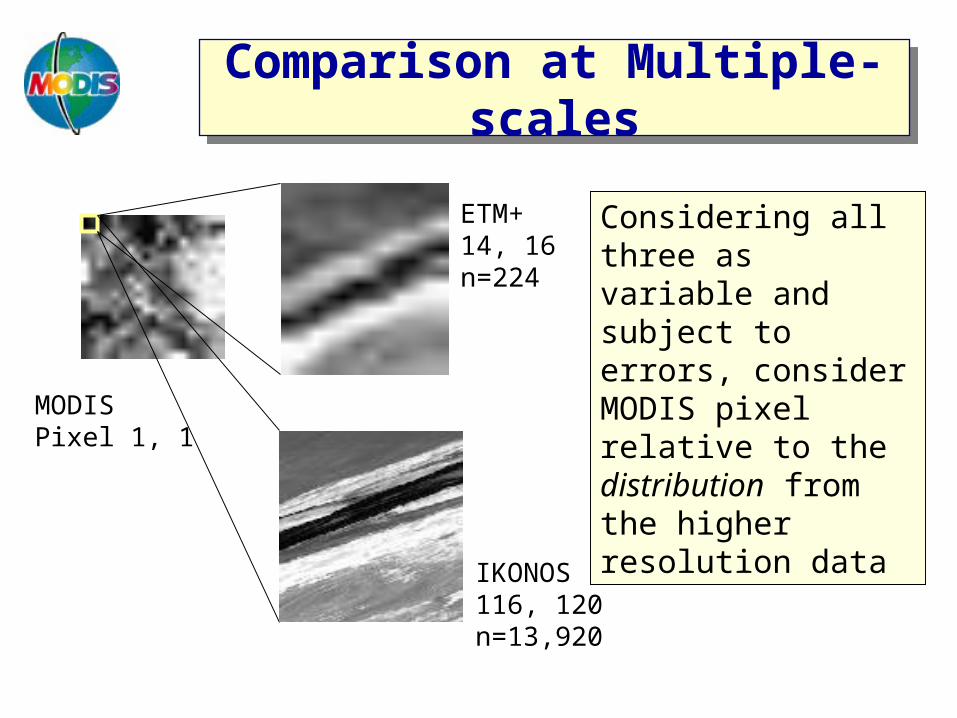
Comparison at Multiple-scales
Comparison at Multiple-scales
MODISPixel 1, 1
ETM+14, 16n=224
IKONOS116, 120n=13,920
Considering all three as variable and subject to errors, consider MODIS pixel relative to the distribution from the higher resolution data
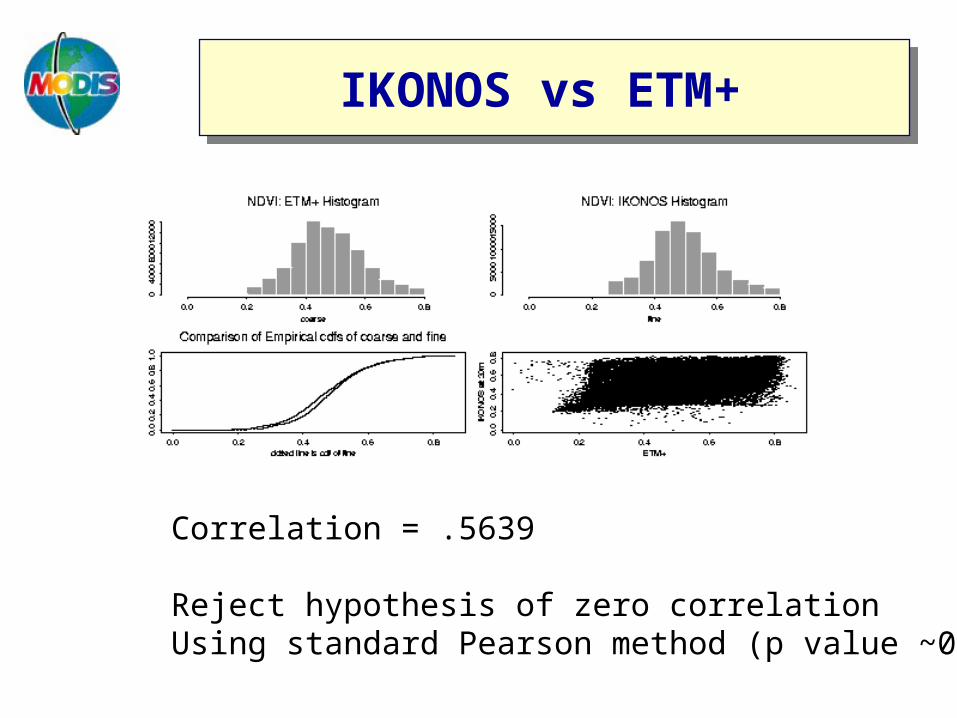
IKONOS vs ETM+ IKONOS vs ETM+
Correlation = .5639
Reject hypothesis of zero correlationUsing standard Pearson method (p value ~0)
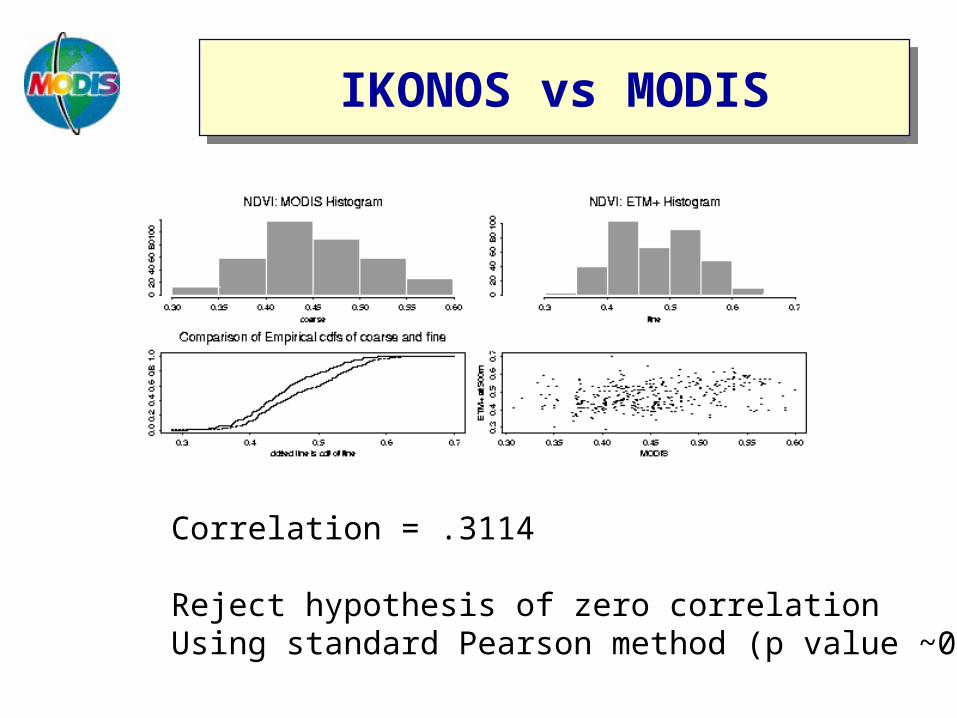
IKONOS vs MODISIKONOS vs MODIS
Correlation = .3114
Reject hypothesis of zero correlationUsing standard Pearson method (p value ~0)
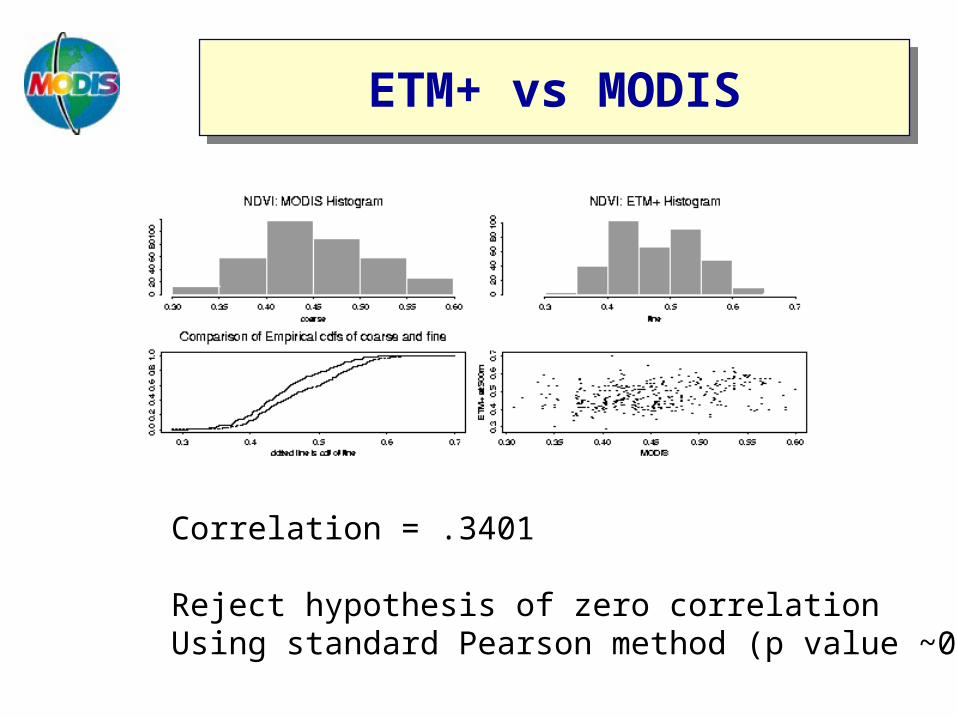
ETM+ vs MODISETM+ vs MODIS
Correlation = .3401
Reject hypothesis of zero correlationUsing standard Pearson method (p value ~0)
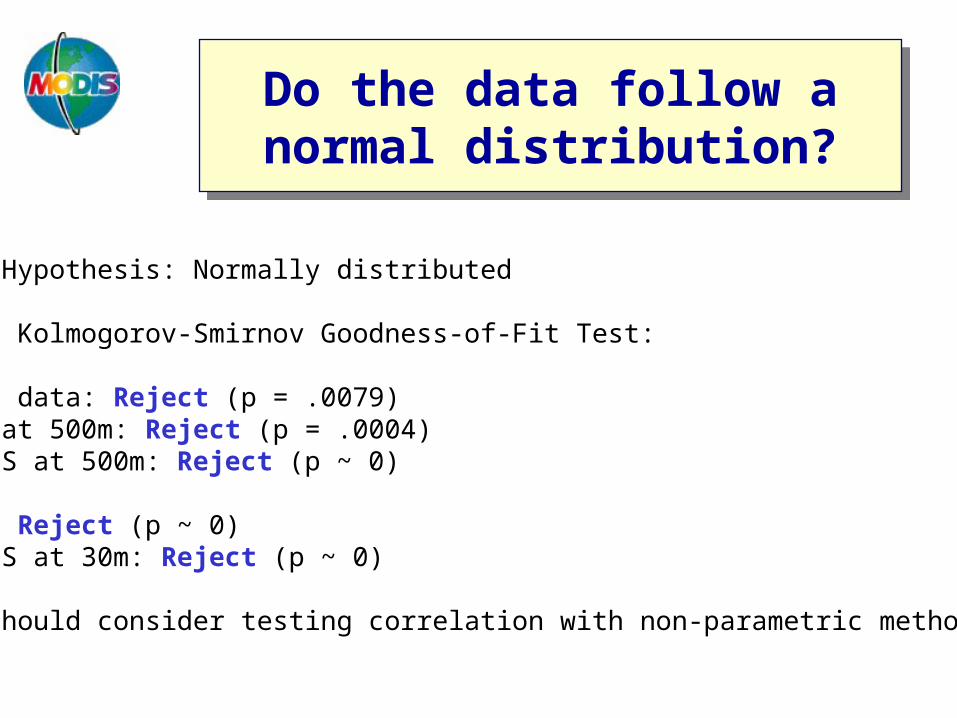
Do the data follow a normal distribution?Do the data follow a normal distribution?
Null Hypothesis: Normally distributed
Test: Kolmogorov-Smirnov Goodness-of-Fit Test:
MODIS data: Reject (p = .0079)ETM+ at 500m: Reject (p = .0004)IKONOS at 500m: Reject (p ~ 0)
ETM+: Reject (p ~ 0)IKONOS at 30m: Reject (p ~ 0)
So, should consider testing correlation with non-parametric methods.
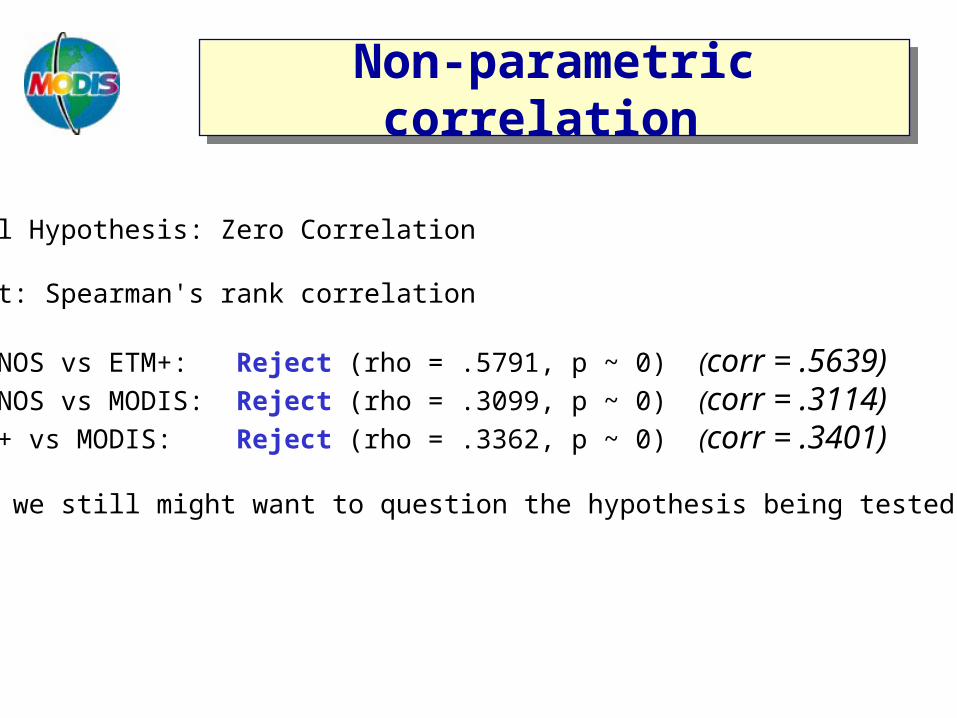
Non-parametric correlation
Non-parametric correlation
Null Hypothesis: Zero Correlation
Test: Spearman's rank correlation
IKONOS vs ETM+: Reject (rho = .5791, p ~ 0) (corr = .5639)IKONOS vs MODIS: Reject (rho = .3099, p ~ 0) (corr = .3114)ETM+ vs MODIS: Reject (rho = .3362, p ~ 0) (corr = .3401)
But we still might want to question the hypothesis being tested.
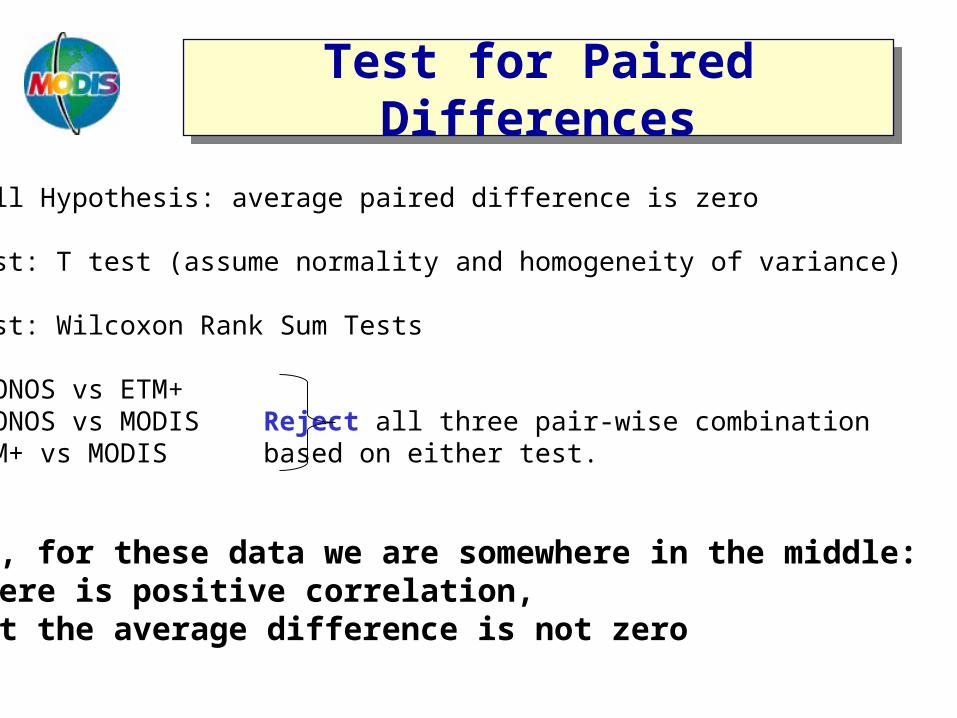
Test for Paired Differences
Test for Paired Differences
Null Hypothesis: average paired difference is zero
Test: T test (assume normality and homogeneity of variance)
Test: Wilcoxon Rank Sum Tests
IKONOS vs ETM+IKONOS vs MODIS Reject all three pair-wise combination ETM+ vs MODIS based on either test.
So, for these data we are somewhere in the middle: There is positive correlation, but the average difference is not zero
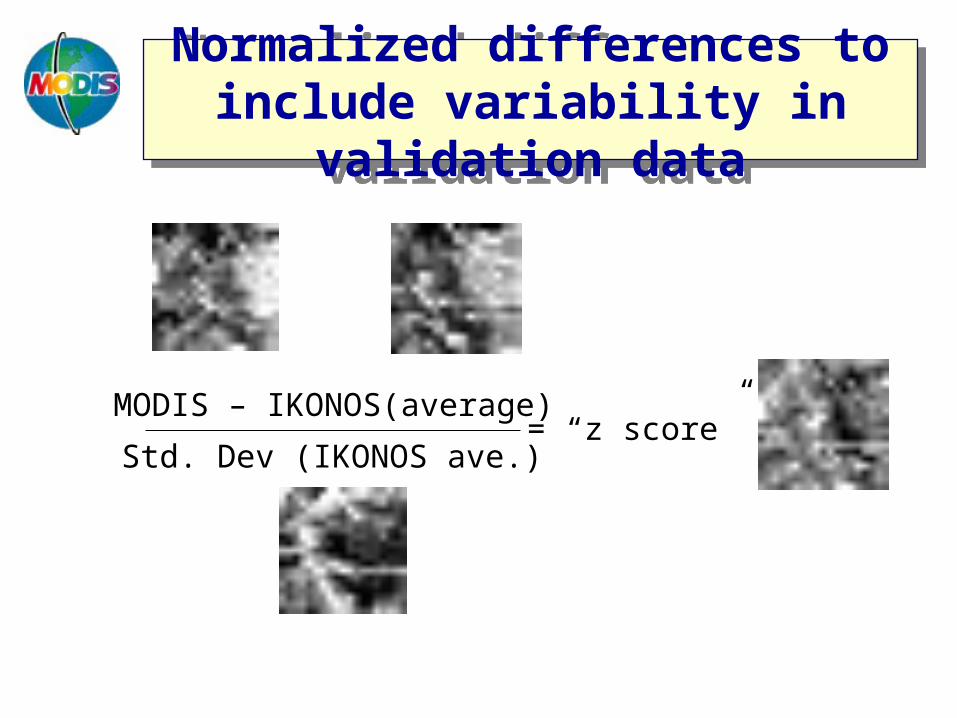
Normalized differences to include variability in
validation data
Normalized differences to include variability in
validation data
MODIS – IKONOS(average)
Std. Dev (IKONOS ave.)= “z score”
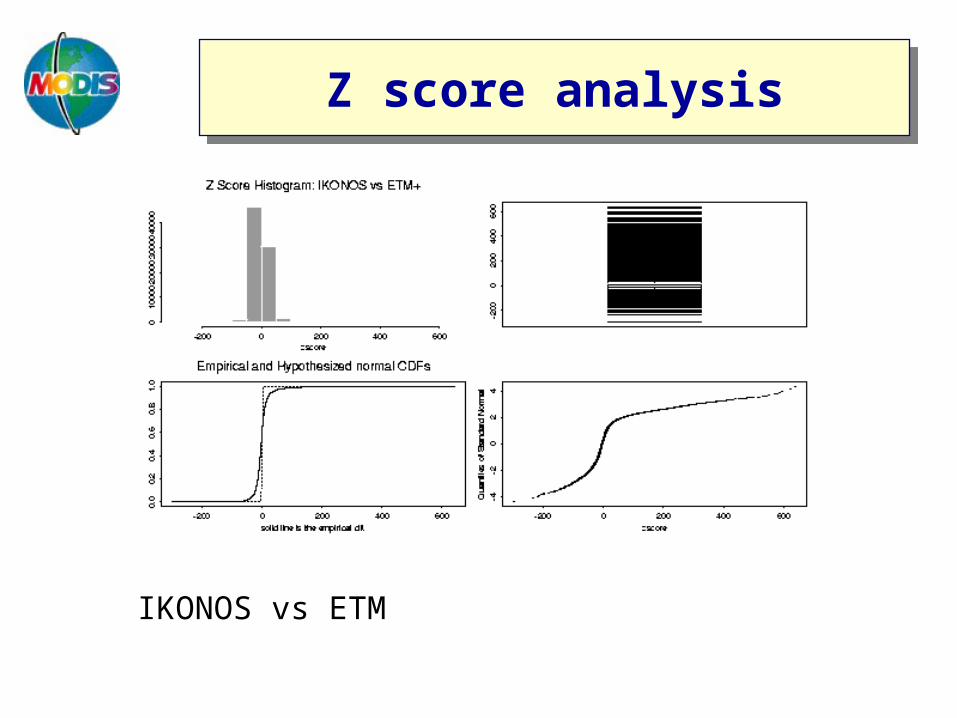
Z score analysisZ score analysis
IKONOS vs ETM
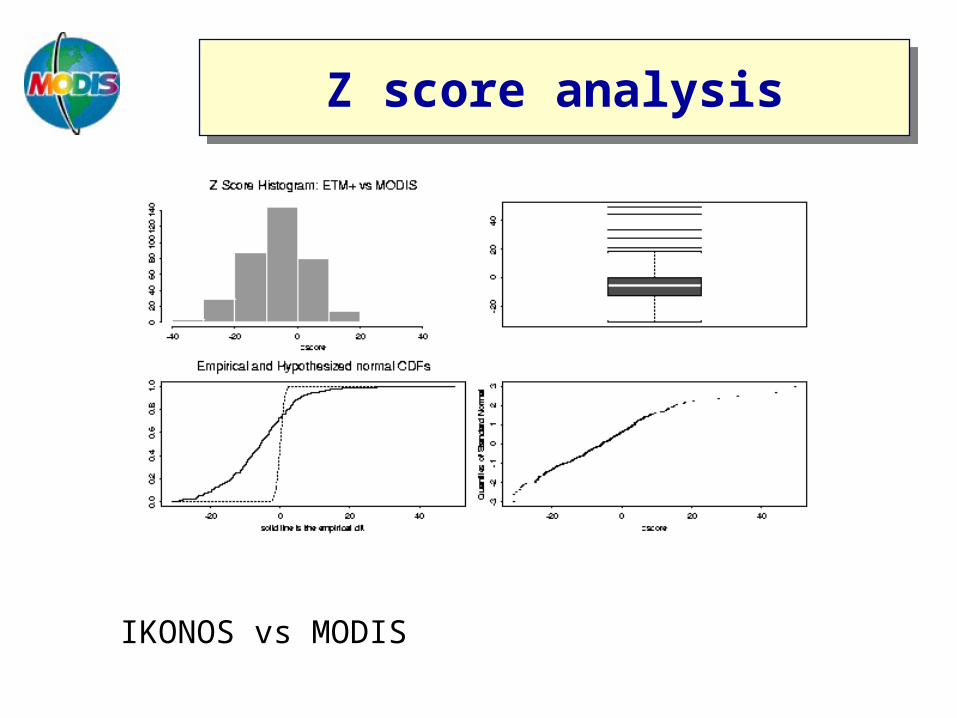
Z score analysisZ score analysis
IKONOS vs MODIS
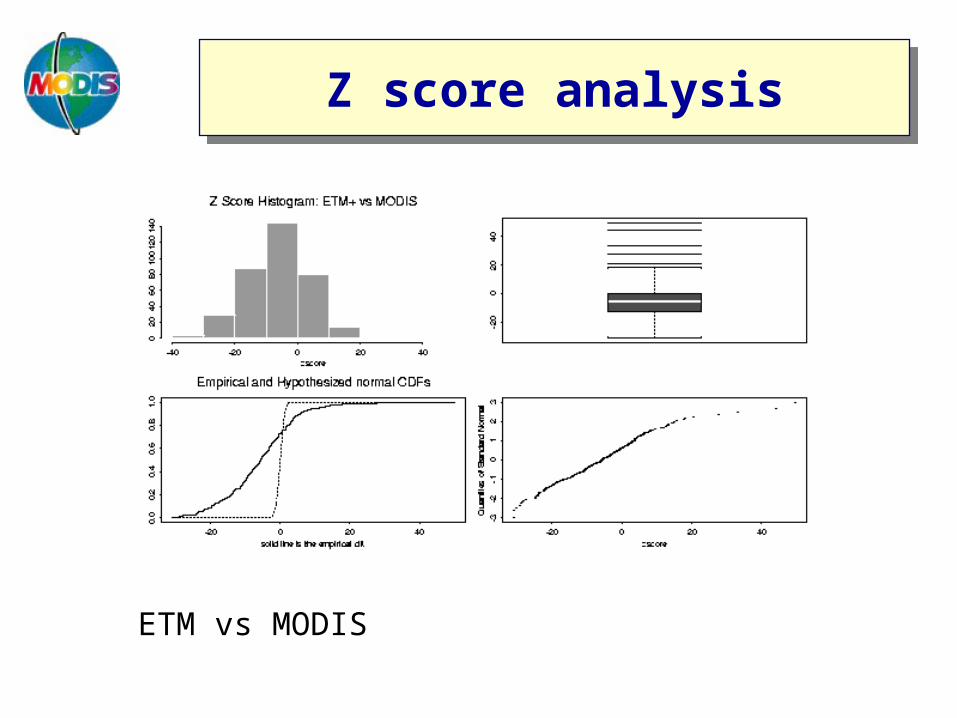
Z score analysisZ score analysis
ETM vs MODIS
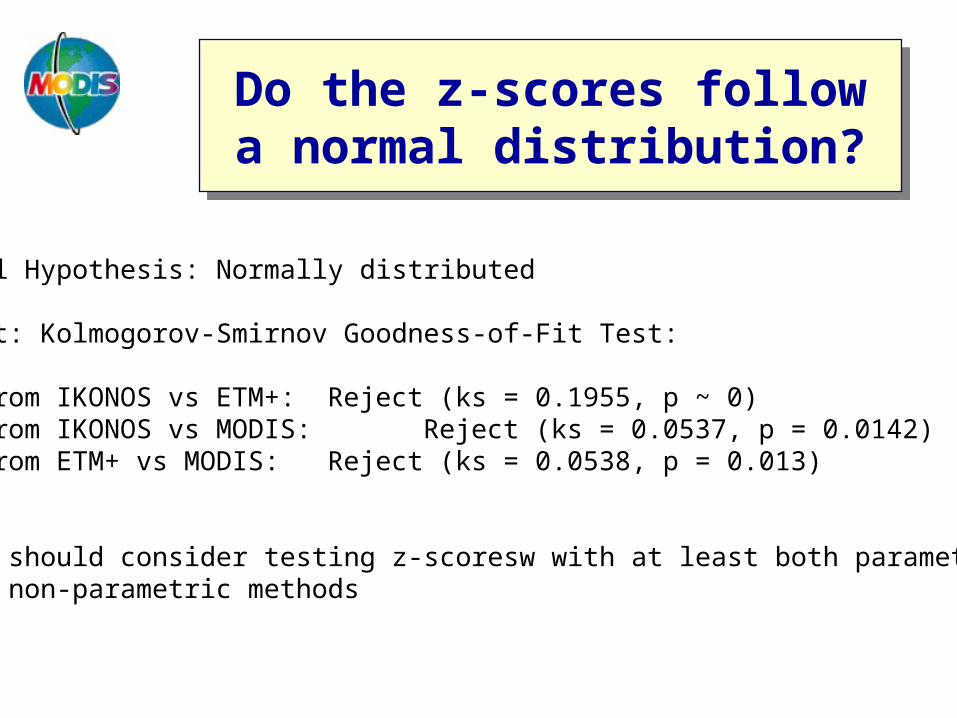
Do the z-scores follow a normal distribution?
Do the z-scores follow a normal distribution?
Null Hypothesis: Normally distributed
Test: Kolmogorov-Smirnov Goodness-of-Fit Test:
Z from IKONOS vs ETM+: Reject (ks = 0.1955, p ~ 0) Z from IKONOS vs MODIS: Reject (ks = 0.0537, p = 0.0142) Z from ETM+ vs MODIS: Reject (ks = 0.0538, p = 0.013)
So, should consider testing z-scoresw with at least both parametericand non-parametric methods
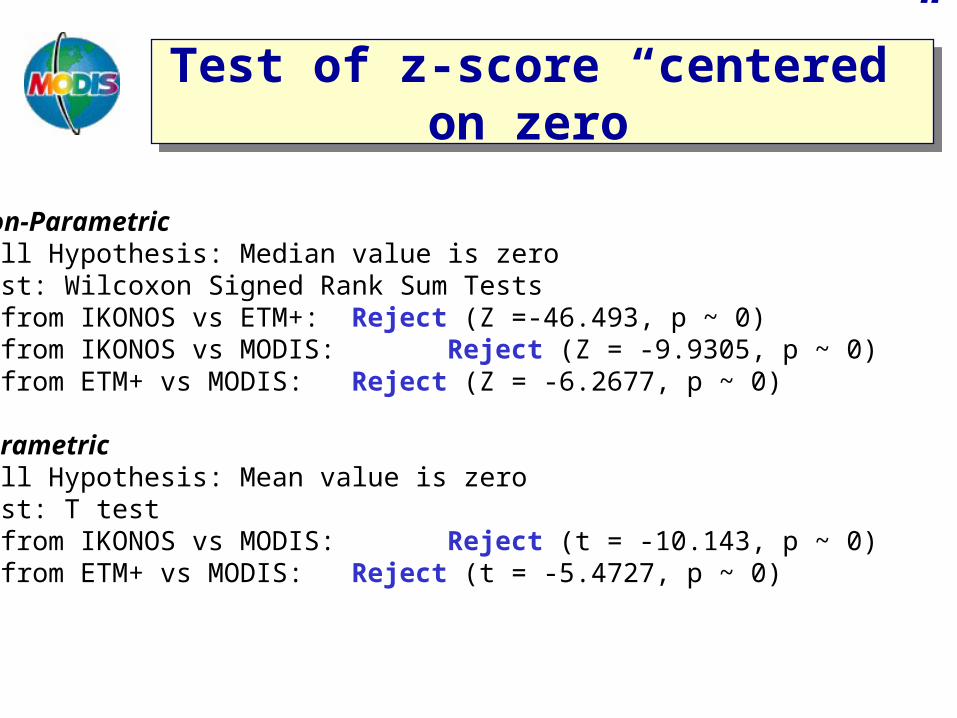
Test of z-score “centered” on zero
Test of z-score “centered” on zero
Non-ParametricNull Hypothesis: Median value is zeroTest: Wilcoxon Signed Rank Sum TestsZ from IKONOS vs ETM+: Reject (Z =-46.493, p ~ 0) Z from IKONOS vs MODIS: Reject (Z = -9.9305, p ~ 0) Z from ETM+ vs MODIS: Reject (Z = -6.2677, p ~ 0)
ParametricNull Hypothesis: Mean value is zeroTest: T testZ from IKONOS vs MODIS: Reject (t = -10.143, p ~ 0) Z from ETM+ vs MODIS: Reject (t = -5.4727, p ~ 0)
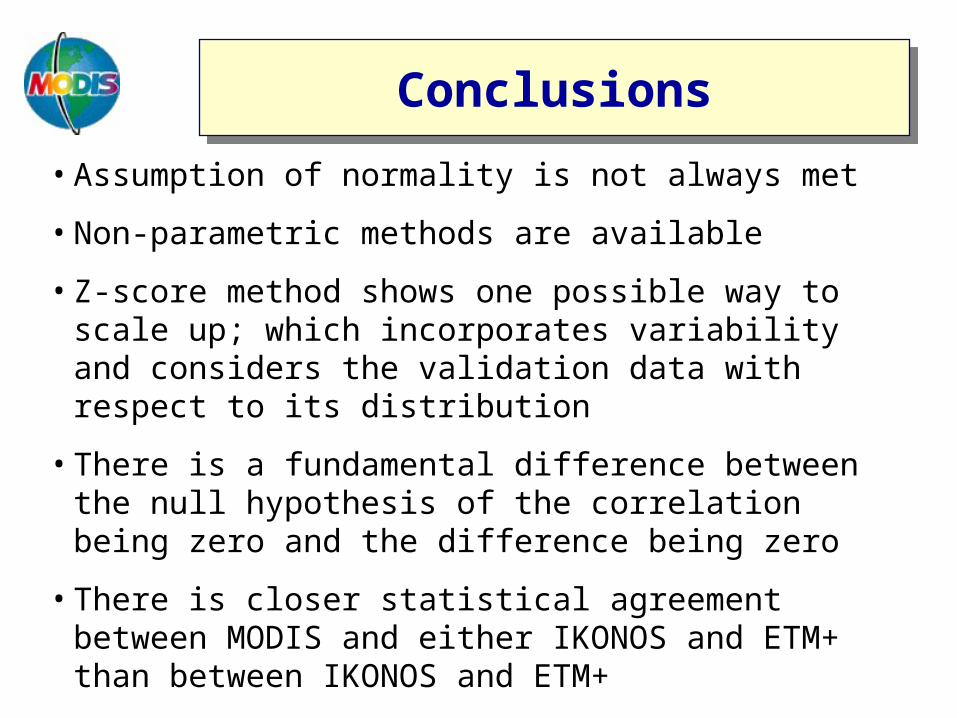
ConclusionsConclusions
• Assumption of normality is not always met
• Non-parametric methods are available
• Z-score method shows one possible way to scale up; which incorporates variability and considers the validation data with respect to its distribution
• There is a fundamental difference between the null hypothesis of the correlation being zero and the difference being zero
• There is closer statistical agreement between MODIS and either IKONOS and ETM+ than between IKONOS and ETM+
• There is a difference between statistical and practical difference
CommentsComments
• ETM+, IKONOS, MODIS and Sun photometer data were easily available
• Major difficulty was ISIN projection and georeferencing – coordination of Jacqueline Le Moigne, GSFC might prove helpful.
• Results are planned to be communicated in the validation article in the Special Issue of RSE.