?/ Final Report NASA DRYDEN-PRC SYSTEM SERVICES Edwards, … · 2013-08-30 · Final Report NASA...
59
Final Report NASA DRYDEN-PRC SYSTEM SERVICES Flight Research Facility Building No. 4839 Edwards, CA 93523-5000 ?/ Electro Optical System to Measure Strains at High Temperature NASA-AMES Grant No. NAG2-547 7/16/90- 12/31/91 By Cesar A. Sciammarella Illinois Institute of Technology Department of Mechanical and Aerospace Engineering Chicago, IL 60616 (NASA-CR-Ig0450) ELECTRO OPTICAL N92-33696 SYSTEM TO MEASURE STRAINS AT HIGH TEMPERATURE Final Report, 16 Ju|. 1990 -)10ec. 1991 (Illinois Unclas Inst. of Tech.} 58 p G3/35 0104028 1NASA Technical Officer for this grant is: Lawrence F. Reardon, Ames Research Center, P.O. Box 273, Edwards, CA 93523-5000 https://ntrs.nasa.gov/search.jsp?R=19920024452 2020-05-05T04:13:11+00:00Z
Transcript of ?/ Final Report NASA DRYDEN-PRC SYSTEM SERVICES Edwards, … · 2013-08-30 · Final Report NASA...
Final Report
NASA DRYDEN-PRC SYSTEM SERVICES
Flight Research Facility
Building No. 4839
Edwards, CA 93523-5000
?/
Electro Optical System to Measure
Strains at High Temperature
NASA-AMES Grant No. NAG2-547
7/16/90- 12/31/91
By
Cesar A. Sciammarella
Illinois Institute of Technology
Department of Mechanical and Aerospace Engineering
Chicago, IL 60616
(NASA-CR-Ig0450) ELECTRO OPTICAL N92-33696
SYSTEM TO MEASURE STRAINS AT HIGH
TEMPERATURE Final Report, 16 Ju|.
1990 -)10ec. 1991 (Illinois Unclas
Inst. of Tech.} 58 p
G3/35 0104028
1NASA Technical Officer for this grant is: Lawrence F. Reardon, Ames Research Center, P.O. Box
273, Edwards, CA 93523-5000
https://ntrs.nasa.gov/search.jsp?R=19920024452 2020-05-05T04:13:11+00:00Z
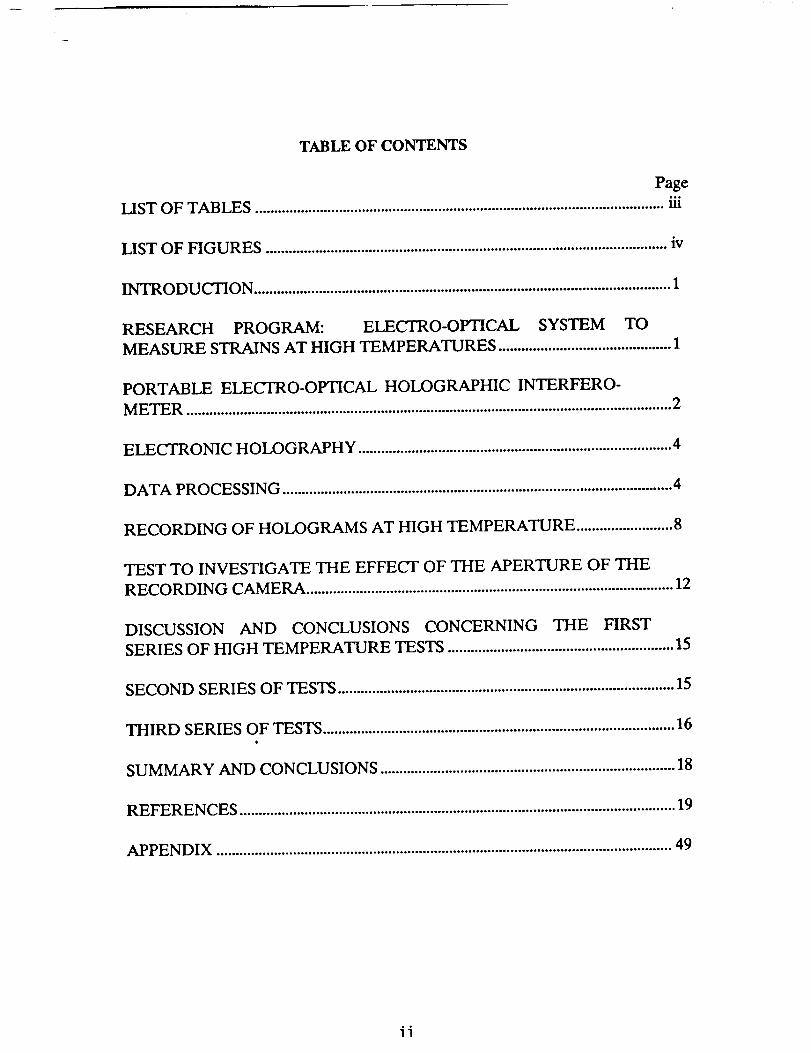
TABLE OF CONTENTS
Page
LIST OF TABLES ........................................................................................................... iii
LIST OF FIGURES ......................................................................................................... iv
INTRODUCTION ............................................................................................................. 1
RESEARCH PROGRAM: ELECTRO-OPTICAL SYSTEM TO
MEASURE STRAINS AT HIGH TEMPERATURES ............................................. 1
PORTABLE ELECTRO-OPTICAL HOLOGRAPHIC INTERFERO-
METER ............................................................................................................................... 2
ELECTRONIC HOLOGRAPHY .................................................................................. 4
DATA PROCESSING ...................................................................................................... 4
RECORDING OF HOLOGRAMS AT HIGH TEMPERATURE ......................... 8
TEST TO INVESTIGATE THE EFFECT OF THE APERTURE OF THE
RECORDING CAMERA ................................................................................................ 12
DISCUSSION AND CONCLUSIONS CONCERNING THE FIRST
SERIES OF HIGH TEMPERATURE TESTS ........................................................... 15
SECOND SERIES OF TESTS ........................................................................................ 15
THIRD SERIES OF TESTS ............................................................................................ 16
SUMMARY AND CONCLUSIONS ............................................................................. 18
REFERENCES .................................................................................................................. 19
APPENDIX ....................................................................................................................... 49
ii
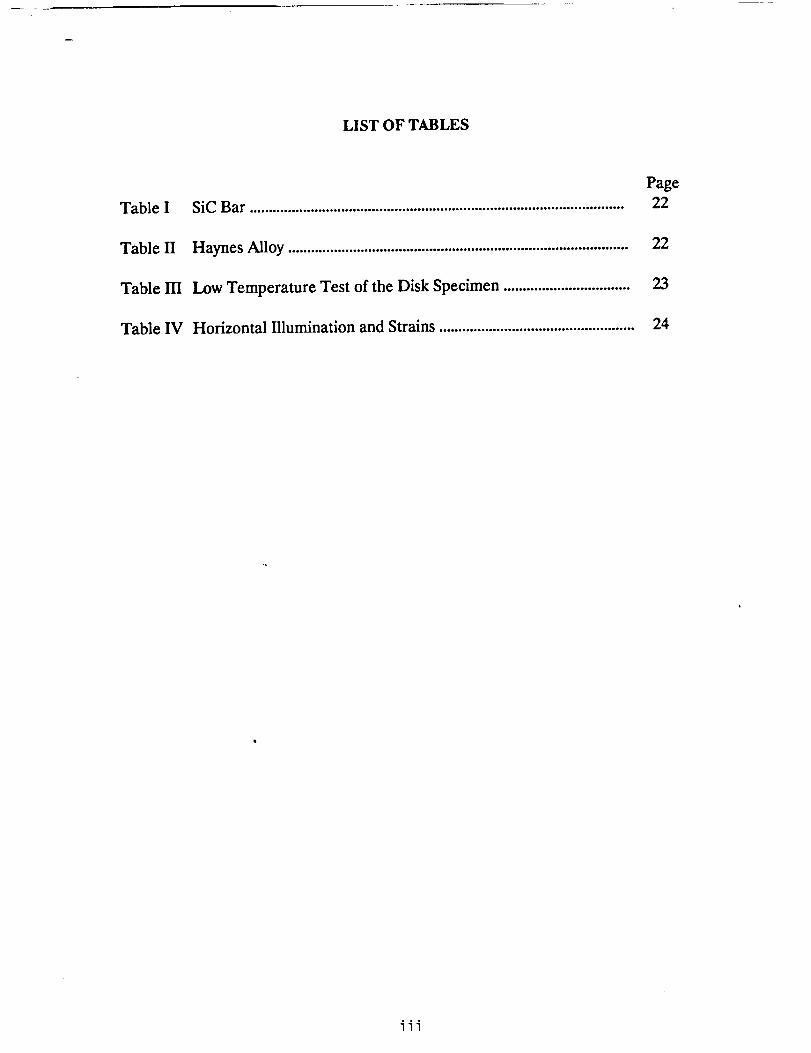
LIST OF TABLES
Table I
Table II
Table III
Table IV
SiC Bar ..................................................................................................
Haynes Alloy ......................................................................................... 22
Low Temperature Test of the Disk Specimen ................................. 23
Horizontal Illumination and Strains ................................................... 24
Page
22
iii
Fig. 1
Fig. 2
Fig. 3
Fig. 4
Fig. 5
Fig. 6
Fig. 7
Fig. 8
Fig. 9
Fig. 10
Fig. 11
Fig. 12
Fig. 13
Fig. 14
Fig. 15
Fig. 16
LIST OF FIGURES
Schematic representation of the electro-optical system used
to measure strains at high temperature ..............................................
Background radiation energy for the black body (emmisivity e = 1)
as a function of the temperature ......................................................... 27
Optical setup .......................................................................................... 28
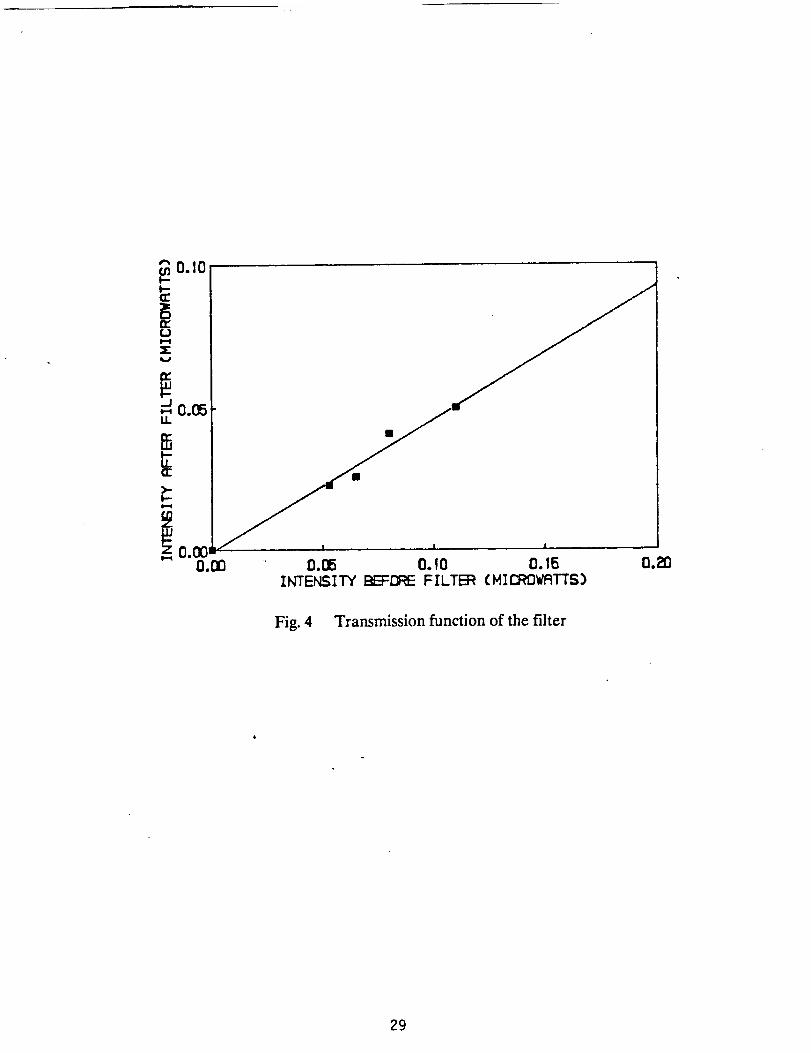
Transmission function of the filter ...................................................... 29
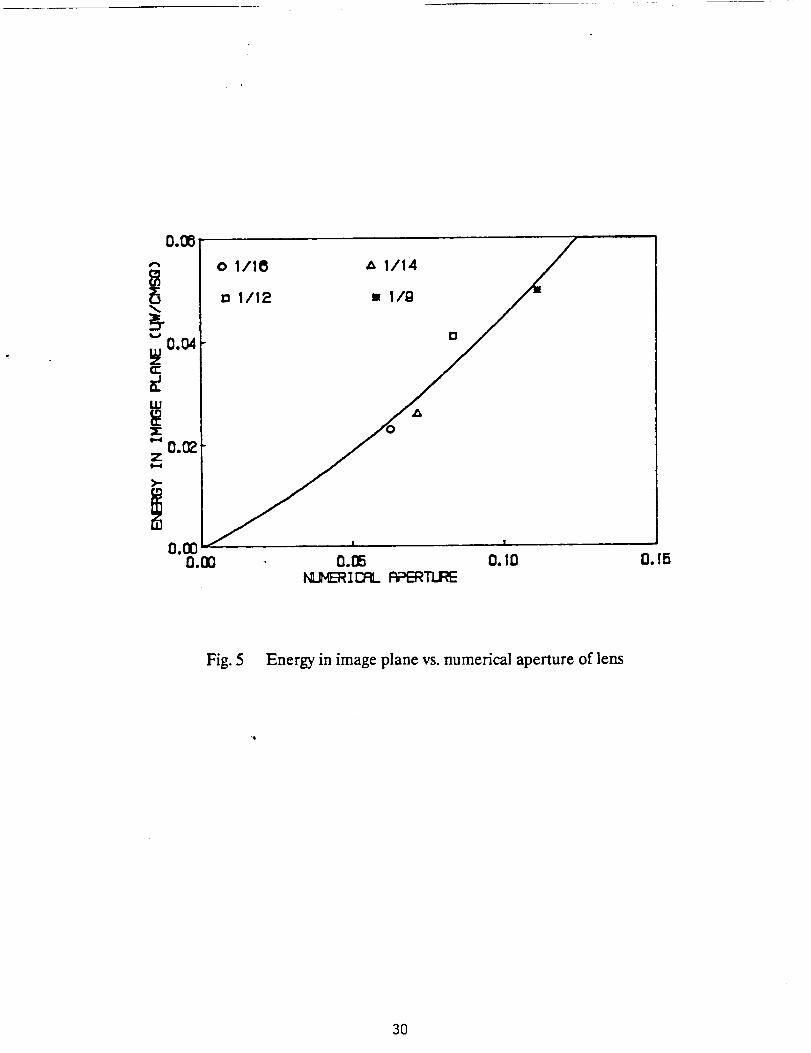
Energy in image plane vs. numerical aperture of lens ...................... 30
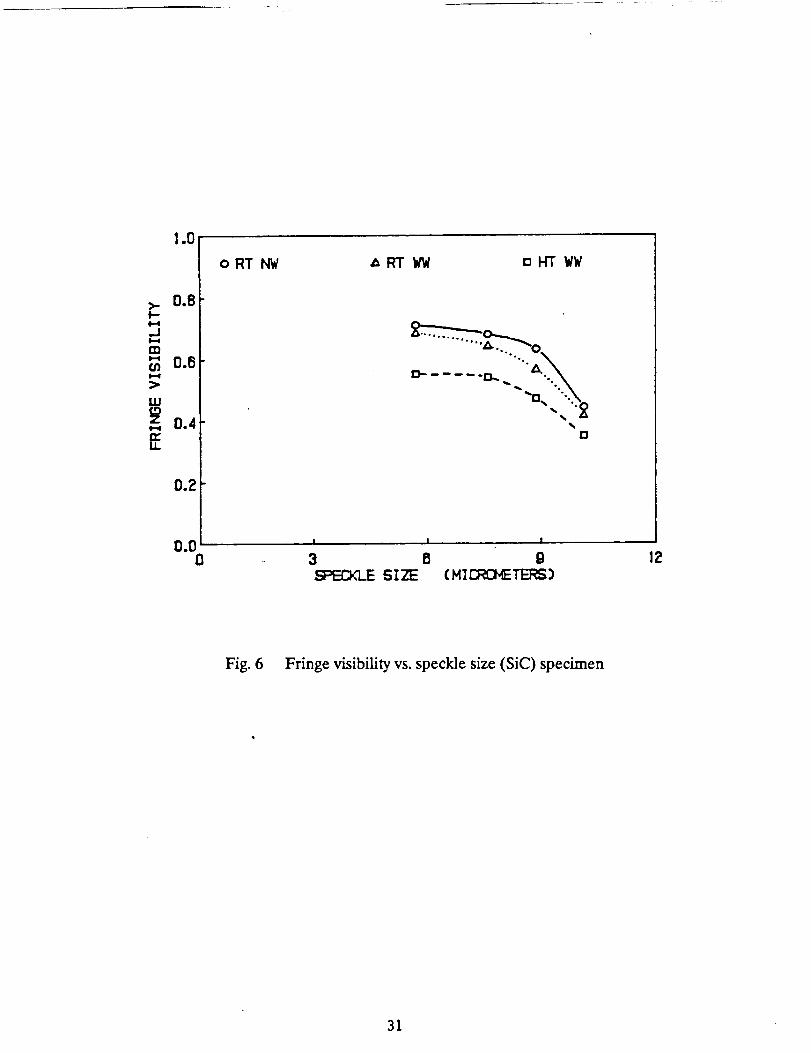
Fringe visibility vs. speckle size (SIC) specimen ................................ 31
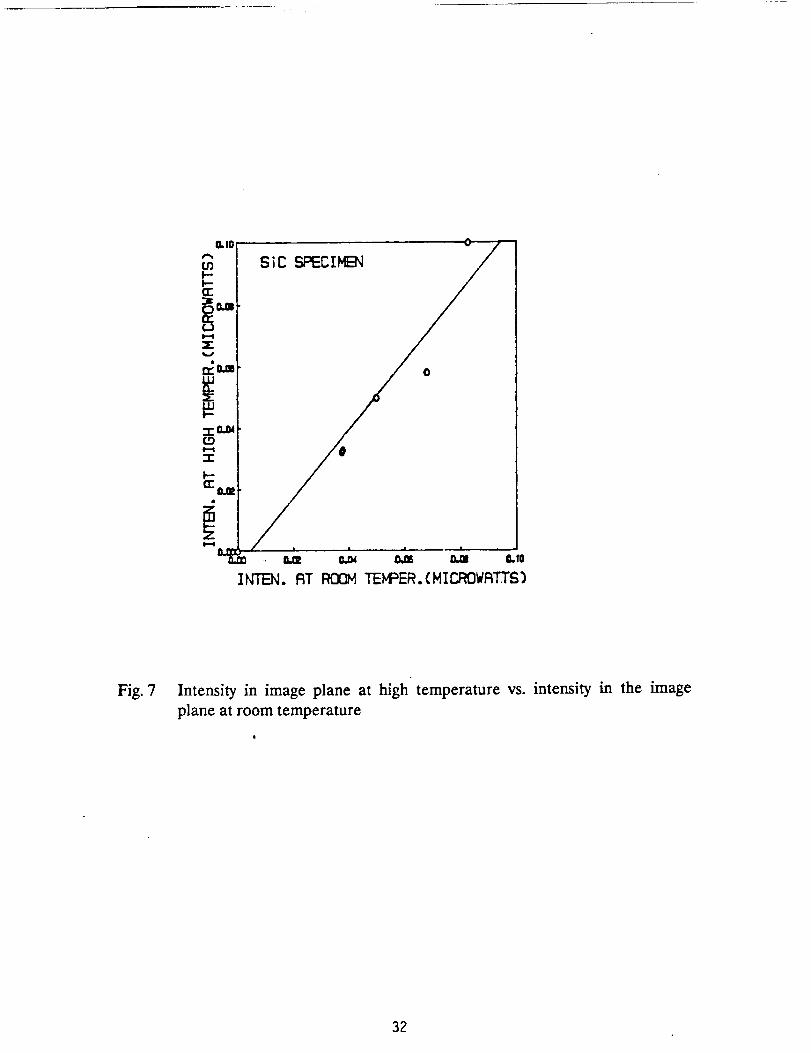
Intensity in image plane at high temperature vs. intensity in
the image plane at room temperature ................................................ 32
Fringe visibility vs. speckle size (Haynes Alloy) ................................ 33
Coefficient of expansion of the Haynes 230 Alloy ............................. 34
High temperature oven built to test specimens at 1000°C ................ 35
Windows configurations of the oven built to test specimens at
1000°C ........................................................................................................ 36
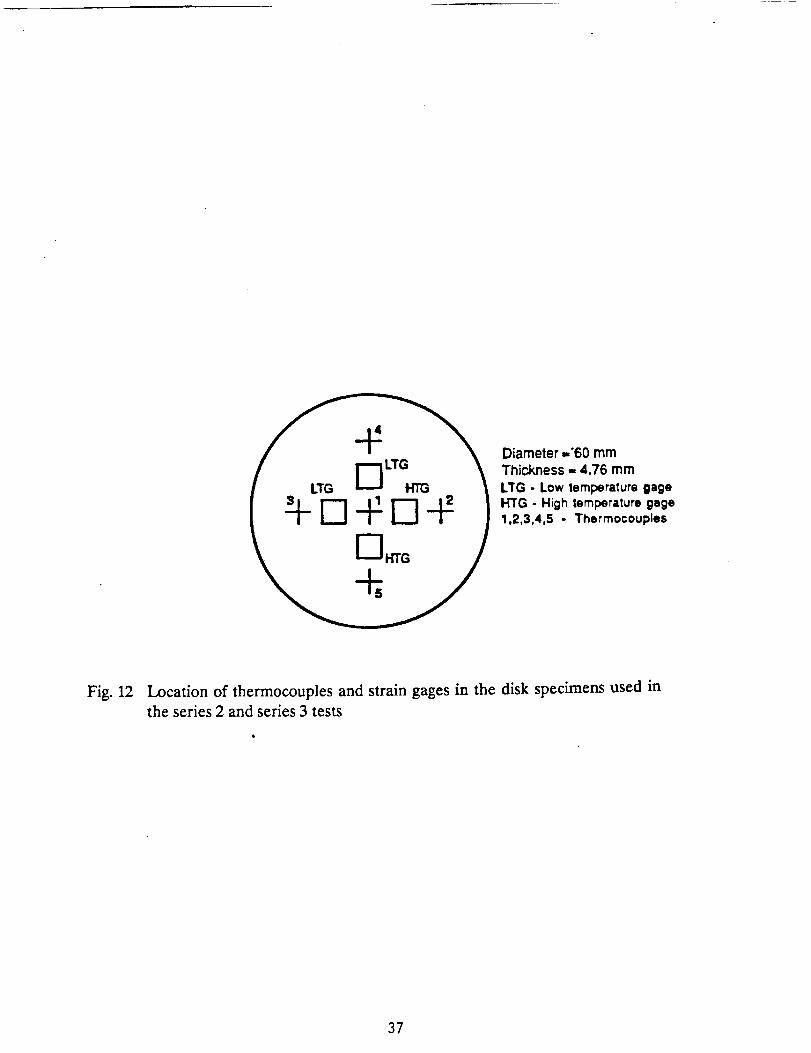
Location of thermocouples and strain gages in the disk specimens
used in the series 2 and series 3 tests ................................................... 37
Comparison of the elastic solution with the electro-optical
holographic-moire results ....................................................................... 38
Comparison of the elastic solution with the electro-optical
holographic-moire results, strains along the horizontal axis .............. 39
Comparion of the Young's modulus computed from the disk tests
with the manufacturer provided values (Haynes Alloy No. 25) .......... 40
Fringe patterns corresponding to 900°C, u-displacements ................... 41
Page
26
ix/
Fig. 17
Fig. 18
Fig. 19
Fig. 20
Fig. 21
Fig. 22
Fig. 23
Comparison of the strain gage and optically measured strains as
a function of the temperature horizontal diameter, gage
4 (horizontal direction) .............................................................................. 42
Comparison of the strain gage and the optically measured
strains, horizontal diameter gage 3 (vertical direction) ....................... 43
Pattern corresponding to the vertical displacements, 900°C ................. 44
Displacement contours corresponding to the average of 40 patterns. 45
Pattern resulting from the phase averaging of 40 patterns recorded
at 985°C ......................................................................................................... 46
Strain contours corresponding to the pattern of Fig. 21 ....................... 47
Comparison of theoretical and experimental results along
the horizontal diameter (values correspond to Fig. 22). Load
5.23 kN, T 985°C ......................................................................................... 48
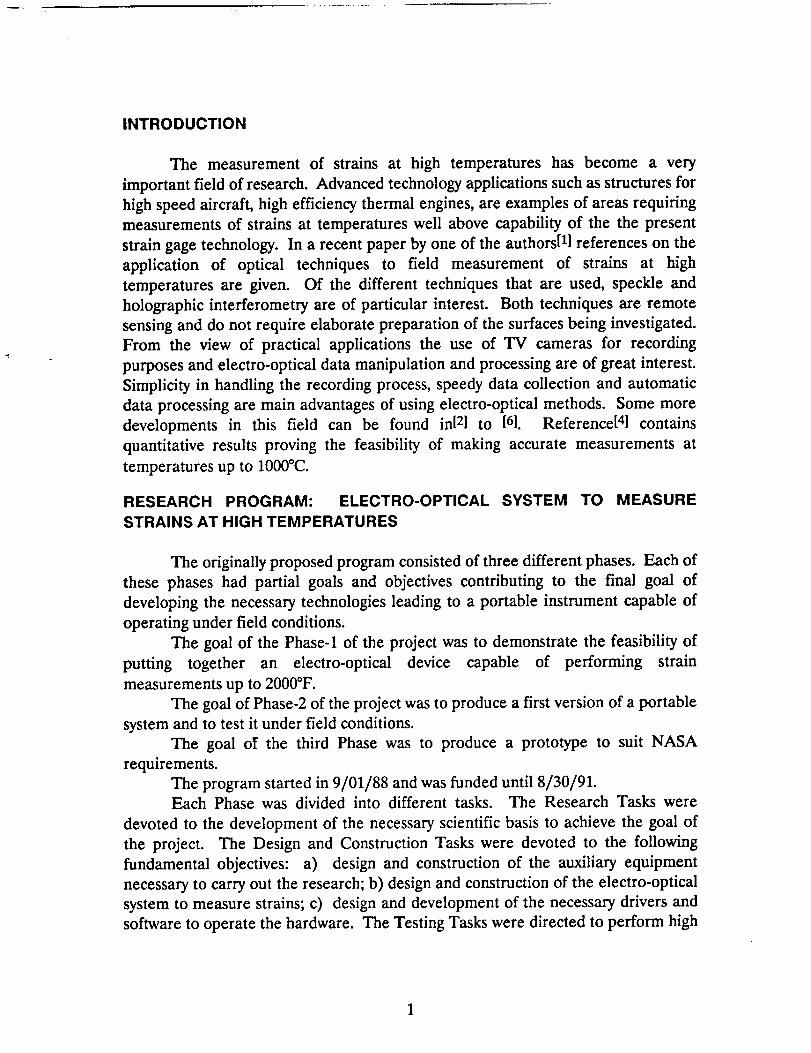
INTRODUCTION
The measurement of strains at high temperatures has become a very
important field of research. Advanced technology applications such as structures for
high speed aircraft, high efficiency thermal engines, are examples of areas requiring
measurements of strains at temperatures well above capability of the the present
strain gage technology. In a recent paper by one of the authors[ll references on the
application of optical techniques to field measurement of strains at high
temperatures are given. Of the different techniques that are used, speckle and
holographic interferometry are of particular interest. Both techniques are remote
sensing and do not require elaborate preparation of the surfaces being investigated.
From the view of practical applications the use of TV cameras for recording
purposes and electro-optical data manipulation and processing are of great interest.
Simplicity in handling the recording process, speedy data collection and automatic
data processing are main advantages of using electro-optical methods. Some more
developments in this field can be found inl21 to [61. Reference[ a] contains
quantitative results proving the feasibility of making accurate measurements at
temperatures up to 1000°C.
RESEARCH PROGRAM: ELECTRO-OPTICAL SYSTEM TO MEASURE
STRAINS AT HIGH TEMPERATURES
The originally proposed program consisted of three different phases. Each of
these phases had partial goals and objectives contributing to the final goal of
developing the necessary technologies leading to a portable instrument capable of
operating under field conditions.
The goal of the Phase-1 of the project was to demonstrate the feasibility of
putting together an electro-optical device capable of performing strain
measurements up to 2000°F.
The goal of Phase-2 of the project was to produce a first version of a portable
system and to test it under field conditions.
The goal oF the third Phase was to produce a prototype to suit NASA
requirements.
The program started in 9/01/88 and was funded until 8/30/91.
Each Phase was divided into different tasks. The Research Tasks were
devoted to the development of the necessary scientific basis to achieve the goal of
the project. The Design and Construction Tasks were devoted to the following
fundamental objectives: a) design and construction of the auxiliary equipment
necessary to carry out the research; b) design and construction of the electro-optical
system to measure strains; c) design and development of the necessary drivers and
software to operate the hardware. The Testing Tasks were directed to perform high
temperature strain measurements. Finally, the Evaluation Tasks provided an
analysis of the achievements of the program.
In the semi-annual reports we have provided the details of the achievements
in the different tasks of the program. In this Final Report, particular emphasis will
be put on the results of the high temperature tests. In what follows we will give a
brief summary of the overall accomplishments of the program.
In the research aspect of the program, all the fundamental variables that
control the measurement, recording and data processing of strains at high
temperature were individualized and investigated.
A high temperature oven was designed and manufactured. Two different
versions were developed, one with three windows and another with five windows.
Two different loading frames were designed and built.
Several versions of the electro-optical system to gather strain information
were designed and built. Some components were assembled by integrating
commercially available components. Other components were designed and built in
our laboratory.
A large number of programs were developed to operate the system and to
carry out other specialized tasks needed for data gathering and data processing.
In what follows we will provide a description of the electro-optical system as
it stands currently.
PORTABLE ELECTRO-OPTICAL HOLOGRAPHIC INTERFEROMETER
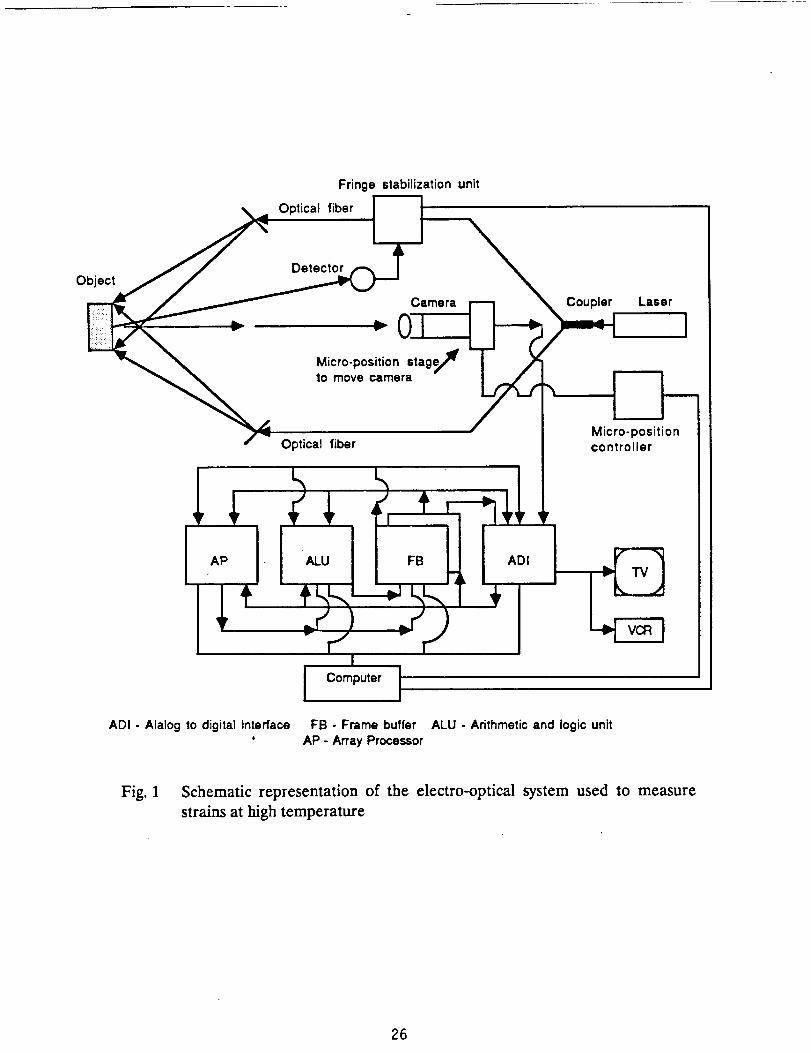
To apply optical technology to the field of high temperatures, the system
schematically shown in Fig. 1 has been designed. The system contains optical and
electronic components that perform different functions; the guiding principle in the
design of the instrument is to use each technology to its fullest advantage. From the
systems point of view, one can distinguish the following components,
1) Illumination and light conditioning
2) Signal reception
3) Signal detectibn
4) Data processing
5) Data output
6) Host processor
The illumination system contains two subsystems, 1) fringe stabilization, 2)
fringe shifting.
The signal reception is performed by a CCD camera. The detection and
conditioning functions rest on several electronic components:
2
a) Analog tO Digital and Digital to Analog Converter. This unit coverts the
analog input coming from the CCD camera to digital form and the output of the
system from digital to analog.
b) Arithmetic-logical Unit. This unit performs arithmetic and logical operations
on the incoming signal.
c) Storage Memories or Frame Buffers. Several units store information during
the processing operations.
d) Array Pr0¢essor. A Parallel processor that performs certain operations with
high efficiency resulting in considerable reduction in computing time.
e) Host Processor. The host processor controls the different components and
performs some of the tasks in data processing.
The output of the system can be a graphic display that goes to a monitor or to
a printer, or numerical values.
The input to the system is an image, from which the system can produce
interference fringes that cover the observed surface. The output can be:
displacements, strains, stresses, or contours of a surface. In the current
configuration images can be recorded as a function of time within the speeds that
can be handled by the American Standard Television System. High speed images
can be recorded one at time, periodic phenomena can be observed by time average
procedures or by stroboscopic techniques.
The fringe stabilization system enables the interferometer to operate without
mechanical isolation. This system compensates rigid body motions, fiber optics
instabilities and random fluctuations caused by air motion. This circuit has two
main components: a) an opto-electric device with a piezo-electric phase shifter
(PPS); b) an electronic circuit that provides the PPS with a voltage that compensates
the phase changes due to the above mentioned causes. A light sensor, senses the
light intensity of a small region of the body. This sensor receives the same
information that the camera receives, except that it does it dynamically. This signal
goes to a circuit where it is processed. Out of the circuit comes an error signal that
is fed to the PPS.
One of th_ problems that affects the practical use of holographic
interferometry is the loss of correlation caused by the rigid motions introduced by
the application of load on the body that is analyzed. To take care of this problem
the camera is supported on an universal motion system. This system receives a
feedback signal from the imaging system. The feedback signal keeps the image
f'txed with respect to a reference system attached to the camera.Both features of the interferometer have been implemented and tested at
room temperature with satisfactory results.
3
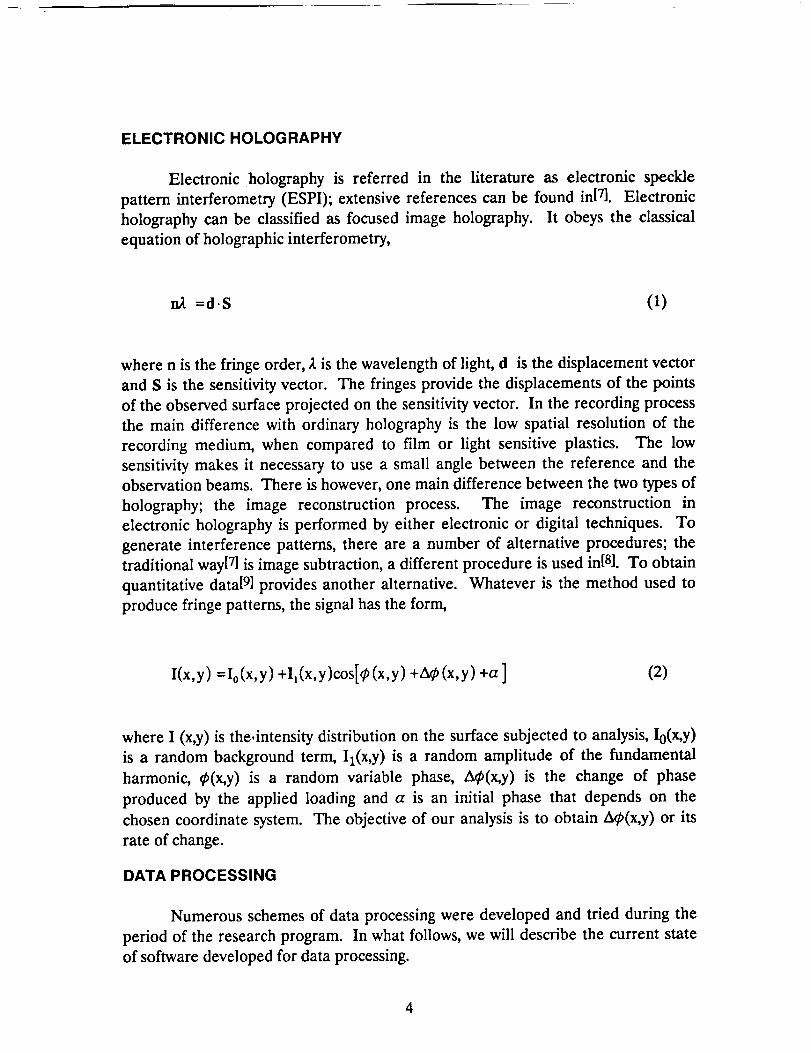
ELECTRONIC HOLOGRAPHY
Electronic holography is referred in the literature as electronic speckle
pattern interferometry (ESPI); extensive references can be found in[7]. Electronic
holography can be classified as focused image holography. It obeys the classical
equation of holographic interferometry,
na =d-S (1)
where n is the fringe order, _ is the wavelength of light, d is the displacement vector
and S is the sensitivity vector. The fringes provide the displacements of the points
of the observed surface projected on the sensitivity vector. In the recording process
the main difference with ordinary holography is the low spatial resolution of the
recording medium, when compared to film or light sensitive plastics. The low
sensitivity makes it necessary to use a small angle between the reference and the
observation beams. There is however, one main difference between the two types of
holography; the image reconstruction process. The image reconstruction in
electronic holography is performed by either electronic or digital techniques. To
generate interference patterns, there are a number of alternative procedures; the
traditional way[71 is image subtraction, a different procedure is used in[8]. To obtain
quantitative data[ 9] provides another alternative. Whatever is the method used to
produce fringe patterns, the signal has the form,
I(x,y) =I0(x,y) +Ii(x,y)cos[_(x,y) +At) (x,y) +a ] (2)
where I (x,y) is the, intensity distribution on the surface subjected to analysis, I0(x,y )
is a random background term, Ii(x,y) is a random amplitude of the fundamental
harmonic, _(x,y) is a random variable phase, A@(x,y) is the change of phase
produced by the applied loading and a is an initial phase that depends on the
chosen coordinate system. The objective of our analysis is to obtain Atp(x,y) or its
rate of change.
DATA PROCESSING
Numerous schemes of data processing were developed and tried during the
period of the research program. In what follows, we will describe the current state
of software developed for data processing.
Computer assisted methods to retrieve fringe information where introduced
by one of the authors[9]. The latest version with a number of improvements
introduced on the original procedures can be found in[l°]. In the past, due to the
lack of low cost high speed hardware, operations where performed in one
dimension. Recent improvements in the available hardware, have made it possible
to implement 2-D techniques of fringe analysis. The developed techniques can be
implemented either in the actual physical space or in the Fourier space. The choice
of one or the other alternative depends on the total computational time. The
Fourier space techniques require an initial Fourier transform and a final inversion;
this additional operation can be compensated only if the total number of operations
in the Fourier space is reduced when compared to processing in the physical space.
The time balance depends on the number of terms used in the filtering of the data.
When operating in 2-D, the problem of implementing an efficient filtering operation
becomes critical and there is a definite time advantage to operate in the Fourier
space. The method described in this paper applies in general to any fringe system.
However in this report, we will discuss a version that applies to the holographic
moire technique. In this techniquel:0] to [15], by using double beam illumination in
two orthogonal directions, the displacement vectors are projected onto a reference
plane.
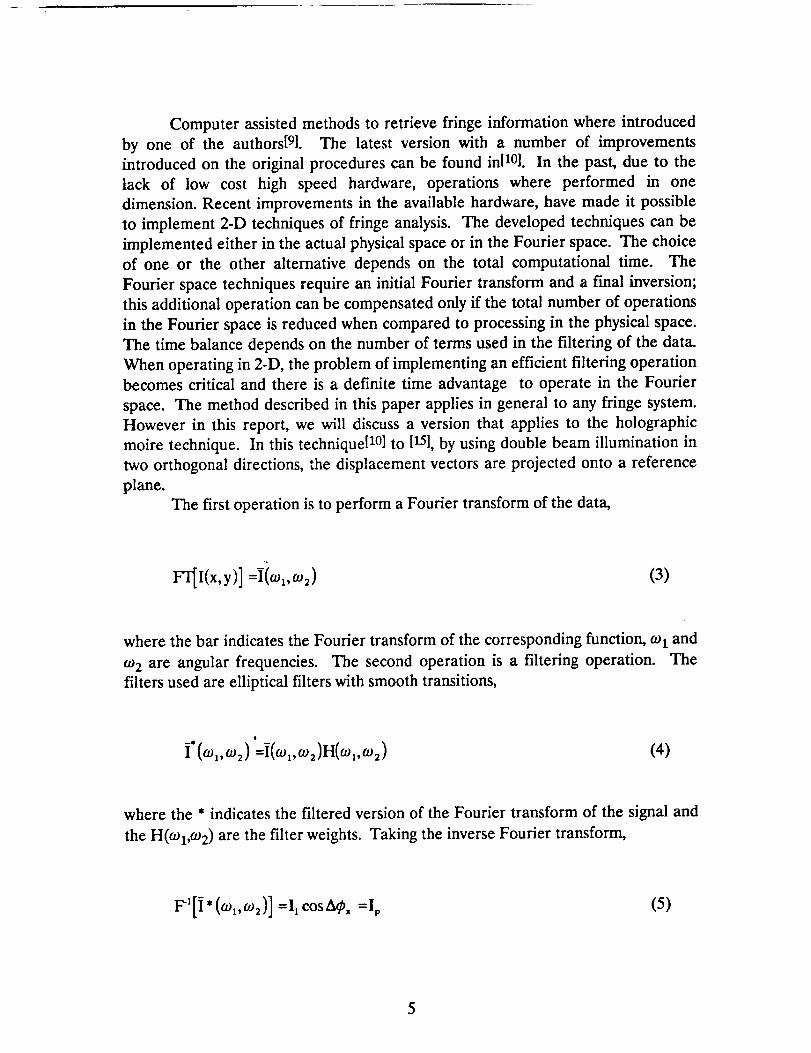
The first operation is to perform a Fourier transform of the data,
FT[I(x,y)] =iitol,to2) (3)
where the bar indicates the Fourier transform of the corresponding function, 091 and
092 are angular frequencies. The second operation is a filtering operation. The
filters used are elliptical filters with smooth transitions,
I" (_01, qI)2) _i(O) i, _0 2 ) H((o l, _o 2) (4)
where the " indicates the filtered version of the Fourier transform of the signal and
the H(tOl,tO2) are the filter weights. Taking the inverse Fourier transform,
F_[i'(co_,co2)]=I_cosA@, =Ip (5)
5
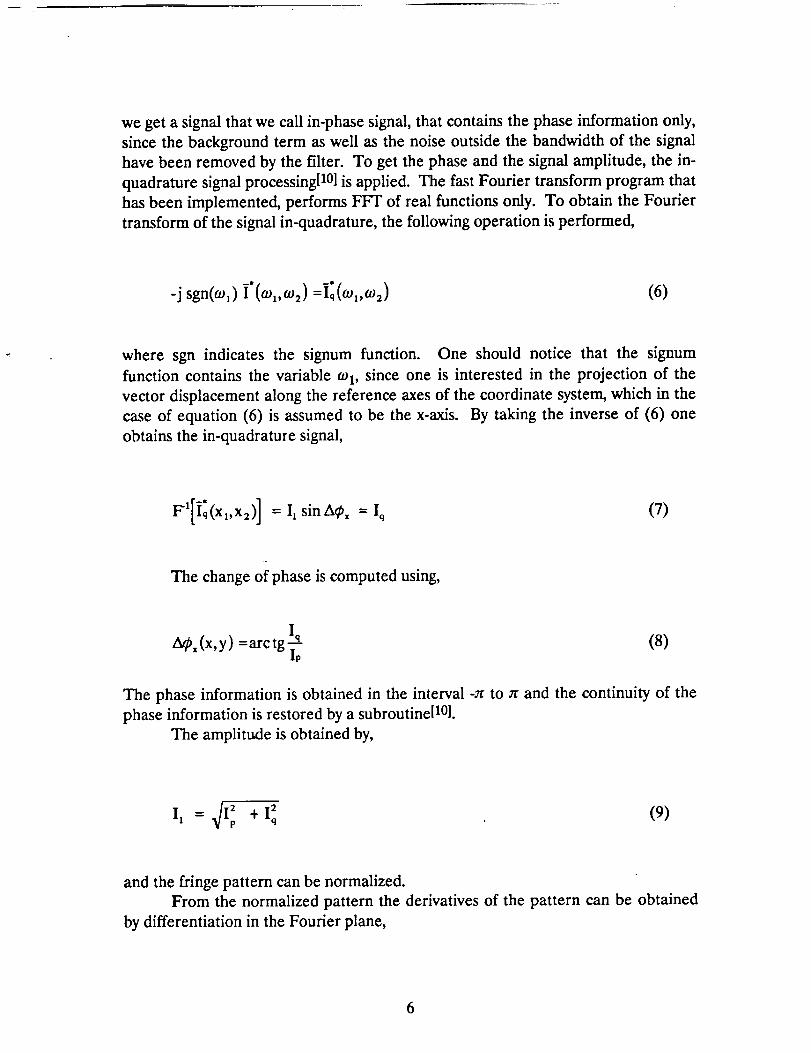
we get a signalthat we call in-phasesignal, that containsthe phaseinformation only,sincethe background term aswell asthe noise outside the bandwidth of the signalhavebeenremovedby the filter. To get the phaseand the signalamplitude, the in-quadrature signalprocessing[101is applied. The fast Fourier transform program thathasbeen implemented, performsFFT of real functions only. To obtain the Fouriertransform of the signalin-quadrature, the following operation is performed,
-j sgn(oJ_)I'(o_,a_2) =I;(_,,a_ 2) (6)
where sgn indicates the signum function. One should notice that the signum
function contains the variable 091, since one is interested in the projection of the
vector displacement along the reference axes of the coordinate system, which in the
case of equation (6) is assumed to be the x-axis. By taking the inverse of (6) one
obtains the in-quadrature signal,
Fl[i;(xl,x2)] = 11sinai, = Iq (7)
The change of phase is computed using,
A_ (x,y) =arctg_(8)
The phase information is obtained in the interval -_ to _ and the continuity of the
phase information is restored by a subroutine[10].
The amplitude is obtained by,
/2+Iq 2 (9)
II r
and the fringe pattern can be normalized.
From the normalized pattern the derivatives of the pattern can be obtained
by differentiation in the Fourier plane,
6
Ip_(o_,,co_)_[-jo_,]= i o(O_,,oJ_) (lO)
where the subscript, n, indicates the normalized spectrum and, ', indicates the
derivative, and
-" "Iq.(o_,_o2)Ho(-joJ,) = I q,, (11)
By Fourier inversion,
F'[i .(o_,,_o2)] =alpn(X,y)
ax(12)
and
F'[I q,(w,,_o2) ] = aIqn(X'Y) (13)Ox
and from these two components one obtains
aACx(X,Y) [(aI__ 2 (aI__211/2dx ='L _, ax / + _, ax / J (14)
Similar operation can be performed in the y-direction to obtain the cross
derivative. By analyzing the pattern in the orthogonal direction, the other two
derivatives can be obtained. Finally,
0A_x (15)_x = P Ox
7
aA_p, (16)_y =p-_ay
ax )(17)
;t
where ex, ey and cxy are the components of the strain tensor, and p - 2 sin a' where
a is the angle of illumination. If the surface is not a plane surface, the obtained
strains must be reduced to the local coordinate system[ 16] and [17].
RECORDING OF HOLOGRAMS AT HIGH TEMPERATURE
The displacement information is encoded in the intensity modulation of the
speckles[181 and the resulting fringe visibility is a function of the speckle visibility. If
the object beam amplitude is given by,
" °
Eo(r ) = Eo(r)ei_O (r) (18)
where Eo(r ) and _o(r) indicate the amplitude and phase of the points of the object
as a function of the spherical coordinates, r, in the object space. When the surface
of the object is rough, a speckle pattern appears at the image plane of the optical
observation system. The intensity distribution is given by,
I(r') = f j" k(r_,r')k*(r2,r')F(r_,r2).
Eo(I"I)Eo(r2)ei[_(h)'+(r2)]dr,dr2 (19)
where r' are the spherical coordinates in the image plane, k(r,r') is the spreading
function of the imaging system, and F(rl,r2) is the mutual coherence function of the
illumination over the object. Equation (19) indicates that the image intensity
8
distribution depends on the spread function of the lens system, the random phase
variations of the object and on the mutual coherence function.
Introducing the normalized standard deviation of the speckle intensity
variations,
V [< I2(r') >" < I(r')>2] 1/2= (20)< I(r') >
where the brackets <... > indicate the ensemble average. Replacing (19) in (20) and
introducing some additional assumptions1191 and [201, it is possible to conclude that
the fringe visibility depends:
a) On the mutual coherence function
b) On the spread function k(rl,r2) of the optical system
c) On the object surface roughness through the autocorrelation function of the
phases <_(rm) _(rn)> which in turn is a function of the rms roughness of thesurface.
From[ 19] and [20], one can conclude that for each surface roughness there is
an optimum aperture of the lens system that gives the best speckle visibility.The mutual coherence function is affected by many factors. At high
temperatures one of the main factors is the intensity radiated by the object in the
wavelength of the laser used.
To understand the problems that arise when one attempts to record fringe
patterns at elevated temperatures, it is necessary to look at the emissive power of
hot surfaces. According to Kirchhoff's law the energy irradiated at a given
wavelength does not depend on the particular substance involved but depends on its
absolute temperature. Kirchhoff's law applies to a black body; in real materials the
energy radiated depends on the emissivity of the surface, which is a function of the
substance, the temperature, the wavelength, the state of the surface and the
direction in the space. In metals, one can take as a first approximation the spectral
distribution corresponding to the black body and use an emissivity coefficient
smaller than one. The spectrum radiated by the black body can be found by
applying Plank's equation.
The energy irradiated by the surface increases the average or background
intensity and reduces the fringe visibility as defined by (20). The problem can be
analyzed as a function of the wavelength of the laser light utilized to record the
pattern and the power of the laser. To improve the fringe visibility, it is necessary to
introduce a filter corresponding to the wavelength of the laser light utilized to
illuminate the specimen. Filters have a spectrum that has the maximum
transmissibility at the peak value. An approximated calculation of the contrast loss
that can be expected can be performed in the following way. The energy emitted
the black body for a given temperature and a given wavelength can be obtained
from tables121]. The tables provide the value
(21 o
where E b is the energy at a given wavelength and a given temperature, and Eo2 is
the total energy up to the corresponding wavelength. If we introduce the bandwidth
of the filter A2
_,.Aa/2
Ea,I = j'F_,bd2 (22)1 O
and
X,./_dt2
Eoa2= j' Eb d2 (23)O
the energy in the bandwidth is given by the difference between (22) and (23).
AE = Eo_ -Eoa (24)2 1
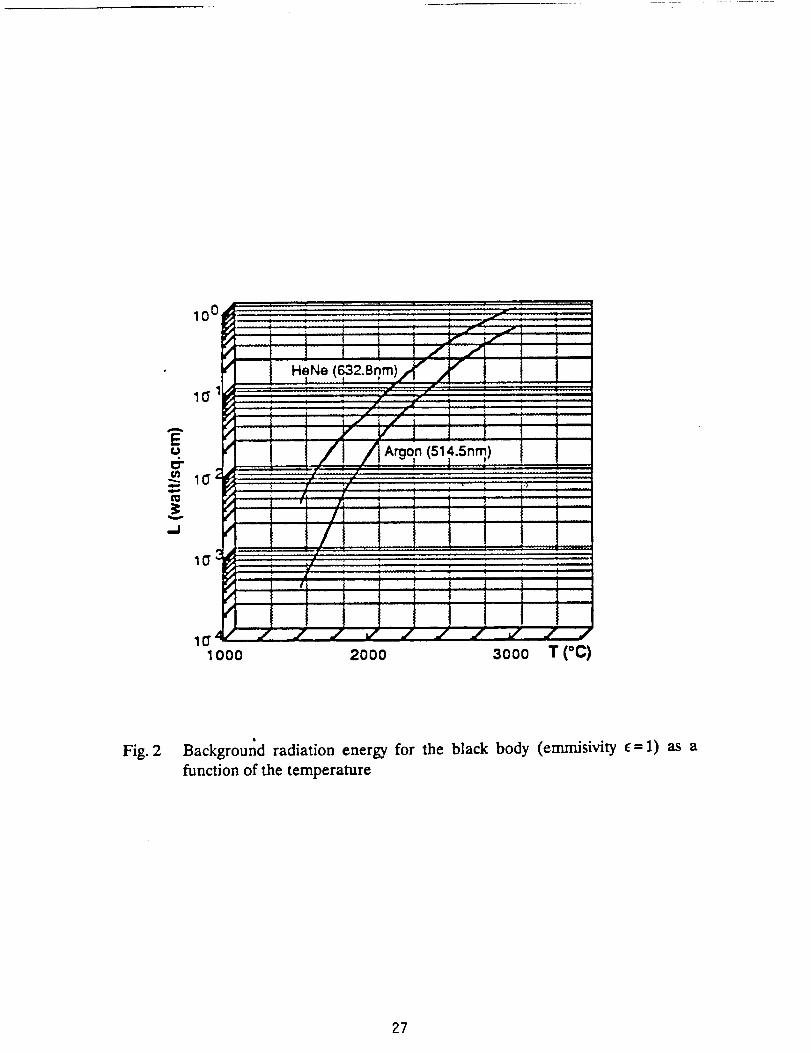
Figure 2 gives a graph of the energy emitted by the black body for ;t = 514.5
nm and _, = 632.8 nm, for a bandwidth of 10 nm.
The loss of visibility due to the light intensity generated by the high
temperature can be summarized as a ratio,
10
R Escr (25)= AE ce
where E s is the energy density of the illumination beam on the surface of the
observed object, cr is the coefficient of reflectivity of the surface, AE is the energy
density irradiated by the surface in the bandwidth of the filter used to remove
unwanted illumination from the observation system, and ce is the emissivity of the
surface. To increase the fringe visibility it is necessary to make R as high as
possible. We can see from Fig. 2 that, by going to shorter wavelengths, one can
reduce AE. One should make E s as high as possible. The coefficient of reflectivity
can be improved by putting a reflective coating capable of withstanding the
temperature. One can reduce the bandwidth of the filter but this change affects also
E s, since the transmissibility of the filter is also reduced when the bandwidth isreduced.
Two other factors affect the speckle visibility, a) mechanical vibrations of the
object, the illumination sources and of other components of the optical system, b)
changes of optical phase caused by air density variations produced by thermal
convective currents. Both effects can be reduced by reducing the exposure times
using cameras that have a shutter. Of course time exposure reduction if it is not
compensated by increased light intensity, in turn, causes a deterioration of the
signal.
To the abovecauses of visibility loss, we have to add effects that change the
correlation between the initial or reference image and the subsequent images
compared with the reference image. The fringe visibility114] is a function of the
decorrelation of the two compared images. The main variable[141 controlling the
visibility is the ratio of the displacement of the points due to the loading to the
speckle size. InI14] it is shown that fringe visibility due to rigid body motions can be
compensated by moving the recording device until maximum visibility is observed.
Another important effect is the changes of the surface due to temperature, such as
oxidation. This factor may limit the time that can be used to observe fringe
patterns.
So for, we have discussed the effect of the high temperature on the fringe
visibility. Another effect of the temperature is to introduce random phase
components to the fringe patterns.
If we consider the propagation of a light beam through the airs taking place
in the z-direction, the phase change recorded by a double exposure hologram is
Zo
z_p (x,y) = _ [n(x, y,z)- n o(x,y,z)]dz (26)o
11
where no(x,y,z ) is the index of refraction at the time of the initial recording and
n(x,y,z) is the index of refraction at the second exposure. The index of refraction of
a gas is given by the equation,
mp (27)n = 1 + KRT
K is a constant, which is a function of the wavelength of light and the type of gas, m
is the molecular weight, p is the pressure, R is the universal gas constant, and T is
the absolute temperature. The turbulent motion caused by convective currents in
the neighborhood of the heated body produces random changes in the density, the
pressure and temperature. These changes result in random phases which are added
to the changes of phase caused by the loading. These changes of phase will not be
eliminated by using high speed recording. If we are dealing with static or low speed
loadings the changes of phase produced by the loading are stationary in time and
space while the changes of phase caused by the thermal effect are random in space
and time.
TEST TO INVESTIGATE THE EFFECT OF THE APERTURE OF THE
RECORDING CAMERA
The first series of tests were devoted to investigate the effect of the aperture
of the recording camera.
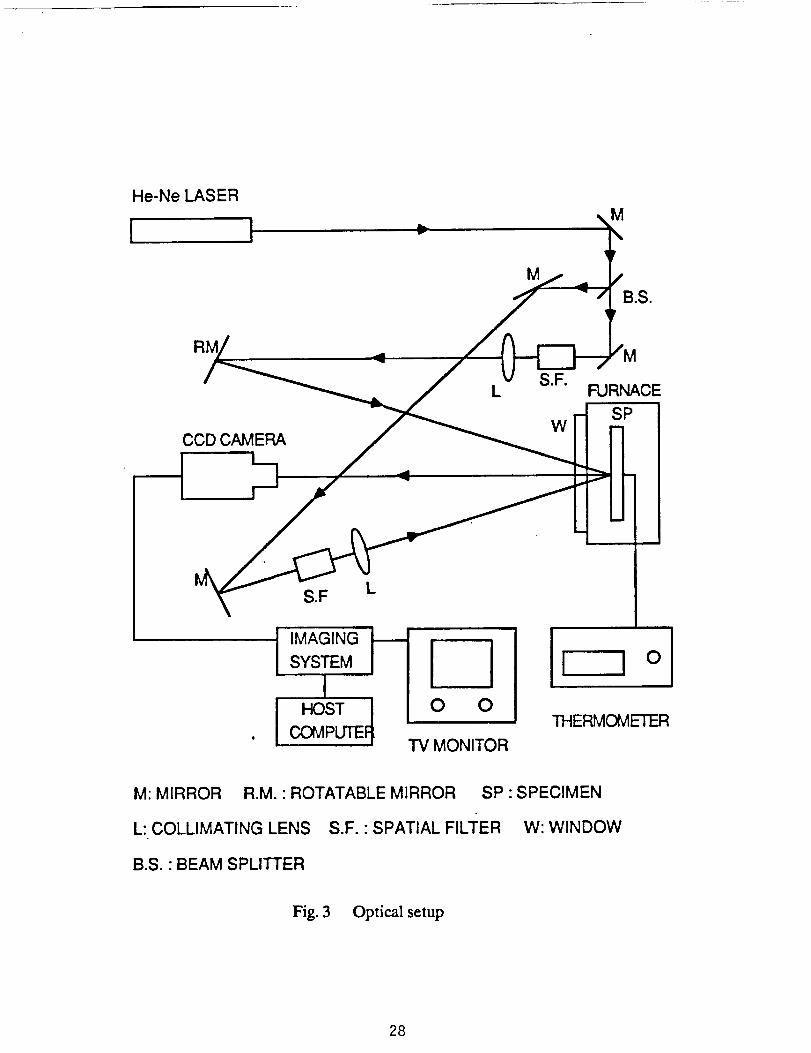
Figure 3 shows the utilized optical set-up. Two rectangular bars were used as
models. The bars were inside an oven. The front window could be closed with a
high temperature silica window. Observations were made with and without the
window. The test showed that, from the point of view of the patterns, there was not
much difference between operating with or without the window. The measurements
were carried out w/th the window to minimize the heat loss.
The furnace has a thermocouple that displays its temperature; the
temperature was measured also by another thermocouple fixed to the specimens
and recorded by a digital thermometer with the accuracy of I°F.
The object was illuminated by a double beam illumination; the
corresponding sensitivity of the system was 0.9251 microns per fringe. In one of the
illumination beams, there was a mirror that could be rotated to generate carrier
fringes. The laser used for illumination was a helium-neon laser operating at 632.8
nm wavelength and at a power of 50 roW.
An interference filter was introduced in front of the lens of the CCD camera.
The filter is rated for maximum transmission of 56.8% at 632.8 nm wavelength. The
12
bandwidth of the filter, defined as the band measured between points where the
transmission has fallen to one half of the maximum, is 3.5 rim.
Two specimens were investigated; a ceramic specimen - a Norton silicon
carbide bar and a Haynes alloy No. 230. The Haynes alloy is a nickel-cromium-
tungsten-molybdenum alloy which has good high-temperature strength and a
resistance to oxidation up to 1,150°C.
During the tests, the SiC bar did not change the appearance of the surface; it
remained shiny and smooth. The Haynes alloy became covered by a black oxide; in
view of this phenomenon, all the experiments for the Haynes alloy were performedin the oxidized condition.
A series of experiments were carried out to define the main characteristics of
the optical parameters that influence the fringe contrast at high temperatures. The
coefficient of expansion of the Haynes alloy 230 was measured between 797°C to986°C.
In Fig. 4 the image intensity measured after the filter is plotted as a function
of the image intensity before the filter for apertures 1/9, 1/12, 1/14 and 1/16 of the
lens system and an illumination intensity in the object plane of 0.20 mW/cm 2. The
filter is rated as having a transmission coefficient of 58.6% at 632.8 nm; Fig. 4 gives
a transmission coefficient of 46.7%. This quantity agrees well with the data
provided for the filter, at 46.7% transmission the bandwidth is 2.5 nm.
Tables I and II summarize some of the quantities measured in the tests. Of
particular significance are the ratio C, ratio between the illumination received by
the object and the intensity generated by the temperature. For the SiC bar, this ratio
is 16.6% and 16.9% for the Haynes alloy in the oxidized condition. This ratio must
be compared with the ratio J of intensities after the filter in the image plane. This
quantity for the SiC bar is 33.3% and indicates that the filter has been very effective
in reducing the effect of the energy emitted by the heated surface. For the Haynes
alloy, J is only 7.3%, this reduction is caused by the dropping of the amount of the
light returned by the oxidized surface of the alloy.
Figure 5 shows the intensity in the image plane after the filter as a function
of the lens aperture for the SiC bar (room temperature). If the illumination was
uniform, this function should change with the ratio of the square of the radii of the
apertures, however since the illumination is stronger at the center than at the
periphery of the aperture, the actual function although quadratic shows lesser
reduction of the intensity than the ratio of the squares of the radii. Figure 6 shows
the experimentally determined fringe visibility in the monitor screen versus the
speckle radius for the SiC ceramic bar. The fringe patterns were generated by
rotating one of the illumination beams, in all cases the amount of rotation was the
same. The speckle radius is computed by means of the equation:
0.61zrp - (2,8)
NA
13
where NA is the numerical aperture of the lens system. All the patterns are
recorded with the same electronic gain. There are two room temperature curves,
one without window, the other with a window. The presence of the window reduces
the visibility, as one could expect, since some amount of light will be reflected by the
window. The high temperature curve corresponds to IO00°C; the patterns were
recorded with a window. As shown in[19l and[20] there is an optimum numerical
aperture that yields maximum visibility. The plot in Fig. 6 shows a steeper loss of
visibility with increasing speckle size than the curves shown in[19] and[201.
Figure 7 shows for the SiC bar the relation between the intensity at the image
plane after the filter at high temperature (1000°C) versus the same intensity at room
temperature. The measurements were carried out for the aperture 1/9. The high
temperature values were determined by subtracting from the intensities at high
temperature with laser illumination, the intensities without illumination. The slope
of the resulting line is approximately one, indicating that for the ceramic bar the
reflectivity remains almost constant from room temperature to 1000°C.
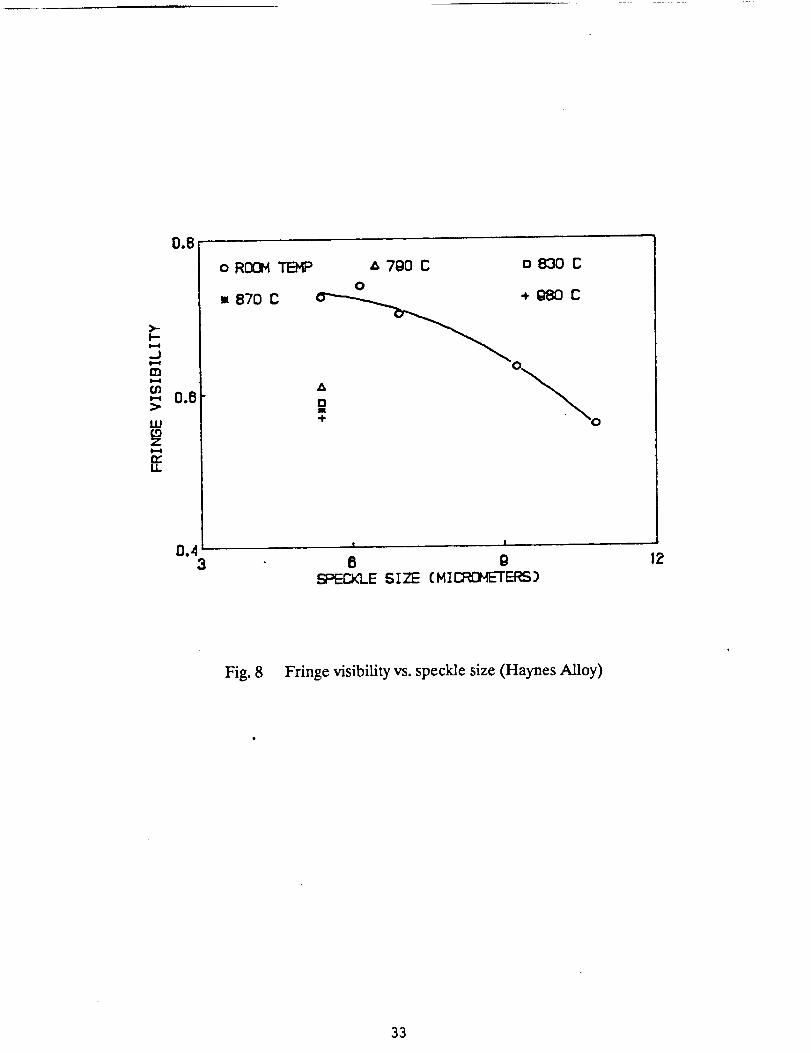
Figure 8 shows for the Haynes 230 alloy, the fringe visibility as a function of
the speckle radius at room temperature for the fully oxidized surface. The lower
points correspond to visibilities measured for the 1/7 aperture at the indicated
temperatures. The electronic gains were not kept constant for the high temperature
due to the fact that the average intensity saturated the camera, thus the gains have
to be reduced with the increasing temperature.
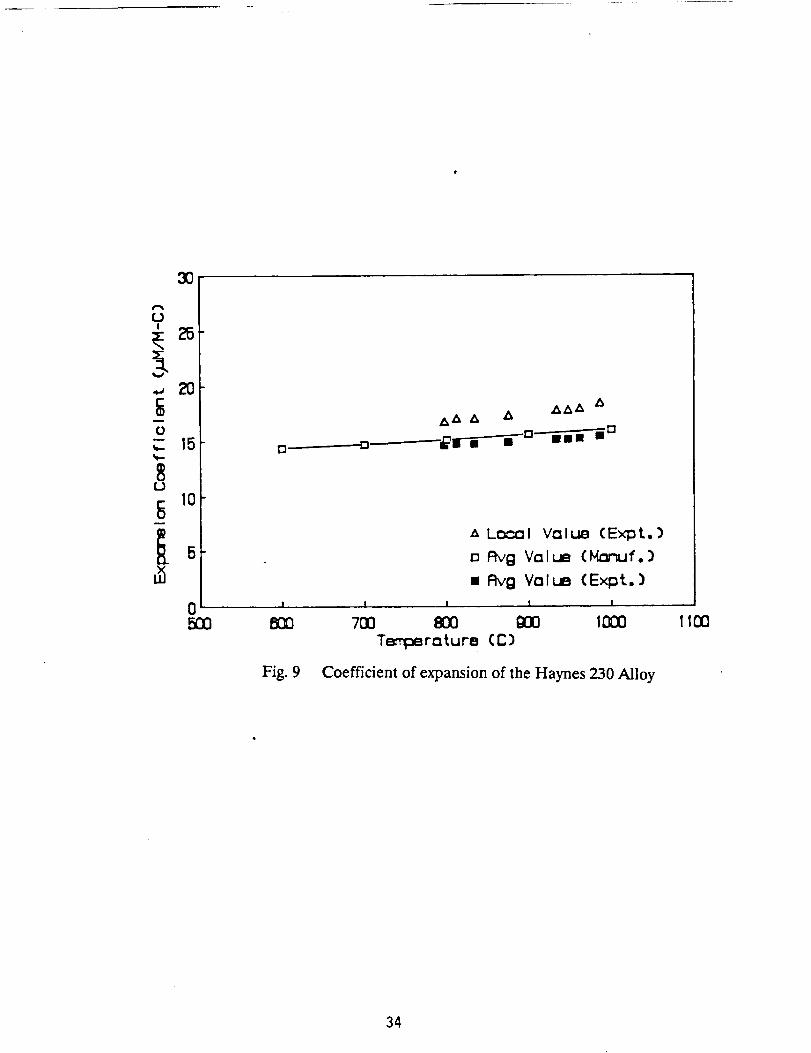
Figure 9 shows the measurement of the coefficient of expansion of the
Haynes alloy as a function of the temperature between 797 and 986°C. The
measurements were carried out by introducing a system of carrier fringes and
recording the changes of the carriers for intervals of temperature ranging from 5°F
to 10°F, depending from the visually observed deterioration of the fringe visibility
with displacement and time. Although they are not exactly comparable, data
provided by the manufacturer are also plotted. These coefficients are averages from
room temperature to the high temperature. Both curves show the same trend and
there is also a numerical agreement. The coefficient of expansion between 25-
100°C is 12.7 x 10⁻⁶ °C and between 25-1000°C is 16.1 x 10⁻⁶ °C. If we average the
12.7 with the 18.5 at 1000°C, computed from the second order polynomial that fits
all the measured points, we get 15.6 which is only 3.1% from the value 16.1 given by
the manufacturer for the average between 0 to 1000°C, and excellent agreement.
The actually measured strains used to plot the coefficient of expansion curve rangedfrom 50.4 x 10 -6 at 986°C to 97.3 x 10 -6 at 836°C.
14
DISCUSSION AND CONCLUSIONS CONCERNING THE FIRST SERIES OF
HIGH TEMPERATURE TESTS
The first series of test was devoted to the study of the main variables
controlling the fringe visibility. The effect of the aperture on fringe visibility
confirmed the theory presented in[191 and[2°].
The measurements performed in the oxidized Haynes alloy show that even at
very low light intensities (only 7.3% of the background light) one can perform very
accurate measurements at 1000°C. The light intensity was .2 mW/cm 2. The
conclusion is that one can perform accurate measurements at 1000°C even in poorly
reflecting surfaces.
Two improvements were suggested by this series of tests. One is to cover the
surface to be analyzed with a light reflecting ceramic. A filter with a reduced
bandwidth is another possibility to improve the ratio R defined by equation (25).
Assuming a 80% effective delivery, with a 1.5 watts of coherent light at 531.4
nm wavelength, an argon-ion laser could provide illumination for about a square
meter. In this calculation, a .2 mW/cm 2 light intensity density and the improvement
resulting from a shorter wavelength were used.
SECOND SERIES OF TESTS
The first series of tests provided information concerning the variables
controlling fringe visibility. This series also proved the feasibility of accurate strain
measurements at 1000°C. A second series of tests was programmed. A disk under
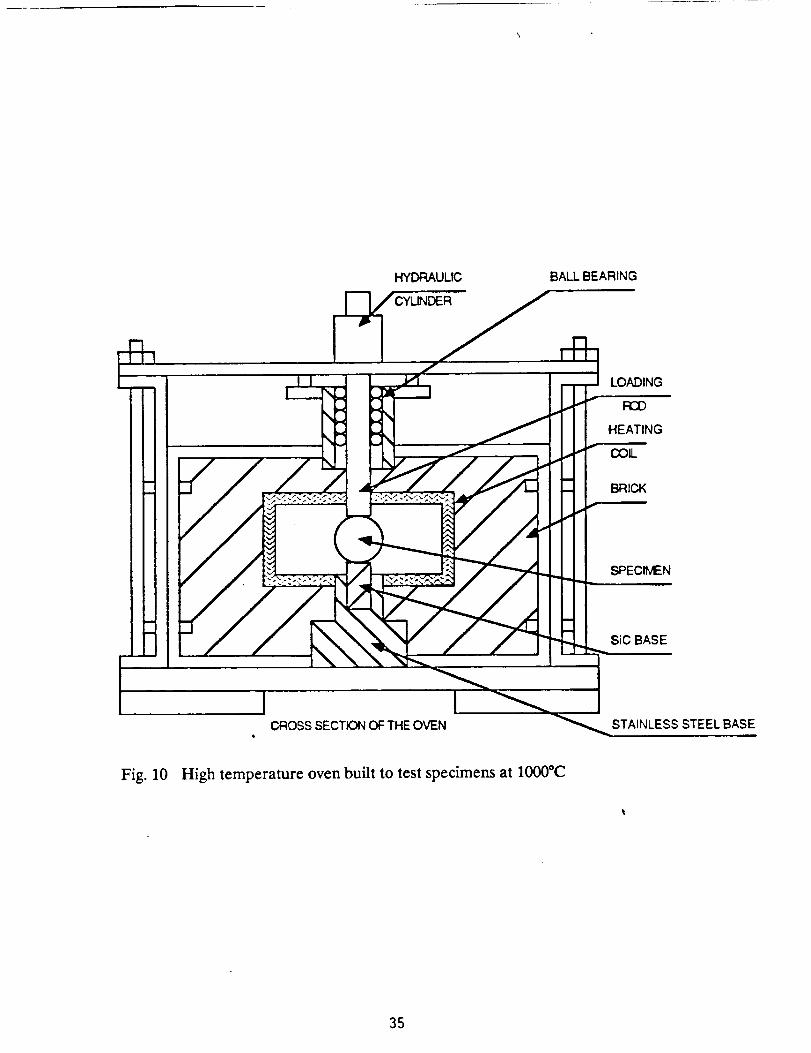
diametrical compression was chosen as a model. To perform the tests, a high
temperature oven and a loading frame were designed and built. Figure 10 shows
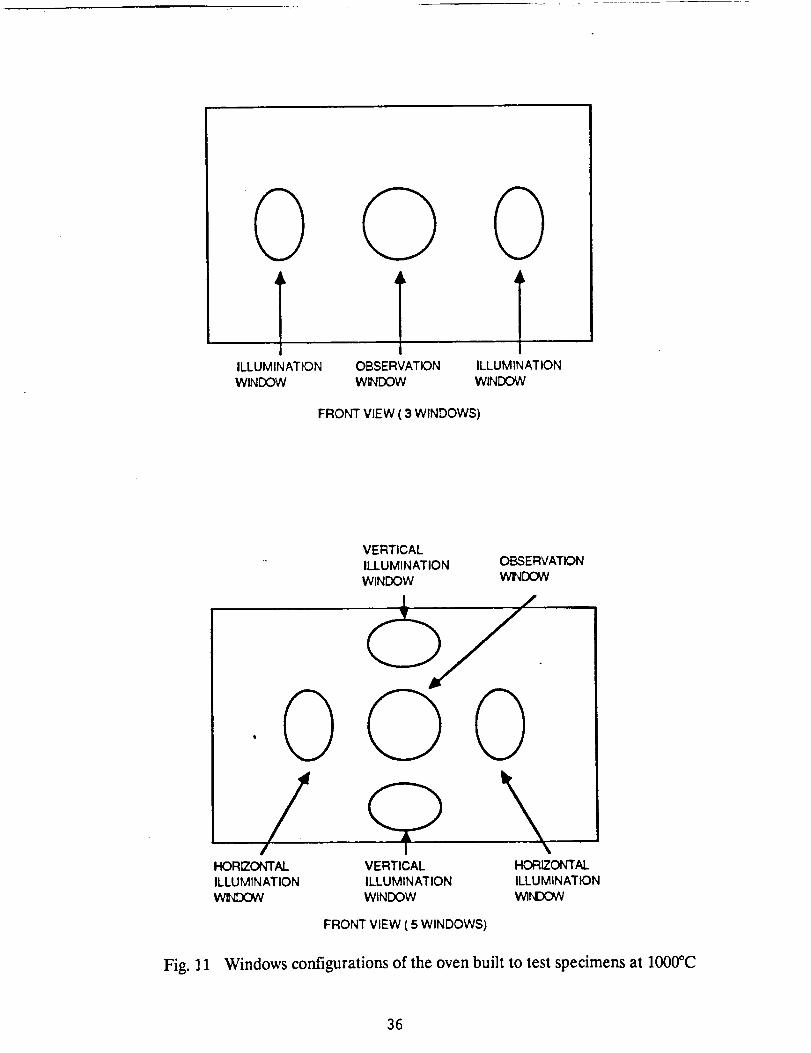
the cross section of the oven and the corresponding loading frame. Figure 11 shows
the detail of the oven door. The door has three windows, a central window to view
the model and two lateral windows for illumination at 45 °. To insure the stability of
the loading, the load was applied through a silicon carbide rod guided by a lateral
bearing. The specilnen was supported by another silicon carbide rod. The specimen
was instrumented with thermocouples and with high and low temperature strain
gages. The location of the thermocouples and strain gages is shown in Fig. 12.
Preliminary tests provided valuable information concerning two important
effects influencing the process of recording fringe patterns. The applied load causes
a distortion of the loading frame. This distortion introduces a rigid body motion of
the model. This motion results in the loss of the correlation between the two
images, the initial and the final, that are needed to produce a fringe pattern. To
minimize a rigid body motion it is necessary to build a very rigid frame. In view of
the loads that is necessary to apply to the specimen, this solution is not practical.
Three alternative solutions can be followed to take care of this problem, besides
reinforcing the frame. The first one is to limit the load to an amount that preserves
15
the correlation. The second one is to reset the system and to apply additional
loading. The third solution is to compensate the rigid body motion. This concept
will be analyzed in more details later on. In this series of tests, the loading was
limited to the amount that could be applied without causing total decorrelation of
the images. The model was subjected to an initial load of about 1600 pounds and
the first image was recorded. An additional load was applied until a total of 6
fringes were observed.
The second effect is the turbulence of the air caused by the heat applied to
the specimen. It was observed that the pattern motion resulting from the turbulence
of the air has an almost periodic character. Hence, the pattern goes through brief
stable periods. These periods were used to snap an image.
The tests were carried out at low and at high temperatures. The results of
the low temperature tests are summarized in Table III. The strains measured by the
strain gage located at the quarter point along the disk diameter are compared with
the theoretical and experimental values. The agreement between the three types of
values is excellent. It is a well known fact that the experimental values of the strain
at the quarter point along the diameter agree with theoretical. Furthermore, the
strain distribution at the quarter point is such that the value measured by the strain
gage agrees with the value at the centroid of the gage.
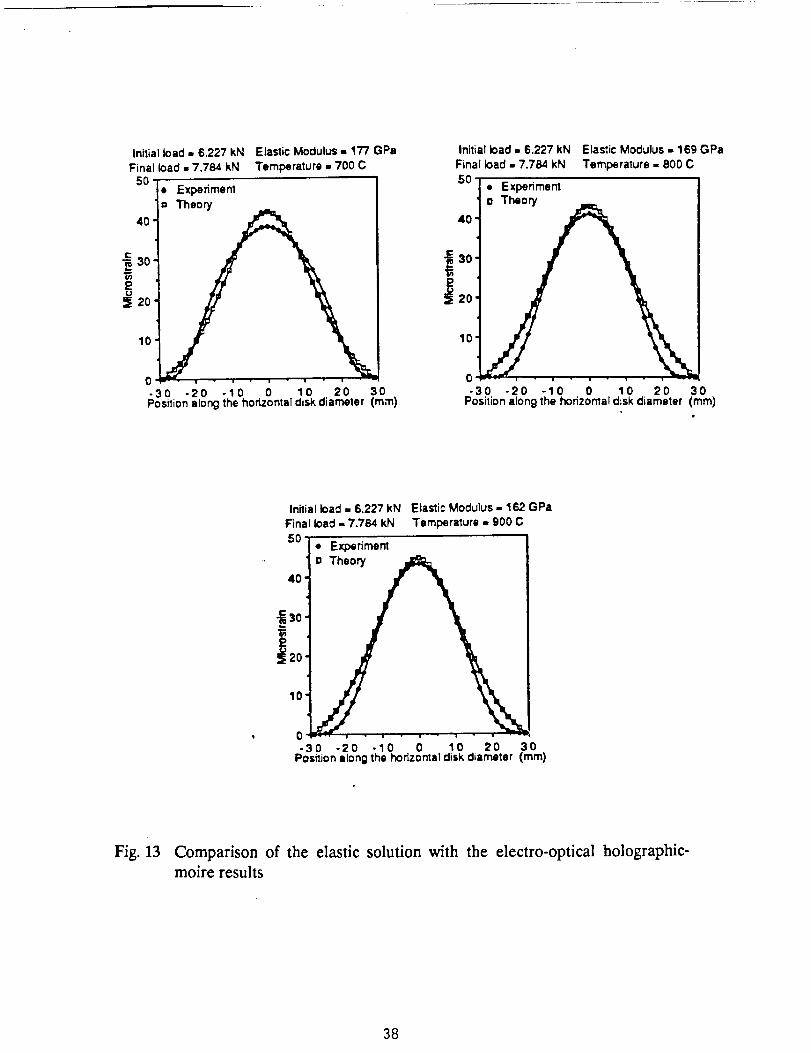
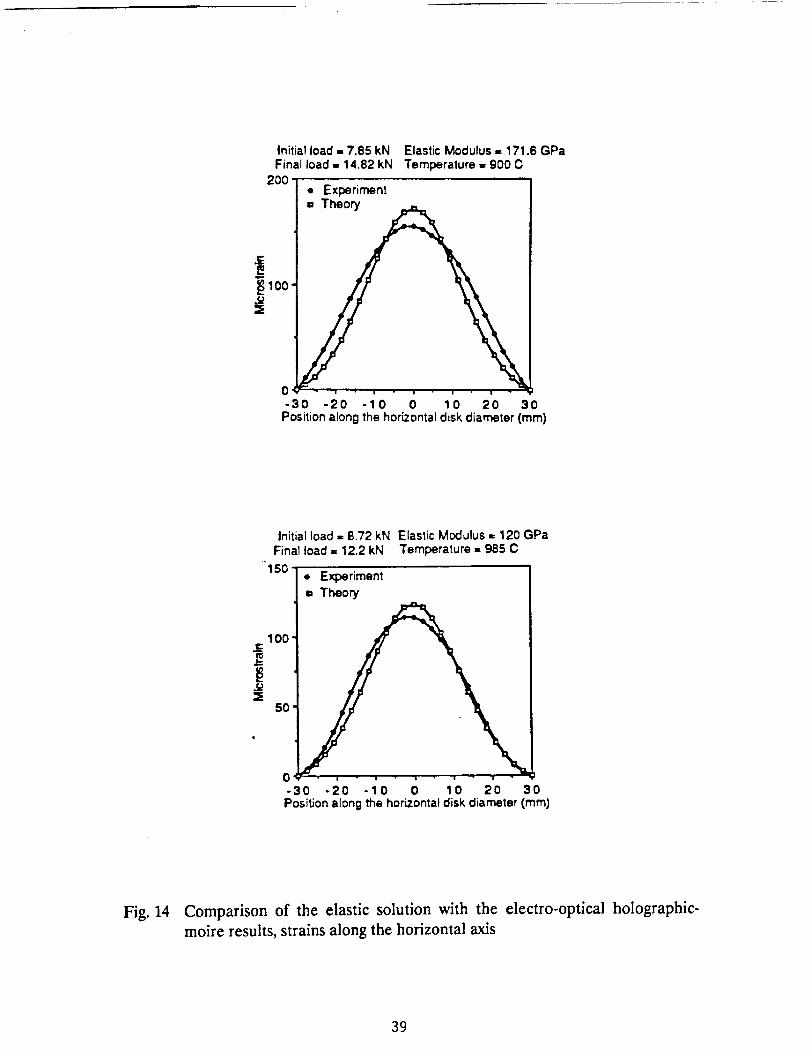
The tests at high temperature could not be checked against the high
temperature gage because the gage failed. In Fig. 13 and 14 the experimental values
are compared with the theoretical values. To obtain this comparison the following
procedure was used. The stresses at the quarter point obtained from the theory of
the elasticity, together with the experimentally obtained strains were used to obtain
the elastic modulus of the material at the corresponding temperature. An
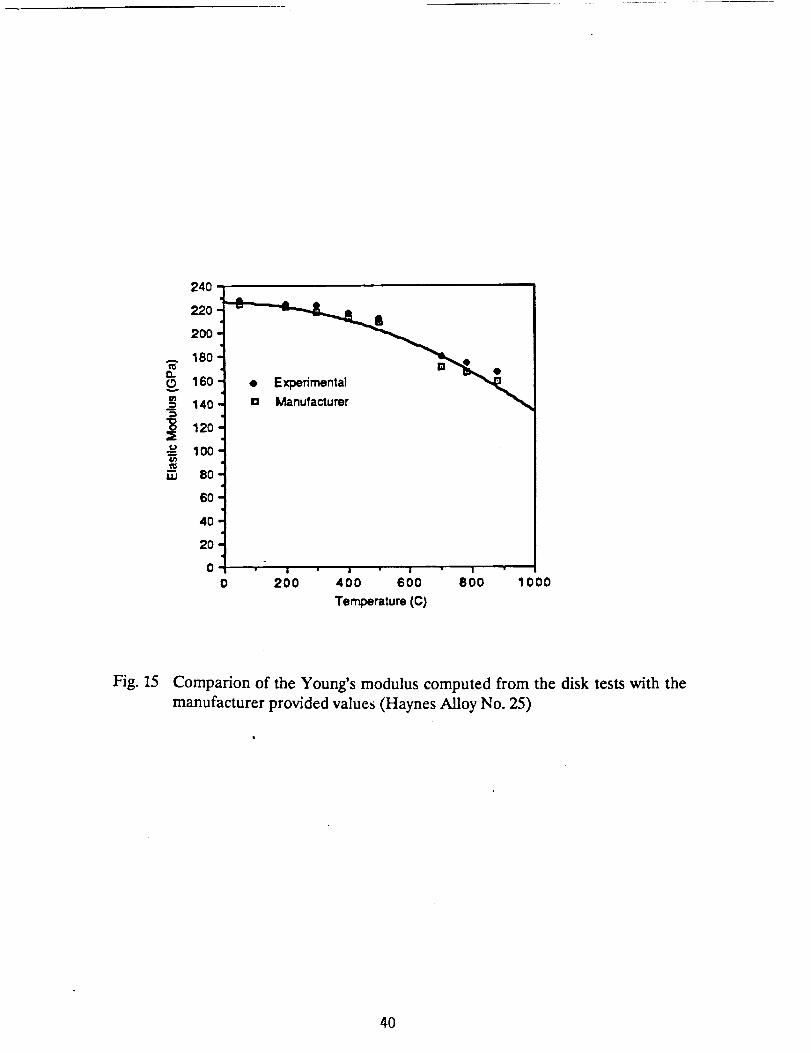
independent verification of this procedure was obtained by comparing the obtained
elastic moduli with the moduli provided by the manufacturer of the alloy, Fig. 15.The manufacturer's elastic moduli values were obtained from ultrasonic
measurements. Since the experimental values correspond to very low stresses, the
agreement with the ultrasound measurements is not surprising. Figure 16 shows the
fringe pattern corresponding to 900°C.Q
THIRD SERIES OF TESTS
For the third series of tests the oven was modified, introducing an additional
pair of windows to provide vertical illumination. The oven with five windows
showed an increased air turbulence when compared to the previous oven
configuration. An additional internal window was introduced to reduce the airturbulence.
A second and more rigid loading frame was built. In this series of test it was
planned to increase the total load applied to the specimen. The loading mechanism
was also modified. The silicon carbide bar used to apply the load developed cracks
as a result of the previous tests. It was replaced by a bar of the same Haynes alloy
16
used in the specimen. The supporting load also cracked and was replaced with a
wider stainless steel base protected by a silicon carbide plate.
The third series of test was carded out on another instrumented specimen.
Again, besides the thermocouples, low and high temperature gages were fixed on
the surface of the specimen.
During the preliminary tests, the upper edge of the disk was damaged and it
was necessary to remove a circular sector from both loading areas. The load was
applied over a wider area than that resulting from the natural flattening of the
contact region.
To increase the total load applied to the specimen, the load step procedure
was applied to this series of tests. An initial load of 1.8 kN was initially applied and
the load was incremented in steps up to 18 kN. At each load step a new initial
image was recorded. The displacements corresponding to each load step were
computed. The total displacement was obtained by adding the displacements at each
step. The strains corresponding total displacement field were computed. The
displacements in the vertical and in the horizontal directions were recorded. Again,
the technique to record patterns was to snap a picture each time that the thermal
fluctuations of the pattern went through a brief period of stability.
The strains resulting from the optical measurements were compared with the
strain gages outputs. Again, the high temperature gages failed. For this reason, the
comparisons between the strain gages and the holographically determined values
were limited to the low temperature range. The results of these tests are
summarized in tables IV and V. These tables give the strain gage values and the
holography values for maximum load. The differences between the two
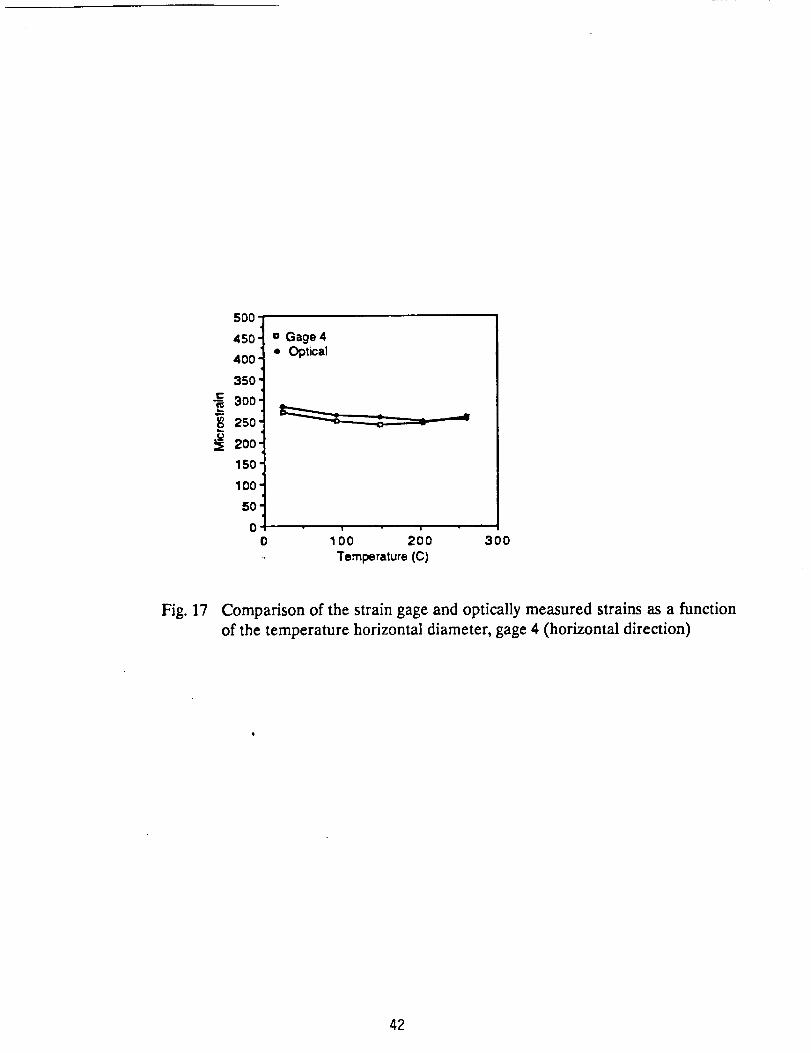
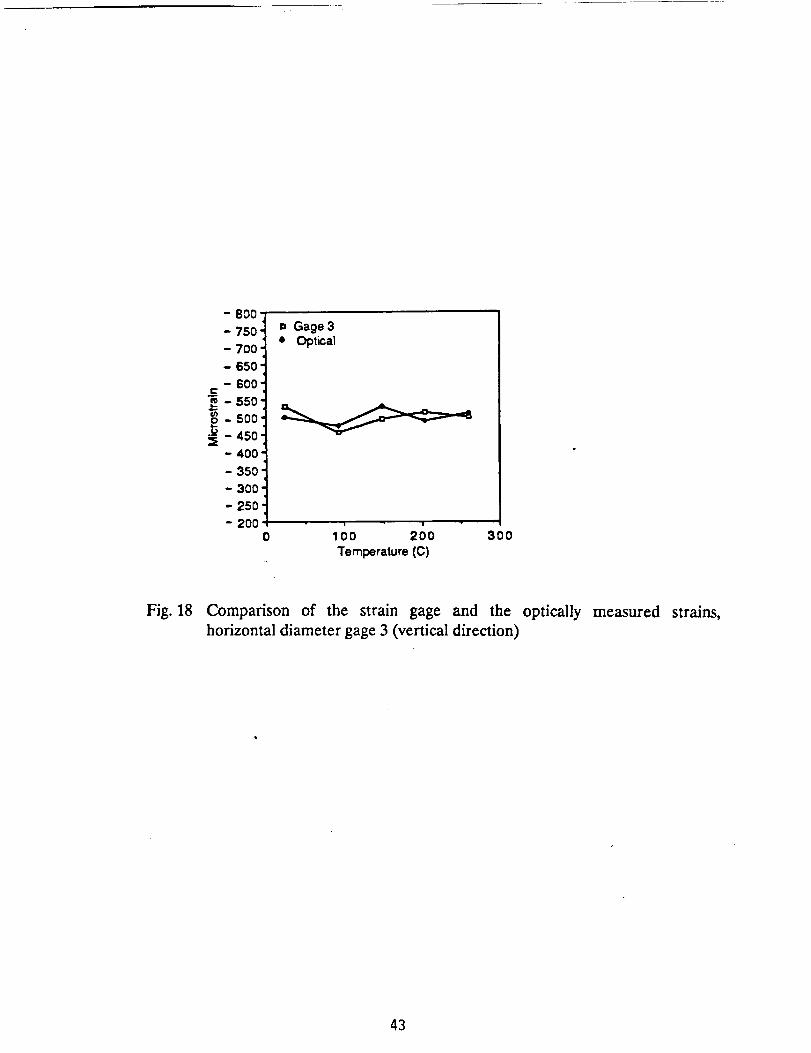
measurements are within a 5% difference. Figures 17 and 18 give the comparison of
the two sets of readings as a function of the temperature. Figure 19 gives the
pattern of the vertical displacements.
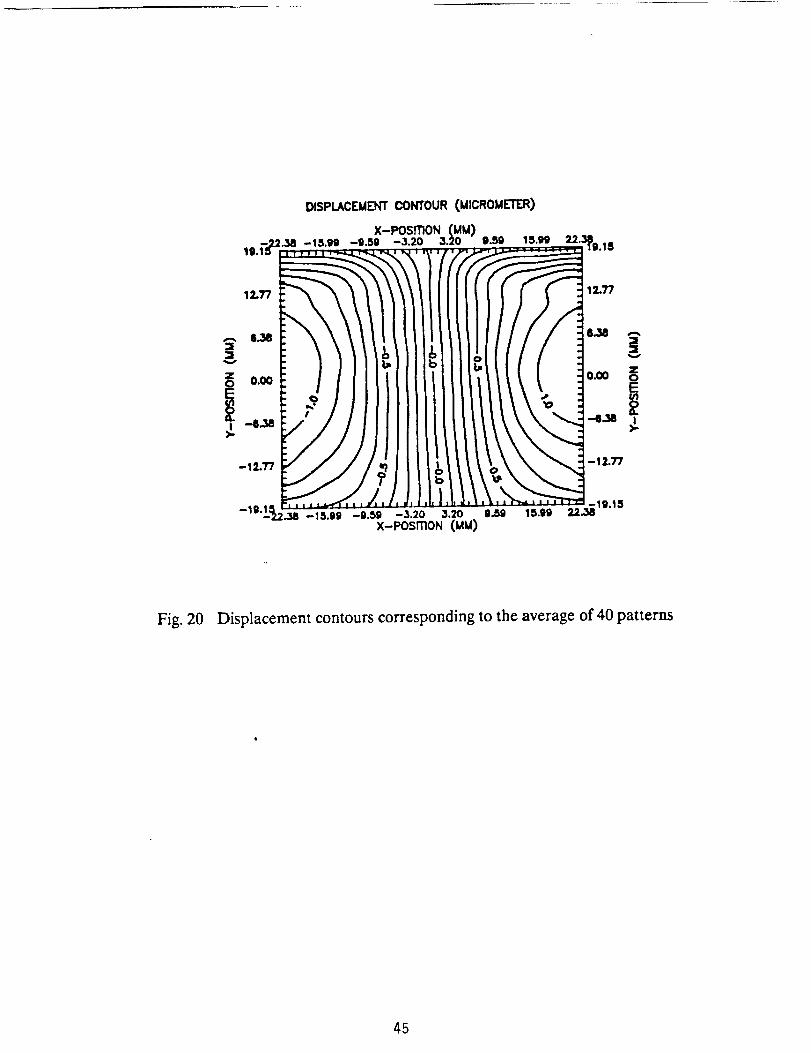
The high temperature tests were performed using a different technique to
obtain the displacement information. In a previous section we have mentioned the
fact that the changes of phase produce by the thermal convective air currents arerandom in nature. A solution to remove these changes is to compute the phases of a
sufficient number bf recordings and to average them. Since the changes of phase
produced by the loading are stationary in space and time, the average will converge
to the stationary value.
The technique of displacement averaging was applied to recordings made at
the temperature of 985°C. At this temperature the creep of the metal is
pronounced, therefore the stresses were kept low. Forty patterns were snapped at
random and the phases of these patterns were computed. The 40 phases were
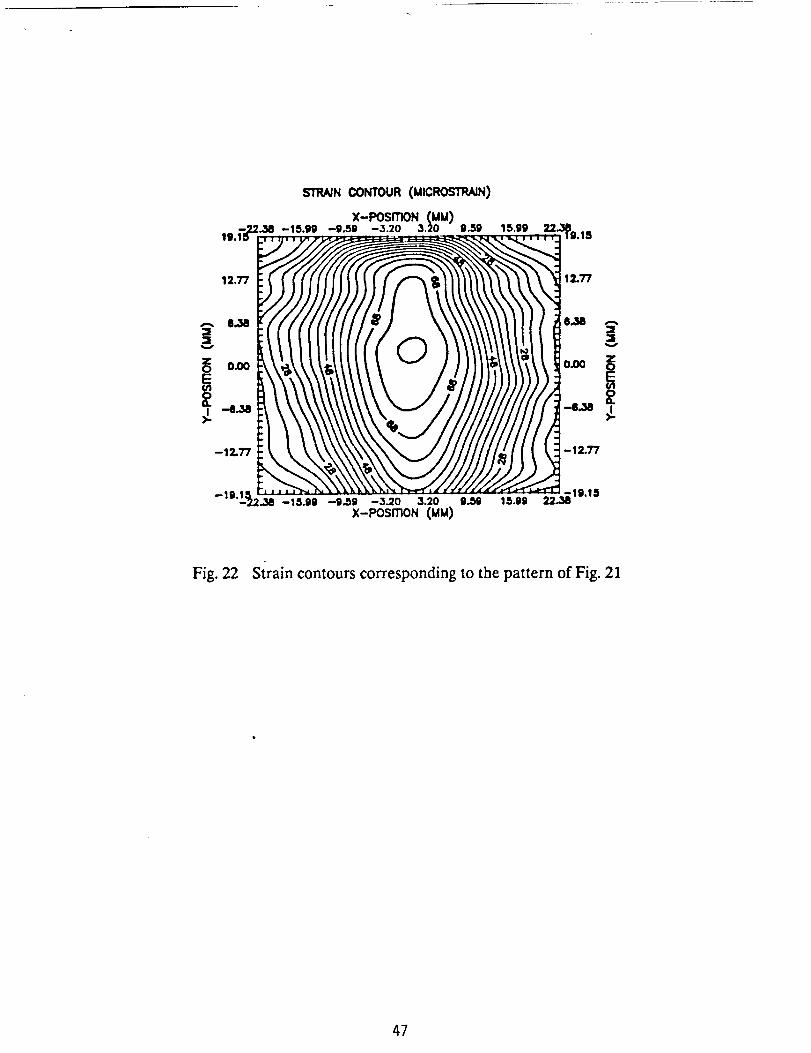
averaged. Figure 20 gives the averaged displacements and Fig. 21 the fringe pattern
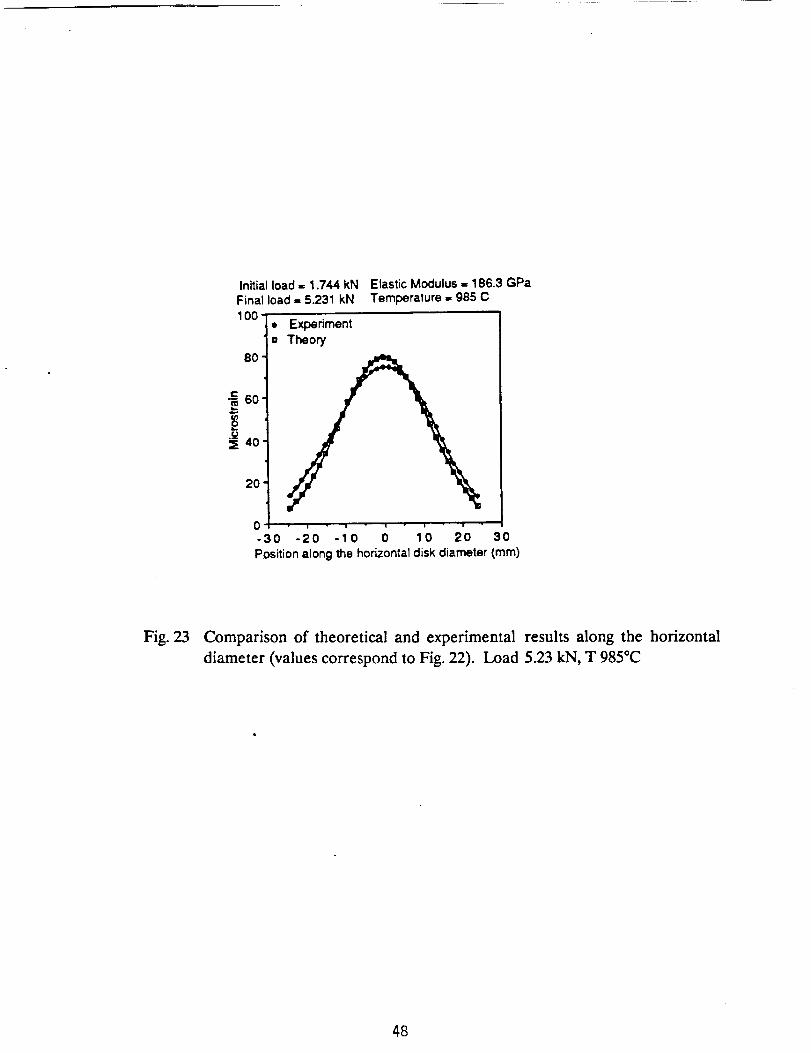
corresponding to the averaged phase. Figure 22 gives the strains. Figure 23 gives
the comparison of the theoretical and the experimental values along the horizontal
diameter. It can be seen that the effect of the flattening of the ends of the specimen
17
does not have a pronounced effect in the strain distribution along the horizontaldiameter. The effect of the flattening is pronounced near the region were the load
is applied as it can be seen in Fig. 22.
SUMMARY AND CONCLUSIONS
The technology to measure displacements and strains at high temperatures
using electronic holography has been successfully developed. The different
variables that control the recording of displacements and strains have been
individualized. Each one of these variables has been theoretically and
experimentally studied. For each one of them, satisfactory compromises have been
found between desired results and practical and economical implementation of
solutions.
The effect of the light intensity radiated by the surface is reduced by
introducing a narrow band pass optical filter, and by improving the surface
reflectivity. The improved reflectivity is obtained by applying to the surface a
ceramic coating.The effect of the thermal convective currents is controlled by two separate
means. One is to snap the pictures when the thermally generated changes of phase
go through brief periods of rest. The other is to average the phases of many
recordings. The current version of the instrument has the circuit that compensates
the changes of optical phase caused by vibrations, thermal changes in the optical
fibers and changes of phase caused by thermal convection currents. This circuit has
been successfully checked at room temperature.
The loss of visibility due to the loss of correlation between the initial and
final images, is compensated by sequential loading. In the current version of the
interferometer, the rigid body motion can be compensated by moving the camera.
The compensation has been satisfactorily checked at room temperature.
During the period of the research program, important improvements wereintroduced in data processing. The addition of a new parallel processor made it
possible to implement a 2-D data processing. The 2-D data processing has resulted
in an improvement in the quality of the obtained results, as well as in the speed of
processing. Currently a full image can be processed in about two minutes.
The application of the interferometer to measure displacements and strains
at high temperatures has been carried out through three series of tests. In all three
cases accurate quantitative results have been obtained, and these results have been
checked by comparison with theory or with other experimental values. These results
show beyond doubts that electronic holography can be used as a tool to obtain
accurate displacement and strain information at high temperatures.
The development of the program has reached the point where the final phase
of the project can be carried out: the construction of a prototype to operate at the
NASA-Dryden facilities.
18
REFERENCES
1. Sciammarella, C.A., "Strains at high temperature by optical techniques," 4th
Annual Hostile Environments and High Temperature Measurements, HEHTM,
Winsor Locks, CT, SEM, March 1987.
2. Lockberg, OJ., Malmo, J.T. and Slettemoen, G.A., "Interferometric
measurement of high temperature objects by speckle pattern interferometry,"
Applied Optics, 24, (19), 3167, 1985.
3. Malmo, J.T., Lockberg, OJ. and Slettemoen, G.A., "Interferometric testing at
very high temperatures by TV holography (ESPI)," Experimental Mechanics, 28, (3),
315, 1988.
4. Sciammarella, C.A, Bhat, G. and Shao, Y., "Measurement of strains at high
temperatures by means of a portable holographic moire camera," Proceedings
HEHTM, SEM, 21, November 1989.
5. Lant, Ch.T. and Barranger, J.P., "Progress in high temperature speckle shift
strain measurement system," Hologram Interferometry and Speckle Metrology,
Proceedings SEM, November 5-8, 1990.
6. Kang, J., Wang, F.X. and Liu, O.K., "High temperature moire interferometry
for use to 550°C," Hologram Interferometry and Speckle Metrology, Proceedings
SEM, November 5-8, 1990.
7. Jones, R. and Wykes, C., Holography and Speckle lnterferometrv,
Cambridge University Press, 1989.
8. Stetson, K.C. and Brohinsky, W.R., "Electro-optical holography and its
application to hologram interferometry," Applied Optics, 24, 363, 1985.
9. Sciammarella, C.A., Bhat, G. and Albertazzi Jr., A., "Measurement of strains
by means of electro-optics holography," to be published in the proceedings of the
SPIE's Optical Engineering Midwest, Chicago, September 21-28, 1990.
10. Sciammarella, C.A. and Ahmadshahi, M.A., "Detection of fringe pattern
information using a computer based method," Wieringa, H. (ed.), Experimental
Stress Analysis, 15BN90-247-3346-4, Martinus Nijhoff, Dordrecht, 1986.
11. Sciammarella, C.A. and Gilbert, J.A., "Holographic-moire technique to
obtain separate patterns for components of displacement", Exp. Mech. 16, (6), 1976.12. Sciammarella, C.A. and Chawla, S.K., "A lens holographic moire technique
to obtain displacement components and derivatives," Exp. Mech., 18, (10), 1978.
13. Gilbert, J.A., Sciammarella, C.A, and Chawla, S.K., "Extension to three-
dimensions of a holographic-moire technique to separate patterns corresponding to
components of displacement," Exp. Mech., 18, (9), 1978.
14. Sciammarella, C.A., Rastogui, P.K., Jacquot, P. and Natayanan, R.,
"Holographic-moire in real time," Exp. Mech. 22, (2), 1982.
15. Sciammarella, C.A., "Holographic-moire, an optical tool for the
determination of displacements, strains, contours and slopes of surfaces", Optical
Eng., 21, (3), 1982.
19
16. Sciammarella, C.A. and Ahmadshahi, M.A., "A computer based holographic
interferometry to analyze 3-D surfaces," IMEKO XI, Instrumentation for the 21st
Century, Proceedings of the l lth Triennial Congress, Metrology, Instrument Society
of America, 163, 1988.
17. Sciammarella, C.A. and Ahmadshahi, M.A., "Computer aided holographic-
moire technique to determine the strains of arbitrary surfaces vibrating in resonant
modes," Proceedings of the 1989 SEM Spring Conference on Experimental
Mechanics, Boston, 1989, 579.
18. Sciammarella, C.A., Bhat, G. and Albertazzi Jr., A., "Analysis of the
sensitivity, an accuracy in the measurement of displacements by means of
interferometric fringes," Hologram and Speckle Metroloty, Proceedinsg of SEM,
Baltimore, 1990, 310.
19. Fujji, H., Asakura,T. and Shinda, Y., "Measurement of surface roughness
properties by using speckle image contrast," J. Opt. Soc. Am., 66, (11), 1976.
20. Fujii, H., Uozomi, J. and Asakura, T., "Computer simulation study of image
speckle patterns with relation to the object surface profile," J. Opt. Soc. Am., 66,
(11), 1976.
20

TABLES
21
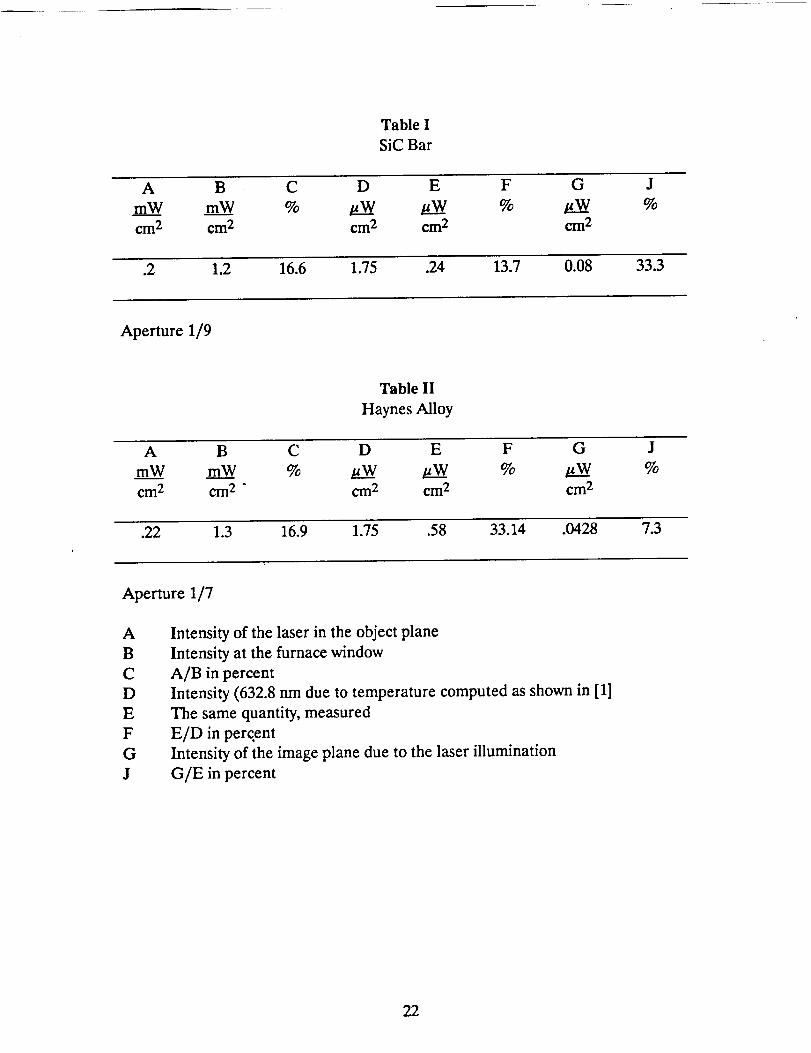
Table ISiCBar
A B C D E F G J
mW m___W % V___W v__W % _ %
_2 _2 _2 _2 _2
.2 1.2 16.6 1.75 .24 13.7 0.08 33.3
Aperture 1/9
Table II
Haynes Alloy
A B C D E F G J
mW mW % v__W _ % _ %
cm 2 cm 2 - cm 2 cm 2 cm 2
.22 1.3 16.9 1.75 .58 33.14 .0428 7.3
Aperture 1/7
A
B
C
D
E
F
G
J
Intensity of the laser in the object plane
Intensity at the furnace window
A/B in percent
Intensity (632.8 nm due to temperature computed as shown in [1]
The same quantity, measured
E/D in percent
Intensity of the image plane due to the laser illumination
G/E in percent
22
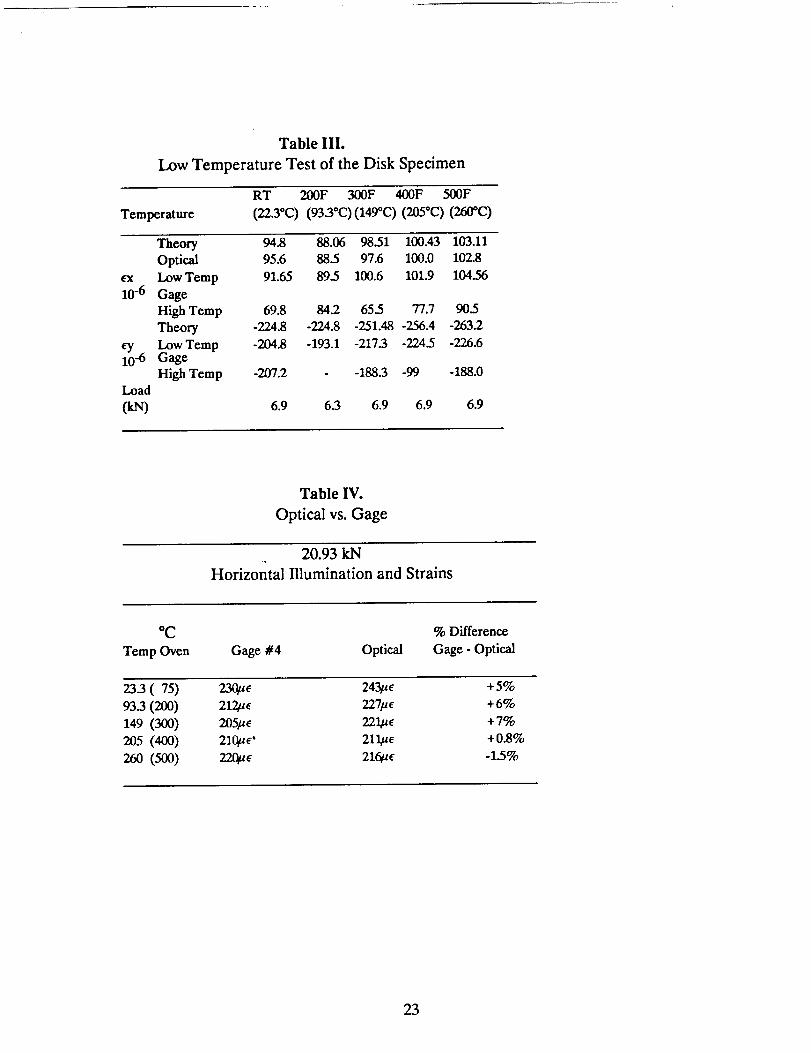
Table III.
Low Temperature Test of the Disk Specimen
RT 200F 300F 400F 500F
Temperature (22.3"C) (9330C)(149°C) (2050C) (260"C)
e-x
10-6
1_-6
Load
(IN)
Theory 94.8 88.06 98.51 100.43 103.11
Optical 95.6 88.5 97.6 100.0 102.8
Low Temp 91.65 89.5 100.6 101.9 104.56
Gage
High Temp 69.8 84.2 65.5 77.7 90.5
Theory -224.8 -224.8 -251.48 -256.4 -263.2
Low Temp -204.8 -193.1 -217.3 -224.5 -226.6Gage
High Temp -207.2 -188.3 -99 -188.0
6.9 63 6.9 6.9 6.9
Table IV.
Optical vs. Gage
20.93 kN
Horizontal Illumination and Strains
°C
Temp Oven Gage #4 Optical
% Difference
Gage - Optical
23.3 (75) 23_E 243_ +5%93.3 (200) 212,uE 227/_E + 6%
149 (300) 205/_E 22_uE +7%
205 (400) 21quE" 211/aE +0.8%
260 (500) 22quE 216u_ -1.5%
23
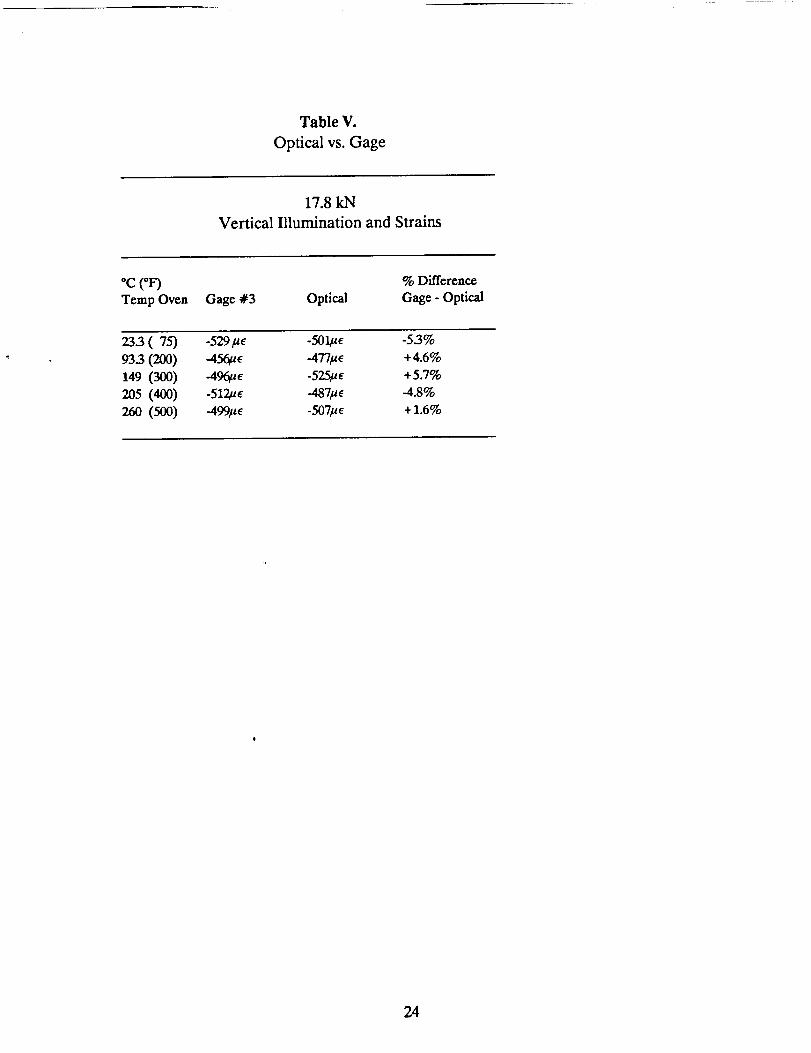
Table V.
Optical vs. Gage
17.8 kN
Vertical Illumination and Strains
*c (*F)Temp Oven Gage #3 Optical
% Difference
Gage - Optical
23.3 (75) -529/ae
933 (200) -456/,E149 (300) -496/z E
205 (400) -512_uE
26o (50o) -499/,E
-50_u_-477kL_
-525_e
-507/_
-53%
+4.6%
+5.7%
4.8%
+1.6%
24

FIGURES
25
Fringe stabilization unit
f,_ Optica.....___lfibe._.._r
o0,oo, / \
Optical fiber I controller
I
I C°mputer I
ADI - Alalog to digital interface FB - Frame buffer ALU - Arithmetic and logic unit
• AP - Array Processor
Fig. 1 Schematic representation of the electro-optical system used to measure
strains at high temperature
26
10 0 _ !
10"1
t iHeNe
I
E ......
o //_-..-. 10 /- /- /,=,I
1[_ '"i ' / ,' .....4
, • . _ C
(_2"Snm)_f _" / / I,iv
'//i i i,f r ! ! !
t1
10oo 2000 3000 T (°C)
Fig. 2 Background radiation energy for the black body (emmisivity c= 1) as a
function of the temperature
27
He-Ne LASER
M
M
CCD CAMERA
r-.-J
S.F L
i IMAGINGSYSTEM
I
. C,C_PUIE_
FURNACE
I I0 0
TV MONITOR
I I °
THERMOMETER
M: MIRROR R.M. • ROTATABLE MIRROR SP" SPECIMEN
L: COLLIMATING LENS S.F. "SPATIAL FILTER W: WINDOW
B.S. "BEAM SPLITTER
Fig. 3 Optical setup
28
0.10
n_¢.)
_r
n-
.J0.05
IL
i O.O0
n.o0
I J I
0.05 0.I0 0.15INTEN.._ITY BEFORE FILTER CHICROWRTTS)
0.20
Fig. 4 Transmission function of the filter
29
!o.=
0.t_
0.000.00
o I118 _ I114 ,_/
J !
0.05 0.10NLII',ERI D:L F:PERT1i_
0.I5
Fig. 5 Energy in image plane vs. numerical aperture of lens
3O
1.0
0.8
o.e
'_" 0.4
E
0.2
oRT hlW _ RT _,/ mHT WW
0
I I I
3 B gSI71: (MID_NETERS)
12
Fig. 6 Fringe visibility vs. speckle size (SIC) specimen
31
!°Ii°f!°I
INrl_. AT _ TE_:_ER.CMI_WA'rTs)
Fig. 7 Intensity in image plane at high temperature vs. intensity in the image
plane at room temperature
32
0.8
I"M
.J
m
iii
E
0.6
0.43
oRDOM
870 C
t. 790 C n 830 13
0
_ +gSOC
.I , !
fl 9
S=_r33KLE SIZE (Hl_)
12
Fig. 8 Fringe visibility vs. speckle size (Haynes Alloy)
33
3O
'G15
810
0
_- --_n =_- _----_mRm
i
800
Fig. 9
L_I Volus CExpt.)
D Ftvg Val_ (N_w_uf,)
• Flvg Vo ILie ( Exp t. )
I I I I
700 8O0 _ 1_3
Temperoture CO)
Coefficient of expansion of the Haynes 230 Alloy
I1_
34
L.=
J
|
I
HYDRAULIC
CYLINDER
BALL BEARING
CROSS SECTION OF THE OVEN
LOADING
R3D
HEATING
COL
BRICK
SPEC_EN
SiC BASE
STAINLESS STEEL BASE
Fig. 10 High temperature oven built to test specimens at 1000°C
35
0T
ILLUMINATION
WINDOW
OT
OBSERVATION
WINDOW
0T
ILLUMINATION
WINDOW
FRONT VIEW ( 3 WINDOWS)
Fig. 11
VERTICALILLU M INATION OBSERVATIONWINDOW W'I_IDOW
O0
HORIZONTAL VERTICAL HORIZONTALILLUMINATION ILLUMINATION ILLUMINATION
WINDOW WINDOW WlkEX:M,/
FRONT VIEW ( 5 WINDOWS)
Windows configurations of the oven built to test specimens at 1000°C
36
I"q G
Diameter ='60 mmThickness = 4.76 mm
LTG - Low temperature gageHTG - High temperature gage1,2,3,4,5 - Thermocouples
Fig. 12 Location of thermocouples and strain gages in the disk specimens used in
the series 2 and series 3 tests
37
Initial load ,, 6.227 kN Elastic Modulus ,, 177 GPaFinal load = 7.784 kN Temperature = 700 C
50• Experiment
= Theory40
t--
IE 20
10
.30 -20 -10 0 10 20 30Position along the horizontaldisk diameter (ram)
Initial load. 6.227 kN Elastic Modulus = 169 GPaFinal load, 7.784 kN Temperature = 800 C
50 | • Experiment J= Theory _ I
40
I:
30
2o
'2-30 -20 -10 0 10 20 30
Posilion along the horizomal disk diameter (ram)
Initial load = 6.227 kN Elastic Modulus = 162 GPaFinal load., 7.784 kN 'Temperature., 900 C50
• Experiment Jn Theory
40
10
0-30 -20 -10 0 10 20 30
Posil.ionalong the hofizonlal disk diameter (ram)
Fig. 13 Comparison of the elastic solution with the electro-optical holographic-moire results
38
Initial load - 7.85 kN Elastic Modulus = 171.6 GPaFinal load, 14.82 kN Temperature ,=g00 C
2OO• Experiment
=:
_100
-30 -20 -10 0 10 20 30
Position along the horizontal disk diameter (mm)
Initial load = B.72 kNFinal load = 12.2 kN
150
Elastic Modulus = 120 GPa
Temperature = 985 C
• Experiment
D Theory
100C
50
0 " " "
-30 -20 -10 0 10 20 30Position along the horizontal disk diameter (ram)
Fig. 14 Comparison of the elastic solution with the electro-optical holographic-moire results, strains along the horizontal axis
39
240
220
200
180
_ 160
__ 140
12o
t'_
rn 80
6O
4O
20
es Manufacturer
,°
I ' i I • I
0 200 400 600 800 1000
Temperature (C)
Fig. 15 Comparion of the Young's modulus computed from the disk tests with the
manufacturer provided values (Haynes Alloy No. 25)
4O
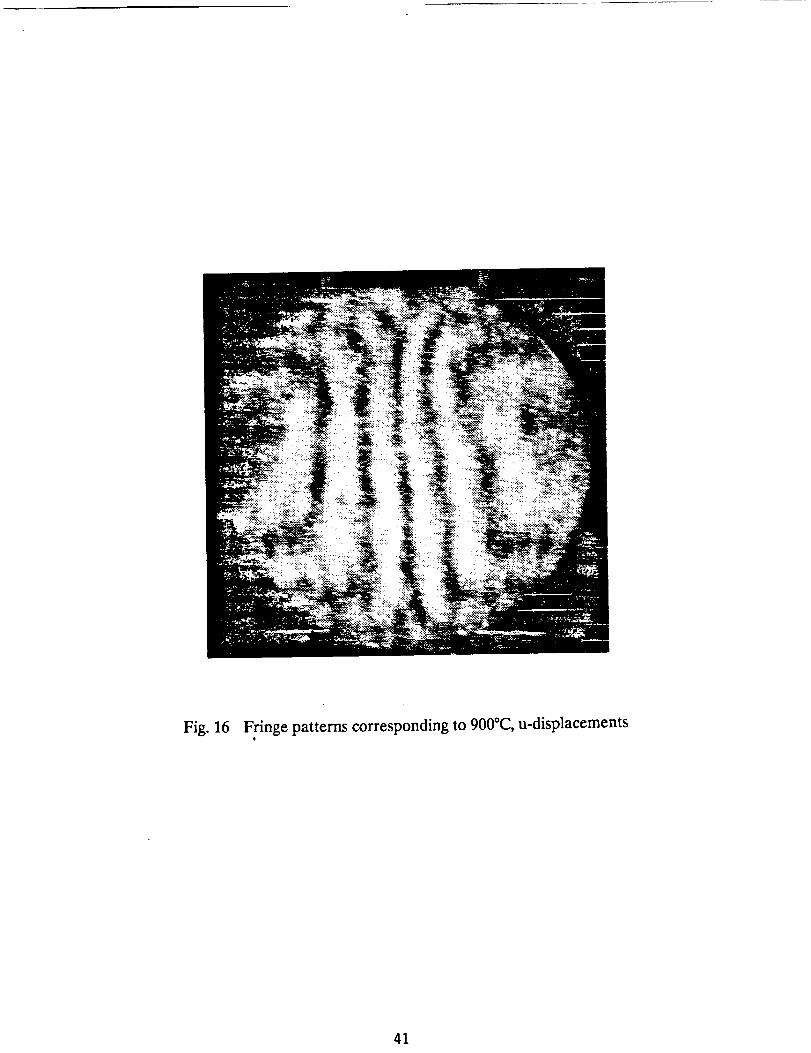
Fig. 16 Fringe patterns corresponding to 900°C, u-displacements
41
500
450
400
3504
¢-.
aoo-
250'
:E 200'
150'
1oo:
50"
00
= Gage 4* Optical
! •
100 20O
Temperature (C)
300
Fig. 17 Comparison of the strain gage and optically measured strains as a function
of the temperature horizontal diameter, gage 4 (horizontal direction)
42
- 800
- 750
- 700
- 650
- 600I=:
- sso- 500
-_ - 450
- 400
- 350 '
- 300'
- 250 _'
•, Gage 3• Optical
i
- 200 , ,0 100 200 300
Temperature (C)
Fig. 18 Comparison of the strain gage and the optically measured strains,
horizontal diameter gage 3 (vertical direction)
43
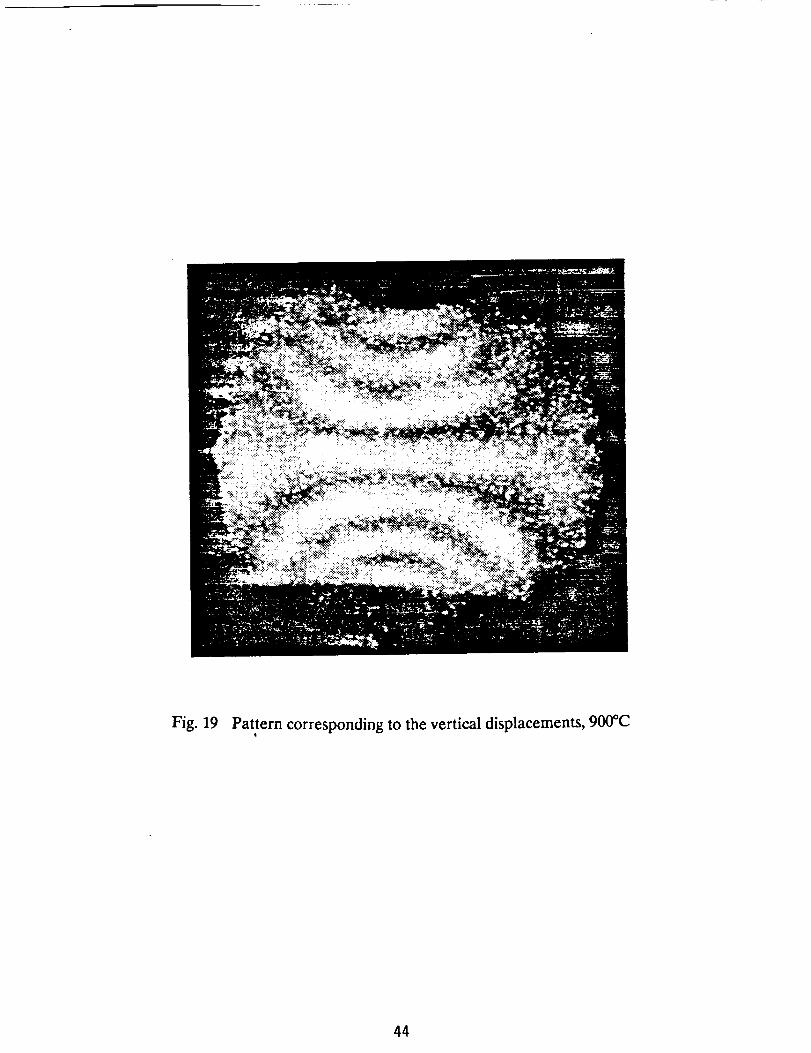
Fig. 19 Pattern corresponding to the vertical displacements, 900"C
44
DISPLACEMENT CONTOUR (MICROMETER)
Fig. 20 Displacement contours corresponding to the average of 40 patterns
45
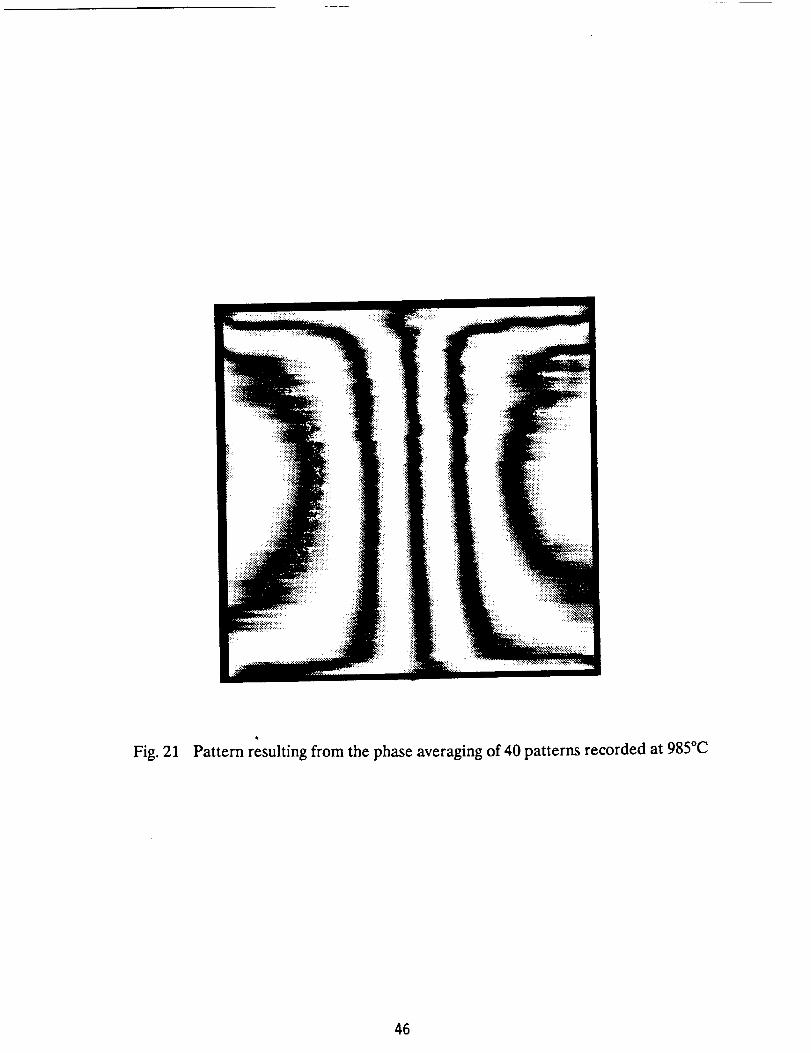
Fig. 21 Pattern resulting from the phase averaging of 40 patterns recorded at 985°C
46
STRAIN CONTOUR (MICROS/RAIN)
12.77 12.77
o- °2)))))i///Ii//1o-o--6.38 " -8.38
X-POSmON (MU)
Fig. 22 Strain contours corresponding to the pattern of Fig. 21
47
100
80
60'
_ 4o
2O
Initial load = 1.744 kN Elastic Modulus = 186.3 GPaFinal load = 5.231 kN Temperature = 985 C
• Experiment,, Theory
• ! • s " I • | " !
-30 -20 -10 0 10 20 30
Position along the horizontal disk diameter (ram)
Fig. 23 Comparison of theoretical and experimental results along the horizontal
diameter (values correspond to Fig. 22). Load 5.23 kN, T 985°C
48
APPENDIX
49
MEASUREMENT OF STRAINS AT HIGH TEMPERATURES
BY MEANS OF A PORTABLE HOLOGRAPHIC MOIRE CAMERA
C.A. SciammareUa, G. Bhat and Y. Shao
Illinois Institute of Technology
Department of Mechanical and Aerospace Engineering
Chicago, IL 60616
ABSTRACT
Electronic holographic moire is utilized to measure strains at temperatures up
to 1000°C. A cw laser operating at 50 mW and at the wavelength of 632.8 nm is
used to illuminate the objects under study. The main variables influencing the
fringe patterns visibility are discussed and measurements are performed to obtain
the values of these variables in the performed experiments. The coefficient of
expansion of an alloy is measured at temperatures ranging from 797°C to 986°C.
Excellent agreement is found between the measured values and those provided bythe manufacturer.
Proceedings of SEM, Hostile Environments and High Temperature
Measurements, Nov.6-8, 1989, Kansas City, Missouri.
5O
MEASUERMENT OF STRAINS AT HIGH TEMPERATURES
BY MEANS OF ELECTRO-OPTICS HOLOGRAPHY
Cesar A. Sciammarella, G. Bhat and Jeffrey Vaitekunas
Illinois Institute of Technology
Department of Mechanical and Aerospace Engineering
Chicago, IL 60616
ABSTRACT
Electro-optics holographic-moire interferometry is used to measure strains at
temperatures up to 1000°C. A description of the instrumentation developed to carry
out the measurements is given. The data processing technique is also explained.
Main problems encountered in recording patterns at high temperatures are
analyzed and possible solutions are outlined. Optical results are compared with
strain gage values obtained with instrumented specimens and with theoretical
results. Very good agreement is found between optical, strain gage and theoretical
results.
Proceedings of the 199I SEM Spring Conference on Experimental Mechanics,
June 10-13, Milwaukee, Wisconsin.
51s
APPLICATION OF ELECTRO-OPTICAL HOLOGRAPHY TO THE
MEASUREMENT OF STRAINS AT HIGH TEMPERATURES
Cesar A. Sciammarella, G. Bhat and Donald R. Matthys
Illinois Institute of Technology
Department of Mechanical and Aerospace Engineering
Chicago, IL 60616
ABSTRACT
The measurement of strains at temperatures of the order of 1000*C has
become a very important field of research. Technological advances in areas such as
the analysis of high speed aircraft structures and high efficiency thermal engines
require operational temperatures of this order of magnitude. Current techniques
for the measurement of strains such as electrical strain gages, are at the limit of
their useful range and new methods need to be developed. Optical techniques are
very attractive in this type of application because of their noncontacting nature.
Holography is of particular interest because a minimal preparation of the surfaces is
required. Opto-electronics holography is specially suited for this type of application,
from the point of view of industrial use. There are a number of technical problems
that is necessary to overcome to measure strains using holographic interferometry at
high temperatures. This paper discuss and gives solutions to some of these
problems. A specimen instrumented with high temperature strains gages is used to
compare the results of both technologies.
To be presented at the SPIE International Symposium on Optical Applied
Science and Engineering, July 19-24, 1992, San Diego, California.
52
PUBLICATIONS
[1] Sciammarella, C.A., Bhat, G. and Shao, Y., "Measurement Of Strains At High
Temperatures by Means of a Portable Holographic Moire Camera," SEM, Hostile
Environments and High Temperature Measurements, Nov. 6-8, 1989, Kansas City,
Missouri.
[2] Sciammarella, C.A., Bhat, G. and Vaitekunas, J., "Measurement of Strains at
High Temperatures by Means of Electro-Optics Holography," Proceedings of the
1991 SEM Spring Conf. on Experimental Mechanics, June 10-13, 1991, Milwaukee,
Wisconsin.
[3] Sciammarella, C.A., Bhat, G. and Matthys, D., "Application of Electro-Optical
Holography to the Measurement of Strains at High Temperatures," to be presented
at the SPIE International Symposium on Optical Applied Science and Engineering,
July 19-24, 1992, San Diego, California.
53
. ] . • k