
Thermal Fluid Analysis of the Fill and Drain … Aeronautics and Space Administration Dryden Flight...
21
National Aeronautics and Space Administration NASA Technical Memorandum 104273 Thermal–Fluid Analysis of the Fill and Drain Operations of a Cryogenic Fuel Tank Craig A. Stephens, Gregory J. Hanna, and Leslie Gong December 1993
Transcript of Thermal Fluid Analysis of the Fill and Drain … Aeronautics and Space Administration Dryden Flight...
National Aeronautics andSpace Administration
NASA Technical Memorandum 104273
Thermal–Fluid Analysis of the Fill and Drain Operations of a Cryogenic Fuel Tank
Craig A. Stephens, Gregory J. Hanna, and Leslie Gong
December 1993
National Aeronautics andSpace Administration
Dryden Flight Research FacilityEdwards, California 93523-0273
1993
NASA Technical Memorandum 104273
Thermal–Fluid Analysis of the Fill and Drain Operations of a Cryogenic Fuel Tank
Craig A. StephensPRC Inc.Edwards, California
Gregory J. HannaHanna Technology ResourcesBoulder, Colorado
Leslie GongNASA Dryden Flight Research Facility Edwards, California

ABSTRACT
The Generic Research Cryogenic Tank was designed to establish techniques for testing and analyzingthe behavior of reusable fuel tank structures subjected to cryogenic fuels and aerodynamic heating. TheGeneric Research Cryogenic Tank tests will consist of filling a pressure vessel to a prescribed fill level,waiting for steady-state conditions, then draining the liquid while heating the external surface to simulatethe thermal environment associated with hypersonic flight. Initial tests of the Generic Research CryogenicTank will use liquid nitrogen with future tests requiring liquid hydrogen. Two-dimensional finite-difference thermal–fluid models were developed for analyzing the behavior of the Generic Research Cryo-genic Tank during fill and drain operations. The development and results of the two-dimensional fill anddrain models, using liquid nitrogen, are provided, along with results and discussion on extrapolating themodel results to the operation of the full-size Generic Research Cryogenic Tank. These numerical modelsprovided a means to predict the behavior of the Generic Research Cryogenic Tank during testing and todefine the requirements for the Generic Research Cryogenic Tank support systems such as vent, drain,pressurization, and instrumentation systems. In addition, the fill model provided insight into the unex-pected role of circumferential conduction in cooling the Generic Research Cryogenic Tank pressure vesselduring fill operations.
NOMENCLATURE
DFRF Dryden Flight Research Facility, Edwards, CA
FILLDRAN FLUINT submodel in NONEQFIL and NONEQDRN
FLUINT FLUid INTegrator
GRCT Generic Research Cryogenic Tank
LHSTF Liquid Hydrogen Structural Test Facility, Edwards, CA
NONEQDRN nonequilibrium drain model
NONEQFIL nonequilibrium fill model
SINDA'85 Systems Improved Numerical Differencing Analyzer
TWODIM SINDA'85 submodel in NONEQFIL and NONEQDRN
2-D two-dimensional
INTRODUCTION
In 1988, a program was initiated by the Aerostructures Branch of NASA Dryden Flight Research Fa-cility (DFRF) to develop the test capability to subject reusable primary structures for transatmospheric ve-hicles to combined loading and heating in the presence of cryogenic fuels such as liquid hydrogen. Testingreusable primary structures, such as transatmospheric vehicle fuel tanks, has been the subject of past ex-perimental programs [1-4] because of the impact the fuel tank has on the flight-vehicle airframe and pro-pulsion concepts.
The short-term goals of the DFRF program were to design, fabricate, and instrument a cryogenic tankto serve as a test article for analytical code evaluation and test technique development. The long-term goal

was to develop the Liquid Hydrogen Structural Test Facility (LHSTF) to test full-scale and subscale flightvehicle components in simultaneous cryogenic and high-temperature environments combined with me-chanical loads. The cryogenic tank will be tested with liquid nitrogen in the Thermostructural Laboratoryand will eventually be tested with liquid hydrogen in the LHSTF.
In 1989, PRC Inc. was tasked to design a cryogenic tank, called the Generic Research Cryogenic Tank(GRCT), per DFRF requirements. As a research tank, the GRCT was to qualitatively simulate the thermalresponse of a transatmospheric vehicle fuel tank exposed to the environment of hypersonic flight. Theobjectives required by NASA for the GRCT included
(1) Develop test and operational procedures which will be applied to future test support of flight-weight fuel tanks.
(2) Develop thermal–fluid and structural analysis models that predict the behavior of cryogenic fueltanks exposed to the environment of hypersonic flight.
(3) Obtain experimental data on the behavior of cryogenic fuel tanks subjected to hypersonic flightconditions for comparison to analytical predictions.
(4) Test and develop instrumentation which will provide accurate and continuous measurements oftemperature, pressure, strain, heat flux, and liquid level for future cryogenic test structures.
(5) Provide a test bed to examine the performance of different insulation systems proposed fortransatmospheric-vehicle fuel tanks.
(6) Allow for the possible examination of the effects of slosh dynamics when coupled with the aero-dynamic heating of cryogenic fuel tanks due to hypersonic flight.
Several numerical models which simulate the behavior of the GRCT were created to support the de-sign, research, and testing of the GRCT [5,6] such as defining subsystem and test requirements. This pa-per reviews recent efforts to develop two-dimensional (2-D) thermal–fluid models that provideperformance predictions for the fill and the combined heating and draining test scenarios for the GRCT.In addition, extrapolation of the 2-D model results to predict the requirements of the full-scale GRCT arepresented.
THE GENERIC RESEARCH CRYOGENIC TANK DESIGN
Figure 1 shows the GRCT suspended below a steel support structure, without the piping and heatlamps required for testing. The GRCT support structure was composed of carbon steel I-beams and was7.3-m (24-ft) long, 3.6-m (12-ft) high, and 3.6-m (12-ft) wide. In addition, Figure 1 shows the heat shieldlocations and the fibrous insulation surrounding the stainless-steel pressure vessel. The requirements forthe GRCT design were to
• keep construction simple, using inexpensive, well characterized, and available materials
• size the pressure vessel to minimize scale effects when extrapolating to larger test articles
• provide for liquid nitrogen and liquid hydrogen testing
• provide the capability for longitudinal and circumferential nonuniform heating up to 1089 K(1960 °R)
2
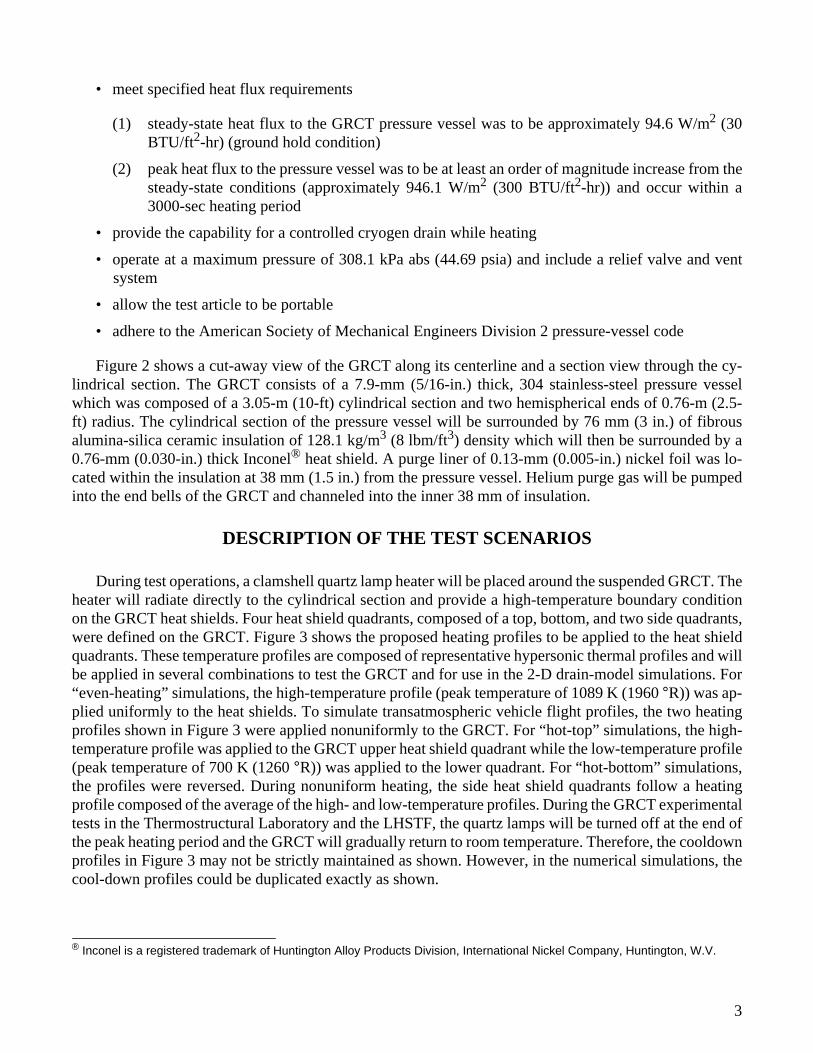
• meet specified heat flux requirements
(1) steady-state heat flux to the GRCT pressure vessel was to be approximately 94.6 W/m2 (30BTU/ft2-hr) (ground hold condition)
(2) peak heat flux to the pressure vessel was to be at least an order of magnitude increase from thesteady-state conditions (approximately 946.1 W/m2 (300 BTU/ft2-hr)) and occur within a3000-sec heating period
• provide the capability for a controlled cryogen drain while heating
• operate at a maximum pressure of 308.1 kPa abs (44.69 psia) and include a relief valve and ventsystem
• allow the test article to be portable
• adhere to the American Society of Mechanical Engineers Division 2 pressure-vessel code
Figure 2 shows a cut-away view of the GRCT along its centerline and a section view through the cy-lindrical section. The GRCT consists of a 7.9-mm (5/16-in.) thick, 304 stainless-steel pressure vesselwhich was composed of a 3.05-m (10-ft) cylindrical section and two hemispherical ends of 0.76-m (2.5-ft) radius. The cylindrical section of the pressure vessel will be surrounded by 76 mm (3 in.) of fibrousalumina-silica ceramic insulation of 128.1 kg/m3 (8 lbm/ft3) density which will then be surrounded by a0.76-mm (0.030-in.) thick Inconel® heat shield. A purge liner of 0.13-mm (0.005-in.) nickel foil was lo-cated within the insulation at 38 mm (1.5 in.) from the pressure vessel. Helium purge gas will be pumpedinto the end bells of the GRCT and channeled into the inner 38 mm of insulation.
DESCRIPTION OF THE TEST SCENARIOS
During test operations, a clamshell quartz lamp heater will be placed around the suspended GRCT. Theheater will radiate directly to the cylindrical section and provide a high-temperature boundary conditionon the GRCT heat shields. Four heat shield quadrants, composed of a top, bottom, and two side quadrants,were defined on the GRCT. Figure 3 shows the proposed heating profiles to be applied to the heat shieldquadrants. These temperature profiles are composed of representative hypersonic thermal profiles and willbe applied in several combinations to test the GRCT and for use in the 2-D drain-model simulations. For“even-heating” simulations, the high-temperature profile (peak temperature of 1089 K (1960 °R)) was ap-plied uniformly to the heat shields. To simulate transatmospheric vehicle flight profiles, the two heatingprofiles shown in Figure 3 were applied nonuniformly to the GRCT. For “hot-top” simulations, the high-temperature profile was applied to the GRCT upper heat shield quadrant while the low-temperature profile(peak temperature of 700 K (1260 °R)) was applied to the lower quadrant. For “hot-bottom” simulations,the profiles were reversed. During nonuniform heating, the side heat shield quadrants follow a heatingprofile composed of the average of the high- and low-temperature profiles. During the GRCT experimentaltests in the Thermostructural Laboratory and the LHSTF, the quartz lamps will be turned off at the end ofthe peak heating period and the GRCT will gradually return to room temperature. Therefore, the cooldownprofiles in Figure 3 may not be strictly maintained as shown. However, in the numerical simulations, thecool-down profiles could be duplicated exactly as shown.
® Inconel is a registered trademark of Huntington Alloy Products Division, International Nickel Company, Huntington, W.V.
3

The thermal–fluid models were used to evaluate proposed GRCT test scenarios to predict the behav-ior of the GRCT, identify unexpected issues, and provide data to size support systems. The GRCT fillprocedure consists of a cooling stage and a fill stage. During cooldown, the GRCT pressure vessel (andfill–drain system) will be taken from room temperature to the cryogen saturation temperature. At the sat-uration temperature, liquid can be maintained in the vessel and the fill stage can be initiated. During thefill stage, an active control method will be used to control the liquid flow rate into the pressure vessel.The active fill control will monitor the temperature gradients being generated in the vessel wall and theamount of boiloff generated to ensure the integrity of the vessel will not be compromised. Once the liquidreaches the desired fill level, the fill control will be turned off and a ground hold will be entered until thedesired steady-state conditions are obtained. Some of the issues associated with the GRCT fill processwhich the thermal–fluid models answered were
(1) What are the circumferential temperature gradients in the pressure-vessel wall associated witha moving liquid interface?
(2) How much liquid cryogen must be made available to cool and fill the pressure vessel to a pre-scribed fill level?
(3) What will be the boiloff rate for the vent system?
(4) Once filled to a prescribed level, how long will it take for the GRCT to reach steady-state con-ditions?
A nonequilibrium fill model (NONEQFIL) of the GRCT was designed to address the previous ques-tions and to simulate various GRCT fill scenarios.
After the GRCT is full of cryogen and steady-state conditions have been reached, the draining andheating tests can be initiated. The procedure for a drain test consists of closing the GRCT vents, pressur-izing the vessel to eliminate boiling, starting the drain and heating profiles, ending the drain profile at lowfill level, and opening the vent to boil away the remaining liquid in the vessel. An active control systemwill maintain constant pressure while draining the vessel. Pressurized fluid transfer or pump-assisted flu-id transfer have been the two proposed methods to remove liquid from the pressure vessel. For eithermethod, self-pressurization or an independent pressurization system have been identified as the twomethods for providing the pressure needed to drain the vessel. Scheduling the start of the heating and thedrain profiles will affect the degree of self-pressurization, the peak temperatures, and the maximum tem-perature gradients that will result in the vessel wall. Some of the issues associated with the GRCT drainprocess were
(1) How much pressurant is required to run prescribed drain profiles? Is self-pressurization possi-ble?
(2) What will the ullage (the unfilled portion of the vessel) pressure be during the drain process?
(3) What are the circumferential temperature gradients in the pressure-vessel wall associated witha moving liquid interface?
(4) What are the effects of the heating and drain scheduling on the response of the GRCT?
(5) If heating the GRCT, will the liquid cryogen absorb enough heat to raise the bulk liquid temper-ature enough to induce boiling?
4
A nonequilibrium drain model (NONEQDRN) of the GRCT was designed to address the previousquestions and to simulate the GRCT combined drain and heating scenarios.
DESCRIPTION OF THE FILL AND DRAIN MODELS
The GRCT 2-D thermal–fluid models provided detailed design guidance and a way to predict the be-havior of the GRCT under various test conditions. Figure 4 shows the pressure-vessel node and lump lay-out for the NONEQFIL and the NONEQDRN models. In both models, the GRCT was modeled as a 0.3-m(1-ft) wide portion of the cylindrical-vessel section divided in half along the vertical axis. The fluid insidethe pressure vessel was modeled by two fluid regions (or lumps), one for liquid and one for vapor. Thepressure-vessel wall was modeled by 12 wall sections (or nodes) spaced at 15°-intervals.
The 2-D thermal models of the GRCT were created using the Systems Improved Numerical Differenc-ing Analyzer and Fluid Integrator (SINDA‘85/FLUINT) [7]. These thermal models were developed tosimulate the flow of heat from the heat shield, through the insulation and pressure vessel, to either liquidhydrogen or liquid nitrogen contained in the vessel. The SINDA'85/FLUINT code uses a finite-differencesolution method to analyze thermal–fluid systems. SINDA'85/FLUINT is composed of two analysiscodes, one code for modeling thermal systems (SINDA'85) and one code for modeling flow systems(FLUINT), which can be run separately or together. The NONEQFIL and NONEQDRN models werecomposed of two submodels that simulated the thermal and fluid characteristics of the GRCT. The thermalcharacteristics of the pressure-vessel wall, insulation, and heat shield are simulated in the TWODIM sub-model which requires the use of the SINDA'85. The fluid characteristics of the vapor and liquid within thepressure vessel are simulated in the FILLDRAN submodel which requires the use of FLUINT.
Pressure Vessel Fill Simulation Using NONEQFIL
The NONEQFIL model was designed to simulate the GRCT beginning warm, dry, and empty, fol-lowed by cooling and filling the vessel with a variable flow rate of liquid nitrogen. As NONEQFIL simu-lates the fill process, the FILLDRAN submodel determines which tank-wall sections are submerged inliquid, which sections are exposed to vapor, and which section is at the liquid–vapor interface. Dependingon the fluid in contact with the vessel, appropriate wall-to-fluid heat-transfer coefficients were assigned toaccount for either vapor- or liquid-free convection or liquid boiling. Heat-transfer coefficients for liquid-and vapor-free convection were calculated using the Nusselt equation [8], and boiling heat-transfer coef-ficients were determined from the Kutateladze correlation [9]. Boiloff flow originated in the liquid andtraveled upward through the vapor and into a vent plenum. A connector was defined between the liquidand vapor regions which allowed a calculated mass flow of boiloff to be vented from the model at a ratedetermined by dividing the total heat input to the liquid region by the heat of vaporization for nitrogen.
Vessel fill rates were set by controlling the volume of fluid incrementally added during each time step.Two different fill-control algorithms were created to simulate the fill process. The first algorithm, calledboiloff control, added liquid to the GRCT based on the boiloff rate. The boiloff control mechanism wasequivalent to a constant heat-transfer rate from the wall to the incoming fluid. If the boiloff rate was abovea prescribed set point, no fluid was added during the time step and conversely, if the boiloff rate was lessthan or equal to the set point, then an incremental amount of fluid was added to the liquid lump. The secondfill control algorithm, called rate control, began adding fluid to the vessel at a constant slow rate and thenchanged to a linearly increasing rate until a maximum constant rate was reached.
5
In the NONEQFIL model, the adjustable model parameters were the method of fill control, the fillrate, the vapor heat-transfer coefficient, and the allowable boiloff rate. NONEQFIL predicted fill timesand profiles, boiloff rates, and temperature gradients around the vessel wall and through the insulation.Heat fluxes and total heat inputs to the fluid were also available as results.
Pressure Vessel Drain Simulation With Heat Using NONEQDRN
The NONEQDRN model was designed to simulate the GRCT at a constant fill level and steady-stateconditions, followed by a transient drain of the pressure vessel subjected to external heating. After theGRCT equilibrated at a constant fill level, several steps were required to drain the vessel. First, pressurantgas was introduced into the ullage at a fixed rate to increase the vessel pressure and suppress boiling bysubcooling the liquid. The vessel pressure was allowed to increase until a prescribed pressure differencebetween the vessel and the pressurant source was reached (currently 6.89 kPa (1 psi)) and draining wasinitiated. The vessel was drained by a volumetric flow connector which allowed a prescribed liquid massto be removed during each time step. The pressurant flow rate was varied to maintain constant pressureas the liquid level dropped. The bulk liquid temperature was monitored to determine if boiling would beinitiated when the liquid reached the saturation temperature for the prescribed drain pressure. Heatingprofiles (Fig. 3) could be impressed on the heat-shield boundary nodes as a function of time before, dur-ing, or after the draining process was initiated.
In the NONEQDRN model, the adjustable model parameters were the initial fill level, drain pressure,rate of pressurization, drain rate, heating profile applied to the heat shields, and internal wall-to-fluid heattransfer coefficients. NONEQDRN predicted pressurization rates, wall-temperature gradients, insulationtemperatures, and drain profiles. Heat fluxes and total heat inputs to the fluid were also available as re-sults.
ANALYSIS OF TEST SCENARIOS
The simulation of numerous fill and drain scenarios are available using the NONEQFIL and NON-EQDRN models. The following scenarios represent the capabilities of the two models.
Seventy-Five-Percent Fill Simulation Using NONEQFIL
The NONEQFIL model was developed to investigate cooldown and fill profiles. A characteristicmeasure of these processes was the pressure-vessel wall temperatures and boiloff rate. The following re-sults refer to a 75-percent fill of the GRCT using liquid nitrogen. The vessel started at room temperature294 K (530 °R) as liquid nitrogen at 137.9 kPa abs (20 psia) pressure and 80 K (144 °R) was introducedinto the vessel. The boiloff fill-control algorithm was used in this example and the allowable boiloff ratewas set at 9.07 kg/hr (20 lbm/hr).
Figure 5 shows the pressure-vessel temperature at prescribed wall positions while filling the GRCTto 75 percent. The temperature response for each wall location followed a three-step behavior. First, wallcooling was accomplished through vapor-free convection heat transfer as shown by the initial sloped linefor node 900 (0 to 1.4 hr). As the liquid interface contacted the node adjacent to node 900, circumferentialconduction within the vessel wall coupled with vapor-free convection caused the node 900 temperature
6

to drop more rapidly (1.4 to 1.7 hr). As the liquid front reached node 900, boiling heat transfer caused thenode 900 temperature to “plunge” toward the liquid nitrogen saturation temperature (1.7 to 2.2 hr). Thisbehavior was observed for all wall locations in every fill run, regardless of fill rate, vapor heat-transfercoefficient, or fill-control method. The fill time was estimated from the curves in Figure 5; the final filllevel of 75 percent required a cooldown and fill time of approximately 4 hr. The wall sections in the ullageregion were always in contact with vapor and their temperatures continued to decline slowly (shown bynode 300). One of the unexpected issues discovered by the NONEQFIL model was that circumferentialconduction had no influence on the wall temperatures until the liquid front was within 20.3 cm (8 in.) ofa node.
Figure 6 shows the total nitrogen added and the amount of stored liquid (equivalent to fill level) versustime. The difference between the two curves corresponds to the amount of boiloff produced during eachtime step. The total nitrogen added provides an estimate of the amount of nitrogen required to fill theGRCT to the prescribed level. This quantity accounted for filling the GRCT pressure vessel and did notinclude the amount of nitrogen required to cool the fill–drain subsystem attached to the GRCT. More than1 hr was needed to accumulate significant quantities of liquid in the GRCT because of the time requiredto cool the bottom of the pressure vessel to the liquid saturation temperature. The nitrogen flow rate intothe GRCT is the slope of the upper curve in Figure 6.
Vapor heat-transfer effects on the wall cooling process were evaluated (Fig. 7) by running two caseswith vapor heat-transfer coefficients of 5.7 and 22.7 W/m2 K (1 and 4 BTU/ft2-hr-°R). In Figure 7, thetemperature histories for the upper wall section (node 100) and the vapor region were examined. The re-sults showed that wall cooling was significantly influenced by vapor heat transfer, and hand calculationsverified that vapor heat transfer was the primary mechanism of wall cooling until the liquid front was with-in 20.3 cm (8 in.) of a node. Raising the vapor heat-transfer coefficient lowers the wall-to-vapor tempera-ture difference and speeds up wall cooling, thus reducing the amount of nitrogen required for cooling. Theeffects were large enough that calculated heat-transfer coefficients could be verified from future GRCTexperimental data. At the end of the fill process (3.5 to 4 hr), the vapor temperature increases because thedesired fill level has been reached, which causes the fill level to remain stationary and the volume ofboiloff to be reduced. The reduced amount of cool boiloff gas entering the ullage causes the vapor tem-perature to increase.
Seventy-Five-Percent Drain Simulation Using NONEQDRN
For the drain test case, the GRCT was 75-percent full of liquid nitrogen and at steady-state conditionsbefore initiating a 45-min drain. Before draining, the GRCT vessel was pressurized from 137.9 kPa abs(20 psia) to 179.2 kPa abs (26 psia) by injecting warm nitrogen pressurant gas (at 294 K (530 °R)) into theullage. A hot-bottom heating profile was started at 0.0 hr and the drain profile was initiated when the vesselhad been pressurized to 179.2 kPa (26 psia) which required 0.6 hr. The vapor heat-transfer coefficient wasset to 22.7 W/m2 K (4 BTU/ft2-hr-°R).
Figure 8 shows temperature versus time for two wall sections as well as the vapor and liquid regionsduring a 75-percent fill–45-min drain simulation. The uppermost section (node 100) was exposed to vaporduring the entire run while a lower section (node 900) was in contact with liquid nitrogen until 1.2 hr, whenthe liquid interface passed and the section was exposed to vapor. In general, the vapor temperature wasless than the wall temperature as the vessel was pressurized. However, when draining was initiated at 0.6hr, the vapor temperature increased because of a large amount of warm pressurant gas being injected into
7
the vessel to maintain constant pressure while draining. The temperature of node 100 became greater thanthe vapor temperature at 0.8 hr because of the effects of the applied heating profile reaching the pressurevessel. As the vessel was drained, the temperature difference between node 900 and the liquid increaseddue to the effects of liquid-free convection heat transfer and the applied heating profile. As the liquid in-terface passed node 900, the wall section was exposed to vapor which decreased the wall-to-fluid heattransfer and caused the wall temperature to increase. Once subcooled, the bulk temperature of the liquidnitrogen did not increase to the saturation temperature corresponding to the vessel pressure, thus prevent-ing boiling from occurring while draining.
Figure 9 is the time history of the vessel pressure and the pressurant flow rate into the vessel. Asshown, the vessel pressure increased from 137.9 kPa (20 psia) to approximately 179.2 kPa (26 psia) with-in 0.6 hr. During this time, the pressurant flow rate into the vessel was relatively small. The drain processwas initiated after 0.6 hr, which caused a slight drop in pressure and a large increase in the pressurant flowrate. The increase in the pressurant flow rate was required to maintain constant pressure while draining.
Figure 10 shows the heat input to the vapor and liquid regions of the pressure vessel as a function oftime. As soon as warm pressurant gas was added to the vessel (0 hr), the wall-to-liquid heat transferchanged from boiling to free convection and the vapor temperature increased, so there was an initial dropin the liquid and vapor heat input. The rapid increase in the wall-to-liquid heat input, before draining(0.6 hr), was caused by the effects of the applied heating profile reaching the pressure vessel. When drain-ing began at 0.6 hr, the wall-to-vapor heat input became negative as the receding liquid interface exposedsections of the cold vessel wall to the warm vapor region. As draining progressed, the total wall-to-liquidheat input decreased because the volume of liquid in the vessel decreased.
APPLICATION OF THE TWO-DIMENSIONAL MODEL RESULTS
The fill and drain models were developed to predict the behavior of the GRCT under various test con-ditions and to define the GRCT subsystem requirements. Of particular interest was extrapolating the 2-Dmodel results to represent the requirements of the entire GRCT, which could then be used to size theGRCT subsystems. Two factors, one for volume and one for area, were required to extrapolate the 2-Dmodel results to the entire GRCT. Filling was a volume-dependent phenomenon, but cooling and boiloffwere area-dependent. The volume of the entire GRCT pressure vessel was 7.4 m3 (262 ft3) while the mod-el volume was 0.28 m3 (9.817 ft3), which yielded a volume factor of 26.7. The inner surface area of theGRCT pressure vessel was 21.9 m2 (236 ft2) while the model volume was 0.73 m2 (7.85 ft2), whichyielded an area factor of 30.1.
Fill Process
Table 1 contains an estimate of the maximum and minimum fill rates for a 75-percent and 90-percentfill of the GRCT. The results correspond to a range of parameters and fill-control methods evaluated withNONEQFIL. Clearly, the minimum fill rate could be as slow as the fill system could trickle liquid nitro-gen into the pressure vessel. Likewise, the maximum fill rate was the maximum evaluated by NONEQ-FIL, not necessarily the maximum possible rate. Actual fill rates will be limited either by boiloff flowfrom rapid vaporization or by thermal stress limits in the pressure-vessel wall. The values in Table 1 de-fine a representative range for the GRCT performance which can be further evaluated when actual test
8

conditions are defined. As a point of reference, the 75-percent fill of the GRCT will require 5.3 hr to fillusing the minimum flow rate and 2 hr to fill using the maximum flow rate (Table 1). At 75-percent full,the GRCT holds 4831 kg (10,650 lbm) of liquid nitrogen. The NONEQFIL simulations predicted 5815 kg(12,820 lbm) of liquid nitrogen will be required to fill the GRCT to a 75-percent fill level. This translatesinto 984 kg (2170 lbm) of liquid nitrogen being required to cool the pressure vessel from room temperature(294 K (530 °R)).
The boiloff and venting rates listed in Table 2 are also representative values obtained during NONEQ-FIL runs. Depending on the type of fill-control algorithm, the boiloff was either nearly constant or fluctu-ated considerably during the run. Consequently, the values in Table 2 were not necessarily observed foran entire cooldown–fill run, but they were typical for what might be expected when full-scale testing ofthe GRCT begins. The vent-gas temperature was approximately 167 K (300 °R) when it left the GRCT,but the gas warms as it travels down the vent pipe which causes the volumetric flow rate to increase.
Drain Process
The model results were multiplied by the volume scale factor (26.7) to estimate pressurant require-ments for the entire GRCT (Table 3). The minimum and maximum pressurization times and flow rateswere determined for a representative range of initial fill levels and drain times. All cases were subjectedto the hot-bottom heating conditions and a vapor heat-transfer coefficient of 22.6 W/m2 K (4 BTU/ft2-hr-°R). The vessel was pressurized from 137.9 kPa (20 psia) to 179.2 kPa (26 psia) before draining within a10- to 60-min period. The range of pressurization times was a function of the initial ullage volume; a smallullage required a smaller pressurization time. A wide range of pressurant flow rates was predicted(23 kg/hr (51 lbm/hr) to 187.8 kg/hr (414 lbm/hr)) depending on the drain time. With a direct correlationbetween pressurization flow rates and the prescribed drain times, decreasing the required drain time by afactor of six decreased the pressurant flow rate requirements by a factor of five. The value of the vaporheat-transfer coefficient and the applied heating profile had a slight effect on the pressurant requirements.For a vapor heat-transfer coefficient of 5.7 W/m2 K (1 BTU/ft2-hr-°R) and a hot-bottom simulation, thepressurant requirements of Table 3 were reduced by 10 percent. For a “hot-top” applied heating profile anda vapor heat-transfer coefficient of 22.7 W/m2 K (4 BTU/ft2-hr-°R), the pressurant requirements for Table3 were also reduced by 10 percent.
The insulation system around the pressure vessel delayed the effects of the heat input to the liquid cryo-gen. During the drain simulations, the effects of the applied heating rates on the pressure vessel were de-layed up to 0.5 hr. This thermal delay was affected by the insulation conductivity, density, and thickness.Variations in these parameters changed how quickly the effects of the applied heat load reached the cryo-gen. For transatmospheric vehicle performance, the insulation thermal delay may impact pressurizationand fuel tank heating rates. Pressurization requirements were too large to be met by self-pressurization inall of the drain simulations. Subcooling the liquid cryogen due to pressure increases and the insulationthermal delay did not allow external heating to produce boiloff gas for self-pressurization during draining.
CONCLUDING REMARKS
Two-dimensional finite-difference fill and drain models were developed to simulate the thermal–fluidbehavior of the Generic Research Cryogenic Tank under anticipated test conditions to be conducted at theNASA Dryden Flight Research Facility. The results of the fill and drain models provided insight intodefining future Generic Research Cryogenic Tank subsystems and test requirements. The fill model pre-
9

dicted fill times and profiles, boiloff rates, and temperature gradients in the pressure vessel and insulation.Based on the fill model, the Generic Research Cryogenic Tank will require from 2 to 5.3 hr and 5815 kg(12,820 lbm) of liquid nitrogen to cool down and fill to 75-percent capacity once liquid has reached thepressure vessel. Wall cooling for the fill process was significantly influenced by the degree of vapor heattransfer, with higher vapor heat transfer lowering the wall-to-vapor temperature difference and thereforereducing the cooldown time and liquid cryogen requirements. As an unexpected result, the NONEQFILmodel showed that vapor-free convection and boiling heat transfer were the primary mechanisms forcooling the pressure vessel during the fill process. Circumferential conduction played a minor role incooling the pressure-vessel wall. The drain model predicted pressurization rates, wall and insulation tem-peratures, and drain profiles. From the drain model predictions, the Generic Research Cryogenic Tankwill require from 0.23 to 0.76 hr to pressurize before draining and require from 188 kg/hr (414 lbm/hr) to23 kg/hr (51 lbm/hr) flow rates to meet drain times of 10 to 60 min. The degree of vapor heat transfer andthe applied heating profile had only a slight effect on the pressurant requirements.
Dryden Flight Research FacilityNational Aeronautics and Space AdministrationEdwards, California, December, 1993
REFERENCES
1. Heathman, John H., “Hydrogen Tankage For Hypersonic Cruise Vehicles - Phase I,” Technical Re-port AFFDL-TR-65-230, Air Force Flight Dynamics Laboratory, Wright-Patterson Air Force Base,OH, Aug. 1966.
2. Heathman, John H., et al., “Hydrogen Tankage Application To Manned Aerospace Systems PhasesII & III,” Technical Report AFFDL-TR-68-75, Vol. I Design and Analytical Investigation, and Vol.III, Structural Acceptance and Flight Simulation Testing, Air Force Flight Dynamics Laboratory,Wright-Patterson Air Force Base, OH, Apr. 1968.
3. Yates, G.B., “An Experimental and Analytical Evaluation of the Thermal Behavior of Liquid Hydro-gen in a Tank Designed and Insulated for Use in a Hypersonic Vehicle,” Advances in CryogenicEngineering, Vol. 12, Proceedings of the 1966 Cryogenic Engineering Conference, June 13–15,1966, K.D. Timmerhaus, ed., Plenum Press, New York, pp. 132–145, 1967.
4. Urie, David M. and Roug, George P., “Zero Length Launch Trans Atmospheric Vehicle (ZEL TAV)Structural Technology Validation Program - Final Report,” U.S.A.F. Contract F18600-86-C-4000,Lockheed Aeronautical Systems Co., July 1988.
5. Stephens, Craig A. and Hanna, Gregory J., “Thermal Modeling and Analysis of a Cryogenic TankDesign Exposed to Extreme Heating Profiles,” AIAA 91-1383, AIAA 26th Thermophysics Confer-ence, Honolulu, HI, June 1991. Also published as NASA CR-186012, 1991.
6. Hanna, Gregory J. and Stephens, Craig A., “Predicted Thermal Response of a Cryogenic Fuel TankExposed to Simulated Aerodynamic Heating Profiles With Different Cryogens and Fill Levels,”
10

AIAA 91-4007, AIAA Session of the ASME/AICHE National Heat Transfer Conference, Minneap-olis, MN, July, 1991. Also published as NASA CR 4395, 1991.
7. Cullimore, B.A., Goble, R.G., Jensen, C.L., and Ring, S.G., “SINDA'85/FLUINT Systems ImprovedNumerical Differencing Analyzer and Fluid Integrator Version 2.3,” Cosmic Program #MSC-21774,Contract NAS9-17448, MCR-90-512, Revision 4, Mar. 1990.
8. Perry, Robert H. and Chilton, Cecil H., eds., Chemical Engineers' Handbook, 5th edition, Chapter 10,McGraw Hill, New York, NY, 1973.
9. Brentari, E.G., Giarratano, P.J., and Smith, R.V., “Boiling Heat Transfer for Oxygen, Nitrogen,Hydrogen, and Helium,” National Bureau Of Standards Technical Note 317, U. S. Government Print-ing Office, Washington, D.C., Sept. 20, 1965.
11
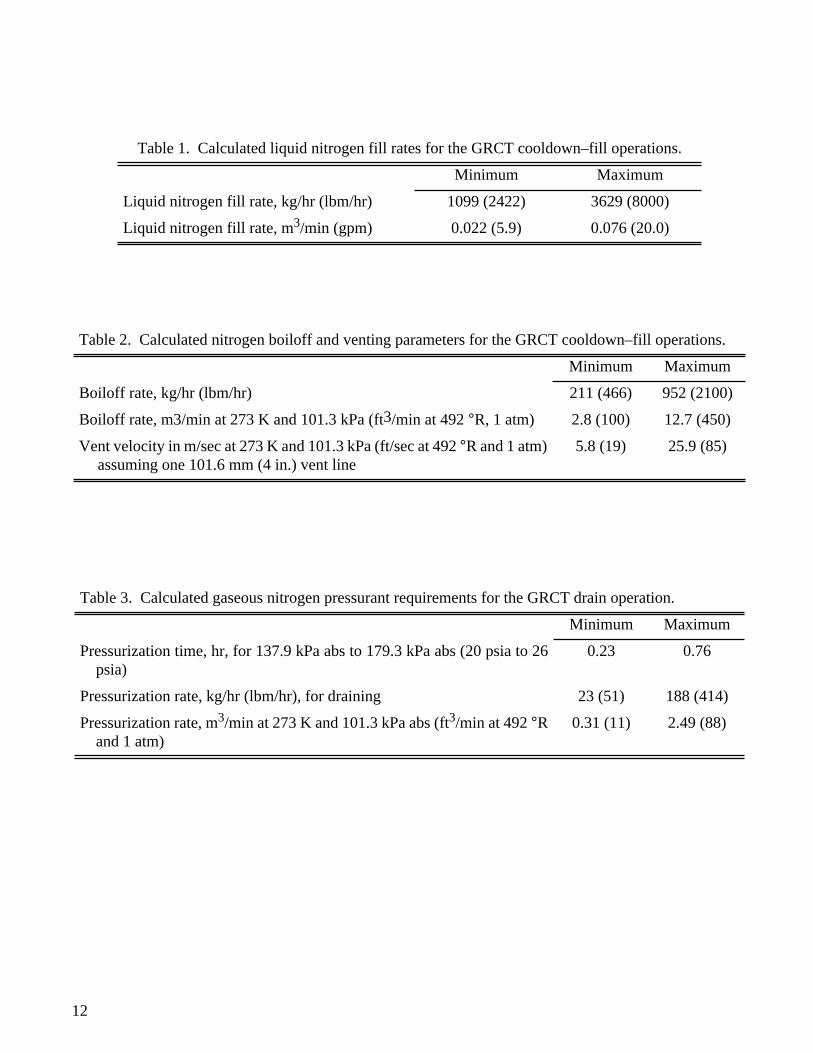
Table 1. Calculated liquid nitrogen fill rates for the GRCT cooldown–fill operations.
Minimum Maximum
Liquid nitrogen fill rate, kg/hr (lbm/hr) 1099 (2422) 3629 (8000)
Liquid nitrogen fill rate, m3/min (gpm) 0.022 (5.9) 0.076 (20.0)
Table 2. Calculated nitrogen boiloff and venting parameters for the GRCT cooldown–fill operations.
Minimum Maximum
Boiloff rate, kg/hr (lbm/hr) 211 (466) 952 (2100)
Boiloff rate, m3/min at 273 K and 101.3 kPa (ft3/min at 492 °R, 1 atm) 2.8 (100) 12.7 (450)
Vent velocity in m/sec at 273 K and 101.3 kPa (ft/sec at 492 °R and 1 atm)assuming one 101.6 mm (4 in.) vent line
5.8 (19) 25.9 (85)
Table 3. Calculated gaseous nitrogen pressurant requirements for the GRCT drain operation.
Minimum Maximum
Pressurization time, hr, for 137.9 kPa abs to 179.3 kPa abs (20 psia to 26psia)
0.23 0.76
Pressurization rate, kg/hr (lbm/hr), for draining 23 (51) 188 (414)
Pressurization rate, m3/min at 273 K and 101.3 kPa abs (ft3/min at 492 °Rand 1 atm)
0.31 (11) 2.49 (88)
12
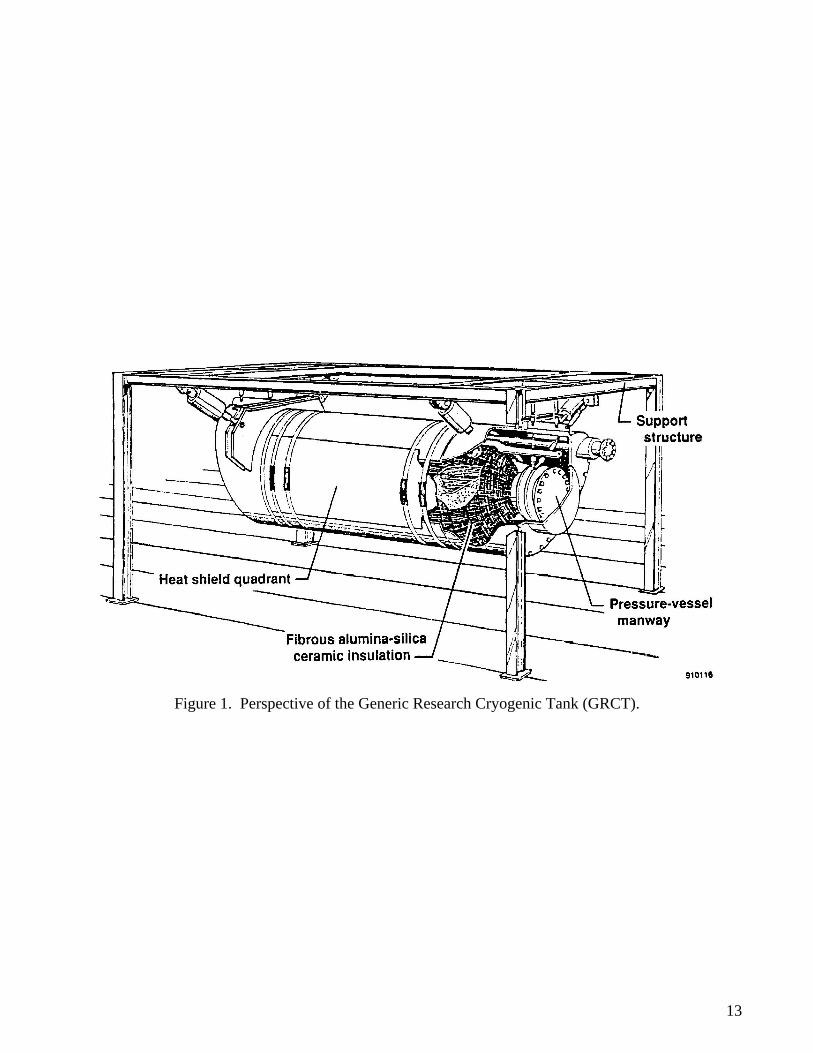
Figure 1. Perspective of the Generic Research Cryogenic Tank (GRCT).
13

Figure 2. Cut-away and section view of the GRCT
930290
Section A-A
Heat shield
Insulation
Purge jacket
Pressure-vessel wall
AAlumina-silica fibrous insulation blankets
0.05-m fill/drain line
0.1-m vent line
A0.5-m manway 0.5-m manway
0.1-m vent line
Vapor cryogen
Liquid cryogen
4.6 m
1.5 m
14

Figure 3. Proposed heating profiles as a function of time to be applied to the GRCT heat shields.
Figure 4. The pressure vessel node and lump layout for the NONEQFIL and NONEQDRN models. The insulation and heat shields are not shown.
930291Elapsed time, hr
1.0
Applied temperature,
K
1200
1000
800
600
400
200
0 .8.6.4.2
High Low
Temperature profile
930292
Liquid flow in or out
Pressure- vessel
wall
Liquid interface; position depends on fill level
To vent Pressurant flow in (drain model only)
Vapor region
Liquid region
Node 100200
300
400
500
600
700
800
900
10001100
1200
15
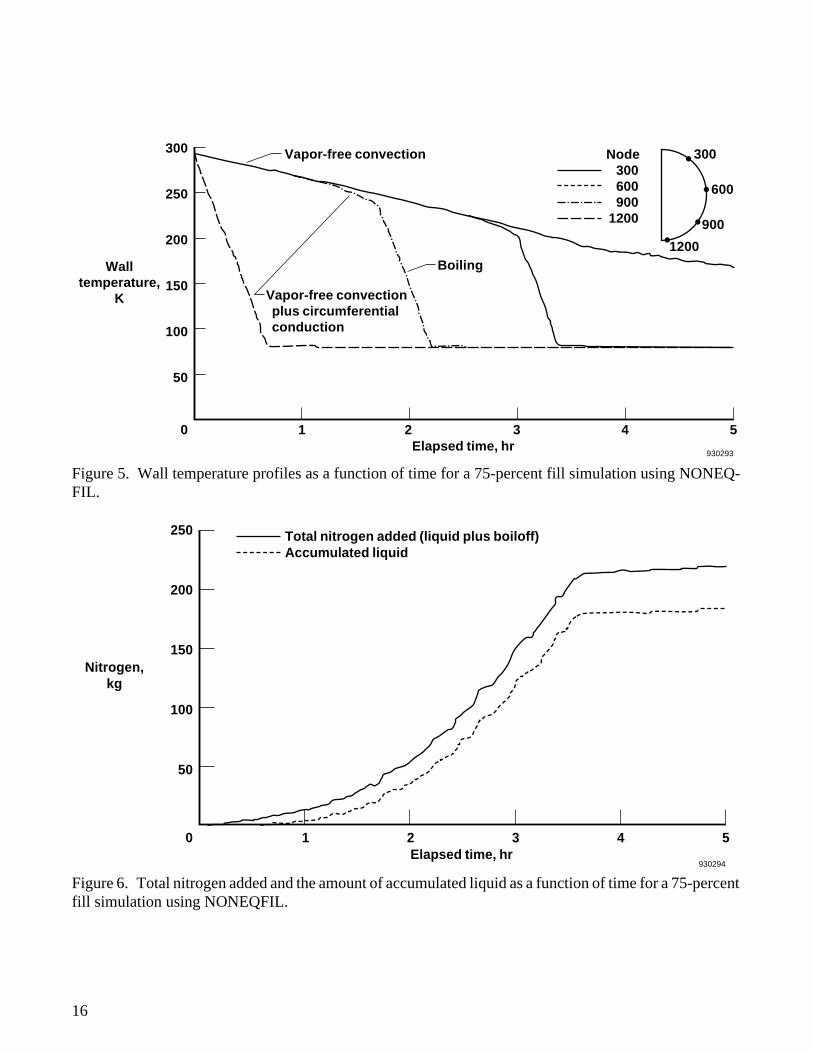
Figure 5. Wall temperature profiles as a function of time for a 75-percent fill simulation using NONEQ-FIL.
Figure 6. Total nitrogen added and the amount of accumulated liquid as a function of time for a 75-percent fill simulation using NONEQFIL.
930293Elapsed time, hr
5
Wall temperature,
K
300
43210
250
200
150
100
50
300
600
900
1200
300 600 900
1200
NodeVapor-free convection
Vapor-free convection plus circumferential conduction
Boiling
Total nitrogen added (liquid plus boiloff) Accumulated liquid
930294Elapsed time, hr
5
Nitrogen, kg
250
200
150
100
50
0 4321
16

Figure 7. The vapor heat-transfer coefficient effects on the wall-to-vapor temperature difference as a func-tion of time for a 75-percent fill simulation using NONEQFIL.
Figure 8. Wall, vapor, and liquid temperatures as a function of time during a 75-percent fill – 45-min drain simulation using NONEQDRN.
100
Vapor region
930295Elapsed time, hr
5
Temperature, K
300
250
200
150
10043210
Node 100
Vapor
Vapor heat transfer coefficient
22.6 W/m2K
5.7 W/m2K
Fluid (vapor or liquid) Wall
100
Vapor
900Liquid
930296Elapsed time, hr
1.4
Temperature, K
140
130
120
110
100
90
80
701.21.0.8.6.4.20
Node 100
Vapor
Node 900
Liquid
17
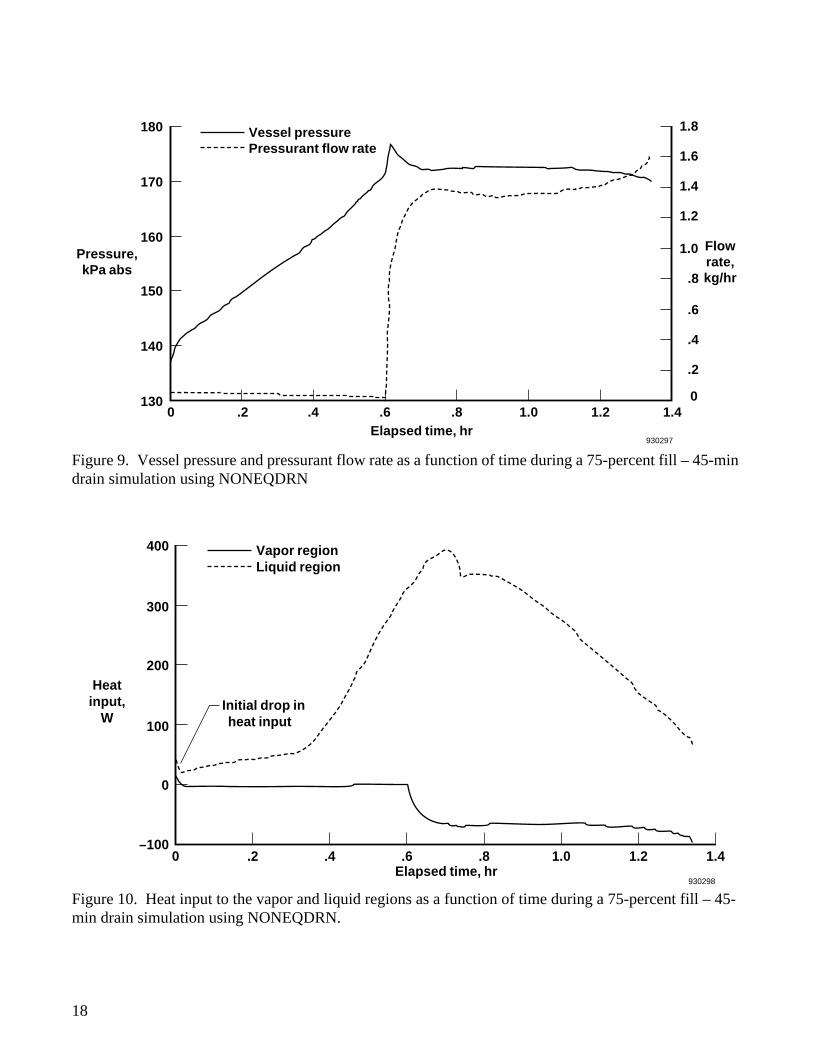
Figure 9. Vessel pressure and pressurant flow rate as a function of time during a 75-percent fill – 45-min drain simulation using NONEQDRN
Figure 10. Heat input to the vapor and liquid regions as a function of time during a 75-percent fill – 45-min drain simulation using NONEQDRN.
Vessel pressure Pressurant flow rate
930297Elapsed time, hr
1.4
Flow rate, kg/hr
1.8
0
Pressure, kPa abs
180
170
160
150
140
1301.21.0.8.6.4.20
1.6
1.4
1.2
1.0
.8
.6
.4
.2
930298Elapsed time, hr
1.4
Heat input,
W
–100
400
300
200
100
0
1.21.0.8.6.4.20
Vapor region Liquid region
Initial drop in heat input
18

REPORT DOCUMENTATION PAGE
Form ApprovedOMB No. 0704-0188
Public reporting burden for this collection of information is estimated to average 1 hour per response, including the time for reviewing instructions, searching existing data sources, gathering and maintaining the data needed, and completing and reviewing the collection of information. Send comments regarding this burden estimate or any other aspect of this col-lection of information, including suggestions for reducing this burden, to Washington Headquarters Services, Directorate for Information Operations and Reports, 1215 Jefferson Davis Highway, Suite 1204, Arlington, VA 22202-4302, and to the Office of Management and Budget, Paperwork Reduction Project (0704-0188), Washington, DC 20503.
1. AGENCY USE ONLY (Leave blank) 2. REPORT DATE 3. REPORT TYPE AND DATES COVERED
4. TITLE AND SUBTITLE 5. FUNDING NUMBERS
6. AUTHOR(S)
8. PERFORMING ORGANIZATION REPORT NUMBER
7. PERFORMING ORGANIZATION NAME(S) AND ADDRESS(ES)
9. SPONSORING/MONOTORING AGENCY NAME(S) AND ADDRESS(ES) 10. SPONSORING/MONITORING AGENCY REPORT NUMBER
11. SUPPLEMENTARY NOTES
12a. DISTRIBUTION/AVAILABILITY STATEMENT 12b. DISTRIBUTION CODE
Unclassified—Unlimited Subject Category 34
13. ABSTRACT (Maximum 200 words)
14. SUBJECT TERMS 15. NUMBER OF PAGES
16. PRICE CODE
17. SECURITY CLASSIFICATION OF REPORT
18. SECURITY CLASSIFICATION OF THIS PAGE
19. SECURITY CLASSIFICATION OF ABSTRACT
20. LIMITATION OF ABSTRACT
NSN 7540-01-280-5500 Standard Form 298 (Rev. 2-89)
Prescribed by ANSI Std. Z39-18298-102
Thermal–Fluid Analysis of the Fill and Drain Operations of a Cryogenic Fuel Tank
505-70-63
Craig A. Stephens, Gregory J. Hanna, and Leslie Gong
NASA Dryden Flight Research FacilityP.O. Box 273Edwards, California 93523-0273
H-1961
National Aeronautics and Space AdministrationWashington, DC 20546-0001 NASA TM-104273
T
he Generic Research Cryogenic Tank was designed to establish techniques for testing and analyzing thebehavior of reusable fuel tank structures subjected to cryogenic fuels and aerodynamic heating. The GenericResearch Cryogenic Tank tests will consist of filling a pressure vessel to a prescribed fill level, waiting forsteady-state conditions, then draining the liquid while heating the external surface to simulate the thermalenvironment associated with hypersonic flight. Initial tests of the Generic Research Cryogenic Tank will use liq-uid nitrogen with future tests requiring liquid hydrogen. Two-dimensional finite-difference thermal–fluid mod-els were developed for analyzing the behavior of the Generic Research Cryogenic Tank during fill and drainoperations. The development and results of the two-dimensional fill and drain models, using liquid nitrogen, areprovided, along with results and discussion on extrapolating the model results to the operation of the full-sizeGeneric Research Cryogenic Tank. These numerical models provided a means to predict the behavior of theGeneric Research Cryogenic Tank during testing and to define the requirements for the Generic Research Cryo-genic Tank support systems such as vent, drain, pressurization, and instrumentation systems. In addition, the fillmodel provided insight into the unexpected role of circumferential conduction in cooling the Generic ResearchCryogenic Tank pressure vessel during fill operations.
Aerodynamic heating, Cryogenics, Fuel tanks, Heat transfer, Liquid nitrogen, Ther-mal analysis, Thermal insulation
AO3
22
Unclassified Unclassified Unclassified Unlimited
December 1993 Technical Memorandum
For sale by the National Technical Information Service, Springfield, Virginia 22161-2171
Prepared as paper for SEM Structural Testing Technology at High Temperature II Conference, Ojai, CA, November 8–10, 1993. Craig Stephens, PRC Inc.; Gregory J. Hanna, Hanna Technology Resources; Leslie Gong, NASA Dryden Flight Research Facility.