! DTIC · 2A. Attenuation versus microwave frequency in the p!asma-filled waveguidc ..... 40 25....
65
A j .O i ? I i-[ • ; L > e + , ' , ' 1 HAC REF G8200 II AD-A250 71C Ii ILl 'I! I ,111 111 III.l1I1 ELECTROMAGNETIC-WAVE PROPAGATION IN II UNMAGNETIZED PLASMAS I ! DTIC D.J. Gregoire, J. Santoru and R.W. Schumacher It _ Hughes Research Laboratories vbMAY8 IE;99 3011 Malibu Canyon Rd. - Malibu, CA 90265 I March 1992 I F49620-89-C-0063 Final Report * May 1, 1989 through January 31, 1992 Prepared for AIR FORCE OFFICE O0 SCIENTIFIC RESEARCH Boiling Air Force Base 92-1 0 Washington, DC 20332-6448 . % I'!1111 4 1 l E 11
Transcript of ! DTIC · 2A. Attenuation versus microwave frequency in the p!asma-filled waveguidc ..... 40 25....
SI A j .O i ? I i-[ • ; L > e + , ' , ' 1HAC REF G8200
II AD-A250 71CIi ILl 'I! I ,111 111 III.l1I1
ELECTROMAGNETIC-WAVEPROPAGATION IN
II UNMAGNETIZED PLASMASI
! DTICD.J. Gregoire, J. Santoru and R.W. Schumacher It _
Hughes Research Laboratories vbMAY8 IE;99
3011 Malibu Canyon Rd.
- Malibu, CA 90265
IMarch 1992IF49620-89-C-0063
Final Report
* May 1, 1989 through January 31, 1992
Prepared for
AIR FORCE OFFICE O0 SCIENTIFIC RESEARCH
Boiling Air Force Base 92-1 0Washington, DC 20332-6448 . %
I'!1111 4 1 l E 11
I form Aj•proved
REPORT DOCUMENTATION PAGE OMB No 0o74.o1S8
coredAt Cc dS'"dc. *n ý.rq ,Lqgev tc-s 'C 'eau.crq !-ii r e-10 " '2Asý.'f H.3d~.s 'iP -(~ 'rc'ctate lo'"C!, O _0 e nl' !3 .•v,%r '."wa %,.!e 2C4 .z., -'jrc" .- : U2C.2 3C; d• rc t-* \,-e- " r ' ;- . Rei•iu•t cePP-.'cr [ Q'8C4 -' 8) v '-
1. AGENCY USE ONLY (Leave blank) 2. REPORT DATE F3 REPORT TYPE AND DATES COVERED131 March 1992 Final 89/5/1 to 92/1/31
4. TITLE AND SUBTITLE 5 FUNDING NUMBERSElectromagnetic wave Propagation in
b Unnagnetized Plasmas F49620-89-C-0063
6. AUTHOR(S)
Daniel J. Gregoire, Jo5eph Santoru,Robert W. Schumacher --
7. PERFORMING ORGANIZATION NAME(S) AND ADDRESS(ES) B. PERFORMING ORGANIZATIONH1ughes Research Laboratories
3011 Malibu Canyon RoadMalibu, CA 90265
9. SPONSORING, MONITORING AGENCY NAME(S) AND ADDRESS(ES) 10. SPONSORING, MONITORING
Air Force Office of Scientific Research AGENCYIEPORTNUMBER
Bolling Air Force Base, Bldg. 410I Washington, DC 20332-6448 ,5
11. SUPPLEMENTARY NOTES
12a. DISTRIBUTION/ AVAILABILITY STATEMENT 12b. DISTRIBUTION CODE
13. ABSTRACT IMzximum 200 words)
This final report describes an investigati3n of electromagnetic-wave propagation inunmagnetized plasmas and its application to the reduction of the radar cross section(RCS) of a plasma-filled enclosure. We have demonstrated RCS reduction of 20 to 25dB with a prototype system at the radar range at Hughes Aircraft's Microwave Products
i Division in Torrance. The prototype consists of a sealea ceramic enclosure with amicrowave reflector ar ' i plasma generator inside it. When the plas-na is present, theRCS is significantly reouced over a frequency range of 4 to 14 G(Hz. As part of theprogram, we also investigated the basic-plasma-physics issues relating to the absorptionand refraction of electromagnetic (EM) waves in collisional plasmas. We demonstratedabsorption as high as 63 dB in a section of plasma-loaded C-band rectangular waveguide.We also developed a theoretical model for the plasma cloaking process that includes
scattering contributions from the plasma-vacuum interface, partial reflections from theplasma, and collisional absorption in the plasma. The theoretical model is found to be inreasonable agreement with the experimental results and can be used to confidently designfuture plasma cloaking systems.
14. SuBJECT TERMS 15. NUMBER OF PAGES
Plasma Cloaking, RCS Reduction 66 C16. PRICE CODE
17. SECURIcY CLASSIFICATION 18. SECURITY CLASSIFICATION 19. SECURITY CLASSIFICATION 20. LIMITATION OF ABSTRACTOF REPORT I OF THIS PAGE I OF ABSTRACT
Unclassified Unclassified Unclassified UL
•'.5% 5d',).)',z O-•502. S'anciarc ?s r, 9Bj " 8,, .S • "'JsU3 CUnlsifiedI• " •"• _ •- =""_"- '
TABLE OF CONTENTS
T able of C ontents .................................................................. .. .......... ii
L ist o f F ig u re s ...................................................................................... iv
1. Introd uctio n .................................................... . . ....................... I
1.1 Summary of Experimental Results ............................................. 3
2. Theory of EM-Wave Propagation in an Unmagnetized Plasma ............... 52.1. B asic T heory .................................................................... 52.2. Collisional Absorption by a Plasma ......................................... 7
2.2.1. Attenuation in a uniform plasma .................................. 7
2.2.2. Attenuation in a non-uniform plasma ..................... 10
2.2.3. Attenuation in a plasma-loaded waveguide ........................... 10
2.3. Reflections from a Plasma-Cloaked Target .................................. 11
2.3. 1. Reflection from a sharp vacuum-plasma interface ................... 11
2.3.2. Reflections from the plasma density gradient ........................ 14
2.3.3. Total reflection from the plasma-cloak,:d target ...................... 17
2.4. The Plasma-Filled Fabry-Perot Resonator .................... ............ 17
3. Experim ental D esign ...................................................................... 21
3.1 Plasma-Production Technique ................................................ 213. 1.1 Plasma fomiation and energy efficiency ........................... 24
3.2 Vacuum System .................................................................. 26
I 3.3 High-Voltage Modulator .................................. 27
4. Plasma-Filled Waveguide Experiments ................................... 29
4.1. Critical Design Components .................................................. 293 4.1.1. Spark-gap array .................................................... 29
4.1.2. Slotted waveguide .................................................. 29
4.2. Plasma Density Measurement ................................................ 31
4.3. Absorption in the Plasma-Filled Waveguide ..................................... 35
4.3.1. Comparison of Experimental Results With The TheoreticalM o d e l ..................................................................... 14 7
5. Em-Wave Absorption by a Plasma Filled Enclosure .................................. 485.1. The Ceramic Enclosure ......................................................... 48 -. "-
5.2. The Compact Radar Range ................................. 52
5.3. Calibration in the Radar Range ............................................... 54
5.4. The Cloaking Measurement .................................................... 56 '
6 . R eferences ....................................................................................... oO0
iJb -i.... i"" •..i 'E..J .....
LIST OF FIGURES
1 Plasm a-cloaking scenarios ................................................................. 2
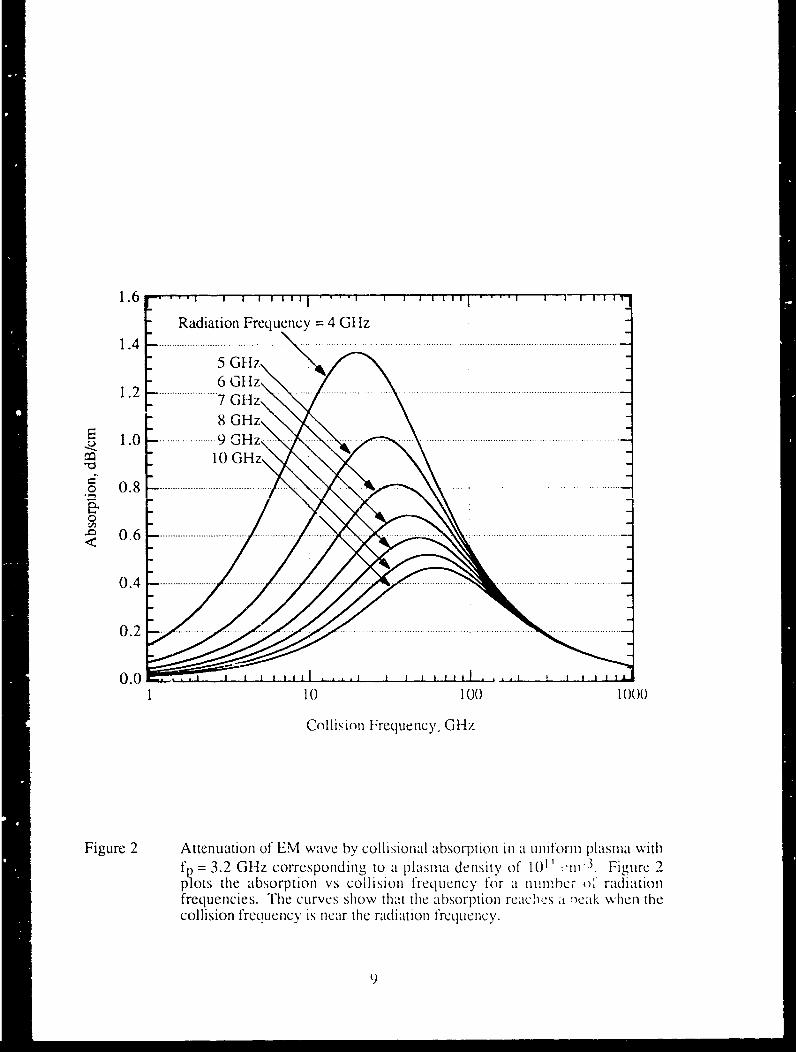
2 Attenuation of EM wave by collisional absorption in a uniform plasma ...... 93 Attenuation of EM wave transmitted through (a) a free-space plasma, and (b)
a plasma-loaded C-band waveguide with a 3.2-Gllz vacuum cutofffre q u e ncy .................................................................................... 12
4 A target surrounded by a plasma with an Epstein profile ........................... 13
5 EM-wave reflection from a plasma-vacuum interface ............................... 15
6 The Epstein profi le ......................................................................... 16
7 Reduction in reflected power of an EM-wave incident on a target surroundedby 30-cm long, Epstein-profile plasma ................................................... 18
8 Reflection from a plasma-filled Fabry-Perot resonator ................................ 20
9 Photoionization cross sections for lie, Ne, and Ar .................................... 23
10 Plasm a lifetim e vs gas purity .............................................................. 25
11 High-voltage spark-gap modulator ................................................... 28
12 SI .... d waveguide and spark-gap array ............................................... 30
13 Slotted, 30-cr-long WR187 waveguide section .................................... 32
14 Slotted-waveguide insertion loss ...................................................... 33
15 Axial plasma-density protile within the slotted ,Naveguide ......................... 3416 Plasma-frequency scaling with spark-gap current ................................. 3617 Rectangular waveguide and spark-gap array ............................................. 37
18 Electromagnetic-wave udasmissien system using diode detectors ................ 38
19 Electromagnetic-wave transmission .:ystem using a spectrum analyzer as atuned receiver ............................................................................... 39
20 Timing scenario for plasma-filled waveguide experiment ............................. 41
21 C loaking dem onstration .................. ................................................. 42
22 Attenuation of the tran smitted signal ..................................................... 44
23 Attenuation versus collision frequency in the plasma-filled waveguide .............. 45
2A. Attenuation versus microwave frequency in the p!asma-filled waveguidc ........... 40
25. Plasm a-filled ceram ic enclosure ........................................................... 49
26. Radar cross section of circular plate ...................................................... Z0
27 . S p ark g ap assem bly ......................................................................... 5 128. Ceram ic enclosure RC S Calibration ...................................................... 53
29. High-resolution range strobe of ceramic enclosure ...................................... 55
30. Single shot RCS measurement of plasma-filled enclosure ............................. 57
31. RCS ,eduction vs frequency for the plasma-filled enclosure .......................... 59
V
1. INTRODUCTION
This final report describes an investigation of electromagnetic-wave propagation in
unmagnetized plasmas and its application to the reduction of th.," radar cross .,cction (RCS)
of a plasma-filled enclosure. Such RCS reduction is an example of plasma cloaking where
artificially-produced plasmas act as FM-wave absorbers or refractors. Figure 1 illustrates
schematically these two cloaking scenarios. We have demonstrated RCS reduction of 20 to
25 dB with a prototype system at the radar range at 1 lughes Aircraft's Microwave Products
Division in Torrance. The prototype consists of" a sealed ceramic enclosure with a
microwave reflector and a plasma generator inside it. When the plasnma is present, the RCS
is significantly reduced over a frequency range of 4 to 14 GIlz. The plasnizs are produced
by a seed-gas/UV photoionization technique that permits independent variation of the
plasma-density profile and the electron co'iision frequceIcy. As part of the program, we
also investigated the basic-plasma-physics issue:; relating to the absorption and refraction of'
electromagnetic (EM) waves in collisional plasmas. Wc demonstrated absorption as high n
as 63 dB in , section of plasma-loaded C-band ectangular waveguide. We also developed
a theoreticai mlode.el for the plasma cloaking process that includes scattering contributions
from the plasma-vacuum interface, partial reflections from the plasma, and collisional
absorption in the plasma. The theoretical model is found to be in reasonable agreement
with the experimental results and can be used to confidently design future plasma cloaking
systems.
Based on the RCS reduction, plasma cloaking could be used to shield pzarts of
existing vehicles having large radar cross sections without major structural altcrations.
Costly redesigns could be delayed and the equipment's service lifetime within the arena of
electronic warfare would be extended. One major advantage of plasma cloaking over
conventional stealth technologies is that the plasma can be implemented as a "shuttered"
cloaking system it is switched on and off very rapidly. The plasnma would cloak the
electromagnetic transmission systems by rapidly turning on the plz ,laia when the
communication or radar systems were not transnitting or receiving. Different plasma
cloaking systems could be developed for use on ships, airborne platfOrius, and satellites to
provide protection against different radar threats.
An effective plasma cloaking system successfully ab•,orbs and/or refracts the
incideni radiation to such an extent that the returned signal is obSCUIed [by background
noise. An inhomogeneous, unnaignctized. collisional plasma -1 can effc icnItlV absorb
electuomagnetic waves. Thc EM-waVe fields accelerate the plAINM ClecCrnMs wI hich collide

I
a.) E.M wave is attenuated by the plasma as it is retlected from the target. 3PLASMA
RADAREM WAVE , ýpv
b.) EM wave is refracted around the cloaked tar,.et.
/ I -- It
5 RADAR9EM WAVE
I __
Figure I PIlasn'a-,wokik•g scenarIO,. 32

with the background gas molecuics, teeytasern nry nteE aet h
gas. In the absorptive plamina-cloaking scenario, shown in Figurc I it, whcrc a target is
surrounded by tafl absorptive plasmia, the 1`M-wave makes two p~asses through thle plasma
as it irradiates and is reflected from thle target, losing energy in eatch pass. The total RCS
reduction in this scenario is depenuecnt onl sevciral parameiter-s suchI as thle plaIsmla voIlumeI,
the EM-wave treqeCyIIIC, the. mo01inentum-transfer collision lrc(jluCncv-, ind the plasma
density. In the refractive plasnia-cloakiniz scenario, shown in Uigure lb), thle incident EMi-wave is scattered by the changing dielectric constant withini thý: plasma. thus minimizing the
interaction with thle target.
1 1.1 Summary of Experimental ResultsI lughes approach to the invcstigadlo Ofj1aplasma CILokiiig during11" the first year 01 our
progrian was to measure the tran'SMISSIOn and retleCL:ion of FM.-A waves propagating in a
section of plasmia-loaded rectangular wavcguide and their variance a'S functions Of thle3plasma-density profile and momientumi-transfer collision rate. Experimental results,, were
compared with thle theoretical model.
Significantl theorotjcal anol cx pertimni ul progýress hads nen iia' ic durim lieC Cklie .\cus
of our programn. The following items describe, our results during thle flirst year.
* Assembled glass-"T" vacuum11 Vessel, mlechianic:' I vacuumil pumlp, and seed-gas andbackground-gas flow and monitoring system.
0 Assembled spark-gitp miodUlator with 1 5-ky high-voltatge powcr supply and
1 Fabricated and operated preltiminary three-gap spark ar-ray With) tungstenl lectroles..
0 D~emon strated plasmia product ion using U V- photoion izathion o1 anl Ar/lIIcI ~seed/background-gas mixture.
* Fabricated an d cold tested C- band waveu ide sctlion withi 75%1(' trarisp~treuI sidewalls With perforim mance accurately predicted bV1w theoreticJnllVSCs-
0 Assemlbled and operated LNI-wz-,V'e 1MISraliStu 11isio nd toonitort~lg euC L\VOIK.
* M~easured 61 113 maxiunuta" alttenluaion f*or 4-(G I Mlzs gl tran.,niitted tLroughiplasmia. The satie plasmia protille provides Ž:38 dB3 fronti 4 through 0( G1 lz, thei eby
validating thle broadband absorher- Concept.

a Mecasured attenuation as funlction'S of COllisio freqecjlCIy and pflaSmal denISIty (I.e.,spark-&.ip current). The scaling is c-OnSi:;ent With ourl absorption mnodel.
Durinig the second year, we applied the knowledge wve gained fr~oml thle first year
experiments on plasnia production and EM -wave absorption to the development anddemonstration of at plasnia-cloaking proi. C. T'he seconld-year milestones are listed
below. 50 Assembled ceramic enclosure with perforated inmierowave reflector and spark -gap
array.I
0 Ensured proper operation of' plasiina-g~nerat ion mnechianismn with in the ceramnic
enclosure.
* Measured uip to 37 d13 attenuation of refleetcd microwave signal from thle plasmla-filled ncloCISUre in laboratory-based two- honi n icrowave scattering experiments.
* Measured RCS reduction (-RCSR) oftimie plasmna-filled enclosure uising tile compactradar range at Hughies-IMOD. The IZCSR wats from 2(0 to 25 dI3 ove-r the fire(uency a)range of 4 to 14 GlIz.
0 Compared RCSR measurements to a theoretical onle-dimiensional plasmia- filledIenclosure model.
In the following sections we will review our technical progress in understanding
and demonstrating thle basic physics of collisional EM-wave ab~sorption and its applieatiOnl
to the plasnia-c:loaking prototype. In Section 2 ý c presenit tethicatcicizl consideiios oour program starting with a simiple absorption miodtel of a plasmia-cloaked target. Important
topics Include quantification of reflection from at plasmia-vacuumi int~erface, propagation Ii' atplasmia-filled waveguide and the physics of the lplasnia-filled FiabrIy-Per-ot resonatoi as it
relates to Multiple reflectionms Iin the plasini--filled enclosure. SectioLn 3 follows wvith Idiscussions related to thle progr;-tlm Umm C's cpeimucntal deCsi en aspects. I Or-CtIOSt amunelt these is
thle plasmia-prod netion t1Cchniqlue. In Section -4 we presenit our results fromi thle plasnia-
filled waveiunde cx pernicents, inlluding at tenlulation seCaling' w itim radiation freqcyIIII),
mnowentumi-transfeCr collision freucyII1C an1d plaIsm1a denIsity. TI'wrs ICNlts are comlparied to
tile prcdictions of the miodel treated inl Sct~io~n 2. 1Final ly in S ectiOti 5.,k we present th1edetails of thue RCS R measuiremients malde Of thC plasma-f~iIlCle Cceai,11c eclCosure at thle
C lughes- MID radar ra~ige.I
4

2. THEOMRY OF EM-WAVE PROPAGFATION IN AN'I ~UNMIAGNEI'IZEI) PLASMA
1 2.1. Basic TheoryIn thle analysis throughout this sectionl, We aIssume1 that [Ihe lctron-ne111Utral COllis;Io
frequency in the plasmia is such that the mean tree path lbetweeni collisions is much sm,ýller
than the Debye length. Thus, any eollcctivc plas:;ma intecractions" are clttctivelvl quenched byI collisions. This is equivalent to requ1iriing that the clectr-on tenmperature is very small. If this
were not the case, then it would be possible for I-M-waves to lose energy to the plasma by
exciting electrostatic waves 5 . Treoe arrin n interaction withl plasima' Waves, an
EM-wave will pass through a uiniform. coflisionl,:ss. uimag1111Ciietze f)LdSIi Wit bout1 anly
attenuation providdthle E-M-wave ani rfreucyj.IC 0), eXCeeds tilc plasma frecquencyI d~t'etined by c/)-/n !,/ 1 2 Where '1ý is thie electi-on mlass, e I's thie electron ciiarg-e,
c, is the tree-space perrititivity, and n,2 is the plasmia-electron d1cislti'. InI the case whereIthe radiation is incident onl anl overdense plasmaI~ suIch tha',t w) ,thle LEM-wave IS totallyIreflected. If the Plasma denislit var-Ies wVith theC loneitUdinal coordinate z, then thle wave is
totally reflected at the point where thle plasima density exceeds a critical value dectermined by
InI contfast to thle coil is oioless pilasMa, aI eel1Ini sonl phILII maWvill alttenuate anl EM-
wave; also the wave will never be totally reflected bcauise thle collisions modify thle
propagation conlstanit to be Complex. thuls fpre\'eiiting the real part from vanishing inl an
overdenise plasma. The d*electric const~ant for' ani unInagnet9IizId, cold (i.e., 7(.= () I) plsitIa
canl be derived frotm the LOrentZ equaion111 Ot mo1tionl(1
dr drtit, -tcE - v.;wz, - 1()I d
I where r is the threce-d iIMen10siln CIelctIIon posit ion vecLtor, E is thle electric field of the I £N
wave, V(: I- theilecto CI lectron- nitlCOllisionlf--IIHV ll -) s11,E -5 ~EoeLp.iwk'i) we cai~ solve for r,
3 - v1. (2)
I5
If we coiliider thle onle-dimlenisiOnial cast: Where (thc plasmla density Vanies only InI thle
direction, tlec conductivity aTc can lie writtenl as
?i~. dr 11 C V. - I,,
F (it Mi. (041
In general, tile electron density in this exprecssionl is at fiunctionl of tile Spatial position,
tc=:n,(z). Thle dielectric constant e may he wvritten in termis of the conductiivity, asI
0)5
Trherefore, the dielectric con Sanlt L-1) for 
and
0 P IN Rc(c) > () (10)
I given the definition For the pha~se
I( ti U I11- VCay/(0 W 0 (0 2 -_(
The eal artof k, k, indicates the FI 1- wave's rate oi- spatial oscillatoion while th.
imaginary part of' k, k1, expr ess~es tht- field's decay rate ats thle wav.e, moves through thle
absorptive mediumli.
* 2.2. Collisional Absorption by a PlasmaElectromagnetic-wave propagatio~nn IIa dielectrCic C IeI CIMIS govcrnICd 1wthe waveI eqUationl
j- d-1z + k V2(z)li. =dz7(1
We employ the WKB method 7 1o derive ani arouit e~~,\Ih~ solu tionl,
I (z)ý lxp Lifk(z')d/] . 12)
I which is valid inl any region where1 d k
(13)
*which requires that thle waveniumber chncVery' little over a distance ot' one waveleng-th.
Ttis condition is easilyý SaItisfied 1w all hilt thle sharpeswt p1 asIna grad icn ts, or whencl thepWaVennmlImbr approachecs zero (i.e., ait walveýi2.uC ide cuto).
3 2.2.1. Attenuation in a uniform plasmia
For an mt ntC p~lasmaI Of Utin 1-1 ilr1dnit.IUMq10tio (1-2) v icids Lni ex lesoil for£the EM-wave powcr aL.; fucion ofM111 Odistanlce
1 7

I!
P z ) = /-,(,e "" (14) "
where Po is the power at z = 0. The expression can bc rcar'inged to yield a fonnula for 5the attenuation in The nIedium
A [tetll aI:on 1cm = 12 x 10 log l (c) Ik, (15) 1Therefore tile attenuation is proportional to the ilnagi nar-' part of tile propagation ecnstaita i
of Equation (6). The form of k, given in t-qtua tion (8) does nut lend itself to easy analysis.-It is useful to examine the form of k in the extreme limits where v,. -4 0 and
VC >> 0 ' CO P, i
l1i, 0 06 1- -1 0l)hlll k k,, I+ -
v > ,.o ,, N-; L ( . .
k,,V1 - w 7/(O- I ~ ~ irJ"'
lilr k = (17)v,: --),C (2 <(0(p (0,, < w-o )
From Ejquations (10) anid (17), it is seen that the ima gi nary panv of the prop :lgal ioul
constant Vanishes as the collision frequency approaches the extreme limits of zero or 3infinity given the Condition that (),< t0o. Figure 2 plots the absorption constant in dB/ctn
for EM-waves of varioLIs trequeCncies propagating in a ituniform plasma. A\s predicted by 3Equations (16) and (17), Figture 2 shows that the absorption tends to zero as the collision
frequency approaches the extreme limits except when 0o<(01,. Furthcr-treC and most
importantly, there is a pcak in t lie absOrltion loll hi v, uit,. T'hese f-cature_,.s are easily
understoo.)d in terms of the simple 1ttodcl otf t p1lasmta eClctCI ui being oscillated by an I-iEM
w.avc and impeded by coll isi,'ins with backgrotind atomlls. As hI ." I- \ ave vniVws into the 1plasma, its electric field oscillates the clcctrons. If there are no collisions, the electrons act
as a lossless dielectric. I lowevcr, when a collection of neutral back ground tomlllS a•e
present, the electrons will collide with and tItans ic r their kilICc tic cuiergV to tlhe Nuckgrounda.tomIIS. The energy transfer is critically dependent on the phase of tIll.e lectronis oscillation 3
S
Radiation Frequency = 4 Gliz
06
1~~1 1010 10
0.8 ~ ~ ~ ~ ~ ~ ol o .Fre.................u....e.. .. .. ... c.. .y. .. .........I ..
c~~ ~ ~~ollision Fruec sna h aito requency .H
9

I
cycle when the collision occurs. If an electron suffers a collision when it has maximum
kinetic energy (at a quarter way through its oscillation cycle), then the energy transfer is 3most efficient. Therefore we can expect the net energy transfer to be the nmxinmum when
the collision rate is roughly equal to tile EM-wave frequency and a requirement for good
absorption is vc-wo.
When vc>>coo, the absorption properties are very poor because the electons have
acquired very little energy before they collide with neutrals. This is verified by Equation
(16) which shows that ki-I/va in the limit of large v,:. In the limit of v-<<ao, the
collision rate is so low that the electrons simply oscillate in the EM-wave fields unimpeded
and little energy is dissipated.
2.2.2. Attenuation in a non-uniforni plasnia
To find the wave attenuation in a non-uniform plasma, we use Equation (12) and fcalculate the integral over the EM-wave's path. For an EM wave which enters a plasma at
z = zo, propagates to a reflecting target at . zt, and then returns through the plasma,
we estimate according to the WKBi approximation that the net reflected power is
P= P0 exp{-4I hl[k(z']dz' (18)
and the attenuation in dB is
Atternuation(d3) = 17.36J hl[k(z')Idz" . (19) 1
2.2.3. Attenuation in a plasma-loaded waveguide
It is much easier to make EM-wave transmission and reflection measurements if
they are done in a transmission line or wavegdide rather than in free space. In our
investigation of the effects of plasmas on EM-wave propagation, we have used a
waveguide to perform the mCasurenmcnts. Therefore it is important to understand the Idifferences between the plasma attcnualtion in the WaavCguide and free space.
In the waveguide, the complex propagation constant k become, jC k,,2 (20) 3
1() 0
where kc is the vacuum cutoff wavenumber of the waveguide. For a :ollisionless plasma,
the EM-wave propagation constant is equivalent to that in a waveguide with cutoff
wavenumber equal to k2 + OWp/C . As in free space propagation through a plasma, the
effect of collisions is to remove the possibility of kr=O , thus eliminating the phenomenon
of total reflection at the cutoff frequency.
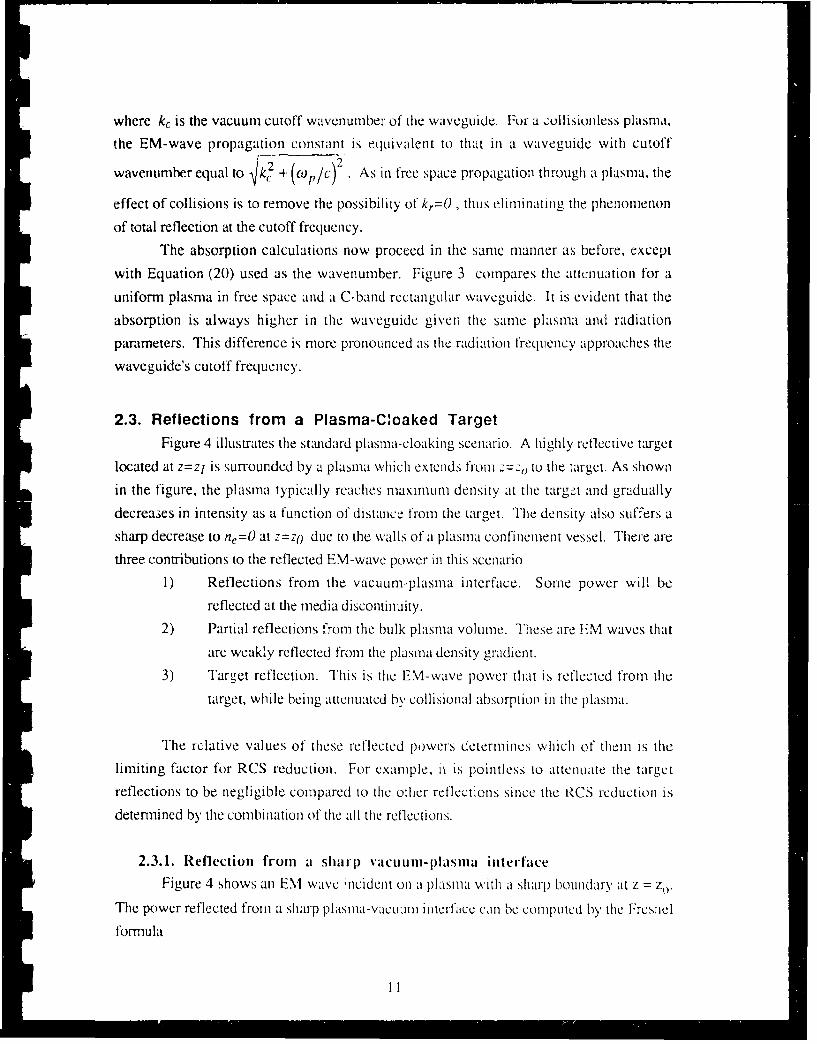
The absorption calculations now proceed in the same manner as before, except
with Equation (20) used as the wavenumber. Figure 3 compares the attcnuation for a
uniform plasma in free space and a C-band rectangular waveguide. It is evident that the
absorption is always higher in the waveguide given the same plasma and radiation
parameters. This difference is more pronounced as the radiation frequency approaches the
waveguide's cutoff frequency.
2.3. Reflections from a Plasma-Cloaked Target
Figure 4 illustrates the standard plasma-cloaking scenario. A highly reflective target
located at z=zl is surrounded by a plasma which extends from z=Zo to the target. As shown
in the figure, the plasma typically reaches maximnum density at the target and gradually
decreases in intensity as a function of distance from the target. The density also suffers a
sharp decrease to ne=O at Z=zo due to the walls of a plasma confinement vessel. There are
three contributions to the reflected EM-wave power in this scenario
1) Reflections from thle vacuum-plasma interface. Some power will be
reflected at the media discontinuity.
2) Partial reflections from the bulk plasma volume. These ire EM waves that
are weakly reflected from the plasma density gradient.
3) Targtet reflection. This is the EM-wave power that is reflected from the
target, while being attenuated by collisional absorption in the plasina.
The rclative values of these reflected powers determines which of them is the
limiting factor for RCS reduction. For example, it is pointless to attenuate the target
reflections to be negligible compared to the otlier reflections since the RCS rcduction is
determined by the combination of the all the reflections.
2.3.1. Reflection from a sharp vacuum-plasma interface
Figure 4 shows an EM wave ;ncident on a pllas!Ha with a shatrp bounodary at z = zo-
The power reflected from a sharp plasia-s,,I-cuJil interface can :be computcd by the Fresnel
formula
II!
(a) I2.0 .' ..... I-.- :•.-,1 . ...11 1 1.- .. , .r ...4 1 . 1"" '1 ... 1 ti I 1 " ' 1 4
"E 1.5 f. 4.5 Gltz I Iex 5.5 GHz
* 1 .0 6..
< 0.5 GI
0.050.0' 1•' "- .... t t I I'' I ! .
(b)
2 1.5 .
1.0 17. 0.5z
0.0
0.1 1 1 100 1000 0
Collison Fr-equeIncy, Gt ]z
Figure 3 Attenuation of EM wave transmitted through (.a) a free-space plasma, and(b) a plasma-loaded C-band waveguide with I 3.2-G(111l vacuulmL cutofffiequency. The EM-wave frequencies range from 4.5 to 7.5 G1lz and theplasma frequency is 3 Gliz. The absorption is greater in the waveguideand the optimum collision fIequeeIcV is shifted to lesser values. 3
12 U

Vcw Plasma Plasmla
IDensityF7
Pi I
Prl2
Zz z0 Z=() ZPlIosit 101)
Figure 4 A target surroun1ded by'. a plasma~ with an Epstcei-L pr-ofile. '[hei incident EM-wave power is reflected by tblu plasma-vacuuim Hintciace (P1,I), the density'
t gradient in the bulk plasma (Pf-2), and by the target (Prl).
13

I
_ =- ,(21)
where Pr, is the reflected power, Pi is the incident power and e,,1 is the plasnma dielectric Iconstant at z-zo. Figure 5a the shows the scaling of the reflected power vs
fo/fp (= wolco/) as given by Equation (2 1). For the collisionless plasma, total reflection I
occurs when wto/p ý_ 1, and the reflected power drops for wo/J) > 1. When collisions
are included, the wave always penetrates into the plasma and is attenuated by the plasma. IThe retiected power is greatly reduced its v, increases , even when O/Wp :1. In
conclusion, it is routine to reduce the refection from the interftace by 30 dB or miore by
judicious choices of the plasma parameters.
2.3.2. Reflections from the plasma density gradient IThe fraction of the EM-wave power (P1) that peneutates beyond the vacuuin-plasna
interface is partially reflected by density gradients in the plasma volume. Although this 5process can be treated numerically, exact solutions to the EM-wave differential equation
may be obtained for certain density profiles. One such profile is the Epstein plalsma-density
profile given byn1(z) = 1,(1 -t- e/) (22) 3
where n0 is the peak electron density at z±= + - and a is the scale lei.gth of the gradient. An
example of the Epstein profile is shown in Figure o for different values of a. The power
reflection cc,lfficient for nori:al incidenceS is
Rz = -I~ V f t i kG I T 1)] (23)1 + V 1/ 1 [[I +- iko(tc'/ 2 1)]
where I- is the complex gammla function and c is the plasma dielectric constant evaluated at
infinity. If G = 0, then Fquation (23) reduces to the Ilresncl IonIiMula of t:.LMatiti (21). 1In the scenario of ligture 4 the plasina has much less than infinite extent, however
we argue that Equation (23), will give good approximyate results for the density-gradient II
14i

I (a)50 T j.j -
Col. Ircu./Ract. f req.=40 0
j 13 ..........
a ~30 30 -- .
~2(........... - -.......
10
(b) 5 /5--
Col. freq.IRad. freq.
40 1
S30 30 ....
10------- .
00.0 Radiation t requeflcy/Plasma frequenicy
I Pigure 5 Ilv- wave reflection from a plasrna-vacuLull interfLace t*br differein electron-COllisio fre1quenIcjLCieS anid I M -wave f'reqcjLCLies. (a , Hie boun1dar-y isinfinitely sharp (o = 0). (b) The boundary has islight softening of the
denstv radient(cy=?ý/1I ). a is the scale leng-th of the pklasma-densitygradientl.
15

! . 0 ----I
0.6Ku2e
......................... a5 cm0.4- - T- Cm1
EU0.2--
0.0 -- ---
-60 -40 -20 0 2)0 40 60Distance, C111
F~igure 6 The Fpstelin protile rep;resenits a1 plasma deiis~i V proti Ic that can he solvcdanalytically for the I-arial reclicction front Ii the SII~ p laaden sitk ,'ridiclit. Thle3sharpaess of the gradient is d~terminc~ med fith characteristic legthtl (T.Several profiles arc shown in the t-igure corresponding to differenclt Values ofo3. The plasma density goes tr-ont 5%/ to 9-Sl" of its peak VadICWleit .Idistance fc
10U

reflections as long as the plasma's extent is several times larger than o-, tie gradicnt scale
factor. Figure 5b .plots Pr2/Pt vs o),Owp for various values of vC ~ 0 for o = (1/15)ý, 0
where X. is; the EM-wave's free-space wavelength. Ev-en though this gradient sIcralC length
is small with respect to a wa-,elength and wo/0%p < 1, the partially reflected power is still
greatly reduced by collisions. It is also important to tlotc that the WK13 condition is still
satisfied for this particUlar case.
2.3.3. Total reflectiol from the plasmia-cloaked target
The total reflected EM-wave power is a combination of the power reflected from the
vacuum-plasma interface, the partial reflections tronm the bulk plasma, and the collisionally
attenuated waves reflected b) the target. An exact calculation oL the combination of thtesc
reflections is not available analytically becausC the effects of multiple ftllctions makes it a
very complicated situ'tion. I towevcr, an tipper limit for the reflected power i:S computed
by summing over the electric fields of the component reflections, calculated from Equations
(18), (21) and (23), and assun;ing that they are all in phase. Figure 7 displays this
approximation to the total reflected powecr versus E'M-waIvC frequency for an EM-wavt..
incident on a target surrounded by an ElpstlNei-pi,)t lie l'lasla that extends to 1
Figure 7a shows how the plasma profile's shape :itfects the attenuation. As seen in the
plots, the reflected power is high at the low- and high-frequency ends of the spectrum. The
low-frequency end has high reflection due to reflection from the density gradient.
Therefore, the reflections at low EM-wave frequencies are more efficiently reduced by the
plasma profiles with greater C* values duc to he larger size of the plasmna relative to the E'M
wavelength. The wave reflects strongly at high-frequency end because the plasma
absorption dec cases rapidly as the frequency increases as seen in Figure 2. Figur. 7b
shows how the reflected power is affected by the electron collision frequenlcy. These
calculations agree with those published by Vidmar 3 .
2.4. The Plasma-Filled Fabry-Perot Resonator
"Fhe effects of multiple reflections from the various intcrlaces was i tnored in the
previous section for the sake of simplicity. I lowCvcr, multiple retlcctions Can be v:Cry
important in a plasma-cloakkintg sv,,tciii as demonstat-cd by the datat taken on the plasta a-
filled enclosure of Section 5. In oider to understan1d the Conpl icat ions introduced b1
multiple inteilfaces in a plaslia-cloaking sceiario, this section treats the problem of
reflection fromi a plasma--fillcd 1:,bry-Pcmt resonato-r.
17

III
(a ICol. Freq. 100Gllz -
50 Plasm Freq. 4 Gllz
0 3
40 - .. 53mS~2cl 1
S20• , -
50 Plasma FreL. = 4 (31 lz
4col0ision= 100 GI I• • 40• -
15 G()l
0 300.1 151G 100
S20
II
EM-Wave Flrequency, G1 lz IFigure 7 Reduction in reflected power of an lN1--wave incident on a target
surrounded b) 30-cm long, Epstcin-profilc plasina with a naximum }plasmafrequency of 4 (1 Iz. Figure 7a displays the reflected power for plasmaiprof*iles With C5= 1, 2, 5 and 10 )cmailnd V, = lO00 lz ('1IZ igure 71) plotsthe reflection from a (5 = 10 cm profile with \'c = 100). 150 "11d 200 Aprfieswih 1 2 5an 1 c adv~ 10 31lz Ii~ure h(1 i
is |

The Fabry-l'erot9 resonlator is a pair- of' partially' recflecting p aral Ici plates. III~ this
example, we assume that tile space betweenI the I)LateS IS filIled With a 1unifot-m1 plasmla and
that the back plate is totally reflective. Ani FIVv-iwae is incident onl the fr~ont plate. Some
the wave's power is rcflectcdi from the front plate whlilec tli, rest penietra tes Into thle
resonator making multiple reflections betweeni the plates. A portion of ihie wave exits thle
resonator each time it strikes thle front plate. The power reflection coefficient is
1- + k, 1, + 2rL' 2kos(2krL)2)R =- 2~ 1k,1. + 24
1 +/ Vr + 2re-I cos(2krL)
where r is the reflectivity from the cavity's fr-ont interface and thle rear interface IS assumeIId
to be totally reflective. The plasma's properties arc contained w-it in ki and kr, thle
Imaginary and real parts of' thle EM%-waveC propagation ccn stanlt InI the p)lasmla. Forsimplicity,~-1 th olwngdsuson uilinore thle comp~lex chiaracter of r and will treat it
as a real number.
Tile effects of- multiple reflections arc revealed by Inspection of 'It o.qilt (24). For
example, if r IS CLqual t0 thle slingl-paSS absorptionI (C-kL and 2krL= if.3ir,3 ifi,... then all
the power is absorbed within the cavity and there is no reflection. InI contrast, when
2krL= 0,2 ,r,4.r,.-., thle reflected power is 0 dB3 higher than ref lection f romn the front
interface alone. InI the limit L''" = I , there is no0 attenuatlion anld 1001,c of thle power is
reflected from thle cavity. InI thle opposite extreme where c-2k 1L,,r, tile back- intcr-fkce is
effectively cloaked and nearly all of the reflected signal is from thle front interfalce.
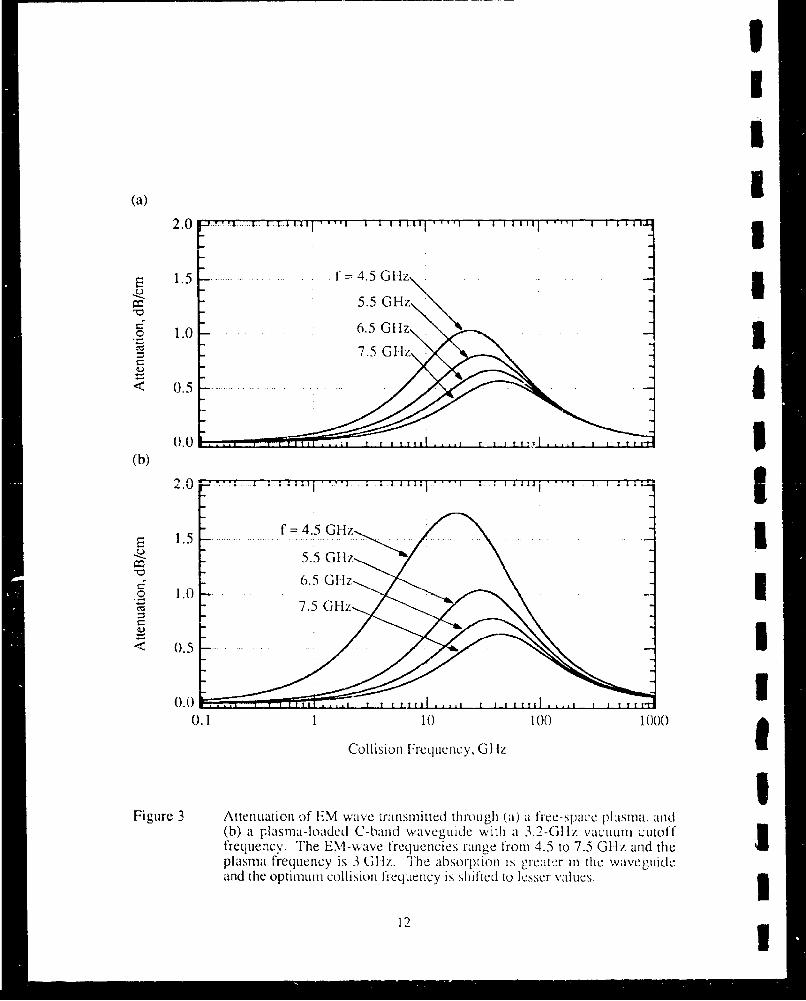
Figure 8 plots the return loss vs frequency fbr var1iotils ratios of e('-kAl-;r . Wheni thle
ratio is near 1, thec return loss has prominent peaks and valleys across thle Spectrum. A~s thle
ratio approaches 0 (See Figure 8a), the reflection from the back interface becomes dolnillaiztt
and the return loss approaches zero. As tile ratio becomes largc, thle back plate is
effectively cloaked by thle p~lasma and i-cflee tionl froml t1ftC front plate is dolininanit anld
constant. The reflection coeffi~ciciit is thenl determinled 1y thle froiitpltsrfeio
coefficient.
19
IIU
a) jj4 30........ ,.....0 ,,.. ....
Si. ..•
- 20 1.0..5 .... 0..... 0.9
,• 10 30b) I
40 1 1I
30 ~k.S~0.9
S- 1.2 ......= 1.7 ------
I.......... ... . ' . ) . . .
6 78 9 10i'rCeelnCV, Gil Iz
Figure 8 Reflection from a phlsma-fillcd [abIry-PeCrOt rCeso)na.tor. Rlct-1CC1ouI firomn aplasma- filled Fahrv-PCrot resonatoIr can he eliminated completely by Uappropriate choice of the front interface reflection coreficient (r ) and thesingle pass absorption ((,2kiz). The figurCs plot the reIturnL loss of 'a signll1reflected from a rcSonator with 15-cm plate separation and r --. 1. In I ii*ure•Lir8a the return loss is; plotted for several values of the absorptiol showinghow the reflection is Con stant at h)igh plasmaM density Zand aIs the density islowered, the reflection .s driven very low as the resonant absorptioncondition is reached. IFigure 8b show , how the retuLrn1 loss behaves as the Iplasma density co V tirlues to decrCase. l'vc utuaIl1v there is IIIC aISorp1tiiOand total rclcctt itI CC.'e.is.
20)

3. EXPEERINIEN'IAI, I)DESIGN
In this section we describe tile tech nique used for producing and diagnosinig a
volumetric plasma to he used inI the sutbsequent Cx\CrinIcntS o0l ltr--wave aIsOrI)tioll in the
plasma-filled wavcguidC and the RCS redCuctionL of the pladsla-l-tlecd enclosure.
3.1 Plasma-Production Technique
The plasma-production tcChniquC is dCsignCd to allow indCepcndcnlt variation of the
plasma density and the electron collision frequellcy. We used a U V-sustained plasma-
generation technology to produce the required plasma densities and plasma-density
gradients. I lughes Research Laboratorics I)has previouslyioneered this techniqueC for
producing spatially controllable, imloderate-dc usity plasillas within a high -pressure gas for
gas-laser discharges. The technique utilizes UV photoioniz~ationl of at low-ionization-
potential seed gas at relatively low concentration in conjuncuion with the Iiigh-pressurC gas.
This approach permits us ito independently vary the plasmia density and the electron
collision frequency in order to determine the parameters that optimize li-,>wave absorption
and refraction. The UV is generated by a high-voltage discharge across an array of spark
gaps. i'rhe spark-gap array is described in detail in Section 4.
The UV-sustained discharge technique was chosen because it decCoplcs the plasma-
production and electron-collision .I')OCCSSes, unlike other conventional volumne-ionization
schemes, such as rf discharges, w,,hich involve the dissociation of the background gas to
form plasma electrons and ions. We developed the U V--sustained disclhrgC techniqluc at
IIRL under an earlier DARPA-supported programi to produce a volumetrically scalablc
discharge for exciting high pressure CO-) k'scrs 10 In that protpramll a ()2-/NI/ llc mlixturt
at near atmospheric pressure was sccdcd wi it a small concenuration of a low-ionizationl-
potential organic molecule (tri- n-propylamuinc) and illhuninatcd with UN radiation from at
spark-gap array. Photoionized Clectron densities >1()12 cnl 3 werec produccd lirou-hiout an
atniospheric-pressure background-gas volumnc of about 20 liters.
In our present experiments. we fotund thatt a scCd/lhckgrnttund-eats inixturc of Ar/I Ic
provides satisfactory plasmna-productionl ratles. This -as iuxture greatly simplifies the
experimental appatrattuS since oilher caiid idae .eeCd g2tse.', ,AouLld ICLeULic .special hantdling
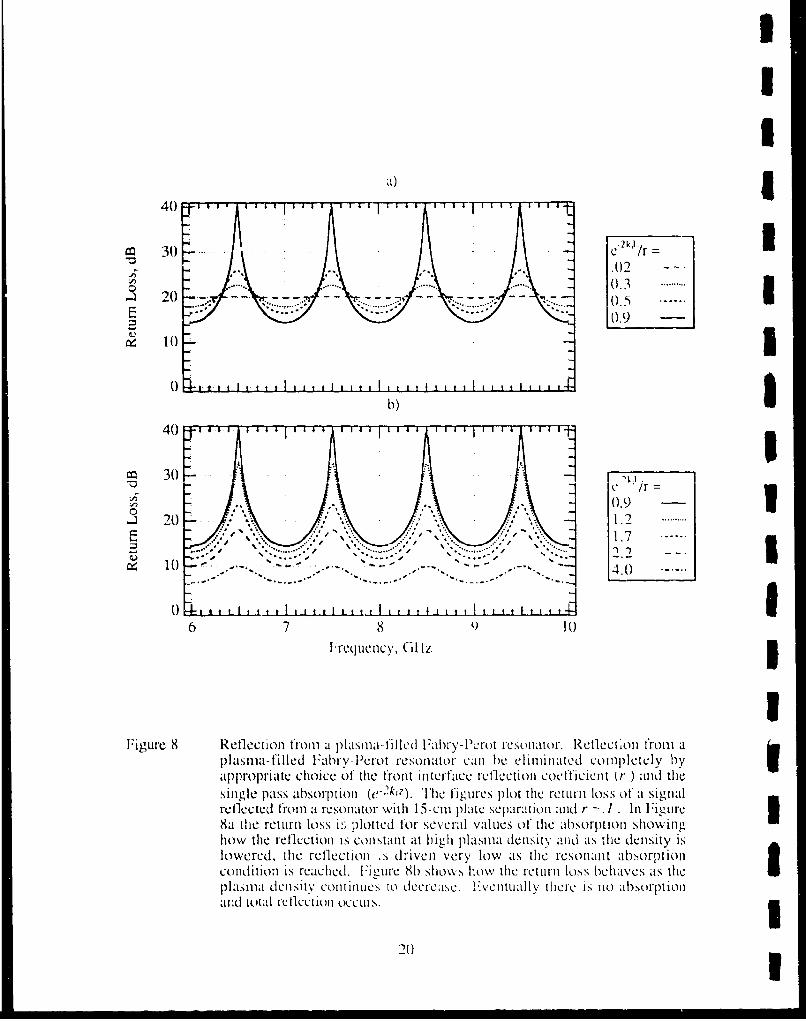
because of their toxicity. The L V - p)hot0lot izt 0ion0 cross-sect ions 11 aIs ft.Liionls of photon
energy for several inert gases are slow1n in :i"Iirc 9. Plhotons with Cncreics bSt\ I ceCm 21
and 16 cV penetrate the highli-presstrc I IC tas aid ioni0eC tile :\AF sCd gtas. WC have found
21

empirically that UV emission from the spark gaps described inl Section 4 hias sufficient
intensity in tii.s spectral regime to itiduce satisfactory Ionization. We camr estimate thle size
of the ionized volume. Thie UV radiation intensity will obey' anI exponenitial decay law
1(0) 4 "'(25)5
where I(x) is the Intensity at position l., /,, is the intensity at thle spark gap at x=~O, and
(76OILPA,4 ), is the UV absorption distance, where Ai is the absorptionl coeIticiciIl i
CnrI- shown in Figure 9, and PIr is ti,.e argon seed-gas pressure Iin lorr. The plasmla
density is then prolportional to derivative of 1l(.) with respmc to A,
(11() _1,, Ak,(26)
Ini our experiments. we typically used Argon pressures from l100 to 400) lB hIiT if' We use
p=6(X) cm- we find that ý varies from 12.7 to 3.2 cm.
It was not1 Possible for uIS to estimIate thle p)ISlasa denIsity 1)1riorI to doinrg thle
experiments as there were several unknownVl italorS invlVeId inl thle calIculatZioI 1inluding thle
spark-gap's UV spectrum and efficiency and thle 1impurit'ly Concentration inl thle gas mnixtur eIni practice, empiricai observation of ilc plasnia properties were tile tastes"t way to optiimize
the plasma generator. IHowever, we were able to estimate the op~timumLII argonl pressnrebased oiln anipuilation of EFquatiion (20). Simple analysis yields tire condition for
maximum plasma density at at fixed polint .1, to oýCcur when =.x. Thlcrecfure, thle op~timum 3llpressure is PAt,=700 Torrl.qi. Ini tire plaSnli-ra-hled WaIveguide e xperimrents (Seeý Section 4),
the distance from tire spark g~rps to the walvee'Luide axis Was 10 () c, thuls tire optimumii argon £pressure is predicted to lie withinl the range fr-om I100I to 200 in1TOrr de1pend~ing, onl tire value
of it used.3
During thle exprlimental meIaSUrcriclits, quLC'. I stions were rased as to whether tlr.
piasma was indeed being formed through thle ISV -Piiotoionitation process or if' it was
created withrin thle spark gap and p~rop1agatd outwarIId to fill tire reCst of'11 tieVacuum1 Cl~iiamb~Ani importaint piece of data uised to resolve this point Was tire reClative tinlirine between tire
spark-gap) current pulse anrd the I EM waveI abopiSon-)11 (See l:ie-'lircs 20 and 30) Iin tilelplasnirU-i lied w iveguide. Tire data slirowed t hat tire initiation01 Of thle e omen elt puLlse and tireonset of the absorption were simultane111ous. This rule1d out1 iry' possibility' Ol l)liaSlIh 3propagation from1 tir( spark gaps be-ingl tire plasmra source, sinrce it wouild liave t akenii nrrarlv
1(00 Jlsec after tire eumient pulse for anl\ absorp~tion to occur; based onl tire taict that at plasmia
in tire pressures used would propagalic at tire Speed of, sounid (-1I(X) irVscc).
Furthrer verification oftire IS V-pli)[lroorittonr1MI1 11et hod wais giver r by tire emipirical
agr~c~lment of absorption vs arglon pre-SSuI- \ne 11 111 itirLLIMI tieclulto ased on 1 FL~luatiOnl (20).
-)2
I&II
so .5. 5 177 V., 67 2,S 3.0 41.3 el 6-2.o
Mb Rare Gases
.~ Pa Lee 0nd '.'ss/er (1952/55) 7200i •. Wla~gfav et al (/955,),
I --- •.--:. . 9•~~ (-o795r,2) -1- _-
"1 30 ---o. I: 1 +0
I I (1S2
I_.... .--.. --... .-- --1 -'• . .. __.-_ .. I299
A &go °Y°---,3 6'V0 200
Iii
Figure 9 Photoionization cross sections for He, Ne, and Ar 1 1.
223U

Ii
As the argon pressure was raised from zero, the absorption increased to a maximum near170 mTorr and then steadily decreased thus indicating that the plasma density in the
waveguide had followed a similar course. The observed behavior was in good agreement
with the predictions. I
3.1.1 Plasma formation and energy efficiency
An ideal plasma cloaking system would create a CW plasma for a small energy Icost. The methods described in this paper are very' primitive and were developed to merely
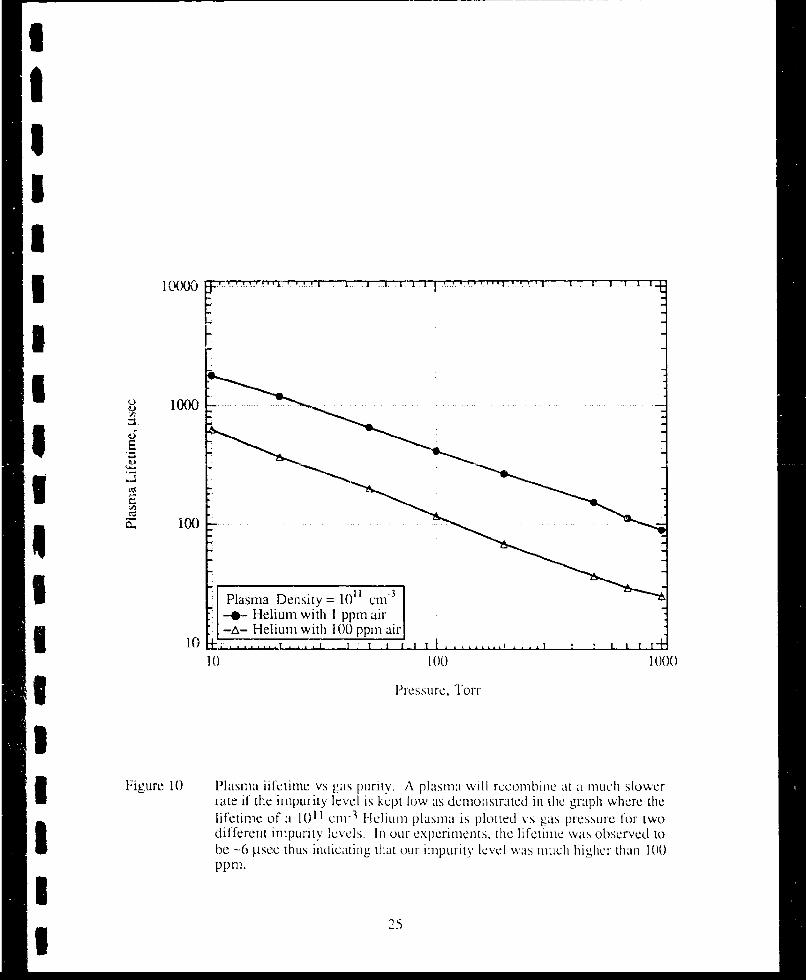
demonstrate the feasibility of plasma cloaking. In order to engineer a viable plasma- Icloaking system for an airborne platform, more efficient means must be used to create theplasma. Gas purity is absolutely imperative for an efficien: system. As an illustration of Ithe effects impurities have on a plasma, Figure 10 displays the plasma lifetimes for helium
as a function of gas purity as computed by Vidmar 3. It shows that an increase of several
orders of magnitude can be achieved with a pure gas. The resultant energy requirements
are calculated from the rate equations.
P= kn2 E, r- 1 (27)
where P is the power per unit volume necessary to maintain a plasma at constant density ne
in a gas with an ionization potential Ei and a recombination rate k. The plasma lifetime isI
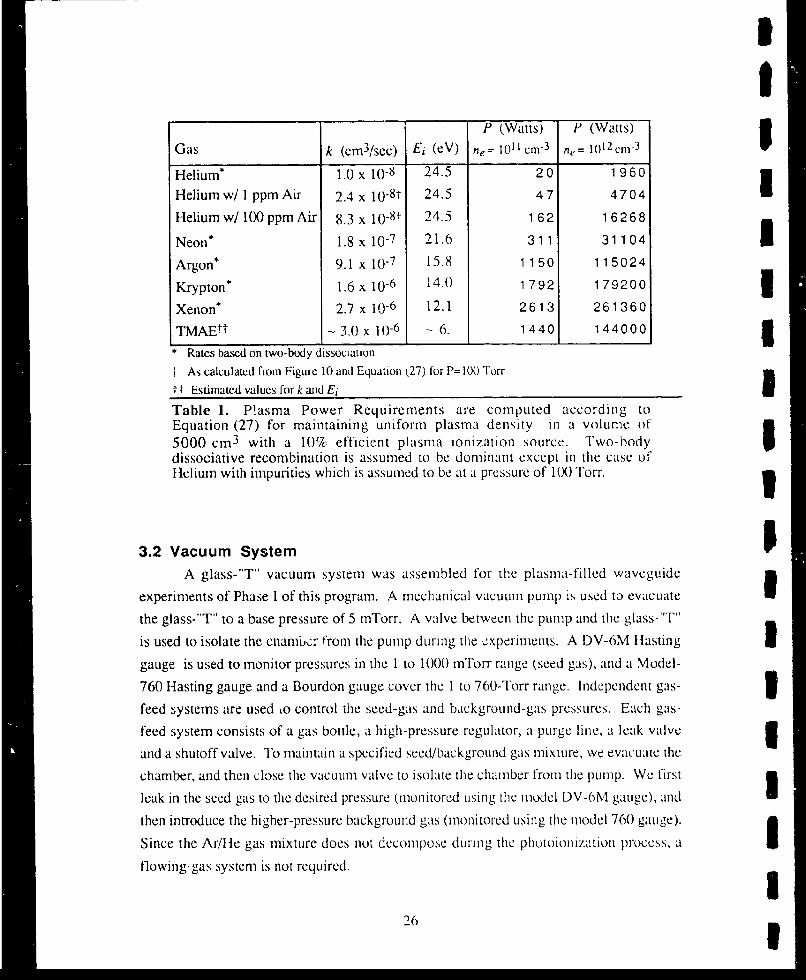
related to the recombination rate by r=l/ k ne. Table I lists the recombination rates and
ionization potentials for several gases along with the power to sustain a plasma as 5calculated from Equation (27).
Another way to increase efficiency is to use a gas which is readily ionized but has a
low intrinsic recombination rate. The noble gases are particularly attractive because of their
low recombination rates and their low affinity for free electrons. I lowever, their ionization 3potentials lie at 10 eV or higher. If it were possible to find other materials with lower
ionization potentials that still have low recombination rates and low radical coefficients,
then efficiency could be driven even higher. Possibilities exist for exotic organic vapors
such as Tetrakis-(dinmethvlanino)ethylene (TMAE), an organic material with Eij, - 6 eV.
On the down side, such materials would break down in any high-voltage discharge being
used to create the plasma, therefore a flowing gas system is ncceCssary II order to maintain
gas purity. The organic materials are also hard to handle because ofthe11ir toxic properties.3
I
I
II
iI
10 1000
Fiue1 Plasma Dfenstyjj VS 10ýJ cmilv lsm ilrcnbn t ILISoerat ithelimumrith I~ee p skpm loairnosrae ndcgap icetl
I~eij 10 Ij 1() I ,13HI1 1 0()ILSIIi lte SgI 1) 00SIIe rti
different impurityý leCvels. [n ouir experiments, thle lifetime was observed toIbe -6 psec thuIs in~dicatiIm ti lt our1 Iimpuri-ty' level WatS muILch hig'her thanII 100
25
I
P (Watts) P (Watts)
Gas k (cm 3/sec) Ei (eV) e- 1-01 cm 3 he= 10 2zcm-3
Helium* 1.0 x 10⁻⁸ 24.5 20 1960
Helium w/ 1 ppm Air 2.4 x 10⁻⁸t 24.5 47 4704 1Helium w/100 ppm Air 8.3 x 10 -8t 24.5 162 16268
Neon* 1.8 x 10⁻⁷ 21.6 311 31104
Argon* 9.1 x 10⁻⁷ 15.8 1150 115024
Krypton* 1.6 x 10⁻⁶ 14.0 1792 179200
Xenon* 2.7 x 10- 6 12.1 2613 261360
TMAEtt -3.0 x 1(0-6 - 6. 1440 144000 1Rates based on two-body dissociation
t As calculated from Figure 10 and Equation (27) for P=lO Torr
It Estimated values for k and Ei aTable 1. P!asma Power Requirements are computed according toEquation (27) for maintaining uniform plasma density in a volume of5000 cm 3 with a 10% efficient plasma ionization source. Two-bodydissociative recombination is assumed to be dominant except in the case ofHelium with impurities which is assumed to be at a pressure of (X) Torr.
3.2 Vacuum System IA glass-"T" vacuum system was assembled for the plasma-filled waveguide
experiments of Phase I of this program. A mechanical vacutum pump is used to evacuate
the glass-"T" to a base pressure of 5 mTorr. A valve between the pump and the glass-"T"
is used to isolate the chambcr from the pump during the experiments. A DV-6M Hasting
gauge is used to monitor pressures in the 1 to 1000 mTorr range (seed gas), and a Model-
760 Hasting gauge and a Bourdon gauge cover the 1 to 760-Torr range. Independent gas- 1feed systems are used Lo control the seed-gas and background-gas pressures. Each gas-
feed system consists of a gas bottle, a high-pressure regulator, a purge line, a leak valve 3and a shutoff valve. To maintain a specified seed/background gas Mixture, we evacuatC thie
chamber, and then close the vacuum valve to isolate the chamber from the pump. We first
leak in the seed gas to the desired pressure (monitored using the model DV-6M gauge), and
then introduce the higher-pressure background gas (monitored using the model 760 gauge).
Since the Arilie gas mixture does not decompose during the phoioionization process, a
flowing-gas system is not required.
26 1

The vacuum vessel utilized for the plasma-filled ceramic enclosure experiments was
the ceramic enclosure itself. A metal flange was fitted to its back cnd with an O-ring seal
and all of the vacuum valves and gas-handling components were tied into the enclosure via
the back flange. Gas-transfer operations were nearly identical to those used with the g!ass-
"T" vacuum system described above.
3.3 High-Voltage Modulator
The high-voltage modulator assembled for this program is shown in Figure 1 is
basically a simple capacitor discharge circuit. A single GL7 703 ignitron switch is used to
close the high-voltage, high-current capacitor discharge circuit- A 15-kV power supply
pre-charges each capacitor through a 100-kQ resistor. The capacitor charging path i,
completed by a 2-kQ resistor. When the GL7703 ignitron is triggered, the high-voltage
immediately appears across the spark-gap array. If the voltage exceeds the breakdown
voltage (measured to be - 1.5 kV), the spark gaps fire and the capacitors are discharged
through the gaps. High-voltage probes and current transformers are used to monitor the
pulsed voltages and currents, respectively. After initiating the arc. the current decreases
with a characteristic R'C decay time constant, where R is the sum of the series resistance
(10 ohms) and the arc resistance. Since the voltage drop across the spark-gap is very low
after breakdown is initiated, the current through the gaps, and hence the intensity of the UV
emission, is controlled by varying ,he capacitor charge voltage and the series resistance.
Special fecdthroughs were fabricated to couple the high-voltage into the vacuuLLm system.
The feedthroughs consist of 20-kV bushings soitered to modified Swagelock O-seal
fittings. Twenty-kilovolt high-voltage ( IV) wire is soldered to the high-voltage bushing to
form part of the vacuum seal. The HIV wire is thenC routed to the different spark-gap
elements. This system has provided reliable operation up to a maximum test voltage of
15 kV with He-gas pressures from 150 to 500 Torr.
2 7

I
JS0319-02R 1
0.5 gF I
II ~5-GAPI
SPARK-GAPARRAY I
0.5 jiF
10 Q3
5-GAP2 k SPARK-GAP I
ARRAY
00.5 -
5-GAP2 k Q SPARK-GAP
ARRAY0.5 E T
100 k 0l 10 a
SGL7703 0• 5-C.,A P!
15 kV 2 k Q( SPARK-GAP
SARRAY
F-igure I I Hfigh-voltage spark-gap 11odu~liltor.I
28I

U
S4. PLASMA-FILLED WAVEGUIDE EXPERIMENTS
In this section we describe our experiments investigating EM-wave absorption in a
plasma-loaded section of C-band wavcguide beginning with a description of the apparatus,
in paiticular the spark-gap array and the slotted waveguide assembly. We then proceed to
discuss the plasma density measurements and the EM-wave propagation experiments. Our
results are then compared to theory and shown to be in good agreement.
4.1. Critical Design Components4.1.1. Spark-gap array
For preliminary experiments, a three-gap spark array was designed by carefully3 considering high-voltage breakdown in a I to 760 Torr gaseous environment 12-14 The
main requirement is that the breakdown occurs between the electrodes and not the electrode
supports. Based on the .esults of this design study, we used 0. 16-cmr-diameter tungstcn
electrodes sharpened toi a point and mounted in 0.64-cm-dia,meter polished stainless-steel
electrode holders (Tantulum electrodes worked equally well except that they had a higher3 erosion rate). The modulator described in Section 3.3 was used to test the preliminary
spark-gap array at pressures ranging from 5 retorr to 760 Torr. We tested the array in3 one, two, and three-gap configurations to detenninc the scaling of the minimum br-akdown
voltage at different pressures with thie number of gaps and the tungsten-electrode spacing.
We found that a gap spacing of 0.64 cm provides reliable operation from 150- to 760-Torr
lie-gas pressure with a minimum breakdown voltage of about 3 kV for a three-gap array.
Operation at lower pressures was extremely difficult due to glow discharges between the
high-voltage-electrode support and the giounded waveguide. There were .Aso problems
with Paschen breakdown inside the high-voltage feedthroughs at the lower pressures.
l! Using these data we designed four arrays with fiv.e spark gaps per array. Each
five-gap array was found to have a breakdown voltage of 4 kV. Figure 12 shows the3 spark-gap arrays mounted on the slotted wavewuide, Which is described in the next
subsection.
4.1.2. Slotted waveguide
The slotted waveguide is the key element in the EM-wave transmission system; it
solves the problem of allowing plasma to be i IIJcoted into the waveguide without disturbing
the waveguide's transmission characteristics. We pcrformcd theoretical calculaiions and
29

viI
PC-w
303

IU
several experiments to validate the concept prior to fabricatirg the full-scale slotted3 waveguide. Our calculations 15, 16 indicated that a C-band (WR 187) waveguidc with 75%
to 80% sidewall transparency will have negligible perturbation on the transmitted wave.
Using the calculations as it guide, wc fabricated a fivc-slot, 75%-transparent section of C-
band rectangular waveguide (slot width = .04 cm). The slots are cut into the short walls
on the waveguide because the electric field of the fundamental mode vanishes at these
walls. Therefore, there are no wall currents that can be intcrrupted by the walls. The slots'
effect on transmission properties was examined by measuring the waveguide insertion loss3 using a scalar network analyzer; the slots werc found to have virtually no eflect. Less than
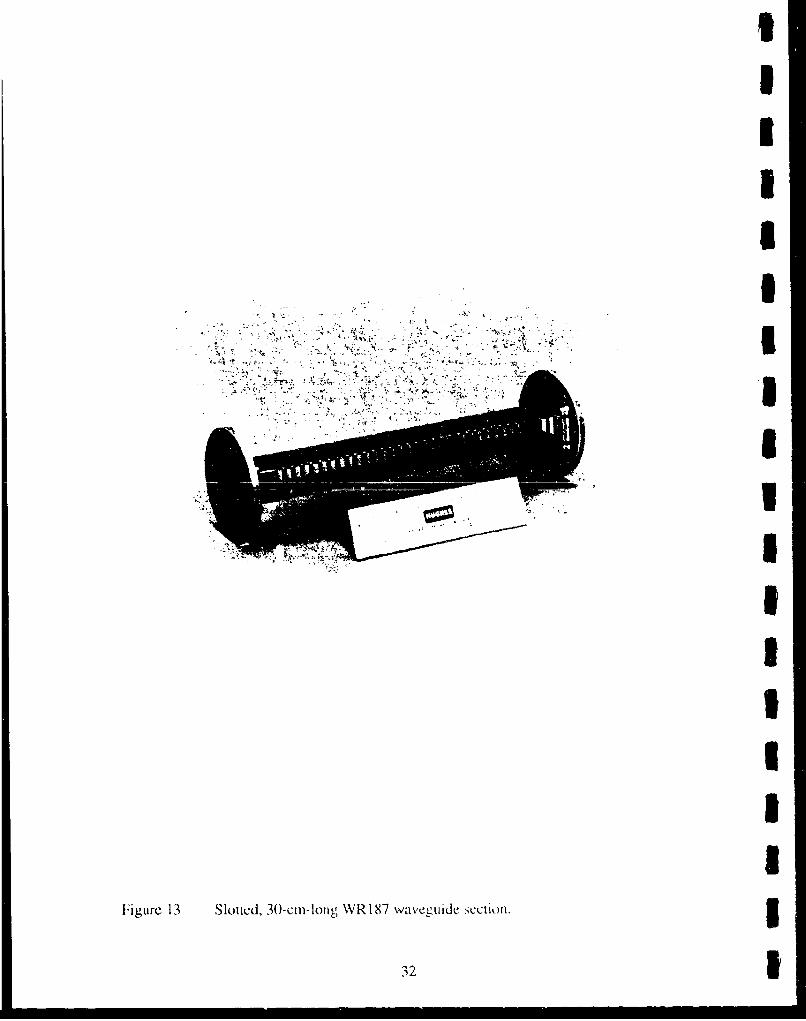
0. 1-dB change in the waveguide's transmission los: wats measured.3 Encouraged by the test piece's high performance. we then fabricated the 30-cmn-
long section of C-band wavCguide with 75% wall transparency shown in Figure 13. The
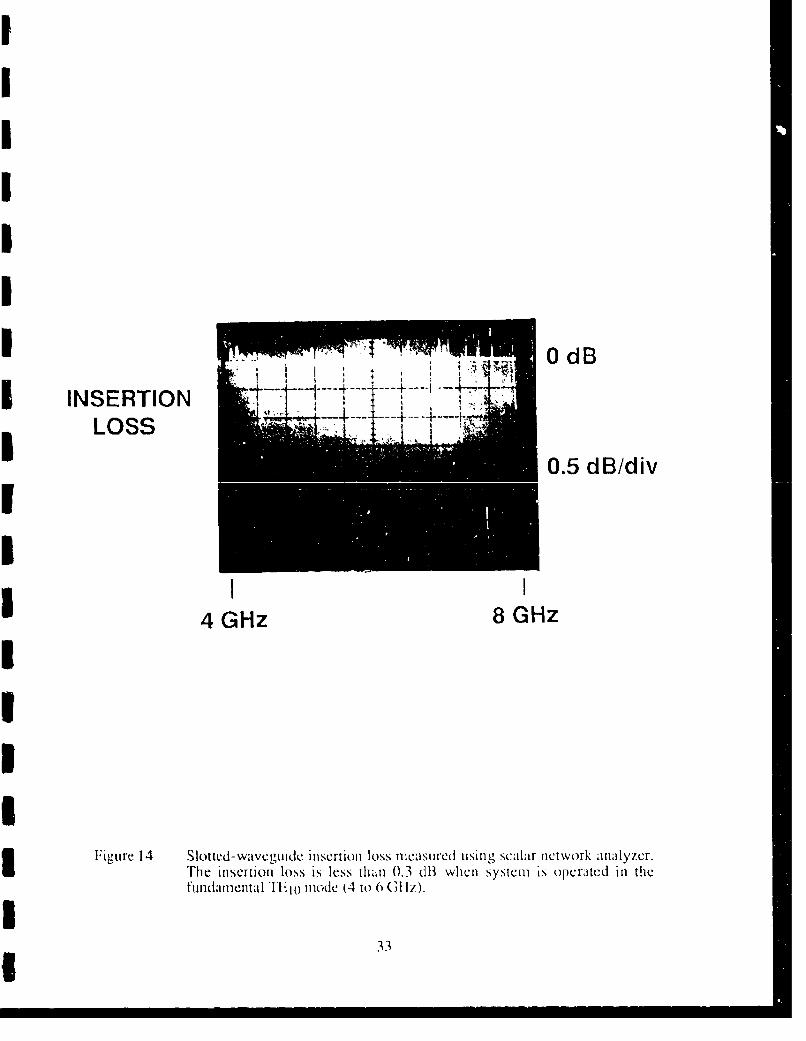
measured insertion loss is shown in Figurc 14, where the in-band characteristics of the
coax-to-waveguide adapters and coaxial cables have been subtracted out. The insertion
loss is less than 0.2 dB over the C-band operating frequencies of 4 to 6 GI lz. This
insertion loss is much less than the l-M-.wave atten nation cxpectcd in the cloaking
experiments therefore we expect to accUr1tely mleasure the eLfects of pl:''na on, the ,'ave3 propagation in the waveguide without having to worry atbouLt the effects of the imperecct
walls.
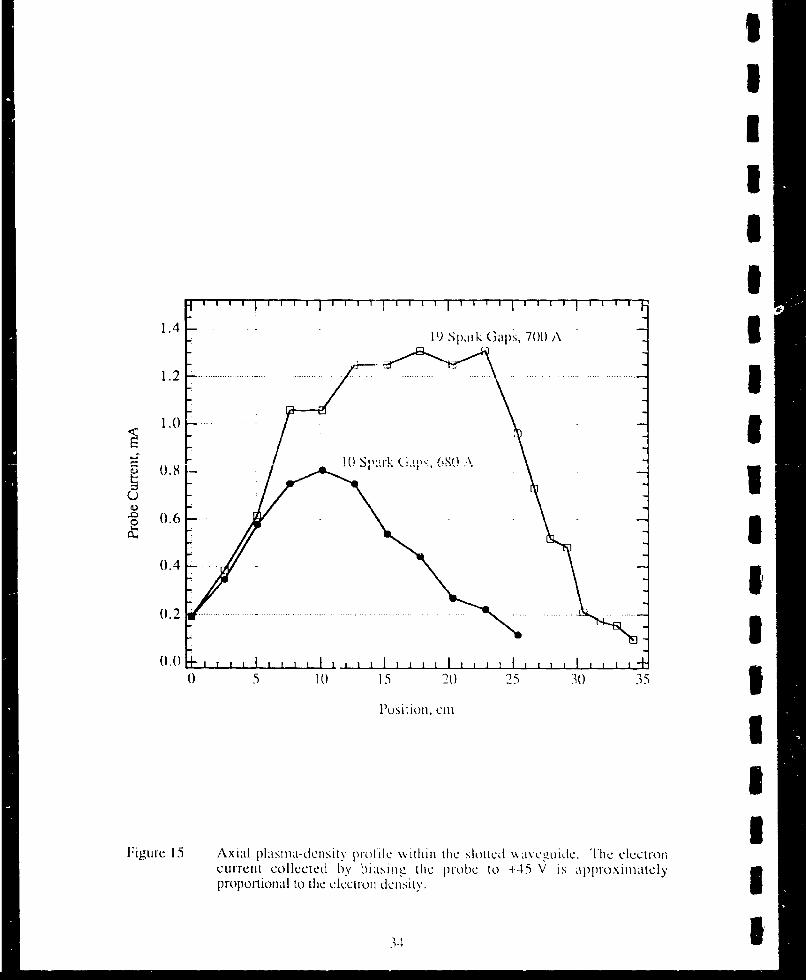
4.2. Plasma Density Measurement
We installed a cylindrical Langmtun probe to measure the plasina-dcn.sity profile
We sampled the axial plasma density by' removing one coax-to-wve:•vgui dc adaipter andI inserting the probe into the wavegiUide. The probe was biased at +45 V to collect electron
current, which provide.,, a relative meaCsurC of the locall electron density. Two plasmla
profiles are shown in Figure 15. One profile was recorded when 700 A was dischargCd
through 19 spark gaps. The second profile resulted when 68(0 A was dischrgcd through0only 10 spark gaps (one fivc-gap aravy on eiach side of the slotted vaveguIii ide). l:rolmt the3,profile measured when the 19 gaps were fired, we find that the l)laS1nI extends for about
22 cm (half-maximumn points on the Clect0Ion-current pr1)file) within the waveguide and has
a a gentle gradient at either end. At this point, wc have not yet assi1gried an a bsolutC Iitelasma
density to the profiles in Figure 15 because We ,ehave found that the Lialigriiir p110)C theoCy
I developed for highly collis.ional plisuMs is computation i nteisive. I ltovCVCr, we have
applied an cmpirical techniiqutie based the da1ta lroil the plasina-filled wýavet.aide's
Iabsorption experiments (Sec Section -1-3) ank applied a non-linear ourv: fit to determi ne the
plasma density. The curve fit is based on th thetory of Section 2 and wC assumLCd unilfonn
1 31
UIU£I
A
S III
IIIIUII
Figure 13 Slotted, 30-cm-long WR 187 waveguide section.
32 1
IIB
INSERTIONL S ' J....---+--- I-
| 0.5 dB/div
I
4 GHz 8 GHz
F~iguire 14 Slotted-wavegultide insertion loss measured using scalar network analyzer.The I nsertion loss is less than 0.3 (111 whecn system is opcrattcd in thefundamental TF~l0 mode (4 to 0•G1 lz).
33=
1.4
1.4- .19 Spai k G aps 700 A
1.2
1.0 Ipu OO
0.4 50.2 3...
.00 5 It) 15 01. 25 30. 353
3,1

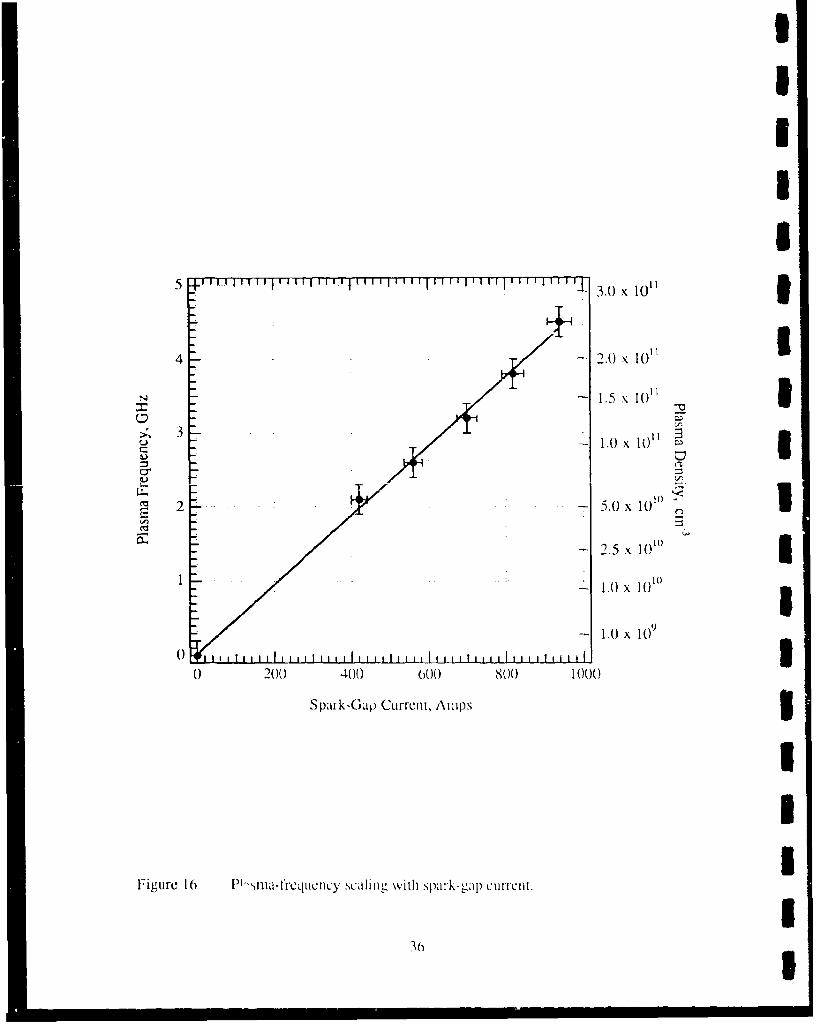
plasnia density across tile wavegu~ide'S Cr-Oss section). AS Shown inl F'igure- 10li.te plasmia3 density scales proportitonal to thle square ol' thle spark -gap current. A corollIary is that thie
corresponding plasmia frequency scales linearly and at curve is filt to tile dtata points based oil3 this simple decpndenice. The linear bechavior is casy to dIcnioistratc analyt ically if' we
assumne that thle spark-gaip impedance is cosatadteZ7e ht~o notepam
generation is proportion:J to thle power diissipatedl across thle arc; tilen, lc-l~arc:-larc 2RarC anld
fp-]Iarc. On the other hand, we canl expect compliati[oils duie ito thle following tinceriain tie's;thle spark gap's UV spectrum as a function of' curr-ent , thle gap's radliation effic incvi, tile9Stability of the spark-gap imipedanlce anld thle mo1deling" 01'the true plasnia profile. As seen
in the curve lit of 1-igure 106, tile eumpliCationS d10 not1 inltirodIC eC seiouIs aberrationls.3We ý..5() used tht- Iangrnuiril probe1 to nIIIaSL. w tilie Ic ativC 1)1 aSInaI dell tv as a
function of argon seed-gas piressutre ill orderk to verily tile op~titnunll valueC as pred~lcited, by3the UV-photoionization anlalysis of'Sectilon 3. 1 . The electron probe currenlt wýas mionitored
as the seed-gas partial pressLtre waIs IIinCresedI f"roti1 0 to 1 TOITr byV liokliI' g ltc prVobe at a
f ixed +45 V bias. The lleliumII pressure Wats alSO Var1iedI trout 200 to -400 lorr. The probe
current peaked at argon pressu res near 1 50) oi''orr corresponditlghl1 to an C-fo(ldng UV -absorption length of about J-'10 emi, thus v'e-tI vt ig t lie Calculations of Section 3. 1 that5showed that the argonl/hlium1,11 gas 1nixiLI NUSe wsUN sutabl fo ourI 11)SOrpi-111 cxj)erI- I tie tits.
£ 4.3. Absorption in the Plasma-Filled WaveguideIn this section wec describe albsorption0 eXl)eritf11lettS deiiotist rat ill, It 11MMa n iaioin of,I ~ ~~63 d B attenuat ion for a 4-G Ilz Ii\ \vIV wave prop1agaed through~j thleP 1 a a-ldd
waveguide. These experiments emrploved the forlve- gap) spark arrays anid tlie slotted C-3 band waVeguIide Shiwl in I i Fkure_ 17, tilie ini*cr~owave%,( tIan1Snti ssioui \StetCii5 shown '11il
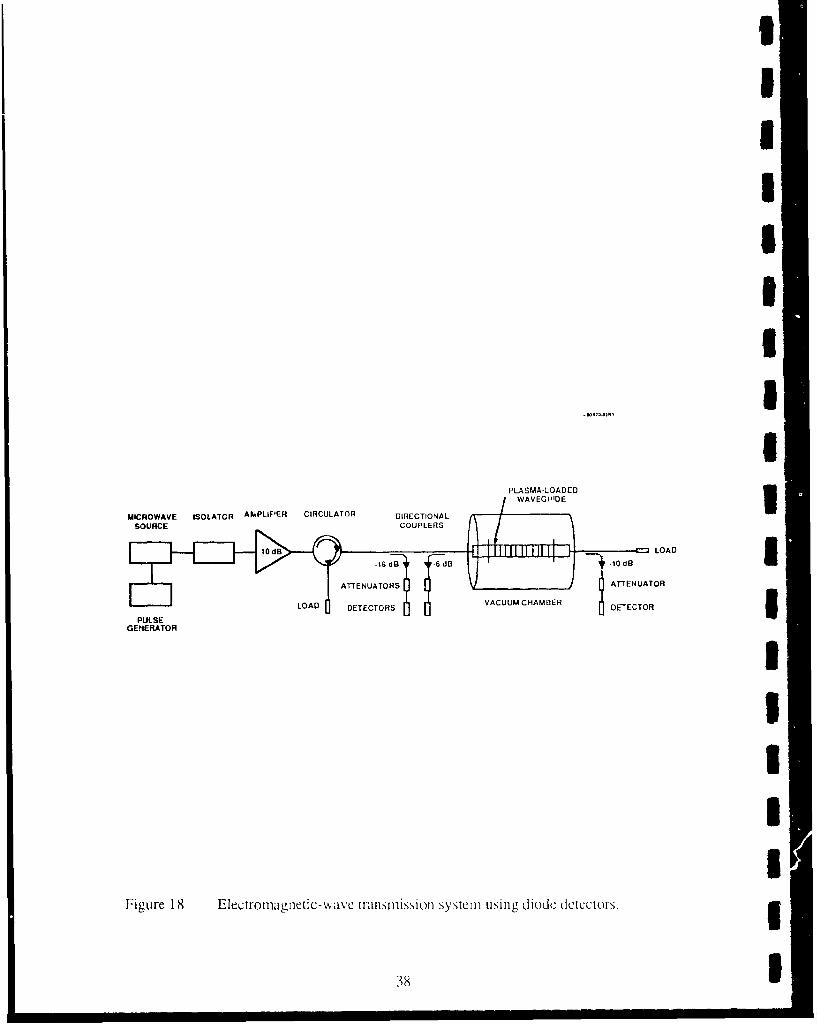
F-igures 1 8 and 19, and the spark- gapI mod LIIkll aror NI s Io l 1ii 11- 11.~cue3 ~ ~We assembled the E:M- wave tr-anstiussioti systein shtowviin Ii cueIN. Thle puil se
genlerator gates thle miicrowave sIIMi SOn al soi Ice oti.b a ppr-ox ittate l 50 p s. The 5 i-1i a Iis3then amplified to approxitiiatcly 1 W. Ati isolator prvClS power ic flected froto ilc
amplifier input fromn returning to thle signal1 SOUrce. "HIi out011 111t frntrleatil jikjer IS touted1Ithrough it circulator0 to isla0Cteilie anliplifier Iliot ii thle p-1I,1,aIa- loaded w veend. )rcrUioa
coutplers and diode eCtc~tors ate usedI to iiCM1- Icasut il 0C i power i ic et ott, ref1lected hlotii, anld
transmitted through thle plasmaI- loadedwave \k nC1Lide. I lerniietically sealeld SNMA I'eed throulghsI ~ ~~are used to route rtie microwkaves, in to lie vacutinni cliat ibet. S land ariA \R 1 87 coax -to -waveguide adapllter-s tiatch t11e co1ax cablesC' to dr lie -,14 a 0 ( lasti h)aCd wve UtdC. lThis tra11it sns-
I1II£
5 3.0x 10"3
4 +,/ 2o.0 x 11r,- 1.5 x10 -v I
a 2 -- 5.0 x 10
S~2.5 x ,1i
1 " 1.0 x 10o")
)10 9
0 IIIIIIa li l~ii 11111 iil T I 111 ilv L-1 0 xio• I0 200 400 000 800 1000
Spai k-Gap Current, Amps 533I
Figure 16 P'-',sina-trqCLency scaling wiEl] spark-gap current.
I336 1

I
PLASMASPARK MICROWAVE
VACUUM ARRAY OUTPUT
I MICROWAVEINPUT
II
RECTANGULAR3 WAVEGUIDE
IF,',ure 17 Rectangular waveguide and spark-gap array used in the plasma-filledwaveguide experiments. The spark gaps, mounted parallel to thewaveguide axis, produce UV radiation that penetrates the waveguidethrough slots in the sidewalls. The UV ionizes an Argon-Helium gasmixture inside the waveguide to density as high as 1012 cn-3
I6 37
IIIIIII-I•I
PLASMA-LOADED
MICROWAVE ISOLATOR APLIFER CIRCULATOR DIRECTIONAL WAVEGE
l~d -6 B 6 B 10dB LOAD3
ATTENATORSATTENUATOR
LOAD DETECTO VACUUM CHAMBER DE-T3ECORPULSE
GENERATOR
I3II
Figure 18 ElecLtromagiletic-wavc tiansillission syste,<tm using diode detecto•s. !
38 1
III
PLASMA-LOADED
IMICROWAVE ISOLATOR AMPLIFIER CIRCULATOR DIRECTIONAL AEUD
30d 11111 - - LOAD
L AD DENUrOR VACUUM CH-AMBER5PULSE LA EETRJVTUNED
GENERATOR RECEIVER
II
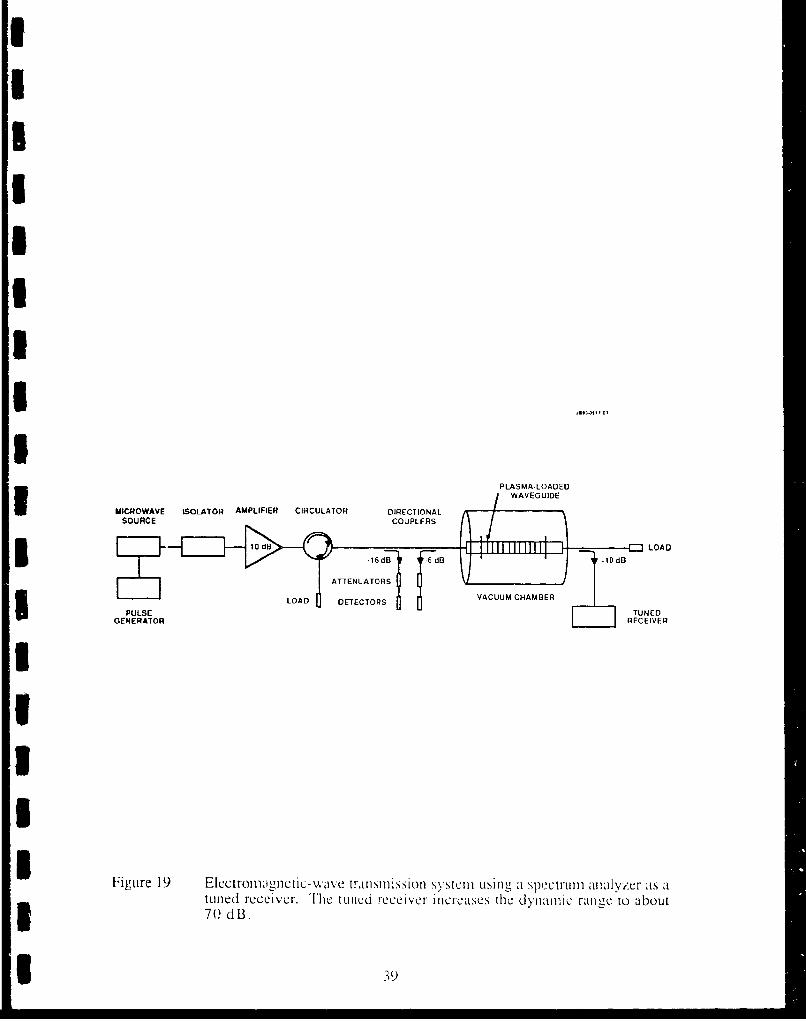
Figure 19 Electromnugnctic-wave trailsn ision systeL using a spectui'li alialyvzcr as atuned receivcr. The tuned receiver incmvases the dynamic ran cc to about3 7(7 dB.
I 39

I
sion system had about 15 dB of dynamic range. We increased the dynamic range to more
than 70 dB by installing the 10-dB amplifier and by replacing the diode detectors with a 3spectrum analyzer employed as a tuned receiver as shown in Figure 19. To eliminate
electromagnetic interference (EM1) produced by the short-duration, high-current spark-gap 3pulses, and ground-loops, we installed thc signal source, amplifier, diode detectors, and
tuned receiver inside an EMI-shieldcd screen room. This eliminated all ground loops and 3EMI effects.
The timing scenario for the experiment is displayed in Figure 20. The microwave
source is gated on by the pulse generator as described above. The turn-on time is chosen to Ibe about 10 pis before the spark gaps arc triggered. This enables us to calibrate microwave
transmission losses by comparing the power transmitted through the system with tile
plasma OFF and then ON. In the ideal case of VSWIR = 1, there is no reflected power
when the plasma is OFF because the 50-ohm load absorbs all the incident power, and there 5are no reflections from the various waveguide anid coaxial components. (VSWR stands for
variable standing wave ratio; it is a inca, or," of how much power is reflected from ai
microwave transmission line system or various components.) However, the reflected
powcr actually includes the signals ici'lcctcd oi'm0i, connectors, cables, and adapters in the
transmission system. In fact, we have found that a major contribution to the reflected
power is from the coax-to-waveguide adapters, which the manufactures quotes as having a
VSWR of •1.25. This specifies an ultimate sensitivity limit of 19 d3 foIr thle reflected
power relative to the input signal. With the plasma on, the measured rellected power can
increase or decrease depending on the standing-wave pattein at the directional coupler. I
This standing-wave pattern is created by the multiple reflections of the microwave signal
from the various coaxial and waveguide components on the input side of the plassma-loaded 3waveguide section. This is because the standi'ig-wave pattern changes when the reflected
power originating from the components on the output side of the plasma-loaded waveguide
section is attenuated by the plasma. UWe performed the cloaking demonstration shown in Figure 21 to unanibiguIously
demonstrate that the microwavvc power is not reflected by tt:e plasmta. The 50-ohm load Inomlally used to terminate the transmission system is now replaced by at short. This
reflects all the microwave power that reaches the short back toward the plasma loaded 3waveguide. Before tile plasma is pulsed, the transmitted and reflected p)owers arc roughly
equal. When the plasma is triggered, both the transmitted and reflected power decrease to
very low levels thus demonstrating that the short at the end of the transmission line was
effectively cloaked by the plasnma.
40 i

III
SPARK-GAP 100 A/DIVCURRENT
PULSED 4INCIDENT3 POWER
3 TRANSMITTED 4- 0POWER
-14 dB
IIREFLECTED
0---
POWER
TIME, 51.LS/DIV
Figure 20 Timing scenario for plasma. filled waveguide cxj criment. The wicrO)wav,•sare pulsed about 10 p.s before the plasma is triggered.
I

UI
SWAVEGUiDE
-I-
LOD DTCOSVACUUM CHAMBER DETECTOR I •
PULSEGENERATOR
IULSE ITRANSMITTED -18 dB1
POWER
I
REFLECTED -23dB11POWER
TIME, 5jis/DIV II
Figure 2 1 Cloaking demonstration. The 50-olhm load normallV uscd to terminate the Itransmission system is replace with a short: microwave power reaching the.Ahort is reflected back toward the plasma-loadcd waveguide. The EM-wavcfrequency was 4.95 Gl'z, the spark-gap current was 700 A (for each ofthe four five-gap spark arrays), and the electron collision frequency was U61 Gllz.
I42

We installed the spctirum11 anallyVZer 1o tie)ICi reus th dnam1111 IC run c of the3transmi-ssion system. The spectrumII analyzer is operated as a ituned recceiver by Inhibiting
the frequency sweep and mianully,1 settin- the freqluency. We icthedi (ispl~liv the vertical3 ~ ~output from the spectrumn anzilyzer on an oscilloSCOpe tO ob'i a1ciprlreodo h
microwave power as shlowni in Figure 22. The IF' bandwidth onl the spcctruui analyzer is
3 MHz, which provides a tem1poral resoltution of ahouit 0.3 his. ''ihe Imiprovemtenlt inlI dynamic range is readily apparent. The baseline at the top of thle photo is O-dIB attentuation,
since this is the power level prior to pulsing- the(, plasmia. When the plasmna is pulsed, the3attenuation increases to 50 dB for a spark- gap) currenClt of 940 A. 'Ite noise at tihe bottom
of the oscilloscope trace is thle weak signal fromn the mnicrowave sotirce aftecr it is amiplified
by the 10-dI3 power amiplifier. [he d1\nainic range for this sNysteml is now Ž!70 d13.
We measilred the attenuation0 Of t11C mIilcr-owave sie-nIA iraMISmitte thrlough thle3plasma as a function of the electron collision treqtlienev. '[he Collision IfrClequecy 17 is
vaLried by changing the ILie-gas I esstirc. The data is shown in Iire 23 for inicrow.ave
frequencies of 4, 5, and 0 Gl Iz. The atiltination lincreases as the spark-gap cullrrent, andIhence the plasma density, is increcased. Ilic attenuation ICincrease beCauILse with higher
elecctron uknsiiics, miore cicctroirs arcý ,,,allablc for- lcc~ lcira ioubl lhev dicM wv.Another3 ~trend is that the attenuation decreases as thiul iso frequ~ency increases. This is expected
since the electron collision frequ~ency is always inrealer thian the mlicrowave frequenIC1cy ini3these experiments. 1These trenids are pre-dicted by the thenre-ic-Al riiodc I as decscribeLd inl
Section 2.5We also TmeaStireCd theC at ten at ion saI Li c ion1.101 Of theC mlIicrowveIV reltCienICY for
different plasmia densities as shlowiin 1I etigre 24- '[he ki areeSt attUCn1111 aNo isobserved for
thle lov\.CSt FM'-WaIVC fiClreq , ieicand the hig-he.st plasmaII~ dci isi tv park- a c urrentj.UThle attenuation dc:reases, at fixed iii1CrowaIvC frqCLiic11v, as" t11e f)LISiMi denlslit decre[ase:s.
We also a-ote thaZt thle atteuaion110 decreaI1,se IS th lie inerokvavercj I'-LIIC\'C Hi Cre ase 5. llesItrends are consistent with those observed ill l'igure 213. Wel enipiha.sizec that thecre is no point
where thle attenuation saturaites:, It Will COMut1iCi i to imces wlCC1S A11 tII iilcrasin e1 pIsitIIN11 den Sit v.3We riieaswedc~ thle attenuationl of, the (i-:ai1siaittedL sien1Al for- diftl wenlt plasiiia'-dcnislit
prof-iles. We prFodtIeed difteremi~t pro-ilcs , i p% Isi ii fg stca':l td 5'-gapr arrays. (Ourl pvlc 1 inimlliIar3Conclusion is that thle shaipe of p)lasiiia prIotile laN onlY ;1 111i:101 effect onl !1C tr-anlsmittedI
signal. We founlld that1 themslC iL 111Mtc1Liaiom1 is prIovide-d b\ thle dnet pila'm wIthl tile3 longest axial leng~th.
I3

IIIiI
v - 61 GIL f 5 GIIz 5i
ISPARK-G;AI
CUR R EN'rTRANSMITTED -~560 AIPOWER
700 A10 dB/DIV 8$20 A 3940 A
I
I,l T1IME, 5 ms/DIV
PLASMAON
Figure 22 Attenuation of the transmitted signal measured using a spectrum analzer roperated as a tuned receiver. The line at tile top of the trace is () dB3attenuation. The EM-wave frequency was 5 Gtliz, and the electroncollision frequency was 61 GlIz.
I44
U

60 1., = 4.0 01I1,. :; 3
50 10.
30
60
I 10
300
10
40
1 300S20
I 104 0 +1 10 JO X( 1 1( 120 IJIIIIIIII IIJ III -T -- T---I~ ~ ~ ~ ~ ~~~~~~~~~~~~1 .ig e2 te utu else t ilzvlo liii-flldwv~ie
30opinv.ci :in[e ce i n srd nrc~lsa ile
Ipabsorptden vsiv. The s~lolid crveq %is r lepr s uentII the abo ptin asclalcullaed
.45

IIII
I1 .3]I 25x 01 .11111 1 1 1 1- (
2.......... .A n, = 8.4 x 101() CM ll
.• 4 0 . ... ....... . . ... . .i. ...
7 |I30
20
I0 I
S0 I I T I I I II
3.5 4.*0 4.5 5.0 5.5 0.0 6-5
E1M-Wave trequency, Gil 33
Figure 24 Attenuation versus INmicrowavc lrctl Cuccv it• the III ana-tilled wavgtidc. IThe absorption vs. I:NI-w ave frcqtIuCIIcy is muIca:1urcd iLn III I"'flasnia-filledwaveguide expertiment for several valtICS Oft the plIsN ,nsitV. Thecollision freq~luncy' is fixed at O ()1 GI.. which co'rscpond, , a I Iclinin gaispressure of 175 Torr. T'he solid cturves? rcprcsen1t tile absorption as scalculated froill Ico)rv' I
4'() I

4.3.1. Comparison of Experimeintal Results WVith The Theoretical Model
We appiied the theoretical analysis of Section 2 to the data in F-ig ures 23 and 24
and achieved very good agreement. U. sinlg the profile 1hLown in Figt"1C 15, we otlolcd
the electron-density profile as a 22-cm-ltug plasmal o0 uniform density. I lowevcr, since
we did not have an absolute measurement of the electron density using the ILangtnmir probe,
we used a self-consistent curve-fitting procedure to deteruminc the electron tdcnsity as
described in Section .1.2.
We applied the theoretical mllodCl with the electroon-density scaling shonl in
Figure 16 to the data in Figures 23 and 24. The theoretical :tvcu rve arc superimlposcd on the
measured data in the figures. "l'hcre is c\cellcnt aercclvient hctweln CxpCrimeCtIt and thcory.
Also, since the data in i igure 23 was recorded inlependc.ntly of the diat in Iigure 2-1,
these data provide an independent, coninnalltion of lie validity of tie model anld the scalirig
relationships.
II
IiI
i 73 •.
I=

5. EM-WAVE ABSORPTION BY A PLASMA-FILLFt)E'NCLOSURE 3
In this section we describe thle operation ot a plasixia-cloaking prototype consisting
of a radar target and a plasmia SOu~rce inside at ceramic enclosure. '[he systemns design is
based on the principles described inl the previouIs sc~t(ions; In particular the plasmia Source
and gas-handling system used in the plasmna-filled watveguide experiments are redesigned
for integration into the ceramic enclosure1-. The plasmia cloaking p)rinciple wats demonstrated
by measuring the prototype's radar cross section (RCS) ili a compaict raidar ranlge that canl3
me"Iasure far-field EMI-wave interact ion with the 1tar-t wilth 0 L1 Ult i ni rfcrcice from other
struict urcs.3
5.1. The Ceramic Enclosure3The ceramic enclosure system is p)icture-d inl FigUre 25. The enclosure is 7" in
diameter at its base and 18" long from basec to tip. The wall thickness, vaie-is over. the itS
length such that microwaves inl thle trel'Cuency ranige frloim 9.5 to 10.5 GIi I,. pass thrlou~gh thle3wall with little reflect-ion. This is known ;.s the enclosure's transparency zone. A
perforated circular plate is moutnted Inside [lhe enclosure T' fr-omi Its balse. Theli [)late will3
serve as a reflector for incident radiation. Its radar cross Section 18, 19 (RCS) is given by
c~uc 4 2 C5( )
where a is the plate radius, ,ý is the radiation wavelengoth, 0 is thle observation anigle With
respect to thle plate's iioriiial vector and a =-4asin(O&) / .. As seen inl 1i-Lire 20, thle peak
RCS of 3.5 dBsni occurs for normail lincidenlce and thle RCS is rc lativclv flat over a wide
an~gular range; fromn 19=) to /W) ', the RCS vaieIs N 011oNly 2 d fl-siii. Ihe perioraions allow3
the plate to he partially tranisparent ito thle UV radia1tion trmi th ii cmprk igaps accordinrg to thle
.samle principl)e used for thle slotted WaivcgLide Ill lieC l)IlaIIi- ti11Cl ldw,1ve guide experIimen~lts
(See Section 4).
A slpark -gap) array IS m1oun 1ted 2'' behlin d the i-cflee or pla~te. Its plurpose is toW
produce the U V radiationl which will i-onize (lie -,as t11in xtuc inside: tile ec ilosure- and crea-te
the plasmia. The spark gap~s, shown in 1IHC i-ur 7, arc lirrianicd HInM MwO CIreI isof5 Spark
gaps each placed along at circularll curveY- ot1 a1 M111Cerncsbtae A l1Ii V0li W leadI IS
4 8U
IIIIII
I
U
I
IIIU Figure 25. Phisnia-lilled ceramic enclosure
I 49
U
IIIIII
63
f= 8 Gllz4 . ............. .. .... ...... ...... ...... .. ... . .. ..... .... ... .. .... ... ..... f = 10 G ltz . . .I
f= 12 GI z1
° I•" -2 . .............. ..... .... ...... ........ ........... :,-"............... ....... ......... ....... ........
-8 . ........ ......... ..... ... .... ..... ... . ...... .... ..... ... .. ... ... ... .... .. ....... .. ". ....... ... .. I
-10 " " I0 5 10 15 20 25
Angle of Incidence, Degrees 3
Figure 26. Radar cross section of circular plate. The RCS of the 5" diameter circularplate is calculated for :a frequencies of 8, 10 and 12 GIltz. it is seen that tiheRCS changes very little for angles of incidence less than 53" thus indicatingthat the alignment is not critical for RCS measurements.
50
IIIIIIII s�'S
IIIIIIIIU
Eiwre 27. Spark gap assembly
I51

II
connected to one end of the spark-gap array and a return line is attached to the other side.
Switching is performed by a 20kV-100kA ignitron switch. When tile high voltage is Iturned on, the large voltage difference on the spark gaps causes the gas mixture in the gap
to break down, thus allowing current to flow from a bank of discharge capacitor through 3the spark gaps. In our experiments, a 1-.tF capacitor, charged to 10 kV was connected to
each spark-gap circuit. During the high-voltage pulse, the current reached a peak value of
3000 A in 4 gisec and then decayed with a half-life of 20 p.sec. Each spark gap consisted
of a 0.25" spacing between tips and each tip was made fr-om 0.060" tungsten with a 400
cone ground on each end. IThe spark-gap array and the reflector plate arc mounted as an integral unit on the
ceramic enclosure's back flange. The spacing between the components is critical because 3too-small a spacing would lead to high voltage breakdown occurring in undesiredlocations. High voltage feedthroughs for spark-gap operation, a vacuumL pumping port, 3gas feedthroughs for maintaining the proper gas mlixture and diagnostic feedthroughs formeasuring plasma density and providing feedback on tile device's operation are all mounted
on the enclosure's back flange. When the device was operated inside the compact radarrange, all connections except the hilgh-volta-e lines re valved off and disconnected in order
to reduce spurious reflections that would reduce measurement's dynamic range and the Ieffects of the plasma cloaking. I5.2. The Compact Radar Range
The compact radar range located at the Microwave Products Division of Hughes IAiicraft was designed specifically for RCS and antenna measurements. Equipped with a
March Microwave reflector system, this range provides test zones as large as to 6 feet overthe frequency rnige of 4 to 100 Gl lz. T'he test zone, also called a quiet zone, is the areawhere the radiation pattern closely resembles a plane wave incident from a distant source, 3thus allowing far-field measurements to be made in relatively small spaces.
The chamber measures 25' wide by 19.5' high bv 55' long and is fully lined with 3Rantec anechoic material which effectively absorbs any radiation at the walls and prevents
multiple reflections from interfering. with the macasurement in progress. The chamber
background levels within tile 6' test ,.onc arc better than -55 dBsiii firon 4 to 8 tllz and-60 dBsm from 8 to 18 Ghz. Targets for RCS ineasureimcnt are typically placed on a 10'
high, low RCS, tapered foallm COIluImn1.a)
I52I
S 40 ............ ..
~35 v .1 30
b)
S-5
I vioU-15
C)
U 0
-2
I4 6 8 1( 12 14 16 18[reIucvjI1I\, Gilt
1Figure 28. Ceramic enclosure R CS Calibration. In order to determine thle absoluteRCS of the eclICosure svstem, we measuired the radair return from thleSystem with no0 Plasma present as shown in a). The gaps InI thle data cnrvesIrepresent the pain differences in thle horns used to produLce thle var[iouIsSegments. The dataI inl a) IS then compare11-d to thle reCturn from an object of'known RCS. in this case a 14" metal Sphere was used. The result is thle
to(I- thle mlicrowave refllector wit h' n thle enclosure.
enlouesasout CSsow i ) sd ~s.Fiue ) ltste3C
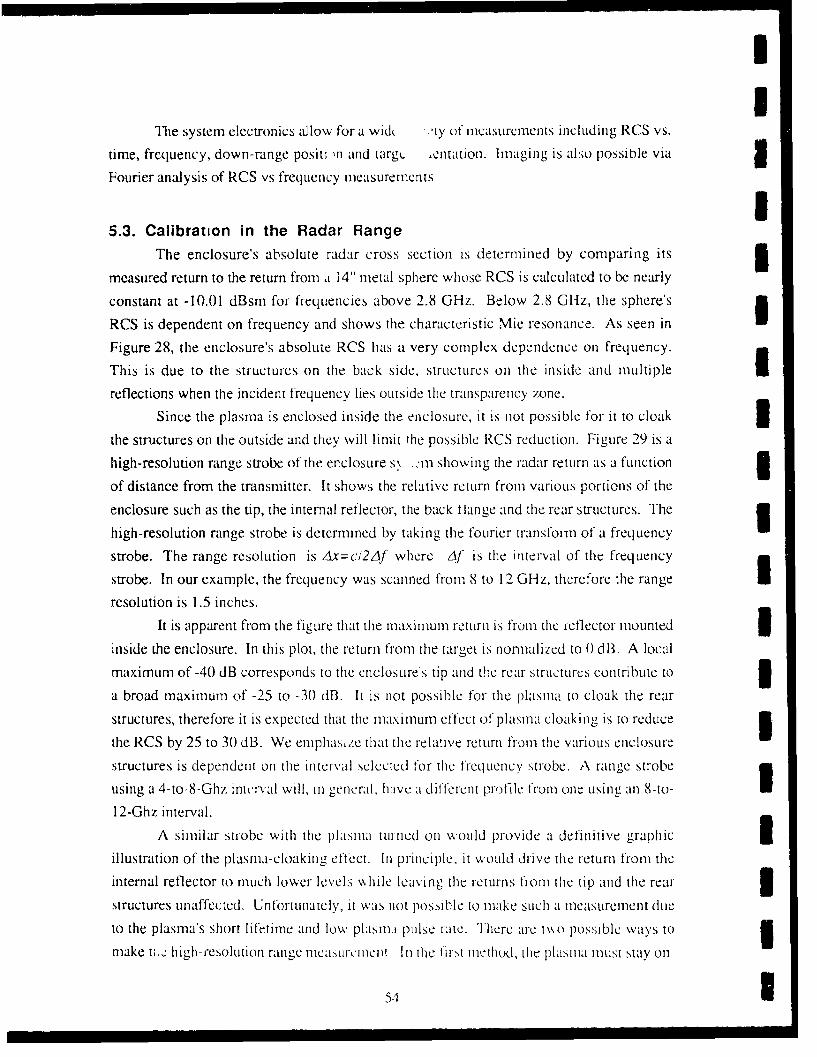
II
The system electronics allow for a widt ty of mncasurcments including RCS vs.
time, frcquency, down-range positi :n and targ. ,cntauion. hmaging is also possiole via 3Fourier analysis of RCS vs frequency measurements I5.3. Calibration in the Radar Range
The enclosure's absolute radar cross section is determined by comparing its 3measured return to the return from a 14" metal sphere whose RCS is calculated to be nearly
constant at -10.01 dBsm for frequencies above 2.8 (GHz. Below 2.8 Gltz, the sphere's
RCS is dependent on frequency and shows the characteristic Mie resonance. As seen in
Figure 28, the enclosure's absolute RCS has a very complex dependence on frequency.
This is due to tile structures on the back side, structures on the inside and multiple
reflections when the incident frequency lies outside the transparency zone.
Since the plasma is enclosed inside the enclosure, it is not possible for it to cloak 3the structures on the outside and they will limit ,he possible RCS reduction. Figure 29 is a
high-resolution range strobe of the enclosure s\ .:m showing the radar return as a function 3of distance from the transmitter. It shows the relative return from various portions of the
enclosure such as the tip, the internal reflector, tile back flange and the rear structures. The
high-resolution range strobe is determined by taking the fourier transform of a frequency
strobe. The range resolution is Ax=ci2AJ' where Af is the interval of the frequency
strobe. In our example, the frequency was scanned fronm 8 to 12 GHz, therefore the range
resolution is 1.5 inches.
It is apparent from the figure that the maximum return is from the reflector mounted 3inside the enclosure. In this plot, the return from the target is nonmalized to 0 dB. A local
maximum of -40 dB corresponds to the enclosure's tip and the rear structurcs contribute to 3a broad maximum of -25 to -30 dB. It is not possible for the plasmna to cloak tile rear
structures, therefore it is expected that the maximum effect of plasma cloaking is to reduce 3the RCS by 25 to 30 dB. We emphasze that the relative return from the various enclosure
structures is dependcnt on the interval selected for the frequency strobe. A range strobe
using a 4-to-8-Ghz ini.rval will, in general, have a different pr,)fil from one using an 8-to- I12-Ghz interval.
A similar strobe with tihe plasma turned on would provide a definitive graphic Iillustration of the plasma-cloaking effect. In principle, it would drive the return from the
internal reflector to much lower levels while leaving the returns from the tip and the rear 3structures unaffected. Un tbrt unate ly, it was not possible to make such a mcasurement due
to the plasma's short lifetime and low plasmai pulse rate. Tl'ere are two possible ways to 3make t;n high-resolution range mcasurcni ne n In the fir,,st meth1old, the plasnia mSut stay oni
54 1

Microwave Reflector Metal Shroud
3 Ceramic Enclosure
* -20
3 -40
U 20 0 20 40 60 S
D~istance from 'l'p ot linelosm-c ce m
Figure 29. H-igh-resolution r-anee StIobC ofkcrai-1c ecllCOSurew. A I -d ange1, Strobe Ofthe ceramic enclosuire with the plasisa OFF reveals that [the mlicrowa,',vereflector is the higeIeSt contri-bUtor to its RCS. Smaller contribut10ios come1from the tip (-4(0 dB3), the metal flang~e (-20(1 13) and the rcar stru-Lctures (-20)to -40 dB3). Since it is im1possible to U.se theC lflaSma to attenuiate SignalsUfrom exterior struLctures, the plot range scan predicts that the RCS cani bereduced by a m1aximum11 Of 220 to 30 d13.
I5

II
at a constant intensity For the duration of the range strobe, a imnimum of 100 P.scC. In tile
second method, the plasma is pulsed at the same rate as the radar transmitter whoseminimum pulse rate is (1000 1tz. In our experiments, the plasma source is capable pulsing
at a maximum of 1 tlz while the plasma density changes rapidly throughout its lifetime,
thus making synchronization by either method impossible.
Additionally, a high-resolution range strobe with the plasma on could be pertormed
by sending a radar pulse of very short duration aiid gating the receiver to look for the pulseat a time corresponding to reflection from a patrticular dist!.:: e. By varying the gate timing,it would be possible to produce a return vs. distance measurement. The duration of the
pulse must be as short as the desired resolution, i.e. Ar=c/IA. For ArL=.5" resolution,
the pulse width must be 27 picoseconds, well beyond the capability of the N'MMS-30() radarsystem whose minimum pulse duration is 5 nanoseconds corresponding to a pulse length
of 5 feet. 3
5.4. The Cloaking Measurement 3As discussed in the previous SC. , to synchronize tile plasma
source with the radar transmitter during a 1ic..' ..! Therefore, the effects of the 3plasma cloaking vs. frequency are measured by singk' .not methods where each shot ismade at at different frequency. Each measurement is made by transmitting a burst of radar
pulses with a 400-ktlz repetition rate throughout the plaIsma's lifetime. The return fromeach radar pulse is measured as at l)hase and an amlplitude. Fignires 30-a and 30b show a-typical set of data for the phase and amplitude of the radar return from the enclosure du.ing
a single plasma pulse. Each data point on the plots correspondls to a single radar pulse.
During the time from 0 to 16 Fisec, the plastla is turned oif and the radar return is constant 3at -5 dBsm. At 16 ýtsec, the spark-gap current pulse is initiated and the plasina forms in the
enclosure as evidenced by the decrease in RCS from -5 dl3stn at 16 [tsec to -27 d3sm atx 20 3[sec - an RCS reduction of 22 dB. Determination of the peak RCS reduction is affected by
the low radar-pulse repetition frequency. The phase is likewise affectcd by the pia.ma Iformation.
Figure 30c plots the rk-gap current daring the p)lasna l-I', c. \ A•,I I n riied to 3the RCS measurement in Figure 30a, it is .seen that plasma/ ,.iatitott b0gins it the onset of'the current pulse. However, thl peak plasma density is asrhicved at a tilm del ayed with
respect to the peak spark-gap cu-rent because tile )lasma density acctnllatcs throughout Ithe current pulse due to a finite electron ion recombination ratc. If the rcconibi nation
I556 I
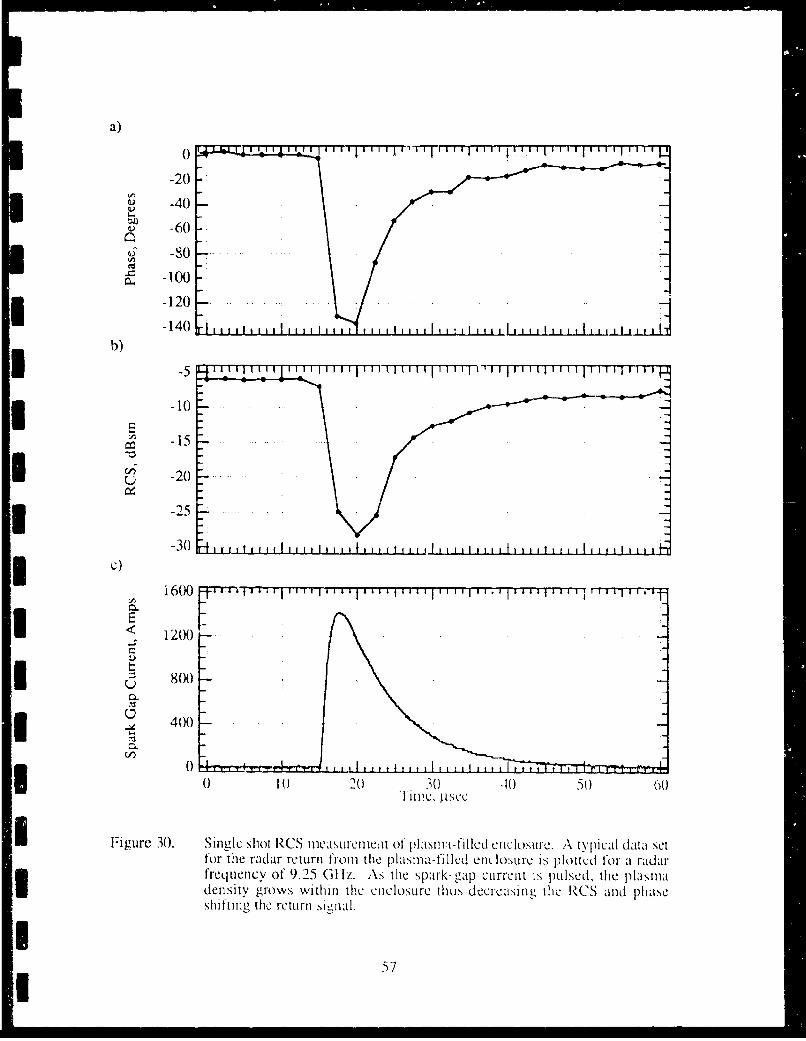
a)
-20
S -40
S -60d -80
"~ -100
-120
-140 5'i,,,,LLLLIi,,,LL,,b)
-20_UE -10 ---••' •--* :
-15
-30
$. 12X20)C
I~8M0!I_
00 10.. -1 0 50 60
I| • Time P) -
*Figure 30. Single shlot RCS me1asurclmeiluof plasm-t-filed eculosure. A typical data set
frequtenlcy of 9.25 (it iz. As the spark-gapill current is pulsed, thle plIsIma3density grows within th1C eclCosure thuLS deCere aSi n g t 'e RCS an11d 1 hshifting flcrcturn s nl
5..
I

II
rate were iero, then. the plasma density would increase whenever current flowed through
the spark gaps and would never decrease.
Several sets of data such as the one shown in Figure 30 were produced covering
the frequency range from 4 to 14 (3hz. Figure 31 displays tile results of the measurementsC 3by plotting the peak RCS reduction vs frequency. There is considerable structure present
in the graph; much of it is due to) multiple reflections within the enclosure while a
contribution is caused by resonances with external structures. The RCS reduction in the
enclosure from 9 to 11 Ghz is relativety flat because that is the enclosure's transparency
zone. In that range, the enclosure is designed to allow EM transmissions to pass through Iunhindered by reflections at the enclosure's surfaces, thus eliminating the possibility of
multiple reflections. In principle, it would be possible to design tile enclosure with the 3transparency zone anywhere.
When comparing Figures 31 and 8 it is not obvious why their diould be so many 3peaks in the enclosure's RCS reduction. After al!, Figaire 31 and Equation (24) show that
the resonant absorption only occurs for coincident choice of the plasma parameters and the
front-interface reflectivity. A simple explan ation is that the plasma density is neither
constant nor unifom within the enclo-ure. A , the density rises to its peak, both the rea!
and imaginary parts of the EM-wave propagation constant are changing, thus making it Imore likely to satisfy the conditions for resonant absorption. The other feature of Figure
31 seeking explanation are the dips in the enclosure's RCS reduction. If we assume that
the ambient extraneous reflectivity is -20 dB, then most of the dips are within the range of 6
dB from that and may be explaincd as part of the internal reflections model. 3Some of the dips extend much farther than 6 LIB and they are probably due to multiple
reflections from external structurcs.
IIIII
-, I
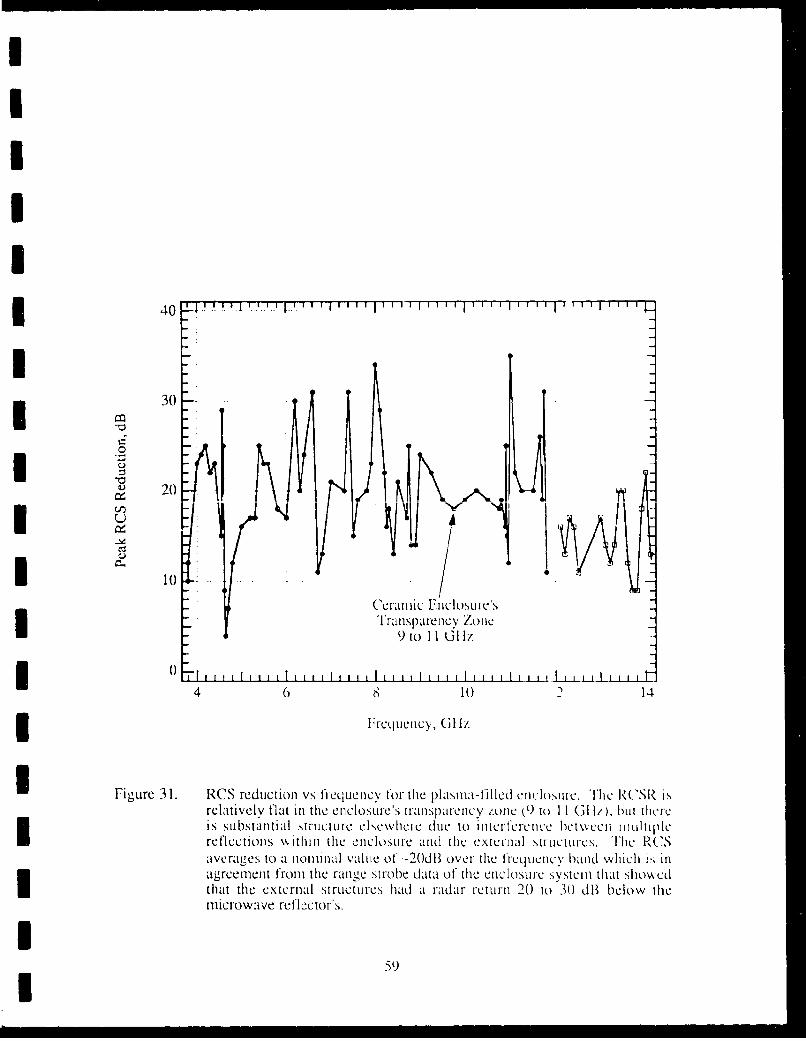
I4
30
20N
(kranuc Fil losuie sI ranspaleient ZbIe
9 to I161 GIl
I i i I i I 1 1 1 1 1 1 1 1 1 1 1 1 t
4iii 6 8 1( 14
UFigure 3 1. RCS reduction VS frequeneIIC tOr the plasma-huiled en~closItmec. The RCSR isrelatively v fat Ill the enIclosure's transp~arency zonec (9) to 1 I (31 1, ).hill 11Crcis substantial srctu-Itl- me eseWherIe due to m umemfere nec em weenl lill tip IcIreflections %%ithiiii the enclosure and theC externacl StruLcturesC. TIhe R'CSaveragzes to a noimi nal value of --2(IOd 1 over the freqjuency hand Which is inlagreement fronm the ran kT Str-obe data Of the eclCOSure- SN stInII that soeI that thc external struIctures.I had a radar return 2() to d( lB below themicrowave reflector's.
.59

6. REFEIRENCES
I Ginzberg, V.L. The propagation oj'electromnagnetic waves in phismas (PergatiniuoriPress, New York, 1970).
2. Vidmnar, Ri. Generation and properties oJ tenuous pi1asma bodie's (it atmosplwrupressure , Annual Report, AF'OSR Contr~act No- F49020- 85- K-00 13 ISRIInternational, 1988).
3. Vidmiar, R.J IEEE Plas.Sci. 18, 733 (1990).4. V idniar, R.1. P'laisma clo~aking: air cemz~isvtr 'v, hroCadhtifl absorption and plasmaI
generation. Final Report, AFOS R Contract No- F49020-85-K-0()1 3 kSRIInternational, 1990).
5~. Stenzel, R.L., A.Y., W. & Kim, Il.C. Phys. Rev'. Lett. 32. 054 (1974).I6. Huddlestone, R. & Leonard, S. Plasma diagnostic techniques (Academic P1ress,
New York, 1965).7.Mathews, J. & Walker, R.L. Mathematical Methods Of Phy1ýsics. 1-501
(Ben~jamiin/CL1mm i1ngs, Menlo Park, CA, 1970).8. Budden, K.G. I-li propagation of radio waves (Cambrid-c UL'iversitv Pes
Cambridge, 1985).I9. Yariv, A. Initroduiction to Op)tical Electronics. 1-342 (11olt, Rinehart and Winston,
Inc., New York, NY, 1971).I10. Lind, R. Investigation of Ultraviolet photoioization sustained discharge !01r gaýs
lasers. Final Report. Contract No. N(X)) I4-73-C-0287, (HUghes Research Lahs,Malibu, CA, 1976).3
11 . Weissler, G.L. in Encyiclopedia of Physics (eds. Finu~ge, S.), ). 32.3, (1956).12. Schonhuber, MTJ IEEE Trans. Power Apparatus anid S-vstemns 88, 100 (1909).
13. Cookson, A.Il., Proc. lEE, 117, p. 2 6 9 (1970).U14. Hopkins, D.fl. Design considerations and data for .ias-insulated high voltage
structures (IEEE, 1975).1.Chen, C.C. IEE-.E Trans. Micro. Iheory and Tech. M'1T-2 1, 1 (1973).
10. Eisenhart. R. (1989).17. 'tikawa, Y. Ph)'sics oj'Fluids 16, 831-835 (1973).31 8. Knott, RE., i.E., S. & Tuley, M.T. Radar Cross .Scctioti (Aicrtec I louse, Denham.
MA, 1985).11). Tuck, G.T. Radar Cross Section Handbook (PClenum Press, New York, 1970.
60)
ACKNOWLED)GMENTS
I Numerous people contributed to the success ot this programi. The authors of this
report would like to extend our thanks and gratitude to Roland Fleig. H ayden (iallagdici
I and Karl rroesken of thc liughes Research Labs for their innovative ideas and relemiifss
troublestimoting. Thanks to Robin H arvey , also of 1IR L, Dave Whelan of RS(G and J av3 ~Palmer, now at NOAA, for illuminating dliscussions that lead to experimental realities. Bob1
Eiisenhart of 1-AC's Missile Systems Giroup was instrumental in making [hIls PrO0erain1
proceed with ease; wt- would like to acknowiedge hIls invaluable expertise that hie applied to
designing and fabricating the slo tted waveguide used iii the plasnia-filled waveguidc
experiments, lie also donated the ceramic enclosure for the plaSm~a-filled eclICosure-
experitienis. Several people at the Radar Systems Group su~ppliedI fantastic services to uISwhile we conducted the RCS meaisurements at the compact radar range. They arc lDoiI ~Williams, Edwin Lee and Ray Samtos. Our thanks to all.
I6