© Copyright McGraw-Hill 2000 9-1 CHAPTER 9 Testing the Difference Between Two Means, Two Variances,...
37
© Copyright McGraw-Hill 2000 9-1 CHAPTER 9 Testing the Difference Between Two Means, Two Variances, and Two Proportions
-
Upload
willis-bennett -
Category
Documents
-
view
226 -
download
0
Transcript of © Copyright McGraw-Hill 2000 9-1 CHAPTER 9 Testing the Difference Between Two Means, Two Variances,...
© Copyright McGraw-Hill 20009-1
CHAPTER 9
Testing the Difference Between Two Means, Two Variances,
and Two Proportions
© Copyright McGraw-Hill 20009-2
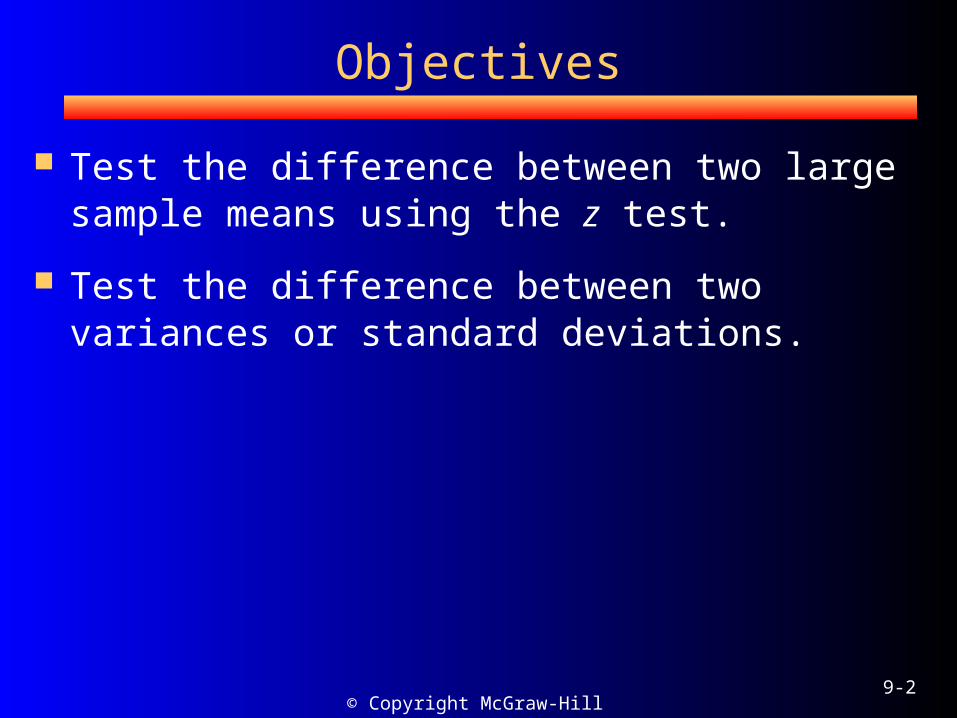
Objectives
Test the difference between two large sample means using the z test.
Test the difference between two variances or standard deviations.
© Copyright McGraw-Hill 20009-3
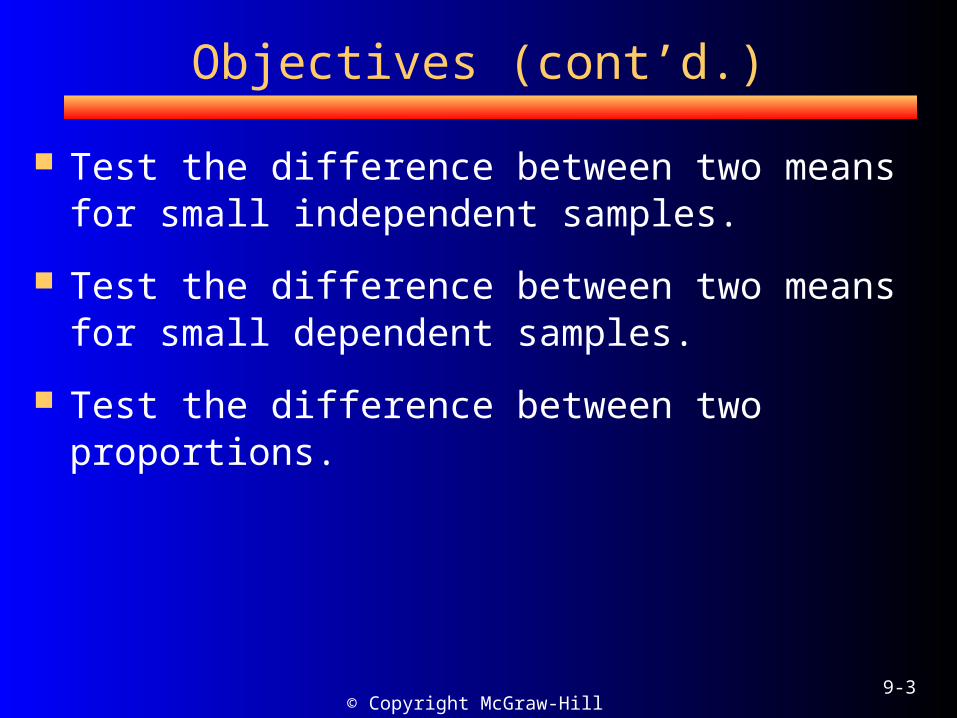
Objectives (cont’d.)
Test the difference between two means for small independent samples.
Test the difference between two means for small dependent samples.
Test the difference between two proportions.
© Copyright McGraw-Hill 20009-4
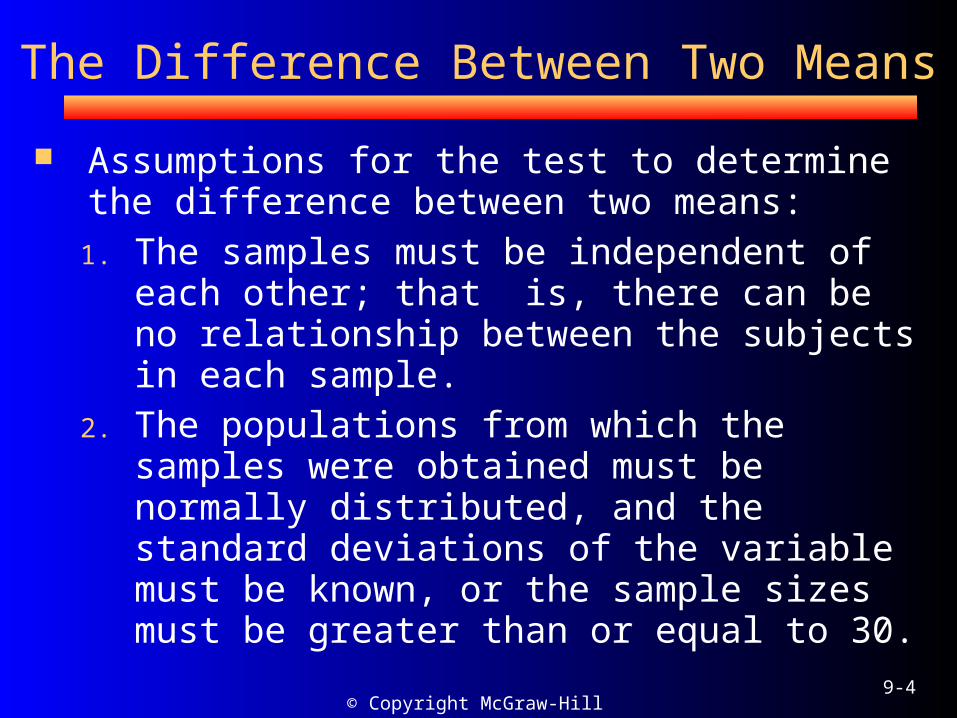
The Difference Between Two Means
Assumptions for the test to determine the difference between two means:1. The samples must be independent of
each other; that is, there can be no relationship between the subjects in each sample.
2. The populations from which the samples were obtained must be normally distributed, and the standard deviations of the variable must be known, or the sample sizes must be greater than or equal to 30.
© Copyright McGraw-Hill 20009-5
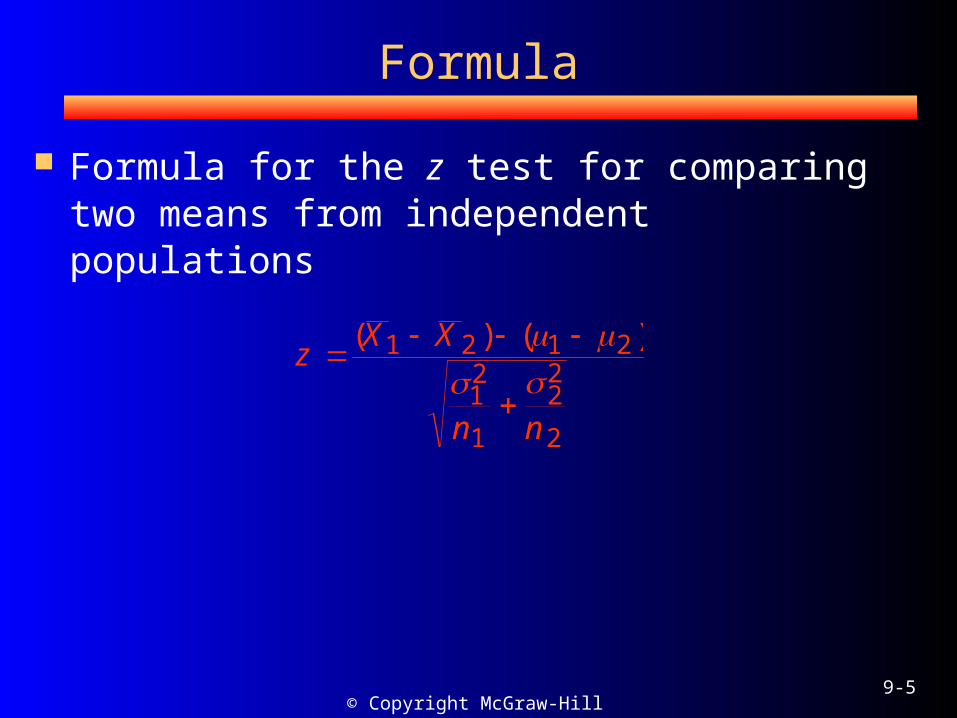
Formula
Formula for the z test for comparing two means from independent populations
zX X
n n
( ) ( )1 2 1 2
12
1
22
2
© Copyright McGraw-Hill 20009-6
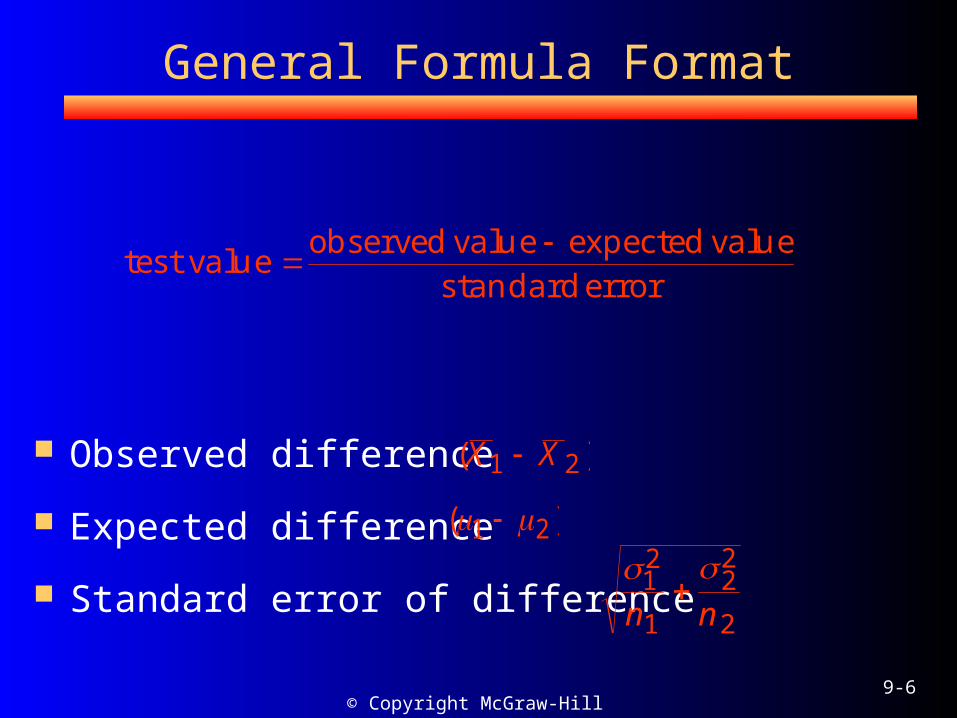
General Formula Format
Observed difference
Expected difference
Standard error of difference
test valueobserved value expected value
standarderror
( )X X1 2
( ) 1 2 1
2
1
22
2n n
© Copyright McGraw-Hill 20009-7
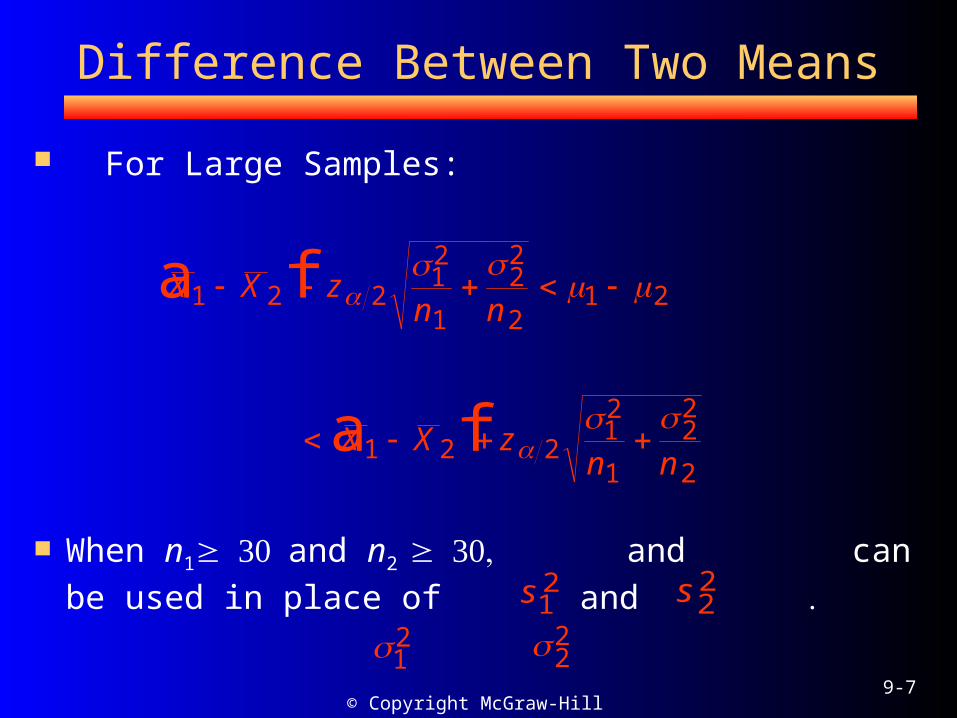
Difference Between Two Means
For Large Samples:
When n1and n2 andcan be used in place of and
X X zn n
X X zn n
1 2 212
1
22
21 2
1 2 212
1
22
2
a f
a f
s12
12
s22
22
© Copyright McGraw-Hill 20009-8
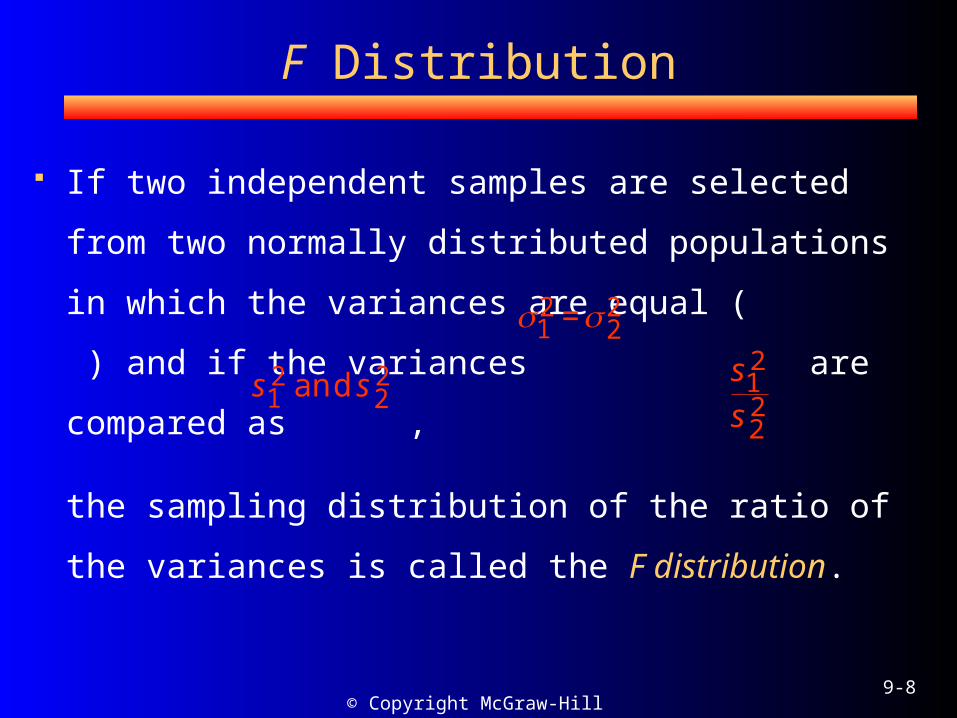
F Distribution
If two independent samples are selected
from two normally distributed populations in
which the variances are equal ( ) and if
the variances are compared as ,
the sampling distribution of the ratio of the
variances is called the F distribution.
12
22=
s s12
22and s
s12
22
© Copyright McGraw-Hill 20009-9
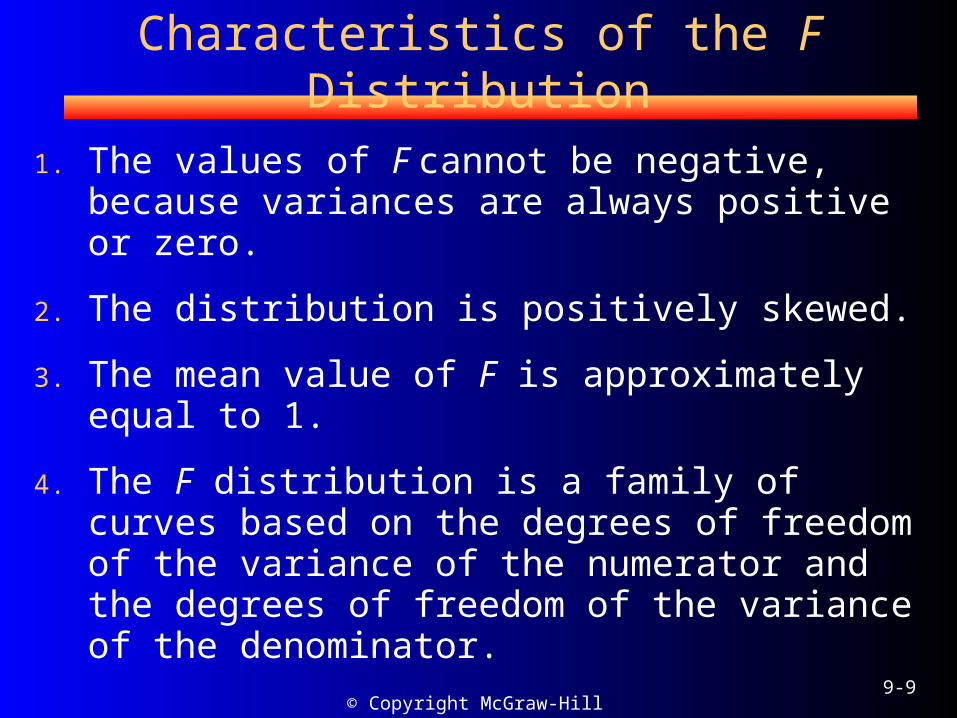
Characteristics of the F Distribution
1. The values of F cannot be negative, because variances are always positive or zero.
2. The distribution is positively skewed.
3. The mean value of F is approximately equal to 1.
4. The F distribution is a family of curves based on the degrees of freedom of the variance of the numerator and the degrees of freedom of the variance of the denominator.

© Copyright McGraw-Hill 20009-10
Formula
The F test:
where is the larger of the two variances.
The F test has two terms for the degrees of freedoms: that of the numerator, n1–1, and that of the denominator, n2–1, where n1 is the sample size from which the larger variance was obtained.
Fss
12
22
s12
© Copyright McGraw-Hill 20009-11
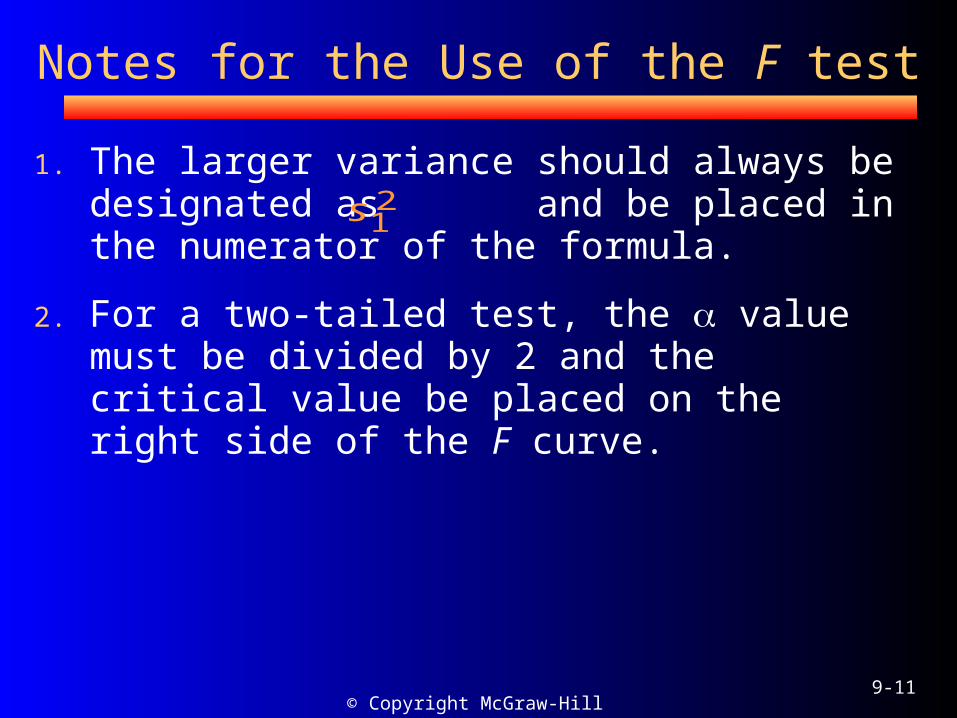
Notes for the Use of the F test
1. The larger variance should always be designated as and be placed in the numerator of the formula.
2. For a two-tailed test, the value must be divided by 2 and the critical value be placed on the right side of the F curve.
s12
© Copyright McGraw-Hill 20009-12
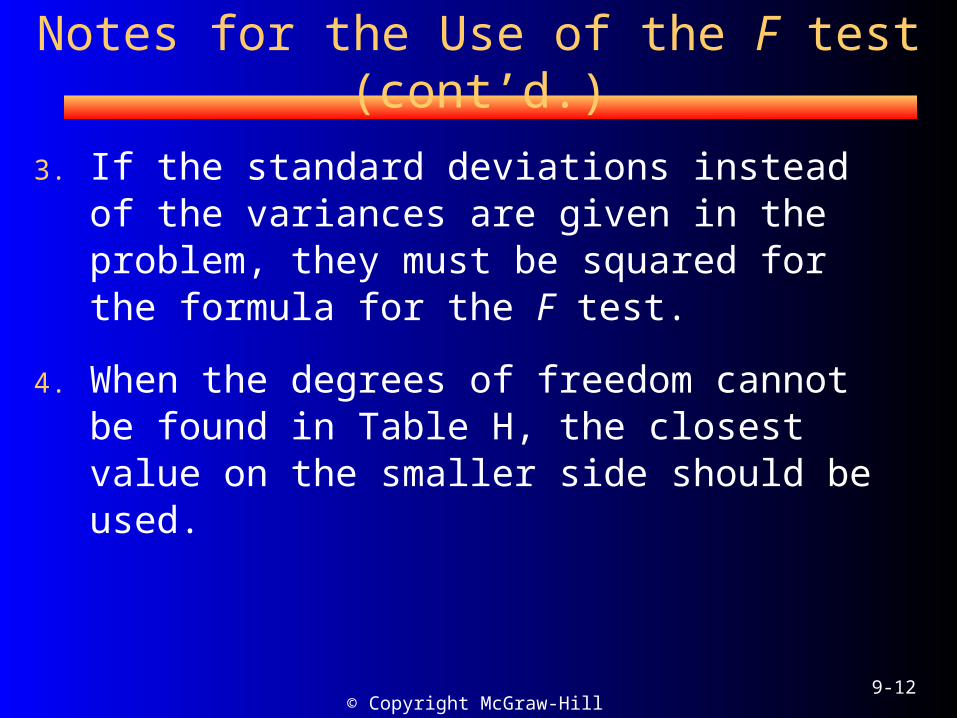
Notes for the Use of the F test (cont’d.)
3. If the standard deviations instead of the variances are given in the problem, they must be squared for the formula for the F test.
4. When the degrees of freedom cannot be found in Table H, the closest value on the smaller side should be used.
© Copyright McGraw-Hill 20009-13
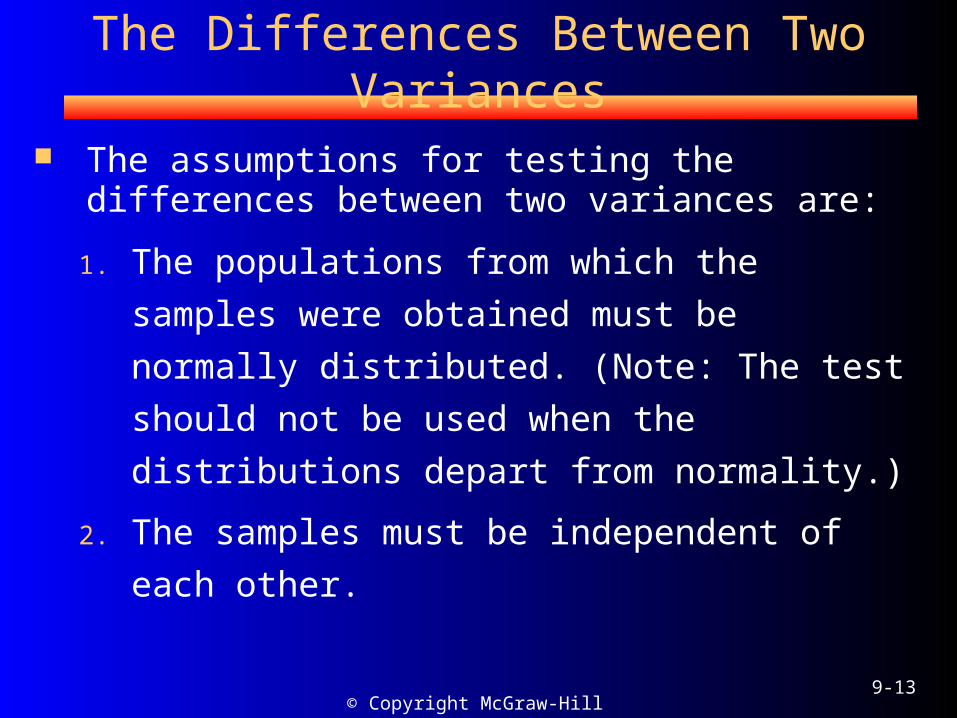
The Differences Between Two Variances
The assumptions for testing the differences between two variances are:
1. The populations from which the samples
were obtained must be normally
distributed. (Note: The test should not be
used when the distributions depart from
normality.)
2. The samples must be independent of
each other.
© Copyright McGraw-Hill 20009-14
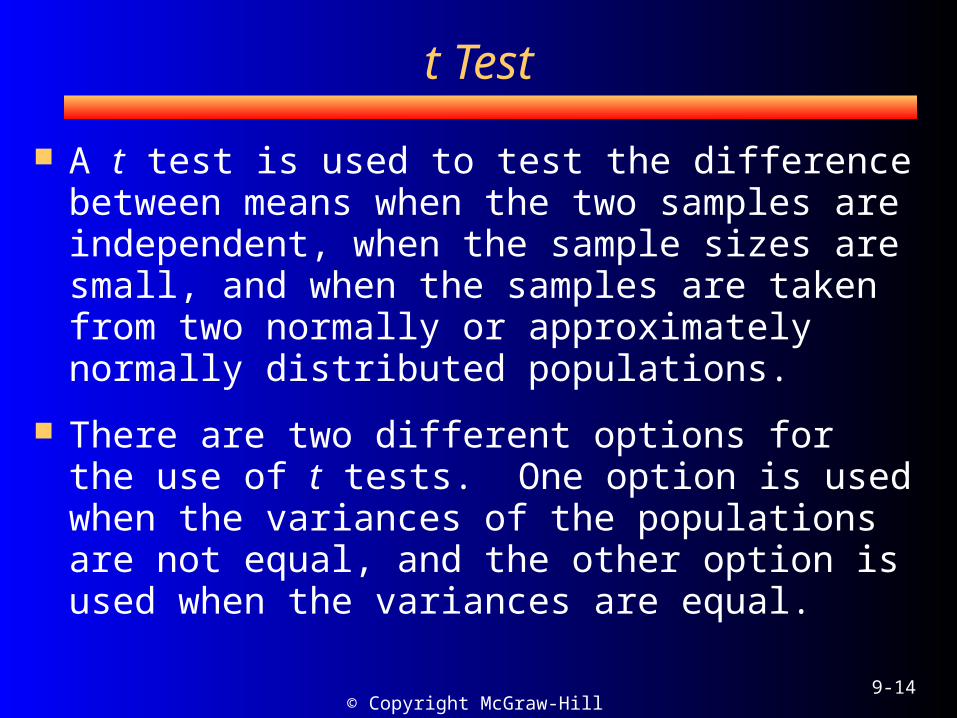
t Test
A t test is used to test the difference between means when the two samples are independent, when the sample sizes are small, and when the samples are taken from two normally or approximately normally distributed populations.
There are two different options for the use of t tests. One option is used when the variances of the populations are not equal, and the other option is used when the variances are equal.
© Copyright McGraw-Hill 20009-15
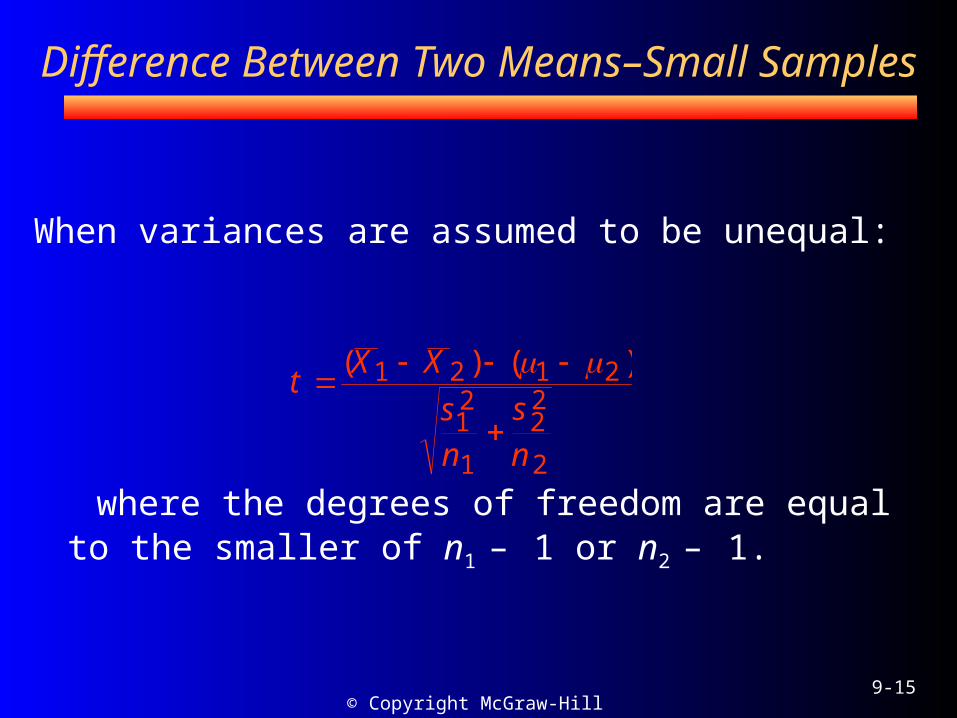
Difference Between Two Means–Small Samples
When variances are assumed to be unequal:
where the degrees of freedom are equal to the smaller of n1 – 1 or n2 – 1.
tX X
sn
sn
( ) ( )1 2 1 2
12
1
22
2
© Copyright McGraw-Hill 20009-16
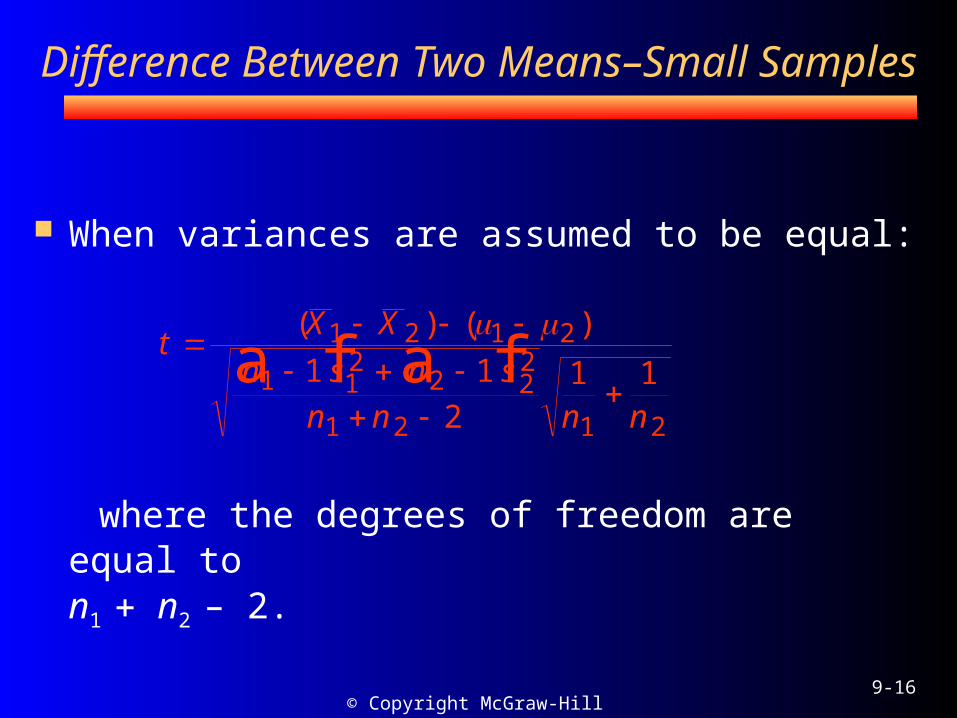
Difference Between Two Means–Small Samples
When variances are assumed to be equal:
where the degrees of freedom are equal to n1 n2 – 2.
tX X
n s n sn n n n
( ) ( )1 2 1 2
1 12
2 22
1 2 1 2
1 12
1 1
a f a f
© Copyright McGraw-Hill 20009-17
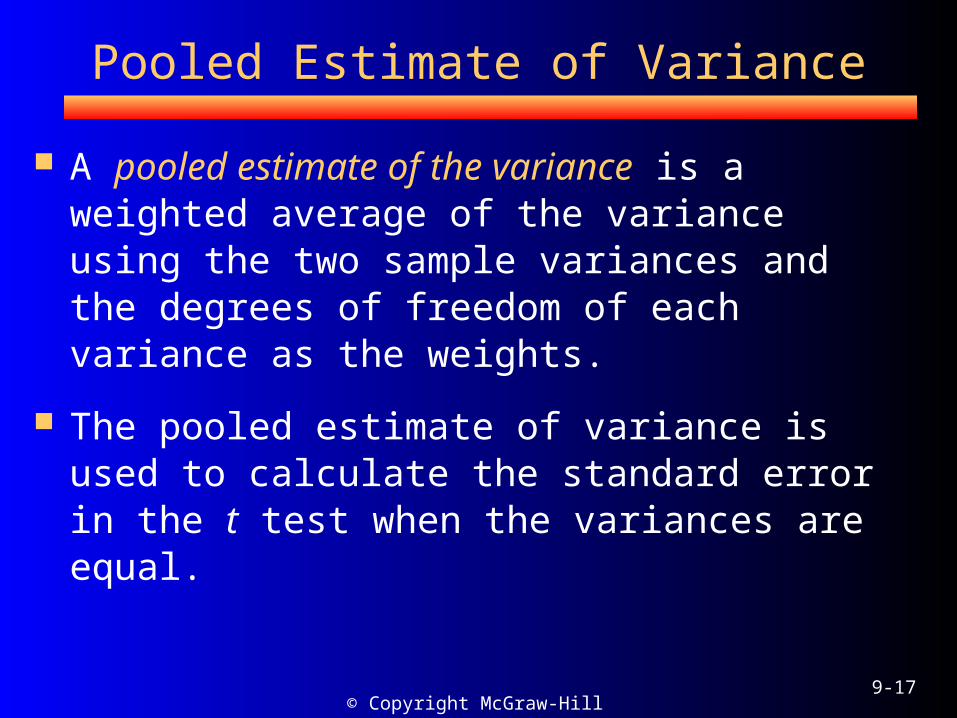
Pooled Estimate of Variance
A pooled estimate of the variance is a weighted average of the variance using the two sample variances and the degrees of freedom of each variance as the weights.
The pooled estimate of variance is used to calculate the standard error in the t test when the variances are equal.
© Copyright McGraw-Hill 20009-18
Note on the t test
To use the t test, first used the F test to determine whether the variances are equal. Then use the appropriate t test formula. This procedure involves two five-step processes.
© Copyright McGraw-Hill 20009-19
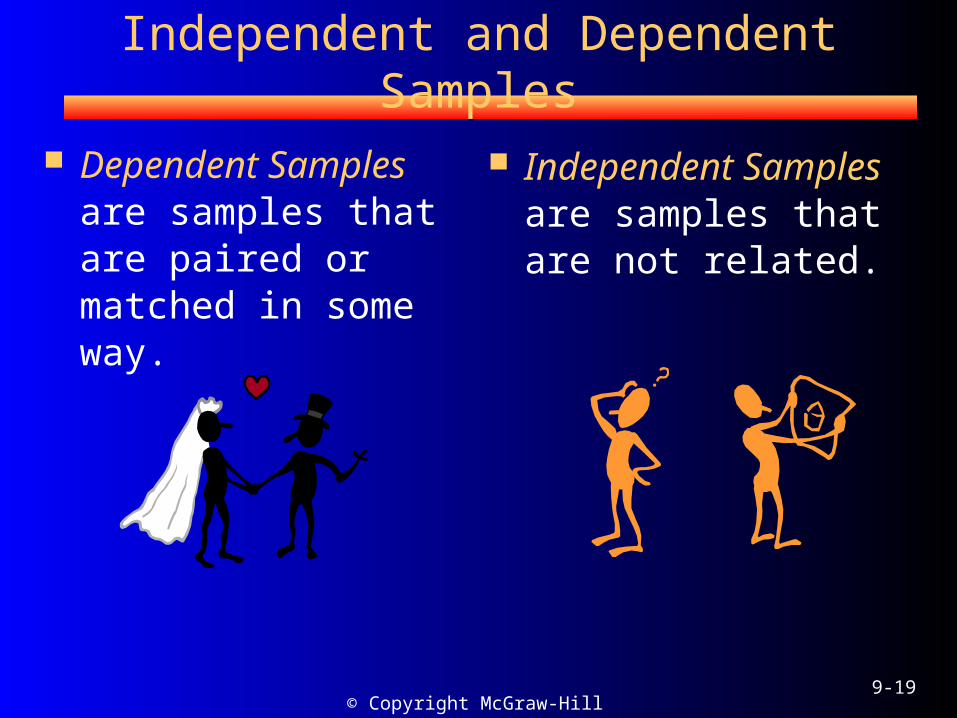
Independent and Dependent Samples
Dependent Samples are samples that are paired or matched in some way.
Independent Samples are samples that are not related.
© Copyright McGraw-Hill 20009-20
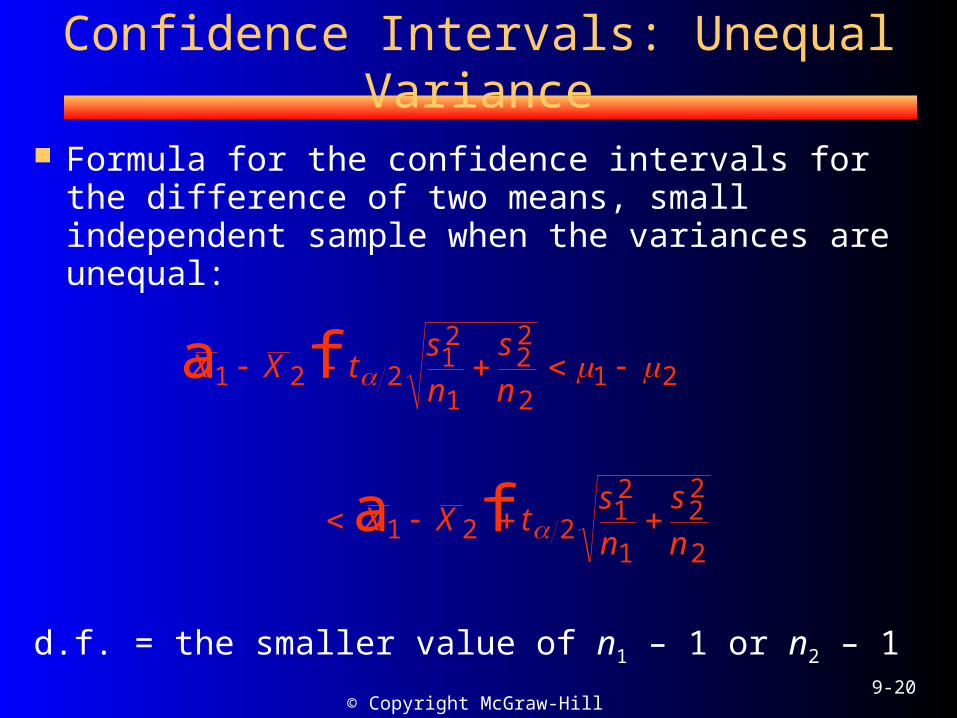
Confidence Intervals: Unequal Variance
Formula for the confidence intervals for the difference of two means, small independent sample when the variances are unequal:
d.f. = the smaller value of n1 – 1 or n2 – 1
X X tsn
sn
X X tsn
sn
1 2 212
1
22
21 2
1 2 212
1
22
2
a f
a f

© Copyright McGraw-Hill 20009-21
Confidence Intervals: Equal Variance
Formula for the confidence intervals for the difference of two means, small independent sample when the variances are equal:
d.f. = the smaller value of n1 + n2 – 2
X X tn s n s
n n n n
X X tn s n s
n n n n
1 2 21 1
22 2
2
1 2 1 21 2
1 2 21 1
22 2
2
1 2 1 2
1 12
1 1
1 12
1 1
a f a f a f
a f a f a f
© Copyright McGraw-Hill 20009-22
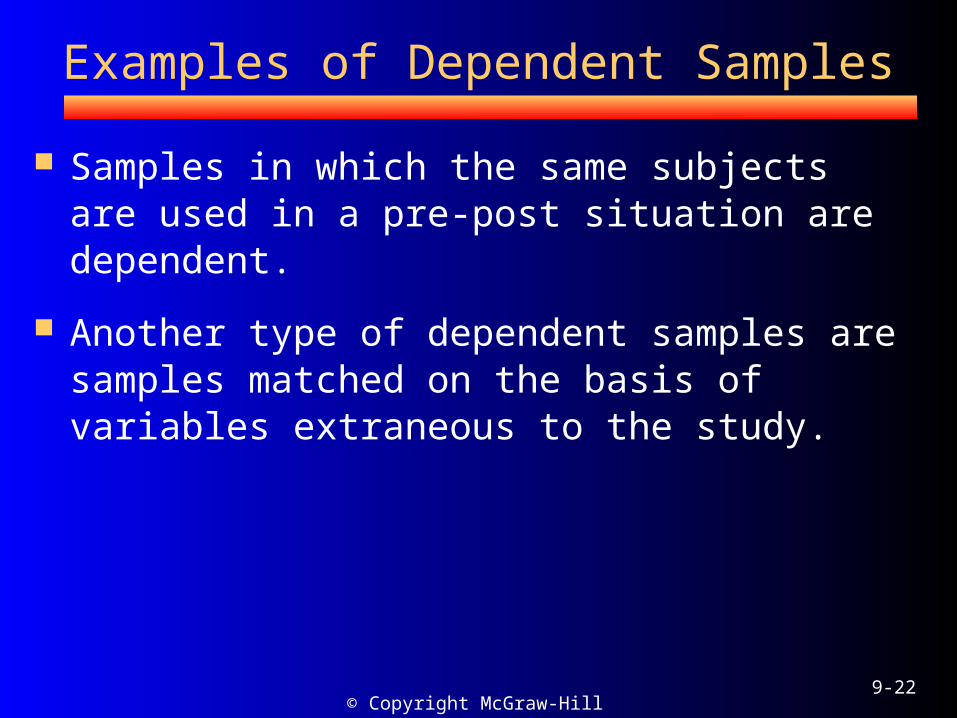
Examples of Dependent Samples
Samples in which the same subjects are used in a pre-post situation are dependent.
Another type of dependent samples are samples matched on the basis of variables extraneous to the study.
© Copyright McGraw-Hill 20009-23
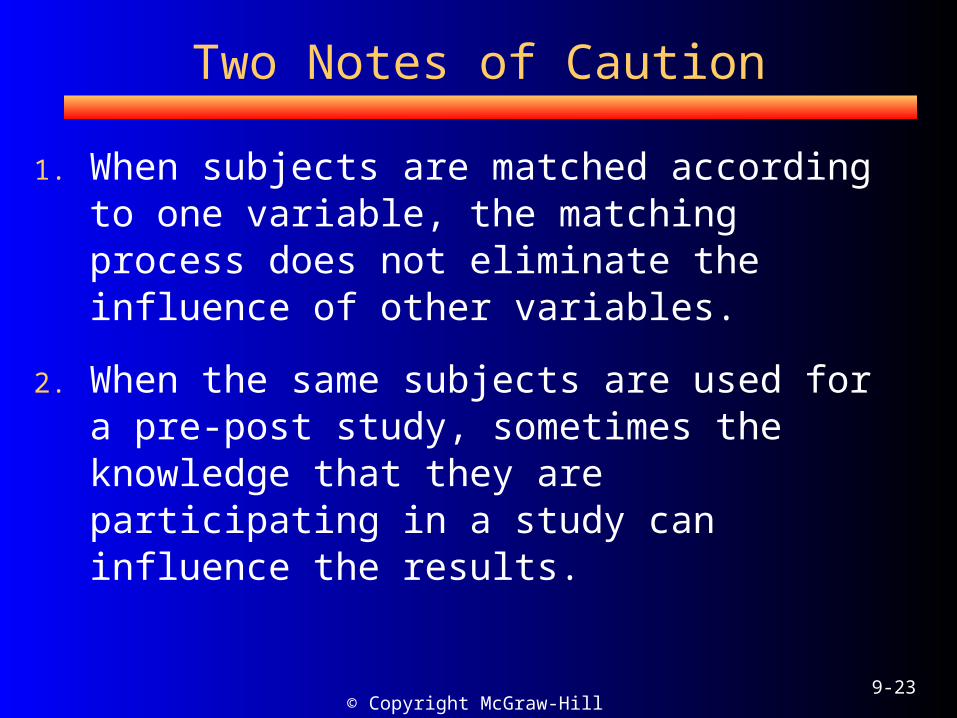
Two Notes of Caution
1. When subjects are matched according to one variable, the matching process does not eliminate the influence of other variables.
2. When the same subjects are used for a pre-post study, sometimes the knowledge that they are participating in a study can influence the results.
© Copyright McGraw-Hill 20009-24
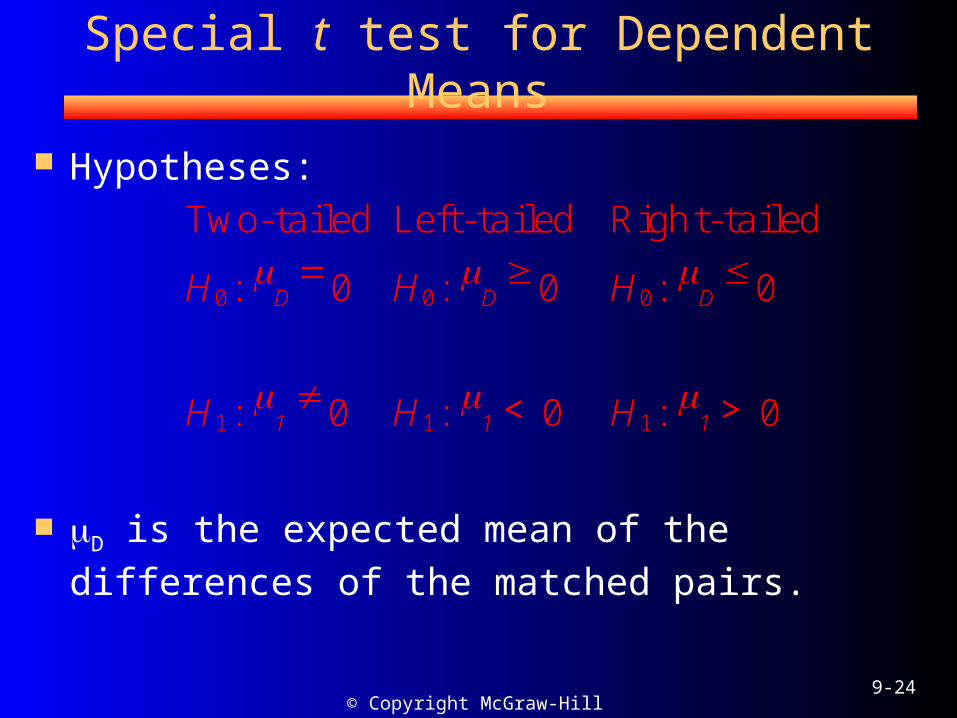
Special t test for Dependent Means
Hypotheses:
D is the expected mean of the differences of the matched pairs.
Two-tailed Left-tailed Right-tailed
H0: D 0 H0: D
0 H0: D 0
H1: 1 0 H1: 1 < 0 H1: 1 > 0
© Copyright McGraw-Hill 20009-25
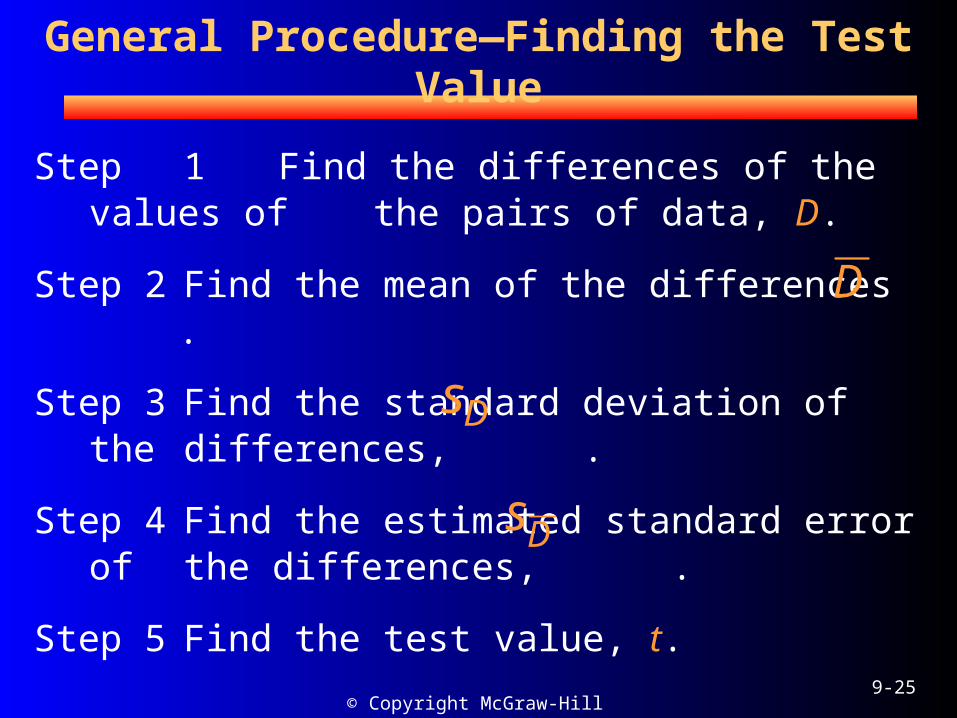
General Procedure—Finding the Test Value
Step 1 Find the differences of the values of the pairs of data, D.
Step 2 Find the mean of the differences .
Step 3 Find the standard deviation of the differences, .
Step 4 Find the estimated standard error of the differences, .
Step 5 Find the test value, t.
D
sD
sD
© Copyright McGraw-Hill 20009-26
t Test Formulas
The formula for the t test for dependent samples:
with d.f. = n – 1 and
where
and
tDs n
D
D
DDn
sD
Dn
nD
22
1
( )
© Copyright McGraw-Hill 20009-27
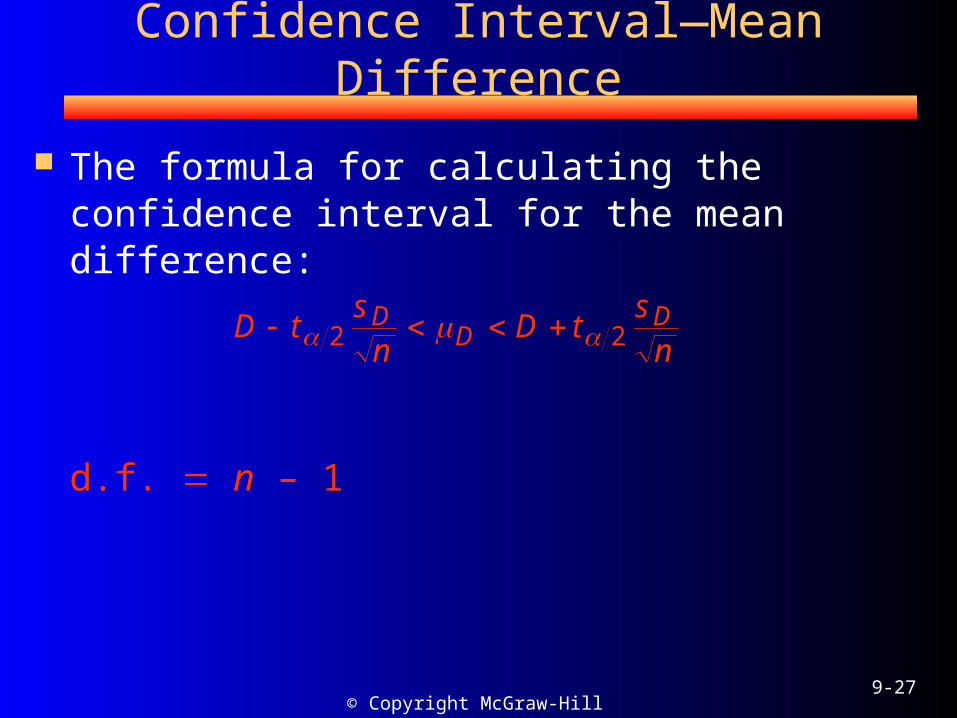
Confidence Interval—Mean Difference
The formula for calculating the confidence interval for the mean difference:
d.f. n – 1
D tsn
D tsn
DD
D 2 2

© Copyright McGraw-Hill 20009-28
Testing the Difference Between Proportions
,“p hat”, is the sample proportion that is used to estimate the population proportion.
where
X number of units that possess the characteristic of interest
n sample size
p
pXn
© Copyright McGraw-Hill 20009-29
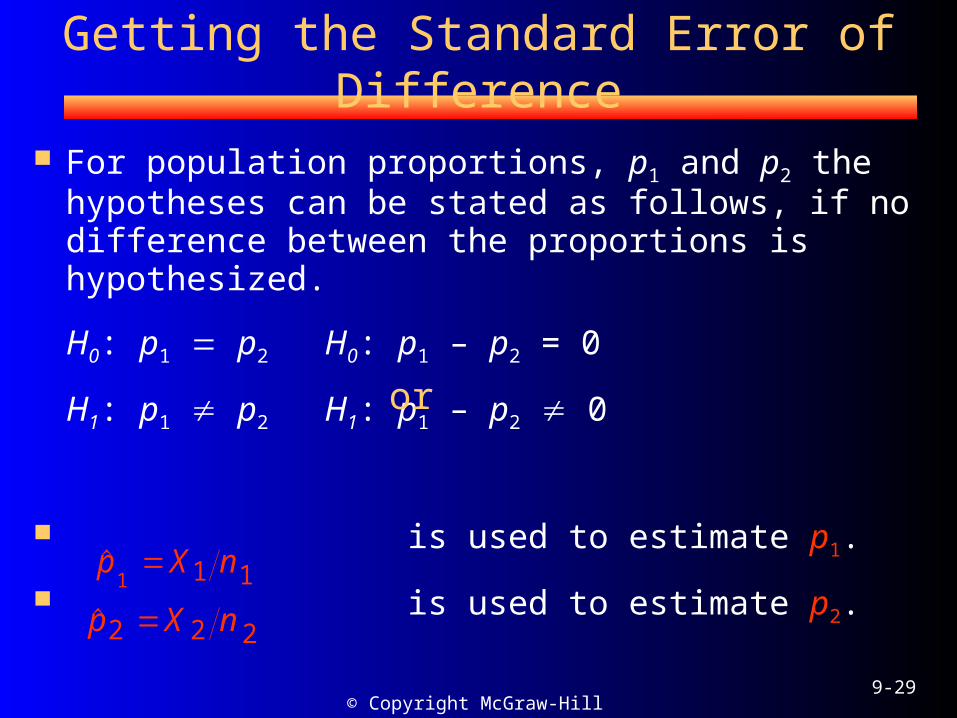
For population proportions, p1 and p2 the hypotheses can be stated as follows, if no difference between the proportions is hypothesized.
H0: p1 p2 H0: p1 – p2 = 0
H1: p1 p2 H1: p1 – p2 0
is used to estimate p1.
is used to estimate p2.
Getting the Standard Error of Difference
p X n1 1 1
p X n2 2 2
or
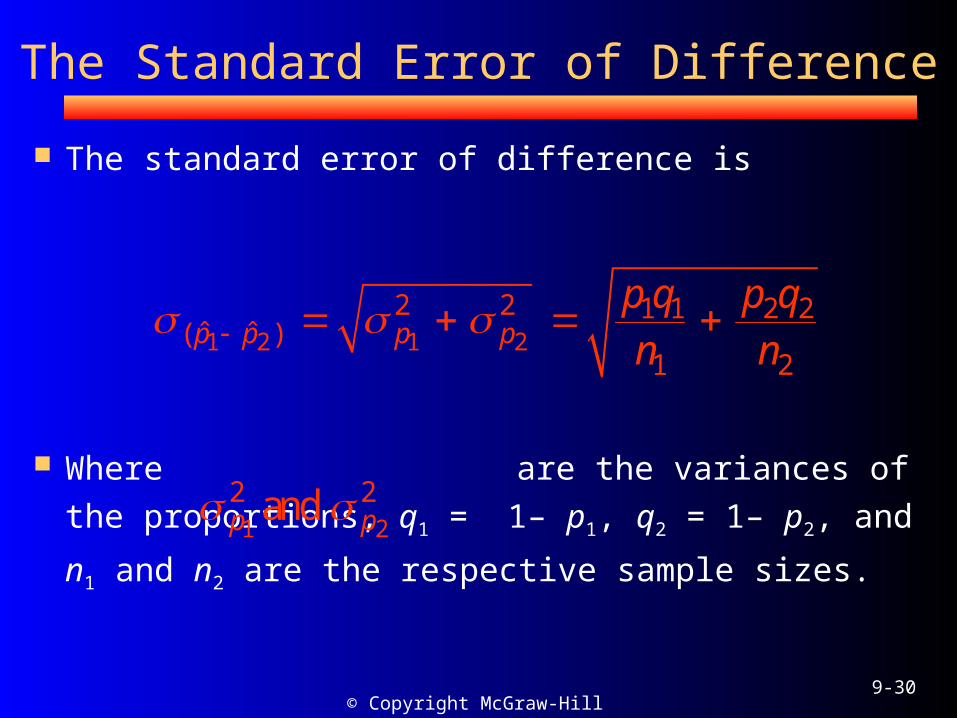
© Copyright McGraw-Hill 20009-30
The standard error of difference is
Where are the variances of the
proportions, q1 = 1– p1, q2 = 1– p2, and n1 and
n2 are the respective sample sizes.
The Standard Error of Difference
1 2 1 2
2 2 1 1 2 2ˆ ˆ( )
1 2p p p p
p q p qn n
1 2
2 2andp p
© Copyright McGraw-Hill 20009-31
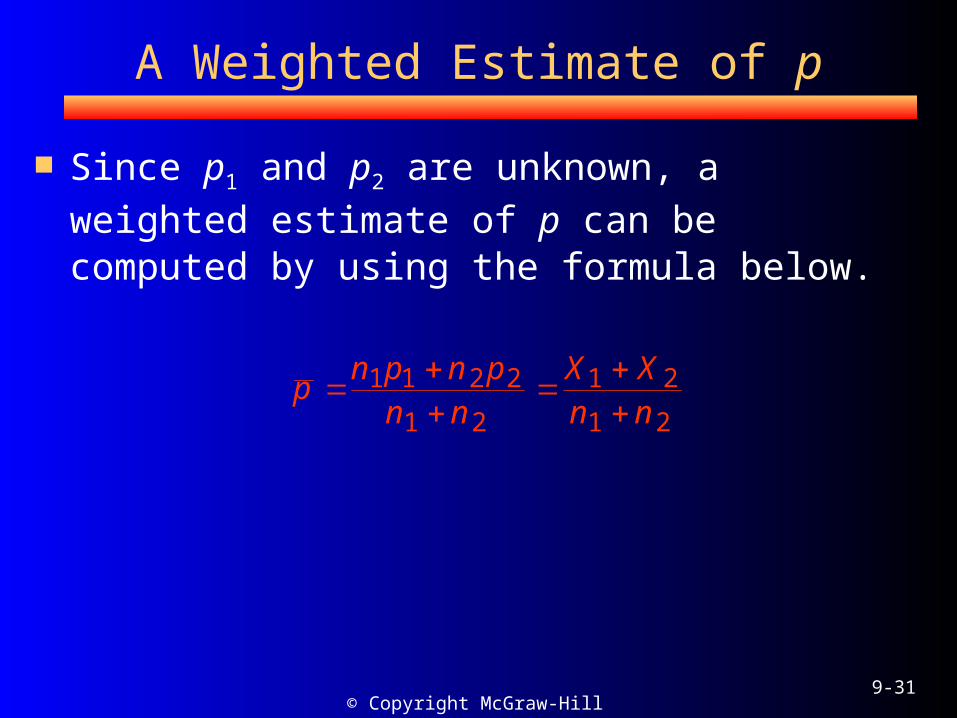
A Weighted Estimate of p
Since p1 and p2 are unknown, a weighted estimate of p can be computed by using the formula below.
pn p n p
n nX Xn n
1 1 2 2
1 2
1 2
1 2
© Copyright McGraw-Hill 20009-32
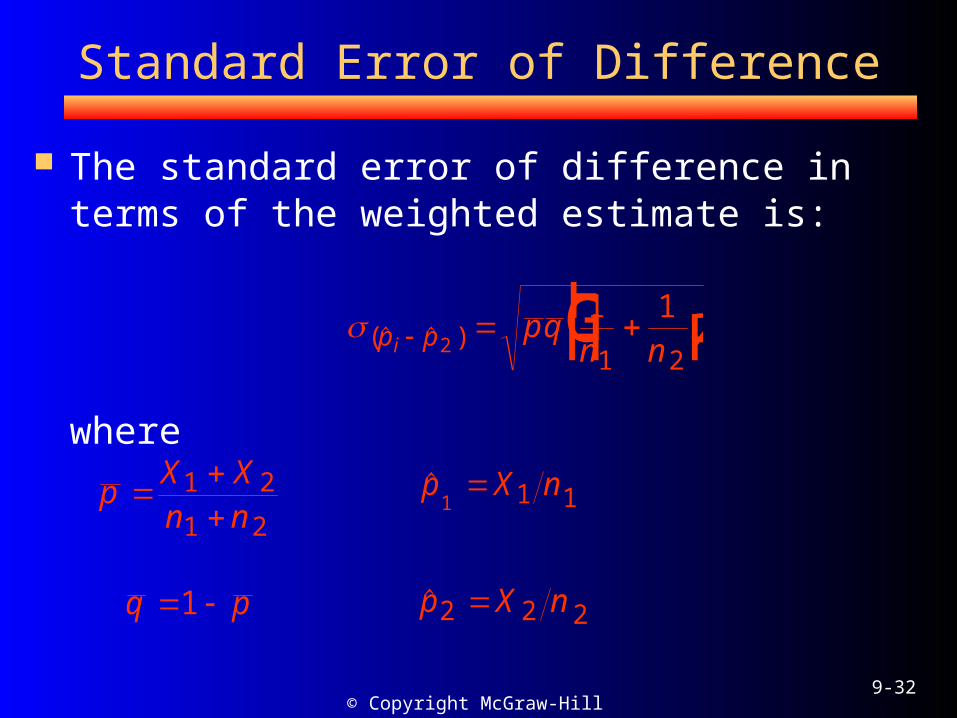
Standard Error of Difference
The standard error of difference in terms of the weighted estimate is:
where
( )p pipq
n n FHG
IKJ2
1 1
1 2
pX Xn n
1 2
1 2
q p 1
p X n1 1 1
p X n2 2 2
© Copyright McGraw-Hill 20009-33
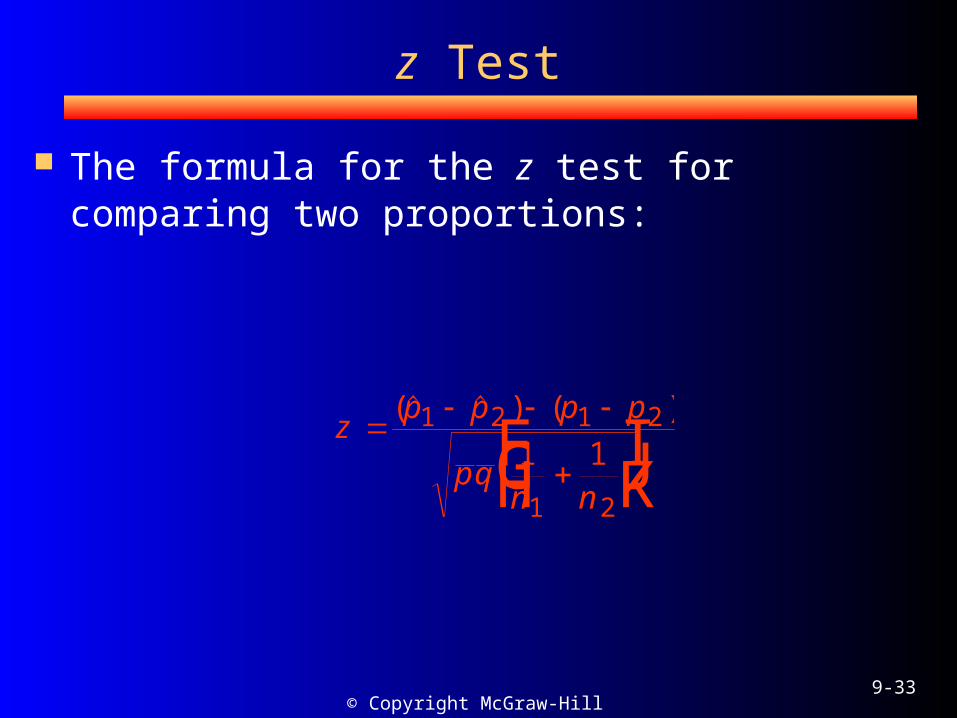
z Test
The formula for the z test for comparing two proportions:
zp p p p
pqn n
FHG
IKJ
( ) ( )1 2 1 2
1 2
1 1
© Copyright McGraw-Hill 20009-34
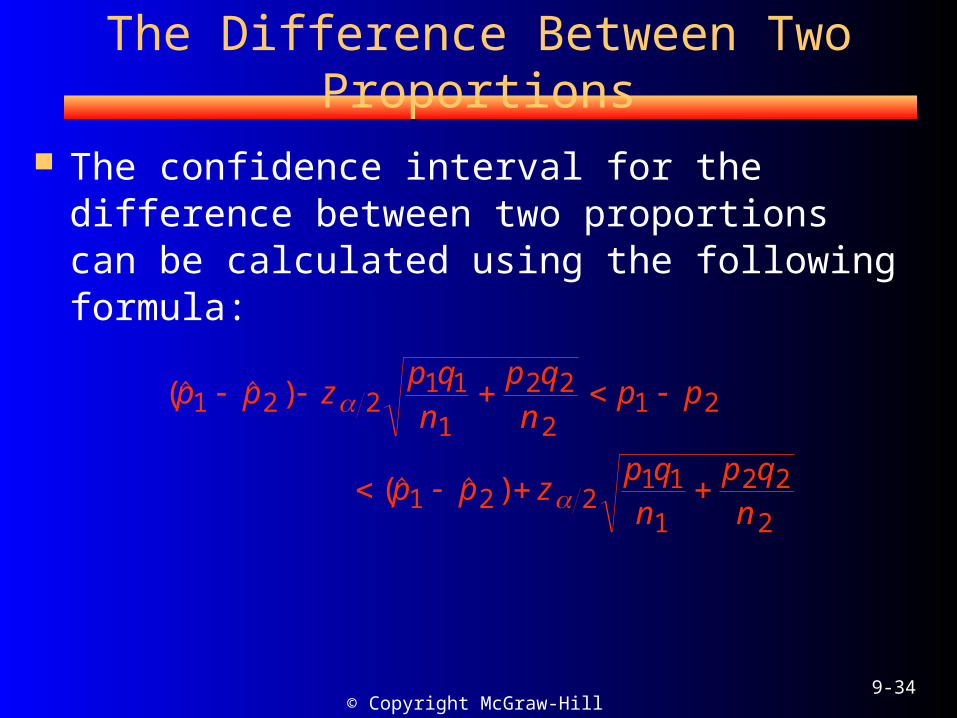
The Difference Between Two Proportions
The confidence interval for the difference between two proportions can be calculated using the following formula:
( )
( )
p p zp qn
p qn
p p
p p zp qn
p qn
1 2 21 1
1
2 2
21 2
1 2 21 1
1
2 2
2
© Copyright McGraw-Hill 20009-35
Summary
Means and Proportions are population parameters that are often compared.
This comparison can be made with the z test if the samples are independent and the variances are known, or if the variances are unknown but both sample sizes are greater than or equal to 30.
© Copyright McGraw-Hill 20009-36
Summary (cont’d.)
If the variances are not know or one or both sample sizes are less than 30, then the t test must be used.
For independent samples the F test must be used to determine whether or not the variances are equal.
For dependent samples the dependent samples t test is used.
A z test is used to compare two proportions.

© Copyright McGraw-Hill 20009-37
Conclusions
Special z and t tests allow researchers to compare population parameters, such as means or proportions.