Laboratory diagnosis gram positive and gram negative bacilli

Centre for Budget and Governance Accountability, 2010
Contents
S. No. Section
A Who Does the FM Meet?
B Promises in the Election Manifesto of Congress vs. Initiatives in Union Budget 2010-11
C Summary
1 Education
2 Health
3 Water Supply & Sanitation
4 Rural Development
5 Agriculture
6 Food Security
7 Adaptation to Climate Change
8 Women
9 Children
10 Dalits and Adivasis
11 Minorities
12 Resource Mobilisation
13 Understanding the Budget Jargon

Centre for Budget and Governance Accountability, 2010

Centre for Budget and Governance Accountability, 2010
A. Who Does the FM Meet?
1`
The Finance Minister started the process of pre-budget consultations with various stakeholders early on in this year. He started the process in the month of January by meeting the industry and commerce lobby groups which included FICCI, ASSOCHAM and CII. This was followed by consultations with farmer leader Mr. Sharad Joshi; Secretary of Consortium of Indian Farmer’s Association (CIFA), Mr. Changal Reddy; and Director of IFPRI (Asia), Dr. Ashok Gulati. The Finance Minister held consultations with the State Finance Ministers too (a practice that was started last year only). He also held consultations with some of the well-known economists of the country, and met the trade union leaders, farmers and members of Society of Indian Law Firms as a part of this process.
A significant development this year was the consultation held by Shri Pranab Mukherjee with representatives of select civil society organisations (CSOs), a step which has been hailed by a wide and diverse cross-section of CSOs in the country. The representatives of CSOs provided inputs to the Finance Minister on a number of concerns ranging from inadequacy of allocations towards development schemes, implementation bottlenecks impeding the conversion of allocations into improved outputs and outcomes and fiscal decentralisation, among others. We hope this practice of meeting civil society representatives in the budget making process would be institutionalised and efforts would be made to incorporate the suggestions of CSOs on the budget.

Centre for Budget and Governance Accountability, 2010
B. P
rom
ises
in th
e E
lect
ion
Man
ifest
o of
Con
gres
s vs
. In
itiat
ives
in U
nion
Bud
get 2
010-
11
SEC
TO
RS
Prom
ises
mad
e in
the
Con
gres
s E
lect
ion
Man
ifest
o 20
09Pr
omis
es a
ddre
ssed
in th
e U
nion
Bud
get
2009
-10
Prom
ises
add
ress
ed in
the
Uni
on B
udge
t 20
10-2
011
Hea
lth
Hea
lth
Insu
ranc
e co
ver
acro
ss
BPL
fam
ilies
Qua
lity
heal
th f
acili
ties
in e
very
di
stric
t hos
pita
l.
All
BPL
fam
ilies
to
be c
over
ed u
nder
Ras
htriy
a Sw
asth
ya B
ima Y
ojana
(RSB
Y).
Allo
catio
n un
der R
SBY
in
crea
sed
by 4
0 %
ove
r pr
evio
us y
ear’s
allo
catio
n to
Rs
. 350
cro
re in
Bud
get 2
009-
10.
Not
add
ress
ed s
peci
fical
ly t
houg
h al
loca
tion
unde
r N
atio
nal
Rura
l H
ealth
Miss
ion
(NRH
M)
incr
ease
d by
Rs.
2,05
7 cr
ore
over
Int
erim
B.E
. 200
9-10
of
Rs.
12,0
70 c
rore
.
Rash
triya
Sw
asth
ya
Bima
Yo
jana
(RSB
Y)
bene
fits
exte
nded
to
all
such
Mah
atm
a G
andh
i N
REG
A
bene
ficia
ries w
ho h
ave w
orke
d fo
r mor
e tha
n 15
day
s du
ring
the
prec
edin
g fin
anci
al y
ear.
The
allo
catio
n fo
r “D
istric
t Hos
pita
ls” sc
hem
e und
er
Min
. of
Hea
lth a
nd F
amily
Wel
fare
incr
ease
d fr
om
Rs 1
6 cr
ore
in 2
009-
10 to
Rs.
200
cror
e fo
r 201
0-11
. A
lloca
tion
for N
RHM
regi
ster
s a sm
all i
ncre
ase.
Edu
catio
n
Tw
o m
odel
sch
ools
in e
very
blo
ck
Free
Edu
catio
n ac
ross
sta
ges
for
dalit
s and
adi
vasis
.
Sche
me
for
setti
ng
up
6000
m
odel
sc
hool
s as
be
nchm
ark
of e
xcel
lenc
e in
eve
ry b
lock
of
the
coun
try
laun
ched
.
Not
add
ress
ed.
Allo
catio
n fo
r “M
odel
Sch
ools”
sch
eme
incr
ease
d fr
om R
s. 35
0 cr
ore
in 2
009-
10 t
o Rs
. 425
cro
re in
20
10-1
1; b
ut f
ar s
hort
of
the
requ
ired
leve
l of
fu
nds.
Min
istry
of
Soci
al Ju
stic
e &
Em
pow
erm
ent t
o re
vise
ra
tes o
f sc
hola
rshi
p un
der i
ts p
ost-m
atric
scho
lars
hip
sche
mes
for S
C a
nd O
BC st
uden
ts.

Centre for Budget and Governance Accountability, 2010
Wor
k &
Soc
ial
Secu
rity
100
days
of
wor
k at
Rs.
100
a d
ay
for e
very
one
Pref
eren
tial
polic
ies
in
govt
. co
ntra
cts
for S
C /
ST
and
wom
en’s
grou
ps, 5
0 %
of r
ural
wom
en li
nked
to
SH
Gs
and
Ban
ks
Soci
al
secu
rity
for
high
ris
k gr
oups
Allo
catio
n un
der
NRE
GS
incr
ease
d by
30
% to
Rs.
39,1
00 c
rore
in 2
009-
10 (B
E) o
ver 2
008-
09 (R
E).
FM, i
n hi
s Bu
dget
Spe
ech
said
tha
t 50
% o
f ru
ral
wom
en w
ill b
e lin
ked
to S
HG
s ov
er n
ext fi
ve y
ears
. H
owev
er, a
lloca
tion
for
all S
HG
-bas
ed p
rogr
amm
es
unde
r M
WC
D h
ave
gone
dow
n in
clud
ing
Rash
triya
M
ahila
Kos
h, Sw
ayam
siddh
a, ST
EP,
Priy
adar
shin
i am
ong
othe
rs.
Act
ion
initi
ated
to
ensu
re im
plem
enta
tion
of s
ocia
l se
curit
y sc
hem
es u
nder
occ
upat
ions
lik
e w
eave
rs,
fishe
rmen
and
wom
en,
todd
y ta
pper
s, le
athe
r an
d ha
ndic
raft
wor
kers
, pl
anta
tion
labo
ur,
cons
truc
tion
labo
ur,
min
e w
orke
rs,
bidi
wor
kers
and
ric
ksha
w
pulle
rs. N
eces
sary
fina
ncia
l allo
catio
n w
ill b
e m
ade
for t
hese
sche
mes
.
Allo
catio
n fo
r the
NRE
GS
incr
ease
d fr
om R
s. 39
,100
cr
ore
in 2
009-
10 to
Rs.
40,1
00 c
rore
in 2
010-
11.
The
fund
corp
us fo
r the
‘Mic
ro-F
inan
ce D
evel
opm
ent
and
Equ
ity F
und
is be
ing
doub
led
to R
s. 40
0 cr
ore
in 2
010-
11.
Nat
iona
l Soc
ial S
ecur
ity F
und
for u
norg
anise
d se
ctor
w
orke
rs to
be
set u
p w
ith a
n in
itial
allo
catio
n of
Rs.
1,00
0 cr
ore.
To e
ncou
rage
peo
ple
from
the
uno
rgan
ised
sect
or
to v
olun
taril
y sa
ve fo
r th
eir
retir
emen
t and
to lo
wer
th
e co
st o
f op
erat
ions
of
the
New
Pen
sion
Sche
me
(NPS
) fo
r su
ch
subs
crib
ers,
Gov
ernm
ent
will
co
ntrib
ute
Rs. 1
,000
per
yea
r to
eac
h N
PS a
ccou
nt
open
ed in
the
yea
r 20
10-1
1. T
his
initi
ativ
e is
calle
d “S
wava
lamba
n”.
Land
and
Fo
rest
s
Mar
ket
rate
s an
d st
akeh
olde
r op
tions
for a
cqui
red
land
Nat
iona
l Reh
abili
tatio
n an
dR
eset
tlem
ent A
ct
Am
endm
ent
of L
and
Acq
uisi
tion
Act
189
4
Not
add
ress
ed
Not
add
ress
ed
Not
add
ress
ed
Not
add
ress
ed
Not
add
ress
ed
Not
add
ress
ed
Food
Sec
urity
Nat
iona
l Foo
d Se
curit
y A
ct a
ndU
nive
rsal
IC
DS
by 2
012
25 k
gs o
f ric
e/w
heat
a m
onth
at R
s. 3
per k
g fo
r BPL
fam
ilies
Nat
iona
l Foo
d Se
curit
y Act
to b
e bro
ught
in to
ensu
re
entit
lem
ent o
f 25
kilo
of
rice
or w
heat
per
mon
th a
t Rs
.3 p
er k
ilo to
eve
ry fa
mily
livi
ng b
elow
the
pove
rty
line
in r
ural
or
urba
n ar
eas.
How
ever
, no
allo
catio
n ha
s bee
n m
ade
for t
his y
et.
Uni
on B
udge
t ou
tlay
for
“Foo
d Su
bsid
y” r
educ
ed
from
Rs.
56,0
00 c
rore
in 2
009-
10 (R
E) t
o Rs
. 555
78
cror
e in
201
0-11
(BE
).
Allo
catio
n fo
r IC
DS
incr
ease
d fr
om
Rs.
6,70
5 cr
ore
in 2
009-
10 (
BE)
to R
s. 8,
700
cror
e in
201
0-11
(BE
); bu
t eve
n th
is in
crea
sed
budg
et a
lloca
tion
is gr
ossly
inad
equa
te fo
r uni
vers
alisa
tion
of IC
DS
with
qu
ality
.

Centre for Budget and Governance Accountability, 2010
Agr
icul
ture
Inte
rest
relie
f fo
r far
mer
s on
timel
y re
paym
ent o
f lo
ans
Cro
p in
sura
nce
Dire
ct
inco
me
supp
ort
in
ecol
ogic
ally
vul
nera
ble
regi
ons
Inte
rest
subv
entio
n sc
hem
e for
shor
t ter
m cr
op lo
ans
up to
Rs.
3 la
kh p
er f
arm
er a
t the
inte
rest
rat
e of
7
% p
er an
num
to b
e co
ntin
ued.
Add
ition
al su
bven
tion
of 1
% t
o be
pai
d fr
om t
his
year
, as
inc
entiv
e to
th
ose
farm
ers
who
rep
ay s
hort
ter
m c
rop
loan
s on
sc
hedu
le. A
dditi
onal
allo
catio
n of
Rs.
411
cror
e ov
er
Inte
rim B
.E. 2
009-
10 m
ade
for t
his.
Tim
e gi
ven
to t
he f
arm
ers
havi
ng m
ore
than
tw
o he
ctar
es o
f la
nd to
pay
75
% o
f th
eir o
verd
ues u
nder
D
ebt W
aiver
and
Deb
t Rel
ief
Sche
me
exte
nded
from
30
th Ju
ne, 2
009
to 3
1st D
ecem
ber,
2009
.
Not
add
ress
ed.
Targ
et f
or a
gric
ultu
re c
redi
t flow
set
at R
s. 3,
25,0
00
cror
e fo
r th
e ye
ar 2
009-
10. I
n 20
08-0
9, a
gric
ultu
re
cred
it flo
w w
as a
t Rs.
2,87
,000
cro
re.
Allo
catio
n un
der
Acc
eler
ated
Ir
rigat
ion
Bene
fit
Prog
ram
me
(AIB
P) in
crea
sed
by75
% o
ver 2
008-
09 (B
E).
Allo
catio
n un
der
Rash
triya
K
rishi
V
ikas
Yo
jana
(R
KV
Y) s
tepp
ed u
p by
30
% in
. 200
9-10
(BE
) ove
r 20
08-0
9 (B
E).
The
per
iod
of re
paym
ent o
f th
e lo
an a
mou
nt b
y th
e fa
rmer
s ext
ende
d by
six
mon
ths f
rom
Dec
embe
r 31,
20
09 t
o Ju
ne 3
0, 2
010
unde
r th
e D
ebt
waiv
er a
nd
Deb
t rel
ief
sche
me
for t
he fa
rmer
s.A
lso in
cent
ive
of a
dditi
onal
1 %
inte
rest
subv
entio
n to
far
mer
s w
ho r
epay
sho
rt-te
rm c
rop
loan
s as
per
sc
hedu
le, i
ncre
ased
to 2
% fo
r 201
0-11
. T
his
budg
et p
ropo
ses
to p
rovi
de f
urth
er c
apita
l to
stre
ngth
en t
he R
egio
nal R
ural
Ban
ks (
RRBs
) RR
Bs
so t
hat
they
hav
e ad
equa
te c
apita
l bas
e to
sup
port
in
crea
sed
lend
ing
to th
e ru
ral e
cono
my.
Allo
catio
n fo
r N
atio
nal
Agr
icul
tura
l In
sura
nce
Sche
me
(NA
IS)
redu
ced
from
Rs.
1219
cro
re i
n 20
09-1
0 (R
E) t
o Rs
. 950
cro
re in
201
0-11
(BE
).
The
agr
icul
ture
cre
dit fl
ow ta
rget
for t
he y
ear
Rs.3
,75,
000
cror
e.
Rs 4
00 cr
ore p
rovi
ded
to ex
tend
the g
reen
revo
lutio
n to
the
eas
tern
reg
ion
of t
he c
ount
ry;R
s. 30
0 cr
ore
prov
ided
to
60,0
00 “
pulse
s an
d oi
l se
eds
villa
ges”
in
rai
n-fe
d ar
eas
durin
g 20
10-1
1 an
d Rs
. 200
cro
re
prov
ided
for
sus
tain
ing
the
gain
s al
read
y m
ade
in
the
gree
n re
volu
tion
area
s th
roug
h co
nser
vatio
n fa
rmin
g.

Centre for Budget and Governance Accountability, 2010
Infr
astr
uctu
re
Wat
er s
ecur
ity
IT fo
r rur
al tr
ansf
orm
atio
n
Urb
an h
ousi
ng a
nd s
anita
tion
Rur
al e
lect
rifica
tion
and
hous
ing
Allo
catio
ns fo
r Rur
al W
ater
Sup
ply
has s
how
n a
very
m
argi
nal i
ncre
ase
but
not
suffi
cien
t to
ens
ure
‘wat
er sec
urity
’.
Not
add
ress
ed
Allo
catio
n un
der
Jaw
ahar
lal N
ehru
Nat
iona
l Urb
an
Rene
wal
Miss
ion
(JNN
URM
) st
eppe
d up
by
87 %
to
Rs.
12,8
87 c
rore
in
2009
-10
(BE
) ov
er 2
008-
09
(BE
). A
lloca
tion
for
hous
ing
and
prov
ision
of
basic
am
eniti
es to
urb
an p
oor e
nhan
ced
to R
s. 3,
973
cror
e in
200
9-10
(BE
). T
his
incl
udes
pro
visio
n fo
r Ra
jiv
Awa
s Yoja
na (R
AY),
a ne
w sc
hem
e an
noun
ced.
Allo
catio
n fo
r Bh
arat
Nirm
an in
crea
sed
by 4
5 %
in
2009
-10
over
200
8-09
(BE
).
Allo
catio
ns u
nder
Pra
dhan
Man
tri G
ram
Sada
k Yo
jana
(PM
GSY
) in
crea
sed
by 5
9 %
ove
r 20
08-0
9 (B
E)
to
Rs. 1
2,00
0 cr
ore
in 2
009-
10 (B
E).
Und
er
Rajiv
G
andh
i G
rame
en
Vidy
utik
aran
Yo
jana
(RG
GV
Y),
allo
catio
n in
crea
sed
by 2
7 %
to R
s. 7,
000
cror
e. A
lloca
tion
unde
r Ind
ira A
waas
Yoja
na (I
AY) i
ncre
ased
by
63 %
to R
s. 8,
800 c
rore
in 20
09-1
0 (BE
). A
lloca
tion
of R
s. 2,
000
cror
e m
ade
for
Rura
l H
ousin
g Fu
nd
(RH
F) in
Nat
iona
l Hou
sing
Bank
(N
HB)
to
boos
t th
e re
sour
ce b
ase
of N
HB
for
refin
ance
ope
ratio
ns
in ru
ral h
ousin
g se
ctor
.
Not
add
ress
ed
Not
add
ress
ed sp
ecifi
cally
but
a si
zabl
e ch
unk
of th
e pl
an a
lloca
tions
are
dev
oted
to th
e de
velo
pmen
t of
rura
l inf
rast
ruct
ure.
For
the
year
201
0-11
, th
is bu
dget
pro
pose
s to
in
crea
se t
he a
lloca
tion
for
urba
n de
velo
pmen
t by
m
ore
than
75
% f
rom
Rs.3
,060
cro
re t
o Rs
. 5,4
00
cror
e. I
n ad
ditio
n, t
he a
lloca
tion
for
Hou
sing
and
Urb
an P
over
ty A
llevi
atio
n is
also
bei
ng r
aise
d fr
om
Rs. 8
50 c
rore
to R
s. 1,
000
cror
e in
201
0-11
.
For t
he ye
ar 2
010-
11, t
his b
udge
t pro
pose
s to
prov
ide
Rs. 6
6,10
0 cr
ore
for R
ural
Dev
elop
men
t.
For t
he ye
ar 2
010-
11, t
his b
udge
t pro
pose
s to
allo
cate
an
am
ount
of
Rs.
48,0
00 c
rore
for
pro
gram
mes
un
der B
hara
t Nirm
an.
For
the
year
20
10-1
1,
the
allo
catio
n fo
r In
dira
Awa
s Yo
jana
is be
ing
incr
ease
d to
Rs.
10,0
00 c
rore
. T
his
budg
et p
ropo
ses
to e
nhan
ce t
he a
lloca
tion
to
Back
war
d Re
gion
Gra
nt F
und
fund
by
26 %
fro
m
Rs. 5
,800
cror
e in
2009
-10
to R
s. 7,
300
cror
e in
2010
-11
.
Eco
nom
y
Goo
ds a
nd S
ervi
ces
Tax
(GST
)Pr
otec
tion
of
PSU
s in
m
anuf
actu
ring
Sect
or.
Will
be
impl
emen
ted
from
Apr
il 20
10.
The
gov
ernm
ent
is ho
ldin
g di
scus
sions
with
the
E
mpo
wer
ed
Com
mitt
ee
of
the
Stat
e Fi
nanc
e M
inist
ers
to fi
nalis
e th
e st
ruct
ure
of G
ST a
s w
ell a
s th
e m
odal
ities
of
its e
xped
itiou
s im
plem
enta
tion.
It
sho
uld
be in
trodu
ced
alon
g w
ith t
he D
irect
Tax
C
ode
in A
pril,
201
1.

Centre for Budget and Governance Accountability, 2010
Soci
al
Incl
usio
n
Wom
en’s
R
eser
vatio
n B
ill
enac
ted
Allo
catio
n fo
r D
alits
and
Trib
al
Sub
Plan
s
Spec
ial i
ncen
tives
for
gir
l ch
ild t
o co
rrec
t adv
erse
sex
ratio
and
ens
ure
girls
’ edu
catio
n
Not
add
ress
ed.
Allo
catio
n fo
r th
e SC
SP o
ut o
f th
e to
tal
plan
ex
pend
iture
of U
nion
Gov
ernm
ent r
educ
ed fr
om 7.
07
% (
2008
-09
RE)
to 6
.49
% (
2009
-10
BE).
Sim
ilarly
fo
r the
TSP
from
4.2
1 %
to 4
.10
% re
spec
tivel
y.
Nat
iona
l Miss
ion
for F
emal
e Li
tera
cy to
be
laun
ched
w
ith
focu
s on
m
inor
ities
, SC
s, ST
s an
d ot
her
mar
gina
lized
gro
ups
with
the
aim
to r
educ
e le
vel o
f fe
mal
e ill
itera
cy b
y ha
lf in
thre
e ye
ars.
Cab
inet
’s ap
prov
al o
btai
ned.
Thi
s bu
dget
pro
pose
s to
enh
ance
the
plan
out
lay o
f th
e M
inist
ry o
f So
cial
Just
ice
and
Em
pow
erm
ent t
o Rs
. 450
0 cr
ore,
but t
he im
plem
enta
tion
of S
CSP
and
TS
P co
ntin
ue to
be
negl
ecte
d.
Thi
s bu
dget
pro
pose
s to
ste
p up
the
plan
out
lay fo
r M
in. o
f W
omen
and
Chi
ld D
evel
opm
ent b
y al
mos
t 50
%.
Gov
erna
nce
Polic
e an
d Ju
dici
al re
form
s
Gra
m
Nya
yala
ya
Act
20
08
impl
emen
ted
New
m
odel
of
ur
ban
adm
inis
trat
ion
Incr
ease
d al
loca
tions
to
gr
am
panc
haya
ts
For m
oder
nisa
tion
of th
e po
lice
in th
e st
ate,
Rs. 4
30
cror
e ha
s bee
n pr
opos
ed.
Not
add
ress
ed.
Rajiv
Awa
s Yoja
na to
mak
e th
e co
untr
y slu
m fr
ee in
a
perio
d of
five
yea
rs.
Miss
ion
Mod
e Pr
ojec
t on
e-P
anch
ayat
has
rec
eive
d an
incr
ease
in a
lloca
tion.
Nat
iona
l Miss
ion
for
Del
iver
y of
Jus
tice
and
lega
l Re
form
s to
help
redu
ce le
gal b
ackl
og.
Not
add
ress
ed.
Thi
s bu
dget
pro
pose
s to
allo
cate
Rs.
1,27
0 cr
ore
for
Rajiv
Awa
s Yo
jana
2010
-11
as c
ompa
red
to R
s. 15
0 cr
ore
last
yea
r.
Not
add
ress
ed.

Centre for Budget and Governance Accountability, 2010
Peac
e &
Se
curit
y
Uni
que
Iden
tity
Car
d fo
r al
l by
20
11
Wom
en a
nd D
alits
pro
tect
ed fr
om
atro
citie
s
Em
pow
ered
NH
RC
to m
onito
rco
mm
unal
and
cas
te v
iole
nce
Mod
erni
satio
n of
Def
ence
Uni
que
Iden
tifica
tion
Aut
horit
y of
Indi
a (U
IDA
I) to
se
t up
onl
ine
data
bas
e w
ith id
entit
y an
d bi
omet
ric
deta
ils o
f In
dian
res
iden
ts a
nd p
rovi
de e
nrol
men
t an
d ve
rifica
tion
serv
ices
acr
oss c
ount
ry. P
rovi
sion
of
Rs. 1
20 c
rore
mad
e fo
r th
is in
the
Budg
et. F
irst s
et
of u
niqu
e id
entit
y nu
mbe
r to
be
rolle
d ou
t in
12 to
18
mon
ths.
Not
Add
ress
ed.
No
allo
catio
n fo
r th
e D
omes
tic
Vio
lenc
e A
ct y
et.
Not
add
ress
ed
Not
add
ress
ed
Sinc
e th
e U
IDA
I w
ill n
ow g
et in
to t
he o
pera
tiona
l ph
ase,
this
budg
et h
as a
lloca
ted
Rs. 1
,900
cro
re t
o th
e A
utho
rity
for 2
010-
11.
No
allo
catio
n in
Uni
on B
udge
t fo
r th
e D
omes
tic
Vio
lenc
e A
ct y
et.
Not
add
ress
ed.
Allo
catio
n fo
r de
fenc
e in
crea
sed
to R
s. 1,
47,3
44
cror
e.
Fore
ign
Polic
y & G
loba
l Rol
e
Nat
iona
l Act
ion
Plan
for C
limat
e C
hang
e im
plem
ente
dIn
fur
ther
ance
to
Nat
iona
l Act
ion
Plan
on
Clim
ate
Cha
nge,
eigh
t nat
iona
l miss
ions
to b
e la
unch
ed.
Som
e of
the
taxa
tion
mea
sure
s orie
nted
tow
ards
this
obje
ctiv
e.

Centre for Budget and Governance Accountability, 2010
“The Union Budget cannot be a mere statement of Government accounts. It has to reflect the Government’s vision and signal the policies to come in future.” With these words, the Finance Minister introduced the Union Budget 2010-11 that could have been a clear policy statement of the government towards propelling not just faster growth but also inclusive growth in the country. With strong indication of the economy reviving fast, the Union Government should have taken an expansionary fiscal stance not only for accelerating growth but also for financing adequately the interventions which are promoting social sector development. However, it has chosen to revert to the path of fiscal conservatism, albeit gradually, with Budget 2010-11.
A “calibrated exit strategy from the expansionary fiscal stance of 2008-09 and 2009-10”, which the Thirteenth Finance Commission has recommended strongly for the Union Government, seems to have been shaped up as the Union Government’s Total Expenditure is projected to fall from 16.6 % of GDP in 2009-10 (RE) to 16 % of GDP in 2010-11 (BE). As regards the policy direction suggested by the Thirteenth Finance Commission, both the Report of the Commission (tabled in Parliament on 25th of February) and the Union Budget 2010-11 clearly indicate that the next five years could witness growing efforts by the Union Government towards elimination/reduction of deficits through compression of public expenditure.
On the expenditure side, the Congress-led government seems to be growing complacent about its budgetary policies especially for the social sectors. While the Union Budget 2010-11 does pay some attention to a few of the important sectors/ issues like women and child development, minorities, infrastructure, rural housing, and technical education, the overall social sector allocations have recorded an insignificant increase in this budget (Table 1).
Table 1: Priority for Social Services in the Union Budget
YearExpenditure on Social Services
as % ofTotal Disbursements of the Union Govt.
Expenditure on Social Services as % of GDP
2004-05 6.3 1.02005-06 7.9 1.12006-07 7.8 1.12007-08 8.9 1.32008-09 10.4 1.62009-10 RE 10.1 1.72010-11 BE 10.4 1.7
Note: The Annual Financial Statement in the Union Budget does not provide any break up (for General Services, Economic Services and Social Services) for the Grants-in-Aid component; hence, the figures for expenditure on Social Services (used in this Table) do not include the grants-in-aid provided by the Union Ministries to States and UTs in the Social Services. Source: Complied from Annual Financial Statement, Union Budget, various years.
Before discussing some of the major deficiencies as well as positive developments relating to the social sectors, important economic sectors and interventions for disadvantaged sections of the population, it would be useful to highlight specific concerns that emerge in the sphere of mobilisation of resources by the Union Government. The tax-GDP ratio (i.e. gross tax revenues for the Centre as a proportion of the GDP) shows a small increase from 10.3 % in 2009-10 (RE) to 10.8 % in 2010-11 (BE). The tax-GDP ratio for the Centre had reached the level of 12 % by 2007-08. It was a welcome trend given that India’s total tax-GDP ratio (i.e. combined for Centre and States) has been hovering around 16 %, which is significantly lower than that for several other countries.
C. Summary

Centre for Budget and Governance Accountability, 2010
However, one of the core strategies of the Fiscal Stimulus Package of the Union Government in 2008-09 and 2009-10 had been reductions in indirect taxes. As a result, the tax-GDP ratio for the Centre had fallen from 12 % in 2007-08 to 10.3 % in 2009-10 (RE) and it still has not recovered much. In this context, the impetus in Union Budget 2010-11 towards further reduction of the direct tax rates (mainly in personal income tax) raises a serious concern. This proposal is estimated to result in a revenue loss of Rs. 26000 crore. The proposed increases in rates of indirect taxes and duties are expected to result in a revenue gain of around Rs. 46500 crore. However, the hike in the duties on crude oil, petrol, and in particular diesel, is ill-timed given the problem of steep rise in prices of food and non-food articles over the last few months.
The Finance Minister had recognized last year that India’s tax base is low compared to other countries, mainly due to a plethora of exemptions / deductions in the Central Government tax system. However, he has not taken any corrective measures in this regard even in the Budget for 2010-11. The total magnitude of tax revenue foregone due to exemptions / incentives / deductions in the Central Government tax system has been estimated (by the Fin. Min. itself) to rise from Rs.4.14 lakh crore in 2008-09 to Rs.5.02 lakh crore in 2009-10. In other words, a liberal estimate of the amount of additional tax revenue which could have been collected by the Union Government in 2009-10, if all exemptions / incentives / deductions (both in direct and indirect taxes) had been eliminated, stands at a staggering 8.1 % of GDP.
Union Government’s spending on Education as a proportion of its total budget outlay has increased marginally from 3.88 % in 2009-10 to 4.5 % in 2010-11. In addition, States will have access to Rs. 3,675 crore for elementary education under the Thirteenth Finance Commission grants for 2010-11. The UPA promise, reiterating the Kothari Commission’s recommendation of 1966, (that total public spending on Education in the country would be raised to the level of 6 % of GDP) remains unfulfilled even after 44 years in 2010. Total public spending on Education in the country, as a share of GDP, at 3.23 % (2009-10) is nowhere near the promised 6 % level. The Union Government’s total allocation for Education in 2010-11 (BE) stands at 0.71 % of GDP, which is slightly better than the 0.64 % of GDP recorded for 2009-10 (RE). However, such gradual and small increases in the Union Budget outlays for Education cannot result in any visible increase in overall public spending on Education in the country.
There has been significant stepping up in the outlays for Rashtriya Madhyamik Shiksha Abhiyan from Rs.550 crore in 2009-10 (RE) to Rs. 1700 crore in 2010-11 (BE). Schemes showing increased outlay include Adult Education & Skill Development Scheme, Educational Loan Interest Subsidy in University and Higher Education, Scholarship for College and University Students, and Upgradation of existing/setting up of New Polytechnics. However, in the context of education, what is disconcerting about Union Budget 2010-11 is that it has been completely silent on financing of the Right to Education Act, which the Union Government is reportedly planning to notify from 1st of April this year.
The Union Government’s allocation for Health & Family Welfare (i.e. the budget for the Ministry of Health and Family Welfare) as percentage of total Union Budget has increased marginally from 2.1 % in 2009-10 (RE) to 2.3 % in 2010-11 (BE). The allocation for Health & Family Welfare shows a negligible increase from 0.35 % of GDP in 2009-10 (RE) to 0.36 % of GDP in 2010-11 (BE). Thus, even after Union Budget 2010-11, the government is far short of the NCMP target of raising total public spending on Health in the country to 2 to 3 % of GDP. As a proportion of GDP, the combined expenditure of Centre and States on health, which was around 1.02 % in 2008-09, is now 1.06 % in 2009-10. In his Budget Speech, the Finance Minister has proposed to include in the Rashtriya Swasthya Bima Yojana (RSBY) all those NREGS beneficiaries who have worked (in the scheme) for at least 15 days in the last fiscal year. This is a welcome development. However, there are several concerns pertaining to the implementation of RSBY (relating to the role of private health insurance companies and the private healthcare institutions), which need to be addressed. Allocation on NRHM has been increased to Rs. 15,514 crore in 2010-11 (BE) from Rs. 14,002 crore in 2009-10. Given the huge infrastructural gaps and human resource crunch in health sector across the country, the budget for NRHM should have been increased significantly.

Centre for Budget and Governance Accountability, 2010
The allocation for Rural Water Supply has shown a marginal increase from Rs. 7,199 crore in 2009-10 (RE) to Rs. 8,100 crore in 2010-11 (BE). In Rural Sanitation too, there has been a small increase in the allocation from Rs. 1,080 crore in 2009-10 (RE) to Rs.1,422 crore in 2010-11 (BE). In Urban Water Supply and Sanitation, allocation for the ‘Integrated Low Cost Sanitation Programme’, a Centrally Sponsored Scheme for the replacement of dry latrines with water borne flush toilets and the rehabilitation of workers engaged in manual scavenging, has been increased from Rs.45 crore in 2009-10 (RE) to Rs.71 crore in 2010-11 (BE). This is a welcome step. However, allocations for provision of Solid Waste Management near Airports in Few Selected Cities, has shown a steep decline from Rs. 12.56 crore in 2009-10 (RE) to a meager Rs. 3.64 crore in 2010-11 (RE).
For the Department of Rural Development (under the Union Ministry of Rural Development), the Union Budget allocations show a marginal increase from Rs. 62201 crore in 2009-10 (RE) to Rs. 66138 crore in 2010-11 (BE). Union Budget allocations for the Mahatma Gandhi National Rural Employment Guarantee Scheme (MGNREGS) have been increased by only 2.5 % from Rs. 39100 crore in 2009-10 (RE) to Rs. 40100 in 2010-11 (BE). The allocation for Pradhan Mantri Gram Sadak Yojana (PMGSY) has remained at the 2009-10 level at Rs. 12000 crore. An appreciable step has been the increase in the unit cost of housing under Indira Awaas Yojana (IAY) to the level of Rs. 45000 for plain areas and Rs. 48500 for hilly areas; however, the total outlay for the IAY scheme has been increased by only 13 % from Rs. 8800 crore to Rs. 10000 crore.
Agriculture and Allied Activities continue to be left out of the Union Government’s spending priority. As a proportion of the total Union Budget for 2010-11 (BE) and the GDP, the allocation for Agriculture & Allied Activities accounts for 9.45 % and 1.56 % respectively. If we compare the total allocations made in the four Union Budgets from 2007-08 to 2010-11 for major schemes in Agriculture with the allocations recommended by the Planning Commission for the 11th Plan period (2007-08 to 2011-12), we find that the total allocation in the last four Union Budgets is no where close to 80 percent of the total outlay recommended by the Planning Commission. This is the case for most of the schemes under the Ministry of Agriculture, such as, the scheme for Micro Irrigation, Technology Mission on Cotton, National Horticulture Mission, Macro Management of Agriculture and Rashtriya Krishi Vikas Yojana, etc.
Given that inflation in food articles has been as high as 18 percent over the last few months, it was expected that there would be an increased allocation for Food Subsidy. However, the Budget 2010-11 on this count has been very disappointing; Food Subsidy has been reduced from Rs. 56002 crore in 2009-10 (RE) to Rs. 55578 Crore in 2010-11 (BE).
With regard to Adaptation to Climate Change, a “National Clean Energy Fund” (NCEF) has been constituted with the corpus coming from levying clean energy cess on indigenously produced and imported coal at Rs. 50 per tonne. Further, a concessional customs duty of 5 % on machinery and instruments required for setting up of photovoltaic and solar thermal power generating units has been proposed to implement National Solar Mission. Ground source heat pumps to tap geo-thermal energy have been exempted from basic customs duty and special additional duty. For promotion of wind energy, components required for the manufacture of rotor blades for wind energy generators have been exempted from Central Excise duty. The budget has also promised fiscal incentives for promotion of energy efficient lighting systems, mode of passenger transport and public transport mechanisms.
Union Budget 2010-11 proposes a 50 percent increase in the plan budget of the Ministry of Women and Child Development, which is welcome. However, the total allocation for Women (as reported in the Gender Budgeting Statement) accounts for just 6.1 % of the total Union Budget. At a per capita level, the total allocation for women (as reported in the Gender Budgeting Statement) comes to a paltry Rs. 1200 per annum. The Finance Minister has introduced two important schemes for women in the Union Budget 2010-11, namely, Mahila Kisan Sashaktikaran Pariyojana (MKSP) and Indira Gandhi Matritva Sahayog Yojana (IGMSY). Given that 74.9 % of the female workforce is engaged in agriculture, a scheme like MKSP could have significant impact. However, to gauge its potential,

Centre for Budget and Governance Accountability, 2010
one would need to assess the details of the scheme, which are yet to be put in the public domain. Similarly, another important scheme promised in the Eleventh Five Year Plan period, IGMSY, finally sees the light of day with an allocation of Rs. 390 crore this year. However, the allocation made for IGMSY is far below the amount that would be required to cover all pregnant and lactating women registered under ICDS.
Priority for Children in the Union Budget shows an insignificant increase in 2010-11 (BE). The aggregate outlay for child specific schemes, as a proportion of total budget outlay by the Union Government, has increased to 4.1 percent in 2010-11 (BE) from 3.7 percent in 2009-10 (RE). If we take into account the fact that children (i.e. all persons up to the age of 18 years) constitute more than 40 percent of the country’s population and that many of the outcome indicators show persisting deficits in the development of children; the magnitude of ‘Child Budget’ at 4.1 percent of the total Union Budget in 2010-10 (BE) appears grossly inadequate. Moreover, the sector-wise prioritisation of the Child Budget seems to have got further skewed against Child Health and Child Protection. Within the total resources earmarked for children in Union Budget 2010-11 (BE), 75 % is meant for Child Education, 20 % for Child Development, only 4 % for Child Health and a meager 1 % for Child Protection.
As regards the priority for Dalits and Adivasis, only a handful of the Union Government Ministries/ Departments have reported their Plan allocations earmarked for Scheduled Castes Sub Plan (SCSP) and Tribal Sub Plan (TSP) in Union Budget 2010-11. And, the guidelines of SCSP (for earmarking 16% of Plan Allocations for SCs) and TSP (for earmarking 8% of Plan Allocations for STs) have not been fulfilled in this budget too. The Union Budget outlays for SCSP and TSP as proportion of the Total Plan allocation of the Union Government (excluding the Central Assistances to the State & UT Plans) have registered small increases in 2010-11(BE) – Plan allocation earmarked for SCs has increased from 6.25 % to 7.19 % in 2010-11 (BE), while Plan allocation earmarked for STs shows an increase from 3.67 % in 2009-10 (RE) to 4.43 %in 2010-11 (BE). Also, of the funds shown as earmarked for SCs and STs, a large chunk is meant for basic social services and employment generation programmes, with little emphasis on providing funds for long term development and empowerment of the SCs and STs.
As regards Minorities, there has been an increase of 49 % in the total budgetary allocation for the Ministry of Minority Affairs (MMA) in Union Budget 2010-11 over the previous year’s allocation; it has increased from Rs. 1756.5 crore in 2009-10 (BE) to Rs. 2615.37 crore in 2010-11 (BE). The allocation under the Multi Sectoral Development Programme has increased from Rs. 889 crore in 2009-10 (BE) to Rs 1245.2 crore in 2010-11 (BE). Although, several development schemes have been launched for development of minorities since 2006-07, the financial and physical achievement of several schemes such as the Scholarship Schemes has been very poor. The Ministry was not able to utilise a substantial portion of the allocated resources from 2006-07 to 2008-09. The poor performance of these schemes has been mainly due to lack of effective institutional mechanisms, inadequate staff and lack of awareness about schemes. Panchayati Raj Institutions have not been given any significant role in programme implementation.
While the Finance Minister, in his Budget Speech, did stress on the need to address the weaknesses in the systems, structures and institutions at different levels of governance, budget outlays towards accomplishing this seem to be missing. It is felt that Union Budget 2010-11 reveals a shift in the focus of the present government from ‘inclusive growth’ to rapid economic growth - what with its stated resolve to cross the ‘double digit growth barrier’. In sum, Union Budget 2010-11 shows that a sense of urgency for addressing the deep rooted problems in the country’s social sectors and those confronting the country’s disadvantaged sections of population is perhaps missing in the policy agenda of the present government.

Centre for Budget and Governance Accountability, 2010
• The UPA promise reiterating the Kothari Commission recommendation of 1966 remains unfulfilled even after 44 years in 2010; India’s total public spending on Education at 3.23 % of GDP (2009-10) is nowhere near the promised level of 6 % of GDP.
• Union Government’s total allocation for Education in 2010-11 (BE) stands at 0.71 % of GDP, which is slightly better than the 0.64 % of GDP recorded for 2009-10 (RE).
• Union Government’s spending on Education as a proportion of its total budget outlay has increased marginally from 3.88 % in 2009-10 to 4.5 % in 2010-11. In addition, States will have access to Rs. 3,675 crore for elementary education under the Thirteenth Finance Commission grants for 2010-11.
• Union Budget 2010-11 has been completely silent on financing of the Right to Education Act, which the Union Government is planning to notify from 1st of April this year.
• While the outlay for Post-Matric Scholarship Scheme for SCs has been increased from Rs. 735 crore in 2009-10 to Rs. 1635 crore in 2010-11, the outlay for National Means-cum-Merit Scholarship scheme has been cut down from Rs. 750 crore in 2009-10 to Rs. 81 crore in 2010-11.
• There has been significant stepping up in the outlays for Rashtriya Madhyamik Shiksha Abhiyan from Rs. 550 crore in 2009-10 RE to Rs. 1700 crore in 2010-11.
• Schemes showing increases in their outlay include Adult Education & Skill Development Scheme, Educational Loan Interest Subsidy in University and Higher Education, Scholarship for College and University Students, and Upgradation of existing/setting up of New Polytechnics.
“The Union Budget cannot be a mere statement of Government accounts. It has to reflect the Government’s vision and signal the policies to come in future.” With these words, the Finance Minister introduced the Union Budget 2010-11 that could have been a clear policy statement of the government towards propelling not just economic but also social development in the country. Some scant provisions notwithstanding, the tenor of the budget has largely missed the mark when it comes to critical social sectors such as education.
Budgetary Allocation
Government spending on education as a proportion of GDP at 3.23 percent in 2009-10 continues to be way below the recommendation made by the first and the only Education Commission in 1966. Not only was it adopted in the subsequent National Policies on Education, but many political parties also adopted it as a key commitment. The UPA in 2004-05 had committed to raise public spending on education by 6 percent of GDP by 2008-09; this remains as much a promise in 2010. Figures 1.a and b show the trends in spending on education by the Union and State governments.
Overall spending on education as a proportion of total budget outlay has increased marginally from 3.88 percent in 2009-10 to 4.5 percent in 2010-11. In addition, States will have access to Rs. 3,675 crore for elementary education under the Thirteenth Finance Commission grants for 2010-11.

Centre for Budget and Governance Accountability, 2010
However, in what seems to be a clear signal of the government being in favour of the neoliberal policy framework, the proposal to ease Foreign Direct Investment (FDI) restrictions in the higher education sector is a move towards pushing for greater privatization in education.
Figure 1.a: Union Government Spending on Education as Percentage of Total Expenditure and GDP
4.53.884.023.814.083.52
2.63
0.710.640.630.580.580.50.42
0123456
2004-05 2005-06 2006-07 2007-08 2008-09 2009-10RE
2010-11BE
Union Govt's Expenditure on Education as a Proportion of TotalExpenditure (in %)Union Govt's Expenditure on Education as a Proportion of GDP (in %)
@ This does not include spending on education by Ministries in Government of India other than MHRD
∗ 2008-09 GDP data is estimated by CSOπ 2009-10 GDP data from Budget at a Glance 2009-10
Source: Compiled from data in Expenditure Budget Vol. 1, Union Budget, various years.
Figure 1.b: State Government Spending on Education as Percentage of Total Expenditure and GDP
15.114.413.814.012.7
14.2
2.3 2.2 2.2 2.1 2.4 2.6
0.02.04.06.08.0
10.012.014.016.0
2004-05 2005-06 2006-07 2007-08 2008-09(RE)
2009-10(BE)
% to Total Expenditure % to GDP
Source: Compiled from data in State Finances: A Study of Budgets 2008-09, Reserve Bank of India, 2008
There are very few benchmarks for assessing the adequacy of public spending on the development schemes in the country; the Eleventh Plan recommended outlays could be treated as some such benchmarks, even though the quality parameters to arrive at these benchmarks are not quite satisfactory. With just one year1• left in the Eleventh Five Year Plan period, most of the schemes have reported shortfalls in terms of budgetary outlays.
1 Considering that the budgetary allocations for 2010-11 have already been announced, even though the year has only just begun.

Centre for Budget and Governance Accountability, 2010
At least 80 percent of the Plan outlay should have been made in the first four years but actual provisioning has been 12 percent for Rashtriya Madhyamik Shiksha Abhiyan, 36 percent for Teacher Training and 46 percent for UGC. SSA and Mid Day Meal have fared better with 76 percent and 65 percent respectively (Table 1.a).
Table 1.a: Recommended Eleventh Plan Outlay vs. Budgetary Allocations in Education
Plan Scheme
Outlay for Eleventh Plan (Rs. in Crore)
[at Current Prices]
Union Budget AllocationsUnion Budget
Outlay made in the
first four years
% Outlay till now2007-08
RE2008-09
RE2009-10
RE2010-11
BE
SSA 71000 13171 13100 13100 15000 54371 76.57MDM 48000 6678 8000 7359 9440 31477 65.57Teacher Training 4000 312 307 325 500 1444 36.1
SUCCESS / RMSA 22620 1 511 550 1700 2762 12.21
Navodaya Vidyalaya 4600 1055 1421 1170 1246 4892 106.34
UGC 25012 1633 2762 3244 3885 11524 46.07Technical Education 23654 1103 2885 3686 4706 12380 52.33
Source: Compiled by CBGA from Eleventh Plan Document and Union Budget documents, various years
Key Issues
Earmarked Spending on SC/ST ChildrenCensus projections for 2011 in 5-29 years age group is 57 crore. Assuming that 24 percent of total population in this age group would be SCs and STs, i.e. 13.68 crore, the per capita expenditure on education of an SC/ST student (in the age group 5-29 years) by the Union Budget 2010-11 works out to Rs. 1073.
Earmarked Spending on Girl ChildrenReplicating the same exercise, the per capita expenditure on education of a girl child by the Union Budget 2010-11 would be Rs. 725. Taking into account the fact that there are high out-of-pocket expenses incurred by individuals on education, the Union government spending on SC/ST and the girl child is insignificant. According to the National Sample Survey (NSS) 64th Round in 2008, per capita out-of-pocket expenditure by an average parent in the country in government schools at the elementary level is Rs. 1243 and at the secondary/higher secondary stage is Rs. 2597.
Public Private PartnershipIt is not just the allocations but also the mode of financing adopted by the government that determine its priority – whether critical commitments are being financed through an approach based on entitlements for people or through low-cost provisioning for the poorest sections of the population. For instance, adoption of Public Private Partnership (PPP) as the preferred mode of financing for setting up 2500 of the 6000 Model Schools is disconcerting.
Financing Right to EducationIncrease in the budget for education is grossly inadequate keeping in mind the need for a complete revamp of the expenditure norms in the Central schemes (like Sarva Shiksha Abhiyan) if the Right to Education (RTE) Act

Centre for Budget and Governance Accountability, 2010
2009 is to be implemented properly. The budget for the Ministry for Human Resource Development (MHRD) at Rs. 49,904 crore for 2010-11 accounts for just 0.72% of GDP, remaining at the same level (as proportion of GDP) that was reached in 2009-10 BE. With the government mulling over the possibility of operationalising RTE Act through SSA, it is unclear how increasing the outlays for SSA from Rs. 13,100 crore in 2009-10 RE to Rs. 15,000 crore in 2010-11 BE would help achieve universal access to education by all.
In this regard, proceeds from education cess have been almost half of the total budget of Department of School Education and Literacy since 2006-07 (Table 1.b). To add to this, the annual growth in the outlay for the Department has been on a decline since 2005-06. It is apparent that outlays for elementary education are not moving in the direction of ensuring effective implementation of the RTE Act.
Table 1.b: Elementary Education and Trends in Financing by Union Government
YearTotal for Department of School Education
and Literacy
Growth in Outlay for Department of
School Education and Literacy
Cess
Cess as % of Total Outlay for Dept of School Education
and Literacy
2004-05 RE 8004 2005-06 RE 12536 56.6 2006-07 RE 17133 36.7 8746 51.042007-08 RE 23191 35.4 11128 47.982008-09 RE 26026 12.2 12134 46.622009-10 RE 25338 -2.6 12257 48.372010-11 BE 33214 31.1 14433 43.45
Source: Compiled by CBGA from Union Budget documents, GoI, various years.
Design Flaws in Government Schemes
While the Finance Minister commended the progress achieved through SSA, government estimates of poor teacher and student attendance tell a different tale. It is unlikely that SSA would be able to address such gaps, given that the thrust of spending has been largely on two areas: Civil Works and recruitment of contract teachers. For instance, in the budget approved for SSA for 2008-09, 28 percent of total outlay was earmarked for Civil Works and 31 percent for Teachers’ Salary, while the components that could influence quality of outcomes such as Teaching Learning Equipment, Teacher Training, Innovative Activities, Community Training, Research and Evaluation etc. account for very low shares.
Increases in the quantum of the budget do not necessarily translate into better development outcomes if the funds are not spent in a timely manner. Average spending in SSA as a proportion of total approved outlay for the country was only 29 percent in the first half of 2008-09. Underutilisation of funds in schemes like SSA is a key concern – which is due to the inefficient institutional and budgetary processes and flaws in the scheme design. Setting of low and unrealistic unit costs illustrates this amply. A grant of Rs. 5,000 per year for primary school for replacement of nonfunctional equipment and other recurring costs is a pittance. Similarly, providing Rs. 100 per person per day for training of teachers (for 10 days) would hardly suffice to conduct effective training. It is disconcerting that even though the Finance Minister did mention the need to address weaknesses in government systems, Union Budget 2010-11 does not make much headway in dealing with these concerns.

Centre for Budget and Governance Accountability, 2010
• Union Government’s allocation for Health & Family Welfare (i.e. the budget for the Ministry of Health and Family Welfare) as percentage of total Union Budget has increased marginally from 2.1 % in 2009-10 (RE) to 2.3 % in 2010-11 (BE).
• The allocation for Health & Family Welfare shows a negligible increase from 0.35 % of GDP in 2009-10 (RE) to 0.36 % of GDP in 2010-11 (BE). As a proportion of GDP, the combined expenditure of Centre and States on Health, which was around 1.02 % in 2008-09, is around 1.06 % in 2009-10. Thus, even after Union Budget 2010-11, the government is far short of the NCMP target of raising total public spending on Health in the country to 2 to 3 % of GDP.
• In his Budget Speech, the Finance Minister has proposed to include in the Rashtriya Swasthya Bima Yojana all those NREGS beneficiaries who have worked (in the scheme) for at least 15 days in the last fiscal year. This is a welcome development. However, there are several concerns pertaining to the implementation of RSBY (relating to the role of private health insurance companies and the private healthcare institutions), which needs to be addressed.
• Allocation on NRHM has been increased to Rs. 15,514 crore in 2010-11 (BE) from Rs. 14,002 crore in 2009-10. Given the huge infrastructural gaps and human resource crunch in the health sector across the country, the budget for NRHM should have been increased significantly.
• The proposal for Annual Health Survey to prepare District Health Profile for all districts is a welcome step; but the government would need to allocate adequate funds for this purpose.
• Allocations for certain major central schemes have gone down; these include Medical Education & Research and National Disease Control Programme.
• Union Budget allocations, during 2007-08 to 2010-11, for a number of important schemes in the health sector fall far short of the benchmarks suggested by the Planning Commission for the 11th Plan period.
Adequacy of Public Resources for Health
The United Progressive Alliance had made a commitment in the National Common Minimum Programme (NCMP) in 2004 that total public spending on Health in the country would be raised to the level of 2 to 3 percent of GDP. This was also reiterated in the Eleventh Five Year Plan. However, the combined budgetary allocation (i.e. the total outlays from both Union and State Budgets) for Health stands at a meagre 1.06 percent of GDP for 2009-10 (Budget Estimates).
In 2003-04, only 1.58 percent of the total Union Budget was spent on Health. The share of the Health sector in the total spending of the Union Government has gradually increased to 2.3 percent by 2010-11 (BE). However, as a proportion of the GDP, the Union Government’s spending on Health shows a less perceptible increase from 0.26 percent in 2003-04 to 0.36 percent in 2010-11 (BE).

Centre for Budget and Governance Accountability, 2010
Table 2.a: Combined Expenditure of Centre and States on Health and Family Welfare
Centre’s Expenditure $
(in Rs. Crore)
States’ Expenditure(in Rs. Crore)
Centre’s Exp. as % of GDP
Total Exp. (Centre + States) as % of GDP @
2003-04 7249.14 17529 0.26 0.902004-05 8085.95 18771 0.26 0.852005-06 9649.24 22031 0.27 0.882006-07 11757.74 25375 0.28 0.902007-08 14410.37 28907.7 0.29 0.882008-09 18476 38578.8 0.33 1.022009-10 21680 43848.18 0.35 1.062010-11 25154 - 0.36 -
Notes: * Figures for States’ Expenditure are Revised Estimates (RE) for 2008-09 and Budget Estimates (BE) for 2009-10. $ Centre’s expenditure on Health and Family Welfare refers to the expenditure by Ministry of Health and Family Welfare only. It doesn’t include the expenditure of other Ministries.@ These figures may involve double counting of the grants-in-aid from Centre to States under Health and Family Welfare.
Source: Compiled by CBGA from Union Budget, various years, GoI and RBI: State Finances – A Study of Budgets, various years.
Chart 2.a: Share of Health Sector in Union Budget (in %)
Note: The figures for 2003-04 to 2009-10 are RE, while 2010-11 is BE. Source: Compiled by CBGA from Expenditure Budget Vol. I, Union Budget, various years, GoI.
While significant outlays were recommended for some major schemes in the Eleventh Five Year Plan, only a fraction of the proposed outlays have been reflected in the Union Budget of the last four years. In two major schemes—National Rural Health Mission (NRHM) and Health Insurance under Urban Health Mission, the allocation of funds are only 57.5 and 40 percent respectively. Similarly District Hospitals and Human Resources for Health also paint a gloomy picture with only 10.2 and 9.9 percent of recommended outlays in the first four years of the Eleventh Five Year Plan period (see Table 2.b).

Centre for Budget and Governance Accountability, 2010
Table 2.b: Outlays Recommended (by Planning Commission) for Eleventh Plan vs. Union Budget allocations made in the first four years of the Plan
Name of the Plan Scheme / Programme
Proposed Outlay for Eleventh Plan(Rs. in Crore)[at Current Prices]
Allocations Made during 2007-08 (RE)(Rs. in Crore)
Allocations Made during 2008-09 (RE)(Rs. in Crore)
Allocations Made during 2009-10 (RE)(Rs. in Crore)
Allocations Made during 2010-11 (BE)(Rs. in Crore)
Total Budget Outlay Made in the first four years(Rs. in Crore)
% of Allocation Till Now
National Rural Health Mission (NRHM)
89478 10669 11930 13378 15440 51417 57.5
District Hospitals* 2780 - 68 16 200 284 10.2Human Resources for Health * 4000 - 56 16.1 323 395.1 9.9
Health Insurance under Urban Health Mission*
4495 89 311 232.51 1165.72 1798.23 40.01
Note: * Figures for Union Budget allocations for these schemes do not include the Lumpsum provision of funds for North Eastern Region and Sikkim, if any.
Source: Compiled by CBGA from Eleventh Five Year Plan, Planning Commission, GoI; Union Budget, GoI, various years; and Detailed Demand for Grants, Ministry of Health and Family Welfare, GoI, various years.
National Rural Health Mission (NRHM)
There has been an increase in overall expenditure in NRHM with each successive year, which indicates • some improvement in States’ capacity to utilise funds provided by the Central Government. However, in the eighteen ‘focus’ States (mostly the Empowered Action Group States and the north eastern States), the pace of fund utilization has been slow. Many high focus States have received relatively less Central grants in NRHM largely due to their inability • to expedite fund utilisation. This is indicative of systemic weaknesses in such States, which need to be addressed through recruitment of staff and their capacity building. NRHM promotes provisioning of a limited package of services through the government health centres, • rather than comprehensive healthcare. For instance, there is no provisioning for mental health, skin, ENT, and dental health, among other services. Reproductive and child health (RCH) services continue to be the main focus in NRHM.In its appraisal of NRHM, the Comptroller and Auditor General (C&AG) notes implementation • bottlenecks in–planning, community participation, fund management, infrastructure development, procurement and supply of medicines and equipment, monitoring and supervision, among others (C& AG’s Report No. 8 of 2009-10).
Areas of Concern:
Combined expenditure by Centre and States in 2009-10 (BE) still hovers around 1 percent of GDP, •which is far short of the promised 2 to 3 percent of GDP. Allocation of Union Government on Health has increased to Rs. 25,154 crore in 2010-11 (BE) from Rs. 22,641 crore in 2009-10 (BE). This is an 11 percent increase compared to the previous year. Out of this, external contribution i.e. Externally
Centre for Budget and Governance Accountability, 2010
Aided Projects (EAP) is Rs. 3,986 crore, which is 16% of the total Union Government’s Budget on health. In the previous year, EAP contribution was Rs. 3,192.71 crore, which means that this is a 25% increase from previous year. When we exclude the EAP contribution from Union Govt’s budget, the increase is only 9 percent.Allocation on NRHM has increased only by 11 percent from Rs. 14,002 crore to Rs. 15,514 crore. •Given the requirement of additional funds to augment rural health infrastructure, fill in vacancies of doctors, ANMs and paramedics, this seems to be a paltry increase. Given that spending by states under NRHM has also picked up off late, the Union Government should increase allocation further.The allocation on National Disease Control Program has gone down from Rs. 1,063 crore in 2009-10 •(BE) to Rs. 1,050 crore in 2010-11 (BE). The decline in allocation for the scheme is very disturbing given that a number of diseases covered under the scheme has witnessed increased prevalence in the recent past.The over all allocation on Medical Education and Training has gone down from Rs. 3,255.94 crore •in 2009-10 BE to Rs. 2,678.84 crore in 2010-11 BE. Within this, the most pronounced is the fall in allocation on Establishment of AIIMS type Super Specialty Hospitals, where allocation has declined to the tune of Rs. 700 crore. Whether the government is falling back on it promise of creating more AIIMS like institutions or not, remains to be seen. Furthermore, allocations for post graduate medical education needs to be prioritised to fulfil the requirement of specialist doctors. However, the central government has reduced allocation on two premier institutes like PGIMER, Chandigarh, ND JIPGMER, Puducherry.At the same time the Annual Health Survey, slated to begin from 2010 needs to be welcomed as it is •expected to generate regular data at annual intervals on various health indicators, which are not available currently. However, no budget head on this has been created, as a result of which no allocation towards this has been made, so far.
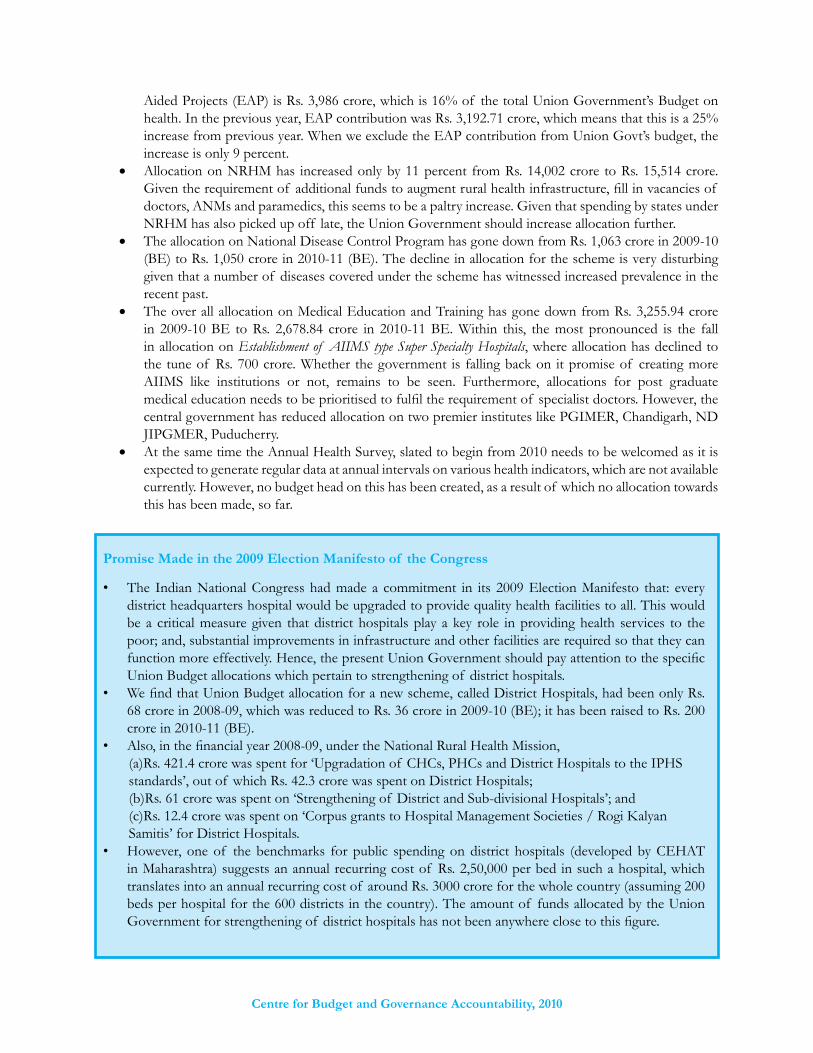
Promise Made in the 2009 Election Manifesto of the Congress
The Indian National Congress had made a commitment in its 2009 Election Manifesto that: every • district headquarters hospital would be upgraded to provide quality health facilities to all. This would be a critical measure given that district hospitals play a key role in providing health services to the poor; and, substantial improvements in infrastructure and other facilities are required so that they can function more effectively. Hence, the present Union Government should pay attention to the specific Union Budget allocations which pertain to strengthening of district hospitals.We find that Union Budget allocation for a new scheme, called District Hospitals, had been only Rs. • 68 crore in 2008-09, which was reduced to Rs. 36 crore in 2009-10 (BE); it has been raised to Rs. 200 crore in 2010-11 (BE).Also, in the financial year 2008-09, under the National Rural Health Mission,•
(a)Rs. 421.4 crore was spent for ‘Upgradation of CHCs, PHCs and District Hospitals to the IPHS standards’, out of which Rs. 42.3 crore was spent on District Hospitals; (b)Rs. 61 crore was spent on ‘Strengthening of District and Sub-divisional Hospitals’; and (c)Rs. 12.4 crore was spent on ‘Corpus grants to Hospital Management Societies / Rogi Kalyan Samitis’ for District Hospitals.
However, one of the benchmarks for public spending on district hospitals (developed by CEHAT • in Maharashtra) suggests an annual recurring cost of Rs. 2,50,000 per bed in such a hospital, which translates into an annual recurring cost of around Rs. 3000 crore for the whole country (assuming 200 beds per hospital for the 600 districts in the country). The amount of funds allocated by the Union Government for strengthening of district hospitals has not been anywhere close to this figure.

Centre for Budget and Governance Accountability, 2010
Budgetary Allocations
Once again Union Budget 2010-11 has not much to offer in the water and sanitation sector. From Rs. 8,269 crore in 2009-10 (RE), allocations have marginally gone up to Rs. 9,522 crore in 2010-11 (BE). The macro picture shows that the allocation for rural water supply and sanitation as percent of Total Expenditure from Union Budget has almost remained stagnant at 0.85 percent. The only silver lining to this is the increased outlay in Rural Sanitation (Total Sanitation Campaign) which is around 33 percent more than the last year’s budget.
The other positive development is the high allocation for ‘Integrated Low Cost Sanitation Programme’ which is almost 58 percent more than previous year. However, since these are only Budget Estimates, we can only wait and watch whether they are revised or not in the financial year.
Table 3.a: Total Expenditure on Rural Water Supply and Sanitation by the Department of Drinking Water Supply, Ministry of Rural Development, GoI
YearRural Drinking Water
Supply and Sanitation*(in Rs. Crore)
Union Govt. Expenditure on Rural Water Supply & Sanitation as a proportion of Total Expenditure from
Union Budget (in %)2003-04 RE 2751.39 0.582004-05 RE 3301.39 0.662005-06 RE 4761.52 0.942006-07 RE 5301.63 0.902007-08 RE 7461.82 1.042008-09 RE 8502.27 0.942009-10 RE 8269.00 0.802010-11 BE 9522.00 0.85
Notes: * Union Budget Outlay for Dept.of Drinking Water Supply under Ministry of Rural DevelopmentSource: Compiled from Expenditure Budget Volume I & II, Union Budget, various years
• The allocation for rural water supply has shown a marginal increase from Rs. 7,199 crore in 2009-10 (RE) to Rs. 8,100 crore in 2010-11 (BE). In rural sanitation too, there has been a small increase in the allocation from Rs. 1,080 crore in 2009-10 (RE) to Rs. 1,422 crore in 2010-11 (BE).
• In urban water supply and sanitation, allocation for the ‘Integrated Low Cost Sanitation Programme’, a Centrally Sponsored Scheme for the replacement of dry latrines with water borne flush toilets and the rehabilitation of workers engaged in manual scavenging, has been increased from Rs. 45 crore in 2009-10 (RE) to Rs. 71 crore in 2010-11 (BE). This is a welcome step. However, allocations for provision of Solid Waste Management near Airports in Few Selected Cities, has shown a steep decline from Rs. 12.56 crore in 2009-10 (RE) to a meager Rs. 3.64 crore in 2010-11 (RE).
• Open defecation and inadequacy of safe drinking water continue to be serious issues despite the progress in target achievements in rural water supply and sanitation.

Centre for Budget and Governance Accountability, 2010
Trend in Allocations for Schemes
Keeping in view the fact that there are only two years for the Eleventh Five Year Plan to end, it is pertinent to look at whether the Plan allocations laid out by the Union government at least measure up to the Proposed Outlay for the Eleventh Plan. A view of Table 3.b clearly shows that Union government allocation for Rural Water Supply is around 78 percent and for Rural Sanitation it is around 68 percent in comparison to what was proposed in the Plan.
Table 3.b: Outlays Recommended (by Planning Commission) for Eleventh Plan vs. Union Budget allocations made in the first four years of the Plan
Name of the Plan Scheme / Programme
Proposed Outlay for Eleventh Plan (Rs. in Crore) [at Current Prices]
Allocations Made during 2007-08 (RE)(Rs. in Crore)
Allocations Made during 2008-09 (RE)(Rs. in Crore)
Allocations Made during 2009-10 (RE)(Rs. in Crore)
Allocations Made during 2010-11 (BE)(Rs. in Crore)
Total Budget Outlay Made in the first four years(Rs. in Crore)
%of Allocation Till Now
Ministry of Rural Development
NRDWP (erstwhile Rural Water Supply Programme)
34916 4601.5# 7300 7199* 8100* 27,200.5 77.9
Total Sanitation Campaign 6910 996# 1200 1080* 1422* 4,698 67.9
Notes: #-Denotes actual expenditure; * Figure does not include the Lumpsum Provision of funds for North Eastern Region and Sikkim (if any).
Source: Expenditure Budget Vol-II, Various Years, Government of India; Detailed Demand for Grants, Ministry of Rural Development, Appendix Eleventh Five Year Plan (2007-2012)
Some Important Schemes:
Bharat Nirman / National Rural Drinking Water Programme
Under Bharat Nirman for rural water supply, Rs 4,098 crore in 2005-06, Rs 4,560 crore in 2006-07, Rs 6,441.69 crore in 2007-08 and Rs 7,276.29 crore in 2008-09 have been utilized. In 2009-10, a budgetary provision of Rs 8,000 crore has been made, out of which Rs 5,669.88 crore has been utilized. In the case of quality-affected habitations, as reported by States, 52,428 habitations have been fully covered by safe water supply (Table 3.c).Projects to cover 2,57,512 habitations have been given technical and administrative approval and are under execution. The goal is to cover all water quality-affected habitations with safe drinking water by the end of 2011 (Economic Survey, 2009-10).
Table 3.c: Bharat Nirman - Rural Drinking water - Cumulative Achievements
Component Target (at the beginning of Bharat Nirman)
Cumulative achievements*
Uncovered habitations to be provided with potable water 55,067 54,589

Centre for Budget and Governance Accountability, 2010
Slipped back habitations to be provided with potable water 3,31,604 3,83,106#
Quality affected habitations to be provided with potable water 2,16,968 3,15,132#
Total 6,03,639 7,52,827#Higher achievement reported cumulatively as some states have reported coverage of habitations other than those included in Bharat Nirman Programme.* As on December 23, 2009.
Source: Economic Survey, 2009-10
To enable rural schools to provide safe and clean drinking water for children, the Jalmani programme was launched on November 14, 2008 and Rs 100 crore was provided to the States in 2008-09. Under the programme, 100 percent financial assistance has been provided to States to install standalone water purification systems in rural schools to allow children’s access to safe and clean water. During 2009-10, another Rs 100 crore has been made available and allocated to the States (Economic Survey, 2009-10).
Total Sanitation Campaign
With the scaling up of the Total Sanitation Campaign (TSC), combined with higher resource allocation, programme implementation has improved substantially. Since 1999, over 6.01 crore toilets have been provided to rural households under the TSC. A significant achievement has also been the construction of 9.37 lakh school toilets and 2.95 lakh Anganwadi toilets. The number of households being provided with toilets annually has increased from only 6.21 lakh in 2002-03 to 115 lakh in 2008-09. In 2009-10 (up to December 22, 2009), more than 62 lakh toilets were provided to rural households. The cumulative coverage till now is 61 percent as against only 21.9 percent rural households having access to latrines as per Census 2001 data (Economic Survey, 2009-10).
Quality Concerns and Sustainability Issues
Major challenges facing the rural water supply sector are source sustainability which is one of the prime reasons for slippage of fully covered habitations. The other challenges include maintenance of supply systems and water quality problems.
In the TSC, an important fact which remains is that coverage need not necessarily mean usage of sanitation facilities. There are various studies which indicate that mere coverage of sanitation have not resulted in usage and resulted behaviour change of not defecating in the open. Quality of construction, materials used, poor maintenance and availability of water are some of the factors which influence the usage of toilets.
Right to Human Dignity: The issue of manual scavenging:
It is shameful that manual scavenging still continues in India. There were approximately 3.42 lakh manual scavengers in India in 2006, according to government records, which needed to be rehabilitated. In 1993, the Indian Parliament enacted a law prohibiting employment of manual scavengers and construction of dry latrines. The National Human Rights Commission of India (NHRC) has termed manual scavenging as one of the worst violation of Human Rights. The NHRC has called for State Governments to stick to the definition of manual scavengers as per the Manual Scavengers and Construction of Dry Latrines (Prohibition) Act, 1993. It also mentions that there should be a clear demarcation between manual scavengers and sanitation workers. (People’s Mid-Term Appraisal of the Eleventh Five Year Plan – A Sectoral Review; Centre for Budget and Governance Accountability, Wada Na Todo Abhiyan and National Social Watch Coalition, 2010)

Centre for Budget and Governance Accountability, 2010
There must be serious efforts to encourage and make available alternative dignified employment opportunities for the manual scavengers. The increased allocation in the ‘Integrated Low Cost Sanitation Programme’ is a step in the right direction.
Despite fulfilment of targets, challenges continue to abound the sector. The challenges faced in the urban water and sanitation sector are sourcing of water, distribution losses in water supply, treatment of waste-water and rainwater harvesting, solid waste management, operationalsing the National Urban Sanitation Policy and private sector participation. In Rural Water Supply and Sanitation, there is the issue of fund utilisation. A CAG audit for the rural water supply programme (Accelerated Rural Water Supply Programme) revealed that 10 States were not able to provide matching grants to the tune of Rs 2,773.14 crore. There was under utilisation of 45 percent to 75 percent of financial assistance from the Centre to the states for the water supply scheme between 2002 and 2007. Further, technology considerations, sustaining Nirmal Grams, ineffective and insufficient monitoring for outcome measurement, are some other issues that need to be tackled. In addition, concerns for inclusion, equity and gender relations are not clearly articulated in the policy guidelines of the sector. (People’s Mid-Term Appraisal of the Eleventh Plan – A Sectoral Review; Centre for Budget and Governance Accountability, Wada Na Todo Abhiyan and National Social Watch Coalition, 2010)
Water Supply and Sanitation has hardly been accorded the priority that it deserves. However, certain initiatives taken since the Eleventh Plan have managed to draw attention that the sector deserves. These were the release of the National Urban Sanitation Policy in October 2008, the Third South Asia Conference on Sanitation and the Delhi Declaration in November 2008, launch of the New Guidelines for National Rural Water Supply Programme, April 2009 and new Guidelines for Nirmal Gram Puraskar, August 2009. All these have somewhat paved the way for ‘clean drinking water, sanitation and clean living conditions’ for all which the Eleventh Five Year Plan envisages.

Centre for Budget and Governance Accountability, 2010
• The allocation for Dept. of Rural Development has increased from Rs. 62,201 crore in 2009-10 (RE) to Rs. 66,138 crore in 2010-11 (BE).
• The allocation on Mahatma Gandhi National Rural Employment Guarantee Scheme (MGNREGS) has gone up by only 2.5 percent from Rs. 39,100 crore in 2009-10 (RE) to Rs. 40,100 in 2010-11 (BE).
• A major development for rural housing sector is a substantial increase in unit costs of housing provided under Indira Awaas Yojana (IAY). The unit cost has been increased by 30 percent to Rs. 45,000 for plain areas and Rs. 48,500 for hilly areas.
• Quantum of allocation for IAY has, however, increased by only 13 percent from Rs. 8,800 crore to Rs. 10,000 crore.
• Allocation for Pradhan Mantri Gram Sadak Yojana (PMGSY) has remained at the 2009-10 level at Rs. 12,000 crore.
• The allocation for Backward Region Grant Fund (BRGF) has been increased by 26 percent, from Rs. 5,800 crore in 2009-10 (RE) to Rs. 7,300 crore.
The Union Budget 2010-11, having been presented at a crucial juncture with an economy creeping out of recession and rising commodity prices, has belied all expectations with its policy pronouncements on rural development. With heart-warming allusions to popular philosophies, the Finance Minister has tried to sidle past a dampener for rural development when rural India required larger investments in rural income generation, housing and infrastructure. The wide gaps in the attainment of physical targets set forth in the Eleventh Five Year Plan, which is nearing its completion, required larger investments in this sector.
The UPA in its first stint undertook a host of policy initiatives, landmark among which is the National Rural Employment Guarantee Act (NREGA) which promised at least 100 days of wage employment to a household seeking employment. Noteworthy also, was the UPA initiative on rural infrastructure development christened Bharat Nirman which encompasses rural housing, rural electricity connection, telephony, all-weather road connectivity, safe drinking water, sanitation and expansion of irrigation capacity. However, with the second full budget of the second run of UPA, the financial commitment on rural development seems less than forthcoming.
Trends in Allocations
Starting from 2004, when the UPA first took office, the total allocation on rural development as a whole took a quantum jump. From 2004-05 to 2008-09 the average annual growth rate of expenditure on rural development was around 37 percent. Superlative growth was attained in 2008-09 with an overall growth rate of 79 percent over the allocation in 2007-08. However, increase in allocation in this sector did not hold the trend for years 2009-10 and 2010-11. Outlays in Union Budget 2010-11 have reduced by 8 percent over the previous year. Overall the allocation for rural development sector stood at 1.1 percent of GDP for 2010-11 compared to 1.2 percent of GDP in 2009-10 (BE).

Centre for Budget and Governance Accountability, 2010
Table 4.a: Union Government’s Expenditure on Rural Development
Dept. of Rural
Development(in Rs. Crore)
Growth Rate (%)
Dept. of Land
Resources(in Rs. Crore)
Growth Rate (%)
Dept. of Drinking
Water Supply
(in Rs. Crore)
Growth Rate (%)
Total Expenditure on
Rural Development(in Rs. Crore)
Growth Rate (%)
2004-05 16020 1014 3284 20318 2005-06 21350 33 1397 38 4738 44 27485 352006-07 24284 14 1412 1 5297 12 30993 132007-08 28797 19 1396 -1 7439 40 37631 212008-09# 56884 98 1800 29 8502 14 67186 792009-10@ 62707 10 2406 34 9203 8 74315 112009-10# 62201 -1 2027 -16 9203 0 73431 -12010 - 11@ 66138 6 2666 32 10584 15 79387 8
Note: @ are Budget Estimates and # are Revised Estimates. Rest of the figures pertaining to all other years are Actual figures.
Source: Compiled from Detailed Demand for Grant (various years) and Expenditure Budget Vol. II (2010-11).
Growth in allocation on rural development is largely driven by increased outlays in department of rural development, which includes some major programmes on rural employment generation and infrastructure creation like rural roads and housing. Allocations for department of land resources and drinking water supply although show an increasing trend over the years, the growth rate for drinking water supply has tapered down considerably since 2007-08 with only Department of Land Resources showing growth rate similar to that experienced in years 2008-09 and 2009-10.
Chart 4.a: Growth in Union Government’s Allocations for Rural Development
0100002000030000400005000060000700008000090000
2004-05
2005-06
2006-07
2007-08
2008-09#
2009-10@
2009-10#
2010-
11@
in R
s. C
rore
Dept of RuralDevelopment
Dept. of LandResources
Dept. ofDrinking WaterSupply
TotalExpenditure onRuralDevelopment
Source: Detailed Demand for Grants (various years), Ministry of Rural Development, Expenditure Budget Vol. II, Union Budget 2010-11.
Department of Rural Development: Major Programmes/Schemes
Department of Rural Development, which has seen the bulk of allocation in rural development sector operates

Centre for Budget and Governance Accountability, 2010
major schemes for rural employment (NREGS/MGNREGS), rural livelihood and entrepreneurship (SGSY), rural housing (IAY) and rural roads (PMGSY). The general trend in growth of allocation across all the schemes is uneven. It is noteworthy that beneficiary-driven schemes like NREGS, SGSY and IAY saw a significant rise in allocation in 2008-09 when UPA-I was nearing completion of its tenure. Strikingly, the allocations in IAY and SGSY hardly saw an increase in the following years. For the present budget, rise in allocations in these schemes is miserly with only SGSY recording a significant increase of 27 percent.
Table 4.b: Union Budget Allocations for Major Programmes/Schemes
NREGSGrowth
Rate (%)
SGSYGrowth
Rate (%)
IAYGrowth
Rate (%)
PMGSYGrowth
Rate (%)
2004-05 - - 997 - 2888 - 2459 -2005-06 - - 1029 3 2741 -5 4217 722006-07 8694 - 1190 16 2910 6 6270 492007-08 12661 46 1677 41 3885 34 6500 42008-09# 30000 137 2350 40 8800 126 7780 202009-10@ 39100 30 2350 0 8800 0 12000 542009-10# 39100 0 2350 0 8800 0 11340 -62010 - 11@ 40100 3 2984 27 10000 14 12000 6
Note: @ are Budget Estimates and # are Revised Estimates. Rest of the figures pertaining to all other years are Actual Estimates.
Source: Detailed Demand for Grants (various years), Ministry of Rural Development, Expenditure Budget Vol. II, Union Budget 2010-11.
Mahatma Gandhi National Rural Employment Guarantee Scheme (MGNREGS/NREGS)
Essentially being a demand-driven scheme, the utilization in NREGS depends on its effective implementation. The allocation for the scheme increased substantially in the first four years of its implementation given that with better implementation, off take from the scheme would also significantly increase. However, it has also been widely observed that in most of the states, the scheme has not been able to provide the guaranteed minimum days of employment to a large number of beneficiaries. The reasons are varied ranging from ineffective implementation to paucity of funds at the district level. On the other hand, with the economy yet to gather momentum out of a recession, lack of any substantial increase in allocation as per 2009-10 (RE) and 2010-11 (BE) betrays a lack of sense of urgency by the government towards rural employment generation.
Swarnajayanti Gram Swarozgar Yojana (SGSY)
The scheme aims to organise the rural poor into SHGs through the process of social mobilization, train and build capacity and provide for income generating assets. The overall objective of the scheme has been to integrate provisions like skill upgradation, infrastructure including marketing development and technology penetration into a programme providing for poverty alleviation and sustainable livelihood options. The Eleventh Five Year Plan envisaged that allocations for the scheme be demand-driven. Although, allocation for the scheme increased significantly over the two consecutive years of the beginning of the plan period, the growth in allocations tapered down significantly belying the adoption of a demand-driven model.
Indira Awaas Yojana (IAY)
The rural housing scheme is one of the major beneficiary driven initiatives of the Ministry of Rural Development. The scheme got a magnificent impetus in 2008-09 with an increase of 127 percent over the previous year. With

Centre for Budget and Governance Accountability, 2010
the Eleventh Five Year Plan overtly targeting 150 lakh houses for the rural poor during the plan period, it was expected that the impetus will continue. However, allocation for the scheme for 2008-09 and 2009-10 remained same with a marginal increase in the present Union Budget 2010-11. Moreover, the present budget also saw a major increase in the unit cost of provisioning rural housing for both plain areas and hilly areas. However, lack of concomitant increase in the total quantum of allocation for the scheme effectively scales down the physical targets for rural housing for a financial year.
Pradhan Mantri Gram Sadak Yojana (PMGSY)
Bharat Nirman Programme envisaged a massive scaling up in terms of habitation connectivity coverage, construction targets and financial investment. To achieve the targets of the Programme, 1,46,185 km of rural roads are proposed to be constructed to benefit 66,802 unconnected eligible habitations in the country. In respect of the Hill States (North-East, Sikkim, Himachal Pradesh, Jammu & Kashmir and Uttaranchal) and the Desert Areas, the objective would be to connect habitations with population of 250 persons and above. It is also proposed to upgrade nearly 1.94 lakh km of the existing rural roads which are identified through routes of the core network. As per the Outcome Budget of the Ministry of Rural Development, compared to all other schemes, PMGSY has shown considerably better utilization of funds and achievement of physical targets. In this context, while the scheme got a big fillip in allocation in the 2009-10 budget, the percentage increase in allocation in 2010-11 is disappointing with a large number of habitations yet to be covered under the scheme.
Backward Region Grant Fund (BRGF)
The scheme operated by Ministry of Panchayati Raj aims at development of backward areas in order to reduce the regional imbalances and speed up development. Panchayat at all levels in the backward districts will have a central role in planning and implementation of schemes under the Backward Regions Grants Fund. The scheme also helps in fostering convergence of programmes/schemes in rural development at the grassroots level in the backward district. The increase in allocation in the scheme from Rs. 5,800 crore in 2009-10 to Rs. 7,300 crore may be considered as the sole high point of rural development in the present budget.

Centre for Budget and Governance Accountability, 2010
• As a proportion of the total expenditure from Union Budget, the expenditure on Agriculture & Allied Activities shows a marked decline from 15.7 % in 2008-09 (Actuals) to 9.7 % in 2010-11 (BE). Union Government’s expenditure on Agriculture & Allied Activities, as a proportion of the GDP, shows an equally visible decline from 2.5 % in 2008-09 (Actuals) to 1.56 % in 2010-11 (BE).
• Union Government’s total expenditure on the Rural Economy (which includes expenditure on Agriculture and Allied Activities, Rural Development, Special Area Programmes, Irrigation and Flood Control and Village and Small Industries) registers a decline from 3.34 % of GDP in 2008-09 (Actuals) to 2.59 % of GDP in 2010-11 (BE).
• Since 2005-06, a decline has been observed in the share of Agriculture and Allied Activities in total Central Plan Allocation, which indicates that the priority accorded to this sector has been on the decline.
• Although the responsibility for financing Irrigation and Flood Control measures lies more with the State Governments, Union Government’s budgetary allocation towards this sector seems to have been far from satisfactory.
• Allocations towards Agricultural Research and Education too do not indicate any increasing trend. • If we compare the total allocations made in the four Union Budgets from 2007-08 to 2010-11 for major schemes
in Agriculture with the allocations recommended by the Planning Commission for the 11th Plan period (2007-08 to 2011-12), we find that the total allocation in the last four Union Budgets has not been anywhere close to 80 % of the total outlay recommended by the Planning Commission.
• An allocation of Rs. 400 crore has been made in this budget for extending the green revolution to the eastern region of the country, comprising five States and eastern part of Uttar Pradesh. The government intends to provide high yielding variety seeds, technology and irrigation etc. to the farmers (as these are essential elements of green revolution); however, the allocation per farmer household in the target region comes to a meagre Rs. 123.
• Again, an allocation of Rs. 300 crore has been made in this budget for organising pulses and oilseeds in 60,000 rain-fed villages; and the average allocation per village comes to a mere Rs. 50,000.
India has experienced a negative agricultural growth rate in 2009-10. This problem, to a large extent, can be linked to the state of public investments in this sector. It was expected that the present budget would try to address the crisis prevailing in the agricultural sector, but the low priority accorded to this sector in Union Budget 2010-11 indicates that the misery of the sector is far from over.
Investments from the Union Budget in Agriculture and Allied Activities Within a period of one year or so, prices of most of the essential commodities have more than doubled in our country. This calls for huge budgetary investment in agricultural sector in order to boost the production and productivity of the sector. The Finance Minister, in his budget speech, has reiterated a four pronged strategy to alleviate the
Negative growth rate in the Agriculture sector
Following an average growth of over 3.8 % per annum over the four years from 2005-06 to 2008-09, the Agriculture and Allied Activities sector has witnessed a negative growth rate, i.e. - 0.2 %, during the year 2009-10. The share of this sector (Agriculture and Allied Activity, at constant 2004-05 prices) in the country’s GDP has consistently been declining over the years and it reached 15.7 % during 2008-09, compared to the previous year’s share of 16.4 %. A slight improvement has been noticed in the Gross Capital Formation (GCF) in Agriculture, as a proportion to the total GDP as well as agricultural GDP. However, the share of GCF in agriculture to the total GDP hovers around 3 % over the period from 2004-05 to 2008-09.Source: Economic Survey, 2009-10, GoI.

Centre for Budget and Governance Accountability, 2010
misery of the sector. However, if one looks at the trend in budgetary investment in agriculture sector, it is clear that allocations made towards this sector in the present budget are far from satisfactory.
Table 5.a: Union Government’s Spending on the Rural Economy* as a Proportion of the Total Union Budget Expenditure and the GDP
Year
Expenditure on Rural Economy* Expenditure on Agriculture and Allied Activities
As % of Total Union Budget Expenditure
As % of GDP at current market
prices
As % of Total Union Budget Expenditure
As % of GDP at current market
prices2004-05 9.91 1.52 7.30 1.122005-06 11.32 1.55 7.43 1.012006-07 14.58 1.99 8.28 1.132007-08 13.05 1.88 9.64 1.392008-09 21.06 3.34 15.74 2.502009-10 RE 16.79 2.78 10.77 1.792010-11 BE 16.18 2.59 9.75 1.56
Note: Expenditure on Rural Economy* includes expenditure on (i) Agriculture and Allied Activities, (ii) Rural Development, (iii) Special Area Programmes, (iv) Irrigation and Flood Control and (v) Village and Small Industries.Source: Computed from the data given in Annual Financial Statement (AFS) and Budget at a Glance, Union Budget, various years.
Union Government’s total expenditure on the Rural Economy (which includes expenditure on Agriculture and Allied Activities, Rural Development, Special Area Programmes, Irrigation and Flood Control and Village and Small Industries) registers a decline from 3.34 % of GDP in 2008-09 (Actuals) to 2.59 % of GDP in 2010-11 (BE). A similar picture emerges for expenditure priority towards Agriculture and Allied Activities in the Union Budget. Union Government’s expenditure on Agriculture and Allied Activities had revolved around 1 to 1.4 percent of GDP during the period 2004-05 to 2007-08. The expenditure on Agriculture and Allied Activities peaked in 2008-09 at 2.5 percent of the GDP. However, this exceptional rise had been due to the additional budgetary provisions for the payment to the manufactures/agencies under the scheme of sale of decontrolled fertilisers to farmers at concessional rates. In the subsequent years, the share of expenditure on Agriculture and Allied Activities has experienced a decline. As a proportion of the total expenditure from Union Budget, the expenditure on Agriculture & Allied Activities shows a marked decline from 15.7 % in 2008-09 (Actuals) to 9.7 % in 2010-11 (BE). Union Government’s expenditure on Agriculture & Allied Activities, as a proportion of the GDP, shows an equally visible decline from 2.5 % in 2008-09 (Actuals) to 1.56 % in 2010-11 (BE).
We must note here that since 2005-06, a declining has been observed in the share of Agriculture and Allied Activities sector in the total Central Plan Allocation, which shows that the priority accorded to this sector in terms of plan investment has declined over the last few years.
In absolute figures, the allocation for Ministry of Agriculture in 2010-11 (BE) registers an increase over the last budget. The increased budget allocation has been mostly in favour of the Department of Agriculture and Cooperation; no such encouraging trend, however, has been witnessed for the allocations for the Department of Agricultural Research and Education or the Department of Animal Husbandry Dairying and Fisheries. Table 5.b: Allocations Under three Departments of Ministry of Agriculture since 2009-10 BE (in Rs. Cr.)
Ministry of Agriculture2009-10 BE 2009-10 RE 2010-11 BE
Plan Non-Plan Total Plan Non-
Plan Total Plan Non-Plan Total
Dept. of Agriculture and Cooperation 11307 608 11915 10765 1151 11917 15042 606 15648
Dept. of Agricultural Research and Education 1760 1481 3241 1760 1501 3261 2300 1518 3818

Centre for Budget and Governance Accountability, 2010
Dept. of Animal Husbandry Dairying and Fisheries
1100 106 1206 930 106 1036 1300 99 1399
Total allocation under the Ministry 14167 2195 16362 13455 2758 16214 18642 2223 20865
Source: Compiled from Expenditure Budget Vol. II, Union Budget 2010-11, GoI
Expenditure on Irrigation and Flood Control Union Government’s budgetary allocation towards financing Irrigation and Flood Control measures has been far from satisfactory. The budgetary provisions made by the Union Government towards Irrigation and Flood Control reveal a stagnating trend since 2004-05. In the past fiscal year, Indian economy was faced with a situation of unprecedented flood in the southern States followed by droughts in most part of the country. In this context, it was expected that this budget would propose a higher allocation towards financing Irrigation and Flood Control measures. However, the expenditure towards financing of these measures, as a proportion of the GDP, has been estimated to be a meagre 0.01 percent in 2010-11 (BE).
Table 5.c: Union Government’s Expenditure on Irrigation and Flood Control
Year Union Govt.’s Expenditure on Irrigation and Flood Control As % of Total Union Budget As % of GDP
2004-05 334.5 0.07 0.012005-06 407.9 0.08 0.012006-07 418.9 0.07 0.012007-08 404.5 0.06 0.012008-09 617.8 0.07 0.012009-10 RE 681.5 0.07 0.012010-11 BE 722.8 0.07 0.01
Source: Computed from the data given in AFS, Various Years, GoI.
Planning Commission Recommended Outlay vs. Union Budget Allocations during First Four Years of 11th PlanThe fiscal year 2010-11 is the fourth year of the Eleventh Five year plan period. If we compare the total allocations made in the four Union Budgets from 2007-08 to 2010-11 for major schemes in Agriculture with the allocations recommended by the Planning Commission for the 11th Plan period (2007-08 to 2011-12), we find that the total allocation in the last four Union Budgets is no where close to 80 percent of the total outlay recommended by the Planning Commission. This is the case for most of the schemes under the Ministry of Agriculture, such as, the scheme for Micro Irrigation, Technology Mission on Cotton, National Horticulture Mission, Macro Management of Agriculture and Rashtriya Krishi Vikas Yojana, etc.
Table 5.d: Proposed Outlay vis-à-vis Allocations in the Major Schemes/Programmes During First Four Years of Eleventh Five Year Plan: A Reality Check
Name of the Plan Scheme /
Programme
Proposed Outlay for Eleventh
Plan Rs. in crore (at Current Prices)
Allocations Made during 2007-08
Allocations Made during 2008-09
(RE)
Allocations Made during 2009-10 (BE)
Allocations Made during 2010-11 (BE)
Total Budget Outlay
Made in the first
four years of the
Eleventh Plan
% of total Allocation
Vis-à-vis the
proposed outlay
during the Eleventh
Plan.

Centre for Budget and Governance Accountability, 2010
Integrated Watershed Management Programme (IWMP)
17372 1175 1591 1959 2212 6936 39.9
National Food Security Mission 4883 396 1023 1350 1221 3990 81.7
Technology Mission on Cotton (TMC) 450 66 59 60 10 195 43.4
Micro Irrigation 3400 409 430 430 1000 2269 66.7
National Horticulture Mission 8809 919 1000 1100 1062 4081 46.3
Agriculture Census 80 15 20 20 15 70 86.9
National Agricultural Insurance Scheme (NAIS)
3500 719 694 644 950 3007 85.9
Macro Management of Agriculture (MMA) Scheme
5500 1001 776 786 772 3335 60.6
Rashtriya Krishi Vikas Yojana 25000 1249 2892 4067 6722 14930 59.7
Note: Budget Figures for the year 2007-08 are actuals as given in the Detailed Demand For grants of the respective Departments, and for the year 2008-09 are Revised Estimates. For the year 2009-10 and 2010-11, figures are Budget Estimates. Allocation for the year 2010-11 excludes allocation towards North East states and Sikkim.
Other Proposals in the Budget
An allocation of Rs. 400 crore has been made in this budget for extending the green revolution to the eastern region of the country, comprising five states and eastern part of Uttar Pradesh. The government intends to provide high yielding variety seeds, technology and irrigation etc. to the farmers (as these are essential elements of green revolution); however, the allocation per farmer household in the target region comes to a meager Rs. 123. Likewise, an allocation of Rs 300 crore has been made in this budget for organising pulses and oilseeds in 60,000 rain-fed villages; and the average allocation per village comes to a mere Rs 50,000.
Development and sustainability of agriculture in India depends crucially on public investment in this sector. In the context spiralling food prices owing to the mismatch between demand and supply of agricultural outputs, it was hoped that the Union Budget for 2010-11 would accord a high priority to this sector than in the past. However, allocations under different schemes and programmes of the Ministry of Agriculture have been far short of the expectations. No significant policy pronouncements have been made in the budget 2010-11, except a few like interest subvention and fixing the target of rural credit which would really benefit the farming community. If we wish to achieve inclusive and green growth, a ‘big push’ for agriculture sector is the need of the hour.

Centre for Budget and Governance Accountability, 2010
Indian economy experienced a negative growth rate in agriculture (- 0.2 percent in 2009-10 as per Economic Survey 2009-10) along with spiralling prices of most essential commodities over the last couple of years. At the same time, it also experienced significant job loss in the manufacturing and textile industries as well as in urban construction sector due to economic recession. The state of affairs was aptly portrayed when the Food and Agriculture Organisation’s (FAO) Global Hunger Index, ranked India at a low of 65 among the 84 countries indicating the state of acute starvation and hunger in the country during 2009. Further, as much as 77 per cent of the total rural population spends either less than or equal to Rs. 20 per day as consumption expenditure which points towards the misery of the rural mass in terms of food deprivation and malnutrition. The severity of the situation is also reflected in the data on child malnutrition and women who are anaemic. As has been widely reported, around 50 per cent children are undernourished and more than 75 per cent women are anaemic in rural India. Per capita net availability of food grains is on a decline since early 1990s.
The grim reality calls for immediate action in the form of increased public investment under food subsidy in order to achieve food security for all. Although, there has been a significant improvement in allocation towards food subsidy over the years, food security still seems like an elusive goal. Before getting into the details of budgetary provisions for food subsidy, it is important to look at the trends of major subsidies provided in the Union Budget during different fiscal years.
Table 6.a: Subsidies given in the Union Budget since 2004-05 (Figures in Rs. Crore)
Items/Year 2004-05 2005-06 2006-07 2007-08 2008-09 2009-10 (RE)
2010-11 (BE)
Food Subsidy 25798 23077 24014 31328 43751 56002 55578
Indigenous (Urea) Subsidies 10243 10653 12650 12950 17696 14080 15981
Imported (Urea) Subsidies 494 1211 3274 6606 10079 3948 5500
Sale of decontrolled fertilizer with concession to farmers 5142 6596 10298 12934 48555 34952 28500
• There has been a substantial decline in total subsidy from the Union Budget from Rs. 1,29,708 crore in 2008-09 (Actuals) to Rs 1,16,224 crore in 2010-11 (BE).
• Given that inflation in food articles has been as high as 18 % over the last few months, it was expected that there would be an increased allocation for Food Subsidy. However, Union Budget 2010-11 on this count has been very disappointing; Food Subsidy has been reduced from Rs. 56,002 crore in 2009-10 (RE) to Rs. 55,578 Crore in 2010-11 (BE).
• Universalisation of PDS in the country calls for additional funds to the tune of Rs. 88,563 crore under food subsidy.

Centre for Budget and Governance Accountability, 2010
Total Fertiliser Subsidy 15879 18460 26222 32490 76330 52980 49981
Petroleum Subsidy 2956 2683 2699 2820 2852 14954 3108
Grants to NAFED for MIS/PPS 120 260 560 860 375 850 425
Other Subsidies 1204 3042 3630 3428 6127 6239 7132
Import/Export of sugar, Edible Oils etc 0 0 0 0 0 0 0
Interest Subsidies 564 2177 2809 2311 3493 2719 4416
Other Subsidies 640 865 821 1117 2634 3520 2716
Total Subsidies 45957 47522 57125 70926 129708 131025 116224
Total Expenditure 498252 505738 583387 712679 883956 1021547 1108749
GDP at Market Prices 3239224 3706473 4283979 4947857 5574449 6164178 6934700
Total Subsidies as proportion to GDP (%) 1.42 1.28 1.33 1.43 2.33 2.13 1.68
Total Subsidies as Proportion to Total Government Expenditure (%)
9.22 9.40 9.79 9.95 14.67 12.83 10.48
Source: Compiled from Expenditure Budget Vol. I, Union Budget, GoI.
It has been observed that, in absolute terms, there has been a drastic decline in allocation towards total subsidy in the current budget for 2010-11 compared to the allocations in the previous budget. There has been a decline in total subsidies as a proportion to the GDP since 2008-09. During 2008-09, total subsidies as a proportion to the GDP were 2.33 percent, which declined to 1.68 percent in 2010-11 (BE). Similarly, total subsidies as a proportion to the total Union Budget declined to 10.48 percent in 2010-11 (BE) from 14.67 percent in 2008-09. The major cutback in the case has been in the total fertilizer subsidy since 2008-09. Moreover, there has been a decline in the amount of subsidies given to manufacturers/agencies for concessional sale of decontrolled fertilisers and subsidy on indigenous fertilisers.
Chart 6.a: Allocation on Food Subsidy as percent of GDP and Total Expenditure since 2004-05
0.80
0.62
0.57 0.
77
0.57 0.
77 0.98
5.85
5.18
4.56
3.70
4.83
3.70
4.83
0.0
1.0
2.0
3.0
4.0
5.0
6.0
2004-05 2005-06 2006-07 2007-08 2008-09 2009-10 RE 2010-11 BE
Food Subsidy As % of the GDP Food Subsidy as % of Total Union Budget
Source: Computed from the data given in Expenditure Budget Vol-1, GoI

Centre for Budget and Governance Accountability, 2010
Failure of macro management of agricultural outputs resulted in high volatility of prices of major foodgrains in the last couple of years. The allocation under food subsidy in 2010-11 has fallen not only as a proportion to the total Union Budget and to the GDP; it has also shown a decline in absolute terms compared to the previous years Revised Estimates i.e. 2009-10 (RE). This indicates that government is not serious about providing food security to the people, particularly the poorer sections of the society. Keeping allocations in the 2010-11(BE) towards food subsidy at such a low level (compared to the allocations made in previous year’s Revised Estimate) indicates that government is not even interested to implement the proposed National Food Security Act. It has been observed that the share of food subsidy as a proportion to the total Union Budget and to the GDP during 2004-05 to 2010-11 shows a marginal increase. Share of food subsidy as a proportion to the GDP has remained less than one percent during the period 2004-05 to 2010-11.
Given the situation, where food inflation is around 18 percent, it was envisaged that there would be an increased allocation on account of food subsidy and rural employment generation programmes such as under MGNREGS. However, the budget 2010-11, on this count was found to be wanting. In this context, we put forward an estimation of the amount of budgetary allocation required to universalise PDS and to secure food for all.
Estimating the amount of Food Subsidy required for Universal PDS:
Clearly the current allocation for food security is abysmally low. The need of the hour is to restart the Universal PDS (UPDS). However, the government seems to be in no mood to restore the UPDS. Further, the proposed National Food Security Act has some fundamental fallacies. For instance, until now, Antyodaya families were entitled to receive 35 kg of wheat/rice per month at Rs. 2 a kg. If the proposed National Food Security Act is implemented, these AAY families will get 10 kg less of subsidized foodgrains. To meet the shortfall, these poorer families have to buy 10 kg of foodgrains from the open market. In this regard, we provide here an estimation of the total food subsidy that government might consider in the coming budgets.
Estimation
The attempt here is to make the policy makers aware of the magnitude of food subsidy that the government needs to provide in the coming budgets in order to ensure food for all.
To ensure food for all, an additional Rs. 88,563 crore may be required to supplement the present provisions of food subsidy in the country. This cost estimation of the proposed universalisation of PDS is based on the following assumptions:
Total number of households in the country at present is 23.96 crore (approx 24 crore) based on the 1. assumption that the size of household is 4.8 (as reported in NFHS-3) and the projected population of the country at present is 115 crore Extending provision of PDS to all the households in the country would demand subsidized food grains 2. at 35 kg per month per household at the Central Issue Price (CIP) of Rs. 3 per kg.Assuming that present Minimum Support Price (MSP) as well as Economic Costs of wheat and rice will 3. not increase from what it is at present i.e. Rs. 1,893.7 per quintal of rice and Rs. 1,402.5 per quintal of wheat.Assuming that the distribution of rice and wheat will be in the ratio of 2:1. 4.
Based on the above assumptions, the total amount of foodgrains needed for distribution through PDS would be around 1008 lakh tonnes. Out of this, the amount of rice and wheat needed for distribution would be around 672 lakh tonnes and 336 lakh tonnes respectively. As a whole, the total amount as food subsidy per annum would be Rs. 1,44,141 crore. At present, the provision of food subsidy accounts for Rs. 55,578 crore as per the budget estimate of 2010-11. Therefore, in the coming budget, i.e. 2011-12, government will have to

Centre for Budget and Governance Accountability, 2010
make provisions of an additional amount of Rs. 88,563 crore.
Table 6.b: Required Amount of Food grains and Food Subsidy (per annum)
A Total amount of food grains (rice/wheat) to be distributed (per annum) at 35 kgs per month per household 1,008 lakh tonnes
B Proposed CIP for food grains per tonne (Rs. 3 per kg X 1,000 Kg) Rs. 3,000
i Total amount of rice need to be distributed (per annum) 672 lakh tonnes
ii Total amount of wheat need to be distributed (per annum) 336 lakh tonnes
C Total amount which would be recovered through CIP (Rs. 3,000 X 1,008 lakh tonnes) Rs. 30,240 Crore
D Economic costs per tonne of rice (Rs. 1,893.7 X 10) Rs.18,937
a Total economic costs for the distribution of proposed amount of rice Rs. 1,27,257 Crore
E Economic costs per tonne of wheat (Rs. 1,402.5 X 10) Rs.14,025
b Total economic costs for the distribution of proposed amount of wheat Rs. 47,124 Crore
F Total economic cost for the distribution of food grain (rice/wheat) (F=a+b) Rs. 1,74,381CroreG Amount of Food Subsidy required per annum (F-C) Rs. 1,44,141CroreH Present Budgetary Provision as Food Subsidy Rs. 55,578 Crore
I Food subsidy required for the coming Budgets over and above the existing provision (I=G-H) Rs. 88,563 Crore
Universalisation of PDS and making available the required amount of funds is not an impossible task for the government. In any case, financial constraints can never be an excuse for denying the basic needs of the masses, and even less so when the government is prepared to forego tax revenue (as exemptions/deductions in both direct and indirect taxes) to the extent of Rs. 5,02,299 crore for a single fiscal year (2009-10).
The allocation for Food Subsidy in Union Budget 2010-11 does not indicate the inclination of the government to implement the promised National Food Security Act. The policy pronouncements in this regard seem rhetorical rather than real. Given the situation of severe food insecurity and sky rocketing prices of essential commodities in the country, the government should revert to the earlier scheme of universal PDS through implementing its promised National Food Security Act with necessary modifications.

Centre for Budget and Governance Accountability, 2010
The Union Budget 2010-11, in the context of climate change, is a considerable departure from the previous years, vis-à-vis its substantial commitments to promote renewable energy and energy efficiency. It has announced the constitution of a National Clean Energy Fund to be financed through a cess of Rs. 50 per tonne on domestically produced or imported coal. A simple and quick estimate based on domestically produced coal (489.85 million tonnes in 2008-09) shows that the quantum of this fund will be substantial. While the purpose of this fund has been proposed, the operational parameters of this fund and the controlling authority are yet to be made clear. In addition, the budget has also proposed substantial measures to promote renewable energy and energy efficiency. These measures focus on a single aspect of climate change i.e., reducing the energy intensity of output produced in the economy and promotion of cleaner energy alternatives.The country, owing to its socio-economic characteristics, faces a larger set of challenges from the adverse impact of climate change, i.e, rise in temperature, unpredictable precipitation, spread of vector borne diseases and extreme weather events, which has the potential to perpetuate already existing inequalities in our society. To counter these set of challenges, the government needs to formulate an adaptation policy framework and provision for additional resources for specific vulnerable sectors. However, some bit of adaptation may already be taking place as certain government programmes/ schemes address human conditions and capabilities, which may enable communities to cope with climate related adversities. The following sections provide an assessment of such spending by the government with respect to its latest budget.
Government Spending on Adaptation to Climate Change
In order to assess government spending on adaptation, the expenditure has been classified into nine sectors relevant to adaptation to climate change. These sectors are a) poverty alleviation, livelihood and food security, b) health improvement and prevention of diseases, c) risk financing, d) land development, drought proofing, irrigation and flood control, e) agriculture & allied sectors, f) forest, biodiversity, and wildlife conservation, g) water resources, h) disaster management and i) Coastal, Marine and Ocean Management.
Adaptation expenditure as percent of total budgetary expenditure and GDP reflects an increasing trend over the last five years. Its share to total budgetary expenditure has increased from 12.1 % in 2006-07 RE to 15.7 %
• A “National Clean Energy Fund” (NCEF) has been constituted with the corpus coming from levying clean energy cess on indigenously produced and imported coal at Rs. 50 per tonne.
• Further, a concessional customs duty of 5 % on machinery and instruments required for setting up of photovoltaic and solar thermal power generating units has been proposed to implement National Solar Mission.
• Ground source heat pumps to tap geo-thermal energy have been exempted from basic customs duty and special additional duty.
• For promotion of wind energy, components required for the manufacture of rotor blades for wind energy generators have been exempted from Central Excise duty.
• The budget has also promised fiscal incentives for promotion of energy efficient lighting systems, mode of passenger transport and public transport mechanisms.

Centre for Budget and Governance Accountability, 2010
in 2010-11 BE. The same trend is reflected in its share of GDP (In 2006-07 RE, it was 1.7 % which has grown up to 2.5% in 2010-11BE). The apparent decline in the adapatation expenditure to GDP ratio for 2010-11 (BE) is due to GDP used for 2010-11 being in 2004-05 base prices, while for rest of the year GDP used is in 1999-2000 base prices.
Chart 7.a: Trends in Adaptation Expenditure by the Union Govt.
12.112.8
15.4 15.6 15.7
1.7 1.9 2.6 2.7 2.5
0.0
2.0
4.0
6.0
8.0
10.0
12.0
14.0
16.0
18.0
2006-07 RE 2007-08 RE 2008-09 RE 2009-10 RE 2010-11 BE
Expnd. (%) to Union BudgetExpnd. (%) to GDP
Increasing trends both as percent to total budgetary expenditure and to GDP is driven particularly by increased allocations in the sector of poverty alleviation, livelihood & food security. This trend is observed due to the enhanced budgetary allocation for food subsidy, ICDS, Central assistance to Tribal Sub Plan. However, the budget earmarked for forestry, wildlife and biodiversity, risk financing, disaster management and coastal, marine and ocean management have either remained stagnant or decreased marginally in its share to the Budgetary Expenditure and GDP. This portrays low policy priorities so far attached by the government to the climate sensitive sectors concerning ecological conservations, natural habitats and coastal, marine and ocean management. More importantly, the budgetary allocations are not adequate to finance risks related to climate centric vulnerabilities.
Table 7.a: Adaptation Expenditure as percentage of the Total Budgetary Expenditure and GDP (Market Prices)
2006-07 (RE) 2007-08 (RE) 2008-09 (RE) 2009-10 (BE) 2010-11 (BE)
Sl. No
Expenditure on Various Adaptation Sectors
(%) of Budget Exp.
(%) of GDP
(%) of Budget Exp.
(%) of GDP
(%) of Budget Exp.
(%) of GDP
(%) of Budget Exp.
(%) of GDP
(%) of Budget Exp.
(%) of GDP
1
Poverty Alleviation, Livelihood & Food Security
9.0 1.26 9.1 1.36 11.68 1.98 11.78 2.05 11.38 1.82
2
Health Improvement and the Prevention of Diseases
1.07 0.15 1.18 0.18 1.06 0.18 1.02 0.18 1.09 0.17

Centre for Budget and Governance Accountability, 2010
3 Risk Financing 0.17 0.02 0.27 0.04 0.2 0.03 0.24 0.04 0.16 0.03
4
Land Development, Drought Proofing, Irrigation and Flood Control
0.63 0.09 1.07 0.16 1.12 0.19 1.2 0.2 1.38 0.22
5 Agriculture & Allied Sectors 0.92 0.13 0.99 0.15 1.15 0.19 1.11 0.19 1.43 0.22
6
Forest, Biodiversity, and Wildlife Conservation
0.11 0.02 0.12 0.02 0.10 0.02 0.10 0.02 0.06 0.01
7 Water Resources 0.09 0.01 0.08 0.01 0.10 0.02 0.10 0.02 0.12 0.02
8 Disaster Management 0.07 0.01 0.02 0.003 0.02 0.003 0.07 0.012 0.07 0.011
9
Coastal, Marine and Ocean Management
0.01 0.002 0.01 0.002 0.01 0.002 0.02 0.003 0.03 0.005
Total 12.1 1.7 12.8 1.9 15.4 2.6 15.6 2.7 15.7 2.5 Source of basic data: Compiled from Expenditure Budget Vol. II (various years), GoI.
The present budget has exposed the government’s apathy towards the protection and conservation of wildlife, forests and bio-diversity. Crucial schemes like National Afforestation Programme (NAP), Integrated Forest Protection Scheme (currently known as Intensification of Forest Management), Biosphere Reserves Conservation Programme, Mangroves Eco-systems and Wetlands Conservation Programme, Natural Resources Management Programme, and Biodiversity Conservation Programme have not received adequate allocation. Less priority signifies less government intervention in ecological restoration and eco-developmental activities in the country. Besides, it will fail to secure people’s participation in planning and regeneration efforts to ensure sustainability and equitable distribution of forest products from the regenerated lands and in promoting partnerships in the management and administration of forests and common property resources. Such insignificant allocation will hamper efforts to strengthen species conservation, creating basic infrastructure for management, habitat development, augmenting water resources, compensatory ameliorative measures for habitat restoration, eco-development, village relocation and use of technology for monitoring and evaluation.
The Budget has provided a substantial allocation for the Integrated Watershed Management Programme (IWMP). The IWMP has registered 35 percent growth over last year revised estimates. The Rainfed Area Development Programme has also received a substantial increase over last year’s allocation. This year the newly announced programme, ‘Climate Sensitive Agriculture Initiative’ would strengthen the process of holistic land development, drought proofing, and measures against Desertification, Wasteland, Dry-land and Rain-fed development programme. However, the allocation for Watershed Development Programmes in Shifting Cultivation has not seen any improvement. Despite being a significant scheme for arresting land erosions in the hilly areas, the allocation for this has remained stagnant.

Centre for Budget and Governance Accountability, 2010
The allocation for AIBP for creating potential for small and medium irrigation has shown 18% growth over last year’s allocation. However it is ironical that, despite the protracted implementation of such crucial programme for irrigation, huge agricultural lands remain beyond the reach of sustained irrigation, leaving crucial farming and agricultural segments to face the volatile Monsoon.
In the Agriculture and Allied Sectors, this year the budget has attached due importance to the balanced utilisation of fertilisers under National Project on Management of Soil and Health Facility as against increasing use of chemical fertilisers. The government has recently announced a nutrient based subsidy policy for the balance use of fertilisers. In the context of low per-capita consumption expenditure of the rural poor, programmes like National Food Security Mission (NFSM) and Rashtriya Krishi Vikas Yojana (RKVY) have received higher rates of allocation for sustainable agriculture and ensuring higher agricultural productivity. The allied agriculture sector like cattle development, marine and inland fisheries have been given high priority in the adaptation expenditure.
For the development of water resources, while Ground Water Management and Regulation has registered a significant allocation in the budget, a scheme like the Artificial Recharge of Ground Water through Dug Wells has not received any allocation. This shows the government’s insensitivity to the crucial issue of ground water resources. Though the allocation for the National River Conservation Plan has been increased, the establishment of Common Effluent Treatment Plants (CTEPs) has not got priority in the Union Budget.
India has 7500 kilometres of coast line that spreads across nine big states and also includes large tracts of fertile cultivable land. As per the National Action Plan on Climate Change (NAPCC), the sea level in India is rising at the rate of 1.06 - 1.75mm per year. If this continues, it may threaten many coastal states, endanger existing mangroves, submerge many low lying areas and islands, cause saltwater intrusion and frequent sea borne natural disasters in the near future. The National Coastal Management Programme (NCMP) implemented by the Ministry of Environment and Forests (MoEF) since 1991, carry out protection and conservation of coastal environment, protection of local communities and livelihood security along the coastal stretches, promote sustainable development along coastal stretches and finally aims to control deterioration of coastal environment due to pollution arising from the land based activities. Such crucial area of adaptation has hardly been prioritised in the budget.
While this year’s Union Budget marks a departure from the previous budgets as far as the problem of climate change is concerned, the fact remains that it continues to be informed by the ‘business-as-usual’ development trajectory and pursue economic growth devoid of climate change inputs and concerns. The significance of inclusive growth and sustainable development has become even more glaring. In the wake of growing climate change induced vulnerabilities, this year’s Union Budget has failed to take any solid steps to address adaptation needs in India.

Centre for Budget and Governance Accountability, 2010
Scope of Gender Budgeting Statement
The Gender Budgeting Statement (GBS) performs the arduous yet important task of trying to assess what percentage of the total expenditure of the budget flows to women. This process of dis-aggregation, although messy at times, is essential. A case for whether women need or don’t need more public spending can be made only if one knows, in the first instance, what is being allocated and spent on women.
Table 8.a.: Summary of the Allocations for Women as Presented in the GBS (in Rs. Crore)
No. of Demands*
Total Allocations under Part A of the Statement**
Total Allocations under Part B of the Statement***
Total magnitude of Gender Budget
2007-08 33 Rs. 8,428.66 (RE) Rs. 13,919.43 (RE) Rs. 22,348.09 (RE)(3.3%)
2008-09 33 Rs. 14,875.15 (RE) Rs. 34,748.20 (RE) Rs. 49,623.35(RE)(5.5%)
2009-10 33 Rs. 15,480.85 (RE) Rs. 40,813.27 (RE) Rs. 56,294.22 (RE)(5.5%)
2010-11 33 Rs. 19,266.05 (BE) Rs. 48,483.75(BE) Rs. 67,749.80(BE)(6.1%)
Notes: *Those that report in the Gender Budgeting Statement.** Part A presents women specific provisions where 100% provisions are for women. ***Part B presents women specific provisions under schemes with at least 30% provisions for women. **** Proportion of total Union Government Expenditure, shown in brackets. Source: Gender Budgeting Statement, Expenditure Budget Vol. I, Union Budget - various years
After stagnating at 5.5% of the Total Expenditure over the last two years, Union Budget 2010-11 has increased the proportion of the GBS to 6.1%. While this does imply an increase in allocations for women to the tune of
Union Budget 2010-11 proposes a 50 percent increase in the plan budget of the Ministry of Women •and Child Development, which is welcome. However, the total allocation for Women (as reported in the Gender Budgeting Statement) accounts •for just 6.1 % of the total Union Budget. At a per capita level, the total allocation for women (as reported in the Gender Budgeting Statement) comes to a paltry Rs. 1200 per annum. Mahila Kisan Sashaktikaran Pariyojana (MKSP)• and Indira Gandhi Matritva Sahayog Yojana (IGMSY) have been introduced in the Union Budget 2010-11. Allocations for several important schemes under MWCD, when added for the last four years, do not •reach even 50 percent of the outlays recommended by the Planning Commission for the Eleventh Five Year Plan period.

Centre for Budget and Governance Accountability, 2010
Rs.11,000 crore, it is unfortunate that the number of demand for grants remains constant. However, this is an improvement in real terms since neither has this been brought about due to increasing number of ministries/department reporting in the GBS nor due to significant methodological changes.
Perhaps it is for the first time thus, that the exercise of GB in Union Budgets has the potential to be more than a mere exercise on paper since it records substantial improvement in priorities for women in budgets. 1 The catch, of course lies in ensuring that these improved outlays translate into improved outcomes for women. However, before complacency sets in, it will be good to remind ourselves that even this increased amount translates to a per capita allocation of approximately Rs. 1200 per woman per annum, which is low by any standards
Analysing the GBS: What are the Priorities?
Chart 8.a and Chart 8.b below analyze the priorities of resources flowing to women as consolidated in the GBS2.
Chart 8.a: GBS 2010-11: From the Sectoral Lens Chart 8.b: GBS 2010-11: From the Exclusion Lens
Chart 8.a shows that while women’s health and education get priority, other important schemes which support women’s economic and political participation do not get adequate public provisioning. Low priority is also accorded to support services for women in distress situation. Chart 8.b shows that schemes that address vulnerabilities specific to most marginalized women account for just 4% of the total resources for women.
Methodological Issues: Problems of Overestimation and Underestimation
The allocations reflected in the GBS should however, be taken with a pinch of salt. There are problems of overestimation that continue to persist For instance, many schemes of the Ministry of Youth Affairs and Sports – although stated in part B of the statement (which lists schemes where atleast 30% funds are earmarked for women) show 100 percent of their allocations for women. Indira Awas Yojana has been repeatedly put under Part A (which lists schemes where 100% provisions are meant for women) despite the fact that all houses built under the scheme are not registered in the name of the female member of the household.
1 Comparing pre 2007-08 figures, does not offer much insight as significant methodological shifts were happening in the initial years2 For understanding priorities of allocations in terms of different sectors, the schemes in the gender budgeting statement (parts A and B) have been categorised into the following heads: (a) Women’s participation in the economy which includes schemes targeted towards income-generating activities, formation of small-scale enterprises and those aimed at providing enabling work conditions to women; (b) Education includes schemes directly promoting education (formal and non formal) and scholarships assisting in attainment of education, as well as initiatives for training and capacity building (c) Health includes health related schemes, and programmes/ schemes for nutrition and food security (d) Housing includes schemes meeting shelter needs of women; (e) Support Services to women in distress; (f) institutional mechanism; and (g) Others includes schemes targeted at generating awareness amongst women in areas such as empowerment , etc. This does not include allocations for Union Territories.

Centre for Budget and Governance Accountability, 2010
On the other hand, there are problems of underestimation as well, since several important Ministries/Departments continue to remain outside the ambit of the GBS. To mention a few - Ministry of Finance, Department of Commerce, Department of Water Supply and Ministry of Heavy Industries & Public Enterprises have not been reporting in the GBS. Crucial schemes such as social security for unorganised workers and Annapurna scheme which have a tremendous bearing on women’s lives, fail to find mention in the GBS.
Schemes for Women in the Union Budget 2010-11
The Finance Minister has introduced two important schemes for women in the Union Budget 2010-11, namely, Mahila Kisan Sashaktikaran Pariyojana (MKSP) and Indira Gandhi Matritva Sahayog Yojana (IGMSY). Given that 74.9% of the female workforce is engaged in agriculture, a scheme like MKSP could have significant impact. However, to gauge its potential, one would need to assess the details of the scheme, which are yet to be put in the public domain. Similarly, another important scheme promised in the Eleventh Five Year Plan period, IGMSY, finally sees the light of day with an allocation of Rs. 390 crore this year. However, as shown in the Box below, the allocation made for IGMSY is far below the amount that would be required to cover all pregnant and lactating women registered under ICDS.
The third noteworthy initiative is the National Mission for Empowerment of Women, which though introduced last year with a token allocation of Rs. 1 crore, has been given the much needed financial boost with an allocation of Rs. 40 crore. This initiative might serve the important objective of convergence of various programmes/schemes meant for women across different ministries/departments.
While the significant increase in important schemes like Swadhar, STEP, Relief and Rehabilitation of Rape Victims, Rajiv Gandhi Scheme for Empowerment of Adolescent Girls and IGMSY among many others is laudable, many other schemes have registered a downward drift. Allocations for schemes/programmes like the Awareness Generation Programme (AGP) “aimed at inculcating a spirit of organized activity among rural women for identifying their needs and for chalking out plans of action” has been cut down. Furthermore, an important institution like the National Commission for Women has not received the requisite attention in terms of financial allocations, essential for carrying out its wide ranging functions and responsibilities
Box 8.a: Proposed Allocation for IGMSY in Union Budget 2010-11
Total number of pregnant & lactating women registered under ICDS (as of June 2008 according to the Annual Report 2008-09 of Ministry of Women and Child Development, GoI): 143.32 LakhAssuming total number of beneficiaries of IGMSY in 2010-11 to be: 143.32 Lakh
Scenario I: Amount of assistance to be paid to each beneficiary under IGMSY (same as entitlement provided to women under Dr. Muthulakshmi Reddy Maternity Benefit Scheme of Tamil Nadu): Rs. 6000Required allocation for IGMSY in Union Budget 2010-11 (Rs. 6000*143.32 Lakh): Rs. 8600 crore
Scenario II:Amount of assistance to be paid to each beneficiary under IGMSY (entitlement reported to have been proposed by the Government): Rs. 4000Required allocation for IGMSY in Union Budget 2010-11 (Rs. 4000*143.32 Lakh): Rs. 5733 Crore
Source: People’s Charter of Demands for Union Budget 2010, People’s Budget Initiative

Centre for Budget and Governance Accountability, 2010
Table 8.b: Proposed Outlay for the Eleventh Five Year Plan vis-à-vis Allocations Made Untill Now
Name of the Plan Scheme / Programme
Proposed Outlay for
Eleventh Plan Rs. in crore (at Current Prices)
Allocations (Rs. in crore) Total Budget Outlay Made
in the first four years
% ofAllocationTill Now
2007-08 (RE)
2008-09 (RE)
2009-10 (RE)
2010-11 (RE)
Swayamsidha 500 25 50 .05 5 80.05 16
IGMSY 9000 0 0 1 390 391 9.7Rashtriya Mahila Kosh 108 12 31 16 15 74 68
Gender Budgeting 20 1 1.3 .05 2 4.35 21.7
Conditional Cash Transfer for girl child with insurance cover
80 10 5 10 25 31.2
Source: Expenditure Budget Vol-II, Various Years, Government of India; Detailed Demand for Grants, Ministry of Rural Development and Ministry of Agriculture, Appendix Eleventh Five Year Plan (2007-2012)
An assessment of the Proposed Outlay for various schemes for women in the Eleventh Five Year Plan vis-à-vis allocations shows that there are several schemes for which allocations made up till now (2010-11) are far from what was proposed. As shown in Table 8.b, allocations for schemes such as Swayamsidha, IGMSY and Conditional Cash Transfer for Girl Child have not received even 50% of the proposed allocations, till date.
Implementation Issues
Table 8.c: Allocations for Swadhar and Short Stay Homes vis-à-vis Actuals
2004-05 2005-06 2006-07 2007-08BE RE Actuals BE RE Actuals BE RE Actuals BE RE Actuals
Swadhar 2.7 3.69 4.21 5.5 5.5 7.36 7 7 7.85 13.5 13.5 12.99Short Stay Homes 15 14.4 15.26 15 15 16.5 15.9 15.72 16.95 15.9 15.9 16.6
Source: Demands for Grants and Expenditure Budget Volume II of the Ministry of Women and Child Development for various years
Table 8 c above unravels a rather pertinent point. It assesses Budget Estimates, Revised Estimates and the Actual Expenditure for some important schemes under the Ministry of Women and Child Development (MWCD). Whereas, most schemes under other ministries suffer on account of under utilization of resources, i.e., in these cases, Actual Expenditure is much less compared to Budget Estimates (sometimes as low as 30-40%), schemes like Swadhar and Short Stay Homes under MWCD have consistently recorded Actual Expenditures higher than Budget Estimates and Revised Estimates. This reflects that the potential for utilisation is very high in these schemes. These schemes are possibly providing services that are much in demand and where demand clearly surpasses supply. Output figures for these schemes further substantiate this argument. As per the MWCD Annual Report 2008-09, 287 Swadhar Shelter Homes and 132 short stay homes were operational across the country. Given that there are 626 districts in India, it is shocking that there is not even one Swadhar home or Short Stay Home per district, when the average population per district is more than 15 lakhs!
For creating an enabling environment for women, we not only require schemes addressing women’s immediate concerns and needs but we also need to challenge insidious and unequal power relations and structural inequities in our society.

Centre for Budget and Governance Accountability, 2010
The persistence of significant deficits in development of children has been one of the major challenges for India. Over the years, India has succeeded in bringing down the Infant Mortality Rate (IMR) to some extent; yet its IMR is much higher compared to the levels not only in developed countries but also in many developing countries. Moreover, there exist huge disparities across regions and across the states within the country. Like IMR, several outcome indicators for children can be cited to emphasize the need for prioritizing the rights of children within the development process of the country. In this context, it is pertinent to ask: what does Union Budget 2010-11 have for children? To find out the magnitude of ‘Child Budget’ within the Union Budget, we refer to Statement 22 (BUDGET PROVISIONS FOR SCHEMES FOR THE WELFARE OF CHILDREN) in Expenditure Budget Vol. I of the Union Budget, which was introduced by the Union Government in the 2008-09 Budget. This Statement “reflects provisions for expenditure on schemes that are meant substantially for the welfare of children”, and the Union Government’s rationale for this initiative has been that “recognising that children under 18 years of age constitute a significant percentage of the Indian population, the Government is committed to their welfare and development”.
Magnitude of ‘Child Budget’ in Union Budget 2010-11
The magnitude of ‘Child Budget’ within the Union Budget, i.e. the aggregate outlay for child specific schemes as a proportion of total budget outlay by the Union Government, has increased to 4.1 percent in 2010-11 (BE) from 3.7 percent in 2009-10 (RE). If we take into account the fact that children (i.e. all persons up to the age of 18 years) constitute more than 40 percent of the country’s population and that many of the outcome indicators show persisting deficits in the development of children; the magnitude of ‘Child Budget’ at 4.1 percent of the total Union Budget in 2010-10 (BE) appears grossly inadequate.
Union Government’s total allocation earmarked for children shows a small increase from 3.7 percent •of the Union Budget in 2009-10 (RE) to 4.1 percent of the Union Budget in 2010-11 (BE).Moreover, the sector-wise prioritisation of the • Child Budget seems to have got further skewed against Child Health and Child Protection. Within the total resources earmarked for children in Union Budget 2010-11 (BE), 75 percent is meant for Child Education, 20 percent for Child Development, only 4 percent for Child Health and a meager 1 percent for Child Protection.

Centre for Budget and Governance Accountability, 2010
Figure 9.1: Outlays for Child Specific Schemes as a Proportion of Union Budget (in %)
Total Outlays for Child Specific Schemes as Proportion of Total Union Budget
4.0 3.9 3.74.1
0.0
1.0
2.0
3.0
4.0
5.0
6.0
2007-08 RE 2008-09 RE 2009-10 RE 2010-11 BE
Year
Perc
enta
ge
Child Buudget as % ofTotal Union Budget
Source: Compiled from Expenditure Budget Vol. I, Union Budget, GoI, various years.
Sector-wise Prioritisation of the ‘Child Budget’
Keeping in mind the different needs of children in our country, all programmes / schemes included in the ‘Child Budget’ can be categorized into four sectors, viz.
Child Development (referring mainly to interventions for early childhood care and nutrition);•Child Health (referring mainly to interventions for child survival and health);•Child Education; and •Child Protection (i.e. protection of children in difficult circumstances). •
Figure 9.2: Sector-wise Composition of the Total Outlay for Children in Union Budget 2010-11 (BE)

Centre for Budget and Governance Accountability, 2010
It is disappointing to note that the sector-wise prioritisation of the Child Budget continues to be skewed against Child Health and Child Protection. Within the total resources earmarked for children in Union Budget 2010-11 (BE):
75 percent is meant for Child Education, •20 percent for Child Development, •Only 4 percent for Child Health and •A meager 1 percent is meant for Child Protection. •
Some Important Schemes for Children
National Child Labour Project (NCLP)
The Union government spends the least on Child Protection as compared to its expenditure on Child Education, Child Development and Child Health. NCLP – a Centrally Sponsored Scheme launched in 1994, in pursuance of the National Child Labour Policy 1987 and the Child Labour (Prohibition & Regulation) Act 1986, has been an intervention in this regard. Before proceeding to examine the financial aspects, it would be useful to take note of the programmatic interventions planned under the scheme. NCLP targets all children below 14 years of age working in hazardous occupations as listed in the Child Labour Act (57 processes listed).
Chart: Fund Utilisation in NCLP
127.46 120.21
171.06156.28 156.06 146.63
90 100135
020406080
100120140160180
BE
Actu
als BE
Actu
als BE
Actu
als BE RE BE
2006-07 2007-08 2008-09 2009-10 2010-11
in R
s. C
rore
As the chart above shows, the extent of fund utilisation in NCLP has been reasonably good over the last few years. However, despite the relatively satisfactory levels of fund utilisation, the overall budget for NCLP had been reduced from Rs. 156 crore in 2008-09 to Rs. 90 crore in 2009-10 (BE). This too was carried out at a time when the need is for increasing the unit costs for honorarium of the Project Director, Field Officer, Clerk, Doctor, Master Trainer, etc. (in the scheme) for improving its effectiveness. The budget for NCLP seems to have been revived to Rs. 135 crore in 2010-11 (BE). However, a lot more resources need to be provided for this scheme for addressing its systemic weaknesses and limited effectiveness.
There is an urgent need to revise the existing low and unrealistic unit costs as prevalent under schemes such as NCLP. Germane to this is the question on whether the Ministry of Labour and Employment would do a comprehensive review of the scheme once the Right to Education Act is notified in April 2010.

Centre for Budget and Governance Accountability, 2010
Integrated Child Development Services (ICDS)
• Staff vacancy has been a critical factor for poor quality of spending under ICDS. The quality of service delivery continues to be poor as the monitoring and supervision of Anganwadi centres (AWCs) is very weak. Moreover, several AWCs across the country are non-functional (e.g. in States like Bihar, UP and Haryana).
• At all India level, around 26% of Anganwadi Worker posts are still vacant; vacancies for other posts such as Child Development Project Officers/Asst. CDPOs (40 %), Supervisors (45 %), Clerk-cum-Accountants and Drivers too are quite high.
• According to a study titled ‘Rapid Facility Survey of Infrastructure at Anganwadi Centres’ conducted by the National Council for Applied Economic Research (NCAER), in 2004-05, only 46 % of the (then operational) AWCs were running from pucca buildings.
• Allocation for ICDS has been increased from Rs. 6705 crore in 2009-10 (BE) to Rs. 8700 crore in 2010-11 (BE); but even this increased budget allocation is grossly inadequate for universalisation of ICDS with quality.

Centre for Budget and Governance Accountability, 2010
Budgetary Allocation for Dalit and Adivasis in the Union Budget 2010-11
The Scheduled Castes and Scheduled Tribes are the most excluded and under privileged among the various socially disadvantaged groups in our country. In the post-independence era, successive governments have formulated laws, special programmes and policies for addressing the developmental needs of these excluded sections of population. These, however, have not contributed to the development the SC/ST population in any significant way. The Scheduled Caste Sub Plan (SCSP) and Tribal Sub Plan (TSP) are two major planning strategies through which developmental needs of these groups are sought to be addressed. The allocation towards SCSP and TSP is required to be in proportion to the respective share of SCs and STs in the population (i.e., 16 % and 8 % respectively at the national level).
Table: 10.a: Plan Allocations Earmarked for SCs from different Union Ministries /Depts. (in Rs. Crore)
Min./Dept. 2004-05 RE
2005-06 RE
2006-07 RE 2007-08 RE 2008-09 RE 2009-10 RE 2010-11 BE
Dept. of Science & Technology 0 2.5 2.5 3 3 3 3
Ministry of Finance 0 0 3.02 0 0 0 9
Ministry of Tribal Affairs 0 0 0 0 0 0 0
*Ministry of Social Justice & Empowerment 986.13 1027.78 1260.14 1661.29 1779.25 1923.38 3350.6
*Dept. of Rural Development 2564.8 2771.67 2293 3134.33 4303.33 4303.33 4994.67
*Ministry of Labour & Employment 0.27 0.48 0.53 0.61 0.67 2.55 3.95
*Dept. of Women & Child Development 0 468.97 641.24 1494.4 1134 1469.16 1516
Only a handful of the Union Government Ministries/ Departments have reported their Plan allocations •earmarked for Scheduled Castes Sub Plan (SCSP) and Tribal Sub Plan (TSP) in Union Budget 2010-11. In this budget, only one new Department, the Department of Food & Public Distribution, has shown Plan allocations earmarked for Scheduled Caste and Scheduled Tribes. The guidelines of SCSP (for earmarking 16% of Plan Allocations for SCs) and TSP (for earmarking •8% of Plan Allocations for STs) have not been fulfilled in this budget too. The Union Budget outlays for SCSP and TSP as proportion of the Total Plan allocation of the Union •Government (excluding the Central Assistances to the State & UT Plans) have registered small increases in 2010-11(BE) – Plan allocation earmarked for SCs has increased from 6.25 % to 7.19 % in 2010-11 (BE), while Plan allocation earmarked for STs shows an increase from 3.67 % in 2009-10 (RE) to 4.43 %in 2010-11 (BE). Also, of the funds shown as earmarked for SCs and STs, a large chunk is meant for basic social •services and employment generation programmes, with little emphasis on providing funds for long term development and empowerment of the SCs and STs.

Centre for Budget and Governance Accountability, 2010
Department of Food & Public Distribution 1.62 1.59 1.59
*Dept. of Secondary Education & Higher Education (Ministry of HRD)
0 266.33 259.28 453.52 4026.31 1281.85 1444
*Dept. of Elementary Education & Literacy (Ministry of HRD) 60 2027.57 2739.86 3509.65 987.16 3951.77 5779.16
*Ministry of Youth Affairs and Sports 0 13.29 13.04 17.9 20.73 148.27 165.67
*Ministry of Agriculture 0 0 0 136.37 228.16 261 282.26
*Dept. of Information Technology 0 0 7.06 20 19.33 22.67 35.47
*Dept. of Health & Family Welfare 0 0 1244.35 1676.19 1885.22 901.75 2408.23
*Dept. of Small Scale Industries(MMSME) 0 0 0 136.8 210.77 188.83 303.23
*Ministry of Textiles 0 0 0 80.93 84.05 89.17 118.8
Dept. of Biotechnology 0 0 0 2.5 2 2 3.5
Ministry of Culture 0 0 0 2.93 3.93 4.93 5.2
Ministry of Pnachyat Raj 0 0 0 26.61 27.2 29.33 33.33
*Union Territories of Andaman & Nicobar Island, Daman & Diu, Dadra & Nagar Haveli and Lakshadweep
0 0 9.92 11.51 11.91 38.94 8.47
Total Plan Exp. for SCs from Union Budget 3611.2 6578.59 8473.94 12367.77 14727.02 14623.52 20466.13
Note: * The Union Budget documents do not segregate the total allocations earmarked for SCs/STs further to show allocations separately for SCs and STs in these Ministries/ Departments. We assume here that following the proportion of SCs and STs in total population of the country (i.e. 16.2 % for SCs and 8.2 % for STs as in Census 2001), out of the total funds earmarked for SCs and STs together, roughly two-third would be spent for SCs.
Source: Compiled from Expenditure Budget Vol. I and Vol. II, Union Budget (various years)
Table 10.b: Plan Allocation Earmarked for SCs from the Union Budget
2004-05 RE
2005-06 RE
2006-07 RE
2007-08 RE
2008-09 RE
2009-10 RE
2010-11BE
A. Total Plan Allocation earmarked for SCs (in Rs. crore)
3611.2 6578.6 8473.9 12367.8 14727 14623.52 20466.13
B. Total Plan Allocation of Union Govt. (excluding Central Assistance to State & UT Plans) (in Rs. crore)
85061 109900 129804 152313 208252 233919 284284
A as % of B 4.25 5.99 6.53 8.12 7.07 6.25 7.19Source: Calculated from the Expenditure Budget Vol. I and Vol. II, Union Budget (various years)

Centre for Budget and Governance Accountability, 2010
From Table 10.b, it is clear that allocation for SCSP had increased gradually over the years up to 2007-08 (RE), after which it shows a decline in the next two budgets. It had crossed the half way mark to the SCSP norm of 16 percent only once in 2007-08 (RE). In 2010-11 (BE), it stands at 7.19 percent of the Total Plan Exp. of Union Govt. (excluding Central Assistance to State & UT Plans).
Table 10.c: Plan Allocations Earmarked for STs from Different Ministries/Departments (in Rs. Crore)
Ministries / Departments
2004-05 RE
2005-06 RE
2006-07 RE
2007-08 RE
2008-09 RE
2009-10 RE
2010-11 BE
Dept. of Science & Technology 0 2.5 2.5 3 3 3 3
Ministry of Finance 0 0 1.51 0 0 0 0Ministry of Tribal Affairs 1069.45 1398.82 1652.68 1719.71 1970 2000 3206.5*Ministry of Social Justice & Empowerment 0 0 25.03 34.9 36.25 58.38 110.8
*Dept. of Rural Development 1282.4 1385.83 1146.5 1567.17 2151.67 2151.67 2497.33
*Ministry of Labour & Employment 0.13 0.24 0.26 0.31 0.34 1.27 1.98
*Dept. of Women & Child Development 0 234.49 320.62 747.2 567 734.58 783
Department of Food & Public Distribution 0.81 0.8 0.8
*Dept. of Secondary Education & Higher Education (Ministry of HRD)
0 133.16 129.64 226.76 493.58 640.93 722
*Dept. of Elementary Education & Literacy (Ministry of HRD)
30 1013.79 1369.93 1754.83 2028.16 1975.89 2889.58
*Ministry of Youth Affairs and Sports 0 6.64 6.52 8.95 10.37 74.13 82.83
*Ministry of Agriculture 0 0 0 68.19 114.08 13.37 141.13
*Dept. of Information Technology 0 0 3.53 10 9.67 11.33 17.73
*Dept. of Health & Family Welfare 0 0 622.17 838.09 942.6 450.88 1204.11
*Dept. of Small Scale Industries(MMSME) 0 0 0 68.4 105.38 94.42 151.61
*Ministry of Textiles 0 0 0 40.47 42.03 44.58 59.4Dept. of Biotechnology 0 0 0 1.25 1 1 1.75Ministry of Culture 0 0 0 1.47 1.97 2.47 2.6
Ministry of Pnachyat Raj 0 0 0 13.31 13.95 14.67 16.67

Centre for Budget and Governance Accountability, 2010
*Union Territories of Andaman & Nicobar Island, Daman & Diu, Dadra & Nagar Haveli and Lakshadweep
0 0 284 342.96 279.98 327.26 333.4
Total Plan Exp. for STs from Union Budget 2381.98 4175.47 5564.89 7446.97 8771.03 8600.63 12226.22
Note: * The Union Budget documents do not segregate the total allocations earmarked for SCs/STs further to show allocations separately for SCs and STs in these Ministries/ Departments. We assume here that following the proportion of SCs and STs in total population of the country (i.e. 16.2 % for SCs and 8.2 % for STs as in Census 2001), out of the total funds earmarked for SCs and STs together, roughly one-third would be spent for STs.
Source: Compiled from Expenditure Budget Vol. I and Vol. II, Union Budget (various years)
Plan allocations earmarked for the Scheduled Tribes (STs) in the Union Budget present a similar picture. The proportion of total Plan Outlay of the Union Government earmarked for STs had increased during 2004-05 (RE) to 2007-08 (RE), but it declined during 2008-09 (RE) and 2009-10 (RE); it stands at 4.30 percent in 2010-11 (BE). This, as is evident, is grossly inadequate considering the proportion of ST population in total population of the country (which is roughly 8 per cent). It also violates the basic premise of Tribal Sub Plan (TSP) which requires the government to make budgetary allocations proportionate to the tribal population in the country.
Table 10.d: Plan Allocation Earmarked for STs from the Union Budget
2004-05 RE
2005-06 RE
2006-07 RE
2007-08 RE
2008-09 RE
2009-10 RE
2010-11 BE
A. Total Plan Allocation earmarked for STs (in Rs. crore)
2382 4175.5 5564.9 7447 8771 8600.63 12226.22
B. Total Plan Allocation of Union Govt. (excluding Central Assistance to State & UT Plans) (in Rs. crore)
85061 109900 129804 152313 208252 233919 284284
A as % of B 2.8 3.8 4.29 4.89 4.21 3.67 4.30Source: Calculated from the Expenditure Budget Vol. I and Vol. II, Union Budget (various years)
Also, of the funds shown as earmarked for SCP and TSP, a large chunk is meant for basic social services and employment generation programmes, with no emphasis on providing funds for long term development and empowerment of the SCs and STs. Only the following Ministries of the Union Govt. have reported substantial magnitude of funds earmarked for SCs / STs in Union Budget.
Ministry of Tribal Affairs•Ministry of Social Justice & Empowerment•Dept. of Rural Development (Ministry of Rural Development)•Ministry of Women & Child Development•Dept. of Elementary Education & Literacy (Ministry of HRD)•Dept. of Secondary Education & Higher Education (Ministry of HRD)•Dept. of Health & Family Welfare.•

Centre for Budget and Governance Accountability, 2010
Budgetary Allocation for Minorities in the Union Budget 2010-11
To improve the educational and economic conditions of minorities and particularly Muslims, Prime Minister’s 15-Point Programme was initiated in 2006 and it sought to allocate at least 15 percent of funds in Union Departments/Ministries wherever it is possible. Moreover, a new separate ministry called Ministry of Minority Affairs was created in 2006 to ensure a focused approach in initiating, planning and coordinating development programme for the upliftment of minorities.
Apart from Ministry of Minority of Affairs, there are three other Ministries and Departments under the Union Government that implement schemes for development of minorities. These are Ministry of Women and Child Development (MWCD), Ministry of External Affairs and Department of Higher and School Education. The schemes include Area Intensive and Madrasa Modernization Scheme, National Council for Promotion of Urdu Language, National Monitoring Committee for Minorities Education (Department of Higher Education), and Scheme for Leadership Development of Minority Women (MWCD) and subsidy provided to Haj pilgrims (Ministry of External Affairs). From this year, the Scheme for Leadership Development of Minority Women has been shifted from MWCD to Ministry of Minority Affairs. From the table 11.a it can be seen that there has been a significant increase in allocations for these schemes over the years.
Table 11.b shows allocations for some of the important schemes under MMA. There has been an increase of 49 percent in this year’s budget compared to the Union Budget in 2009-10; however, the increase last year was more drastic (73 percent).
• There has been an increase of 49 percent in the total budgetary allocation for the Ministry of Minority Affairs (MMA) in Union Budget 2010-11 over the previous year’s allocation; it has increased from Rs. 1756.5 crore in 2009-10 (BE) to Rs. 2615.37 crore in 2010-11 (BE).
• However, the Ministry was not able to utilise a substantial portion of the allocated resources from 2006-07 to 2008-09.
• The allocation under the Multi Sectoral Development Programme has increased from Rs. 889 crore in 2009-10 (BE) to Rs 1245.2 crore in 2010-11 (BE).
• In addition, there has been a substantial increase in the allocation for several scholarship schemes and the Scheme for Leadership Development of Minority Women.
• In 2010-11, the MMA has introduced four new schemes, though with meagre allocations. These include Strengthening State Wakf Boards, Grant-in–aid to Central Wakf Board, Educational Loan for Overseas Study and Containing Population Decline of Small Minority Communities.
• Although, several development schemes have been launched for development of minorities since 2006-07, the financial and physical achievement of several schemes such as the Scholarship Schemes has been very poor.
• The poor performance of these schemes has been mainly due to lack of effective institutional mechanisms, inadequate staff and lack of awareness about schemes.
• Panchayati Raj Institutions have not been given any significant role in programme implementation.

Centre for Budget and Governance Accountability, 2010
Table 11.a: Union Budget Outlays under Different Ministries for Minorities (in Rs. crore)
Ministries / Department 2004-05 (RE)
2005-06(RE)
2006-07 (RE)
2007-08 (RE)
2008-09 (RE)
2009-10(RE)
2010-11 (BE)
Ministry of Minority Affairs - - 143.52 362.83 664.38 1755.5 2615.4
Department of Higher & School Education 31.5 36 60.6 61.15 79.18 66.6 72.67
Ministry External Affairs 6 9.81 9.8
Ministry of Women and Child Development - - - - 4.5 - -
Total 31.5 36 204.12 423.98 790.06 1831.9 2697.84
Source: Compiled from Expenditure Budget Vol. II, Union Budget, various yearsMost of the schemes run by the Ministry provide resources for education and infrastructure related aspects. However, programmes relating to economic empowerment also need to be strengthened for the upliftment of these communities. A special scheme called Multi-Sectoral Development Programme has been initiated for overall development of the community and is operational in 90 minority dominated districts in India. Considering the coverage and level of backwardness of minority concentrated districts, this scheme needs more budgetary allocation and widening of its scope beyond the 90 minority-dominated districts.
Table 11.b: Union Budget Outlays for the Ministry of Minority Affairs (in Rs. Crore)
S.No Schemes 2006-07 (RE)
2007-08 (RE)
2008-09 (RE)
2009-10 (RE)
2010-11 (BE)
1 Secretariat 3.87 4.46 6.08 7.52 7.10
2 Grants-in –Aid to Maulana Azad Educational Foundation(MAEF) 100 50 60 115 125
3 Free coaching and allied Scheme 1.6 9 7.75 10.80 13.504 Research /Studies , Monitoring &Evaluation 1 10.99 8.45 12.70 21.505 Merit-cum –Means Scholarship 10 48.6 58.44 90 121.56 Pre-Matric Scholarship for Minorities 9 71.90 180 4057 Post-Matric Scholarship for Minorities 54 62.93 135 238.58 Multi-Sectoral Development Programme 66.97 251.89 889.50 1245.20
9 Maulana Azad Fellowship for Students - - - 13.50 27
10 Grants-in Aids to State for National Minorities Development & Finance Corporation (NMDFC) 9 1.80 1.80 3.60
11 Special Officer for Linguistic Minorities 1.04 1.23 1.74 1.91 2
12 National Commission for Religious and Linguistic Minorities 1.99 0.16 -
13 National Commission for Minorities (NCM) 3.67 3.63 4.55 5.05 5.26
14 Scheme for Leadership Development of Minority Women - - - 7.20 13.50
15 Grants-in-aid to Wakf 2.06 2.9 2.35 1.5 1.5
16 Computerisation of records of State Wakf Boards - - - 9 11.7
17 Investment in Public Enterprises 16.47 63 67.50 112.50 103.50
18 Grant- in –ad to central waqf board .01 .01

Centre for Budget and Governance Accountability, 2010
19 Strengthening State Waqf board .01 6.3020 Educational loan for overseas .90
21 Promotional activities for linguist minority 1
22 Containing decline of population of small minority
23 Grants in Aid to North East 1.82 29.44 59 162.50 260
Grand Total 143.52 362.83 664.38 1755.50 2615.37
Source: Compiled from Expenditure Budget Vol. II, Union Budget, various years
Issues in Implementation of Budgets for Minorities
During the last five years, the agenda for development of minorities has been in the limelight, while the actual performance on the ground level was extremely poor. Under the Prime Minister’s 15-Point Programme, various ministries like Human Resource Development, Labour and Employment, Housing and Urban Poverty Alleviation, Rural Development and Women and Child Development make separate allocations for minorities in their ongoing schemes. But the implementation and outcome of various schemes have been found to be very weak. From the table 11.c, we can see the overall financial performance of MMA from 2006-07 to 2008-09, is extremely poor in terms actual utilisation of funds in comparison to Budget Estimate. Table 11.c: Actual Financial Performance by the Ministry of Minority Affairs ( 2006-07 to 2008-09)
BE RE Actual Actual Exp. as % of BE (or RE)
2006-07* 0 130.89 119.49 91.292007-08 500 350 196.65 39.332008-09 1000 650 618.62 61.86
Note: * No amount was allocated at BE level Source: Detailed Demand for Grants of Ministry of Minority Affairs & Standing Committee and Social Justice (2009-10).
Ministry of Minority Affairs: Financial Performance of Major Schemes
Table 11.d reveals that certain programmes like Maulana Azad Educational Foundation (MAEF) and National Minorities Development and Finance Corporation (NMDFC) have achieved 100 percent target, while Free Coaching and Allied Scheme, Scholarship Schemes and Multi Sectoral Development Programme were not able to achieve financial and physical targets. From Table 11.e it is seen that, after three years of completion of Eleventh Plan, the fund utilisation under Multi Sectoral Development Programme has been merely 5.18 percent.
Table 11.d: Actual financial Performance of major schemes (MMA) from 2006-07 t0 2008-09
Schemes 2006-07 (BE)
2006-07 (Actuals)
2007-08 (BE)
2007-08 (Actual)
2008-09 (BE)
2008-09 (Actual)
Grants-in –Aid to MAEF 100 100 50 50 60 60
% of Actual Exp to BE 100 100 100
Contribution to NMDFC 18.29 18.29 70 70 75 75
% of Actual Exp to BE 100 100 100
Free coaching scheme 1.6 0.41 10 5.74 10 7.44
% of Actual Exp to BE 25.625 57.4 74.4

Centre for Budget and Governance Accountability, 2010
Research /Studies ** 1 0.79 6 10.48 5 8.23% of Actual Exp to BE 79 174.67 164.60
Merit-cum –Means Scholarship 10 0 54 40.8 124.9 63.93
% of Actual Exp to BE 0 75.56 51.18
Pre-Matric Scholarship 0 0 80 0 79.9 62.2
% of Actual Exp to BE 0 0 77.85
Post-Matric Scholarship 0 0 100 9.63 99.9 70.63
% of Actual Exp to BE 0 9.63 70.70
Multi-Sectoral Development Programme 0 0 120 0 539.89 270.85
% of Actual Exp to BE 0 0 50.17
Grants-in Aids to States for (NMDFC) 0 0 10 10 5 0
% of Actual Exp to BE 0 100 0
Source: Compiled from data given in the Detailed Demands for Grants of Ministry of Minority Affairs & Report of the Standing Committee on Social Justice (2009-10)
Table 11.e: Status of implementation Multi Sectoral development Programme (as on 31st December, 2009) (Amount in Crore)
Number of MCDs 90No. of plan approved 76Total cost of project approved 1821.52Total releases by Centre and States 813.43Total expenditure ( amount in crore) 142.35Total allocation in 11th plan 2750% of expenditure of total project approved 7.81% of expenditure of total released fund 17.50% total cost of approved project to total allocation in 11th plan 66.24% of expenditure to total allocation in 11th plan 5.18
Source: Ministry of Minority Affairs, GoI
Taking into consideration the poor development indicators of minorities, in particular the Muslim community, the Sachar Committee had suggested specific measures for mainstreaming the community and a special policy framework for inclusion of the Muslim community in all development programmes. A separate Union Ministry (Minority Affairs) has been created to ensure the implementation of more than 300 programmes by different Ministries and Departments to alleviate poverty and improve overall human development; however, it is difficult for a single Ministry to deal with so many programmes in an efficient and holistic manner. The larger malaise of exclusion of minorities needs to be addressed by all Ministries and Departments at the national, state and district levels taken together. Panchayati Raj Institutions also have to be given significant role in terms of programme implementation.

Centre for Budget and Governance Accountability, 2010
Overall Magnitude of the Union BudgetWith a clear indication of the economy reviving fast, the Union Government should have taken an expansionary fiscal stance not only for growth accelerating sectors but also for financing adequately the interventions which are promoting social sector development. However, it has chosen to revert to the path of fiscal conservatism, albeit gradually, with Budget 2010-11.
Table 12.a: Total Magnitude of the Union Budget
YearGDP at market prices
(at current prices)[in Rs. Crore]
Union Govt.’s Total Expenditure *
(in Rs. Crore)
Union Govt.’s Total Expenditureas % of GDP
2004-05 3239224 498252 15.42005-06 3706473 505738 13.62006-07 4283979 583387 13.62007-08 4947857 712679 14.42008-09 5574449 (QE) 883956 15.9
2009-10 (RE) 6164178 (AE) 1021547 16.62010-11 (BE) 6934700 (#) 1108749 16.0
Notes: * Total Expenditure from the Union Budget (at current prices); QE: Quick Estimate; AE: Advanced Estimate; #: Projected by Min. of Finance, GoI, assuming GDP growth at 12.5 % over previous year. Source: Compiled from Economic Survey 2009-10, GoI, and Union Budget, GoI, various years.
A “calibrated exit strategy from the expansionary fiscal stance of 2008-09 and 2009-10”, which the Thirteenth Finance Commission has recommended strongly for the Union Government, seems to have been shaped up as the Union Govt.’s Total Expenditure as a proportion of GDP is projected to fall from 16.6 % in 2009-10 (RE) to 16 % in 2010-11 (BE).
Union Govt.’s Total Expenditure as a proportion of GDP is projected to fall from 16.6 % in 2009-10 •(RE) to 16 % in 2010-11 (BE). The next five years could witness growing efforts by the Union Govt. towards elimination/reduction of deficits through compression of public expenditure.Tax-GDP ratio (for the Centre) shows a small increase from 10.3 % in 2009-10 (RE) to 10.8 % in 2010-11 •(BE). The impetus in Budget 2010-11 towards further reduction of the direct tax rates raises a concern, while the proposed increases in the duties on crude oil, petrol, and in particular diesel, are ill-timed given the problem of steep rise in prices over the last few months.A liberal estimate of the amount of additional tax revenue which could have been collected by the Union •Govt. in 2009-10, if all exemptions/incentives/deductions (both in direct and indirect taxes) had been eliminated, stands at a staggering 8.1 % of GDP.Union Budget 2010-11 fails to address the problems confronting fiscal federalism in India. The trend of •growing dominance of Centre vis-à-vis States in the domain of Plan expenditure would continue in 2010-11. And, the Gross Devolutions & Transfers (GDT) from Centre to States would be 5.4 % of GDP in 2010-11, which is unlikely to reverse the disturbing trend of a decline in the share of GDT in Aggregate Expenditure from State Budgets.

Centre for Budget and Governance Accountability, 2010
In tandem with the compression of public expenditure, the Fiscal Deficit of Union Govt. is projected to fall from 6.7 % of GDP in 2009-10 (RE) to 5.5 % of GDP in 2010-11 (BE), and the Revenue Deficit is estimated at 4.0 % of GDP in 2010-11 (BE), significantly lower than the 5.3 % figure for 2009-10 (RE).
As regards the policy direction suggested by the Thirteenth Finance Commission, both the Report of the Commission (tabled in Parliament on 25th of February) and the Union Budget 2010-11 clearly indicate that the next five years would witness growing efforts by the Union Govt. towards elimination/reduction of deficits through compression of public expenditure. Consequently, any significant boost to public expenditure in the social sectors in the last two years of the Eleventh Five Year Plan (2010-11 and 2011-12) seems unlikely now.
Table 12.b: Deficits in the Union Budget
Year Revenue Deficit as % of GDP
Fiscal Deficit as % of GDP
2004-05 2.5 4.02005-06 2.6 4.12006-07 1.9 3.42007-08 1.1 2.72008-09 4.5 6.0
2009-10 RE 5.3 6.72010-11 BE 4.0 5.5
Source: Compiled from Budget at a Glance, Union Budget, GoI, various years.
Mobilisation of Tax RevenueCompression of public expenditure would not be inevitable for fiscal consolidation by the Union Govt. if it could mobilise adequate resources through tax and non-tax revenues. As shown in Chart 12.a, tax revenues would contribute the largest chunk of receipts for the Union Govt. in 2010-11 (estimated to be around Rs. 7.5 lakh crore); while non-tax revenues are expected to be around Rs. 1.5 lakh crore, proceeds from disinvestment too are projected to increase in 2010-11. Borrowing by the Union Govt. is projected to fall from Rs. 4.2 lakh crore in 2009-10 (RE) to Rs. 3.8 lakh crore in 2010-11 (BE).
Chart 12.a
Note: Non-Debt Capital Receipts mainly comprise proceeds from Disinvestment. Source: Compiled from Receipts Budget, Union Budget 2009-10, GoI.
Despite the estimated rise in the absolute level of Gross Tax Revenue of Centre in 2010-11, the tax-GDP ratio (for the Centre) shows a small increase from 10.3 % in 2009-10 (RE) to 10.8 % in 2010-11 (BE). The tax-GDP ratio for the Centre had reached the level of 12 % by 2007-08, which was a welcome trend given that India’s tax-GDP ratio (hovering, since a long time, around 16 % for Centre and States combined) has been significantly lower than that for several other countries. However, one of the core strategies of the Fiscal Stimulus Package of the Union Govt., for dealing with the impact of global financial crisis since the latter half of 2008-09, has been reductions in indirect taxes. As a result, the tax-GDP ratio for the Union Govt. had fallen from 12 % in 2007-08 to 10.3 % in 2009-10 (RE) and it still has not recovered much (see Chart 12.b).
Major Sources of Receipts for Union Budget

Centre for Budget and Governance Accountability, 2010
In this context, the impetus in Budget 2010-11 towards further reduction of the direct tax rates (mainly in personal income tax), which is estimated to result in a revenue loss of Rs. 26,000 crore, raises a concern. On the other hand, while the proposed increases in rates of indirect taxes and duties are expected to result in a revenue gain of around Rs. 46,500 crore, the hike in the duties on crude oil, petrol, and in particular diesel, have been strongly criticized as ill-timed given the problem of steep rise in prices of food and non-food articles over the last few months.
Chart 12.b
Tax-GDP Ratio
9.4 9.911.1
12.010.9 10.810.3
0.0
2.0
4.0
6.0
8.0
10.0
12.0
14.0
16.0
18.0
20.0
2004-05 2005-06 2006-07 2007-08 2008-09 2009-10(RE)
2010-11(BE)
(in %
)
Note: Union Government’s Gross Tax Revenue as % of GDP Source: Compiled from Receipts Budget, Union Budget, GoI, various years.
The Finance Minster had recognized, in last year’s Budget Speech that India’s tax base continues to be low compared to other countries, mainly due to a plethora of exemptions / deductions in the Central Government tax system. However, the Government has not taken any corrective measures in this regard even in the Budget for 2010-11. As shown in Table 12.c, the total magnitude of tax revenue foregone due to exemptions/incentives/deductions in the Central Government tax system has been estimated (by the Finance Ministry itself) to rise from Rs. 4.14 lakh crore in 2008-09 to Rs. 5.02 lakh crore in 2009-10. What it implies is: a liberal estimate of the amount of additional tax revenue which could have been collected by the Union Govt. in 2009-10, if all exemptions/incentives/deductions (both in direct and indirect taxes) had been eliminated, stands at a staggering 8.1 % of GDP.
Table 12.c: Tax Revenue Foregone in the Central Government Tax System due to Tax Exemptions/Incentives/Deductions
Items
Revenue Foregone in
2008-09(in Rs. Crore)
Revenue Foregone as %
of aggregate tax collection in 2008-09
Revenue Foregone in
2009-10(in Rs. Crore)
Revenue Foregone as %
of aggregate tax collection in 2009-10
Corporate Income Tax 66901 11.08 79554 12.60Personal Income-tax 37570 6.22 40929 6.48Excise Duty 128293 21.25 170765 27.04Customs Duty 225752 37.39 249021 39.43Total 458516 75.95 540269 85.56Less (Export Credit Related) 44417 7.36 37970 6.01Grand Total 414099 68.6 502299 79.5
Note: (1) As per the Receipts Budget in Union Budget, “ the estimates and projections are intended to indicate the potential revenue gain that would be realized by removing exemptions, deductions, weighted deductions and affected by removal of such measures….. (Also) the cost of each tax concession is determined separately, assuming that all other tax provisions remain unchanged”. (2) Aggregate Tax Collection refers to the aggregate of net direct and indirect tax collected by the Central Government.Source: Receipts Budget, Union Budget 2010-11, GoI.
Tax - GDP Ratio

Centre for Budget and Governance Accountability, 2010
Not all kinds of tax exemptions/incentives/deductions can be eliminated; however, there could be a strong case for removing those exemptions which are benefiting mainly the privileged sections of population. For instance, the estimated magnitude of tax revenue foregone in 2009-10 due to exemptions in customs duties relating to “Diamond, Gold and Jewellery” is as much as Rs. 39,769 crore! Likewise, with regard to exemptions in corporation tax, the Finance Ministry estimates that the Effective tax rate (inclusive of surcharge and education cess) in 2008-09 was 27.1 % for Public Sector companies and only 21.6 % for Private Sector companies.
Impact on State Finances
Union Budget 2010-11 marks the first year of the implementation of Thirteenth Finance Commission recommendations. Despite the increase in States’ Share in Central Taxes & Duties to 32 % (from the erstwhile 30.5 %) and a number of specific purpose grants, recommended by the Thirteenth Finance Commission, the Gross Devolutions & Transfers (GDT) from Centre to States would be 5.4 % of GDP in 2010-11 (which is almost the same as that in 2007-08 and 2008-09). This is unlikely to reverse the disturbing trend of a decline in the share of GDT in Aggregate Expenditure from State Budgets.
Chart 12.c
Note: Gross Devolution and Transfers (GDT) include: (i) States’ Share in Central taxes, (ii) Grants from the Centre and (iii) Gross Loans from the Centre.Source: Compiled from data provided in Union Budget, GoI, various years; Economic Survey 2009-10, GoI; State Finances: A Study of Budgets, RBI, various years.
Table 12.d: Growing dominance of Centre vis-à-vis States in the domain of Plan Expenditure
Years
Shares inTotal Plan Expenditure from the Union Budget
Proportion ofBudget Support for Plan Schemes of
Central Govt. Ministrieswhich is Bypassing # State
Budgets (in %)
Budget Support for Plan Schemes of Central Govt. Ministries (in %)
Central Assistance for State and UT
Plans(in %)2006-07 RE 73.2 24.9 35.72007-08 RE 71.6 26.6 34.52008-09 RE 72.1 26.4 42.62009-10 RE 72.7 26.0 41.02010-11 BE 75.2 23.8 38.3
Notes: # Funds for Central Schemes directly transferred to State/District Level Implementing Agencies. Source: Compiled from the data given in Union Budget, GoI, various years.
Likewise, the trend of growing dominance of Centre vis-à-vis States in the domain of Plan expenditure would continue in 2010-11; as the share of Central Assistance for State and UT Plans in the Total Plan Expenditure from Union Budget registers a decline from 26 % in 2009-10 (RE) to 23.8 % in 2010-11 (BE). Moreover, in 2010-11, as much as 38.3 % of the Budget Support for Plan Schemes of Central Govt. Ministries would be routed outside the State Budgets. Thus, Union Budget 2010-11 fails to address the problems confronting fiscal federalism in India.
Gross Devolutions & Transfers (GDT) from Centre to States

Centre for Budget and Governance Accountability, 2010
Every Budget broadly consists of two parts, viz. (i) Expenditure Budget and (ii) Receipts Budget. The Expenditure Budget presents the information on how much the Government intends to spend and on what, in the next fiscal year. On the other hand, the Receipts Budget presents the information on how much the Government intends to collect as its financial resources for meeting its expenditure requirements and from which sources, in the next fiscal year.
Union Budget 2010-11: Budget at a Glance
(In Crore of Rupees)
2008-2009 Actuals@
2009-2010 Budget Estimates
2009-2010 Revised Estimates
2010-2011 Budget Estimates
1. Revenue Receipts 540259 614497 577294 682212
2. Tax Revenue (net to Centre) 443319 474218 465103 534094
3. Non-tax Revenue 96940 140279 112191 1481184. Capital Receipts (5+6+7) $ 343697 406341 444253 426537 5. Recoveries of Loans 6139 4225 4254 5129 6. Other Receipts 566 1120 25958 40000 7. Borrowings and other Liabilities* 336992 400996 414041 381408
8. Total Receipts (1+4) $ 883956 1020838 1021547 1108749
9. Non-plan Expenditure 608721 695689 706371 735657 10. On Revenue Account of which, 559024 618834 641944 643599
11. Interest Payments 192204 225511 219500 248664 12. On Capital Account 49697 76855 64427 9250813. Plan Expenditure 275235 325149 315176 373092 14. On Revenue Account 234774 278398 264411 315125 15. On Capital Account 40461 46751 50765 5796716. Total Expenditure (9+13) 883956 1020838 1021547 1108749 17. Revenue Expenditure (10+14) 793798 897232 906355 958724
18. Capital Expenditure (12+15) 90158 123606 115192 150025
19. Revenue Deficit (17 - 1) 253539 282735 329061 27651220. Fiscal Deficit {16 - (1+5+6)} 336992 400996 414041 38140821. Primary Deficit (20 - 11) 144788 175485 194541 132744@ Actuals for 2008-09 are provisional. $ Does not include receipts in respect of Market Stabilization Scheme.* Includes draw-down of Cash Balance.Source: www.indiabudget.nic.in

Centre for Budget and Governance Accountability, 2010
Classification of Government Interventions/Services Economic Services: These are government services/functions which usually lead to income generating activities for people and promote the expansion of economic activities in the country. Social Services: These services usually refer to the interventions by the Government which are expected to promote social development. Although better outcomes in the social sector, like better education and better health, also contribute towards economic development, this effect would be indirect and take more time to be realized. General Services: The term General is meant to distinguish these services from the other two kinds of services, i.e. Economic and Social.
CLASSIFICATION EXAMPLES OF GOVT. SERVICES/ FUNCTIONS General Services
Interest Payments Repayment of Debt (taken in the past)DefenceLaw and Order (Police)Running of Different Organs of the State Pensions
Economic Services
AgricultureIrrigationIndustry and MineralsEmployment Generation ProgrammesTransport
Social Services
EducationHealth & Family WelfareWater Supply & SanitationWelfare of Marginalised SectionsWelfare of Handicapped and Destitute PeopleYouth Affairs & Sports
Grants to Sub-national Governments
Grants in Aid to StatesGrants in Aid to Union Territories
Note: This table illustrates only some of the services/ functions under the various heads. Please refer to the budget documents for a comprehensive list.
Classification of Government ReceiptsReceipts Budget can be divided into two distinct categories viz. Revenue Receipts and Capital Receipts.
Capital Receipts: Capital Receipts lead to a reduction in the assets or an increase in the liabilities of the government. Capital Receipts need not come periodically in every Budget.
Capital Receipts that lead to a reduction in assets are - Recoveries of Loans given by the government in the past, and Earnings from Disinvestment in government owned enterprises. Capital Receipts through Debt lead to an increase in government’s liabilities.
Revenue Receipts: With this kind of receipts, there is no change in the asset-liability position of the government, i.e. a Revenue Receipt neither reduces the assets of the government nor increases its liabilities. Revenue Receipts consist of proceeds of total Tax and Non-Tax Revenues of the government.
Some examples of Revenue Receipts:Receipts from Fees/ User Charges- imposed by government; Dividend & Profits from government owned enterprises (no effect on the size of the original asset of government); Revenue earned from the various

Centre for Budget and Governance Accountability, 2010
types of Taxes
Classification of Revenue Receipts
Tax Revenue and Non-Tax Revenue:- The receipts of the Government through different types of taxes are collectively referred to as Tax Revenue. On the other hand, Interest receipts, Fees/ User Charges, and Dividend & Profits from Government Enterprises together constitute the Non-Tax Revenue of the Government. However, Recoveries of Loans, Earnings from Disinvestment, and Debt are distinguished from Revenue Receipts and are referred to as Capital Receipts.
Direct and Indirect Taxes-
Direct Taxes: Those taxes for which the tax-burden cannot be shifted or passed on are called Direct Taxes. What this means is: any person, who directly pays this kind of a tax to the Government, bears the burden of that particular tax. Examples of Direct Taxes are: Corporation Tax, Personal Income tax and Wealth Tax etc.
Indirect Taxes: Those taxes for which the tax-burden can be shifted or passed on are called Indirect Taxes. What this implies is: any person, who directly pays this kind of a tax to the Government, need not bear the burden of that particular tax; he/she can ultimately shift the tax-burden to other persons later through business transactions of goods/ services. Examples of Indirect Taxes are: Customs Duties, Excise Duties, Sales Tax, Service Tax etc.
Classification of Government Expenditure
Revenue and Capital Expenditure:
The entire Expenditure Budget can be divided into two distinct categories called: Revenue Expenditure and Capital Expenditure.
Capital Expenditure is usually meant for increasing the government’s assets or reducing its liabilities. It is, however, not necessary that the assets created should be productive or they should even be revenue - generating. Once the government decides to spend for the creation of an asset, Capital Expenditure bears all charges - for the first construction of the asset, while Revenue Expenditure bears all subsequent charges for its maintenance and all working expenses. Capital Expenditure of any type is usually not incurred regularly from every Budget. Hence, most kinds of - Capital Expenditure are seen as non-recurring expenditure. Some examples of Capital Expenditure:- Government spends for building a new Factory (increase in assets)- Government gives a Loan to someone (increase in assets)- Government repays the Principal amount of a debt it had taken from someone (reduction of a liability)-
Revenue Expenditure generally does not have anything to do with creation of assets or reduction of liabilities of the government. Most kinds of Revenue Expenditure are seen as recurring expenditure, since the government incurs those expenditure periodically from every Budget. Some examples of Revenue Expenditure:
Government pays the Interest charges due on a loan from International Monetary Fund (no effect on the - size of the original liability of Government)Government expenditure on Food Subsidy (no effect on assets/ liabilities)- Government spending on Salary of its employees - Government spending on procurement of medicines for its hospitals- Government gives Grants to a sub-national government, which spends it to build Schools/ Hospitals (This - would not be reported as a Capital Expenditure in the Budget of the national Government as the national Government would not own the Schools/ Hospitals built!)

Centre for Budget and Governance Accountability, 2010
Plan and Non-plan Expenditure
Plan Expenditure is meant for financing the development schemes formulated under the given Five Year Plan or the unfinished tasks of the previous Plans. Once a programme or scheme pursued under a specific Plan completes its duration, the maintenance cost and future running expenditures on the assets created or staff recruited are not regarded as Plan Expenditure.
Any expenditure of the government that does not fall under the category of Plan Expenditure is referred to as Non-Plan Expenditure. Sectors like Defence, Interest Payments, Pensions, Subsidies, Police, Audits etc. have only Non-plan Expenditure since these services are completely outside the purview of the Planning Commission; while sectors like Agriculture, Education, Health, Water & Sanitation etc. have both Plan and Non-plan Expenditure.
Different Categories of Plan Schemes
There are three different kinds of Plan Schemes, which are implemented in any State, viz. State Plan Schemes, Central Sector Schemes and Centrally Sponsored Schemes.
State Plan Schemes – The funds for State Plan Schemes are provided only by the State Government, with no ‘direct contribution’ from the Centre. However, the Centre may provide, at the recommendation of Planning Commission, some assistance to the State Government for its State Plan schemes, which is known as ‘Central Assistance for State & UT Plans’. Unlike Centre’s grants to a State under central schemes, the ‘Central Assistance for State & UT Plans’ cannot be tied to any conditionalities of the central government ministries.
Central Sector Schemes (also known as Central Plan Schemes) – The entire amount of funds for a Central Sector Scheme/ Central Plan Scheme is provided by the Central Government from the Union Budget. The State Government implements the Scheme, but it does not provide any funds for such a Scheme from its State Budget.
Centrally Sponsored Schemes – In case of a Centrally Sponsored Scheme, the Central Government provides a part of the funds and the State Government provides a matching grant for the Scheme. The ratio of contributions by the Centre and a State is pre-decided through negotiations between the two.
Deficit & Debt
The excess of government’s expenditure over its income is known as ‘Deficit’. Thus, deficit refers to a gap, and the Govt. takes Debt to cover that gap. Until late 1990s, Govt. of India could ask RBI to print money to cover a part of this Fiscal Deficit (called, Monetisation of Fiscal Deficit). But that practice has been discontinued.
Fiscal Deficit: Fiscal Deficit is the gap between the government’s total expenditure (including loans net of repayments) and its sum total of non-debt receipts. Thus, fiscal deficit indicates the total borrowing to be made by the government in a particular year.
Revenue Deficit: The gap between Revenue Expenditure of the Govt. and its Revenue Receipts is called the Revenue Deficit.
Budget Estimates (BE) and Revised Estimates (RE)
Let’s consider a new Budget being presented in Parliament. The estimates presented in this Budget for the approaching fiscal year would be called Budget Estimates (BE). The estimates presented in this Budget for the current/ ongoing fiscal year based on the disbursements in the first two to three Quarters of the fiscal year would be called as Revised Estimates (RE). However, the figures (of receipts and expenditure) for the previous fiscal year would be referred to as Actuals or Accounts.