- Amazon Simple Storage Service · What is DAX? o Programming language •Power Pivot •SSAS...
345
www.sqlbi.com
Transcript of - Amazon Simple Storage Service · What is DAX? o Programming language •Power Pivot •SSAS...

www.sqlbi.com


Who We Are
o BI Experts and Consultants
o Founders of www.sqlbi.com
• Problem Solving• Complex Project Assistance• Data Warehouse Assessments and Development• Courses, Trainings and Workshops
o Book Writers
o Microsoft Gold Business Intelligence Partners
o SSAS Maestros – MVP – MCP

The DAX Language
o Language of
• Power Pivot
• Power BI
• SSAS Tabular
o DAX is simple, but it is not easy
o New programming concepts and patterns

Introduction to DAX
Introduction to the DAX language

What is DAX?
o Programming language
• Power Pivot• SSAS Tabular• Power BI
o Resembles Excel
• Because it was born with PowerPivot
o Important differences
• No concept of «row» and «column»• Different type system
o Many new functions
o Designed for data models and business

Functional Language
DAX is a functional language, the execution flows with function calls, here is an example of a DAX formula
=SUMX (FILTER (
VALUES ( 'Date'[Year] ),'Date'[Year] < 2005
),IF (
'Date'[Year] >= 2000,[Sales Amount] * 100,[Sales Amount] * 90
))

DAX Types
o Numeric types
• Integer (64 bit)
• Decimal (floating point)
• Currency (money)
• Date (DateTime)
• TRUE / FALSE (Boolean)
o Other types
• String
• Binary Objects

DAX Type Handling
o Operator Overloading
• Operators are not strongly typed
• The result depends on the inputs
o Example:
• "5" + "4" = 9
• 5 & 4 = "54"
o Conversion happens when needed
• i.e. when you don’t want it to happen

DateTime
o Floating point value
o Integer part
• Number of days after December, 30, 1899
o Decimal part
• Seconds: 1 / ( 24 * 60 * 60 )
o DateTime Expressions
• Date + 1 = The day after
• Date - 1 = The day before

DAX Syntax for Columns
o The general format
• 'TableName'[ColumnName]
o Quotes can be omitted
• If TableName does not contain spaces
• Do it: don’t use spaces, omit quotes
o TableName can be omitted
• Current table is searched for ColumnName
• Don’t do it, harder to understand
o Brackets for column name cannot be omitted

Calculated Columns
o Columns computed using DAX
o Always computed for the current row
o Product[Price] means
• The value of the Price column (explicit)
• In the Product table (explicit, optional)
• For the current row (implicit)
• Different for each row

Calculated Columns and Measures
o GrossMargin = SalesAmount - ProductCost
• Calculated column
o GrossMargin% = GrossMargin / SalesAmount
• Cannot be computed row by row
o Measures needed
𝑘=0
𝑛𝐺𝑟𝑜𝑠𝑠𝑀𝑎𝑟𝑔𝑖𝑛
𝑆𝑎𝑙𝑒𝑠𝐴𝑚𝑜𝑢𝑛𝑡≠σ 𝐺𝑟𝑜𝑠𝑠𝑀𝑎𝑟𝑔𝑖𝑛
σ 𝑆𝑎𝑙𝑒𝑠𝐴𝑚𝑜𝑢𝑛𝑡

Measures
o Written using DAX
o Do not work row by row
o Instead, use tables and aggregators
o Do not have the «current row» concept
o Examples
• GrossMargin• is a calculated column
• but can be a measure too
• GrossMargin % • needs to be a measure

Naming Convention
o Measures do not belong to a table
• Avoid table name
• [Margin%] instead of Sales[Margin%]
• Easier to move to another table
• Easier to identify as a measure
o Thus
• Calculated columns Table[Column]
• Measures [Measure]
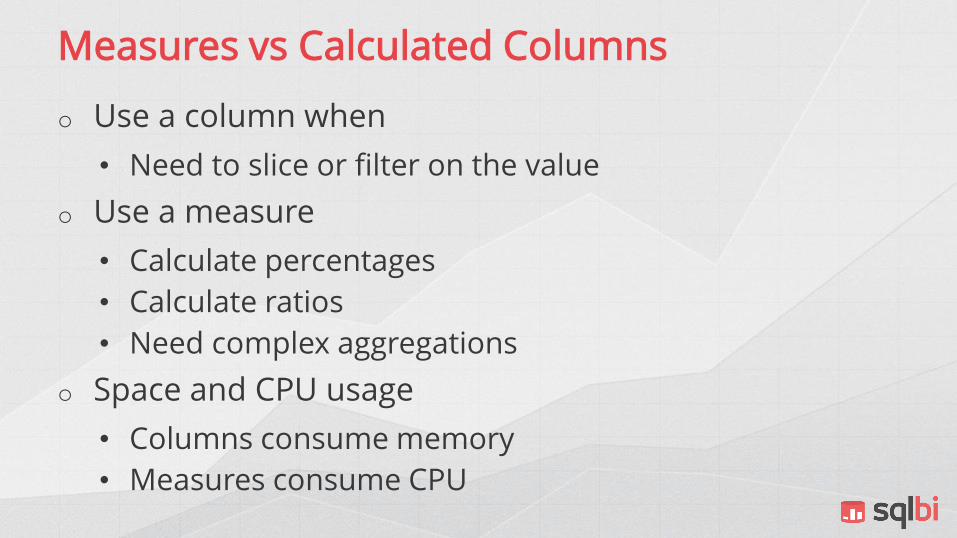
Measures vs Calculated Columns
o Use a column when
• Need to slice or filter on the value
o Use a measure
• Calculate percentages
• Calculate ratios
• Need complex aggregations
o Space and CPU usage
• Columns consume memory
• Measures consume CPU

Handling Errors
o Sales[LineTotal] / Sales[Quantity] fail if
• Sales[Quantity] is blank or zero
• Sales[Quantity] is a string and cannot be converted
o Causes of errors
• Conversion errors
• Arithmetical operations
• Empty or missing values

ISERROR (Expression)
Evaluates Expression
Returns TRUE or FALSE, depending on the presence of an error during evaluation
ISERROR (Sales[GrossMargin] / Sales[Amount]
)

IFERROR (Expression, Alternative)
In case of error returns AlternativeUseful to avoid writing expression twice
IFERROR (Sales[GrossMargin] / Sales[Amount],BLANK ()
)
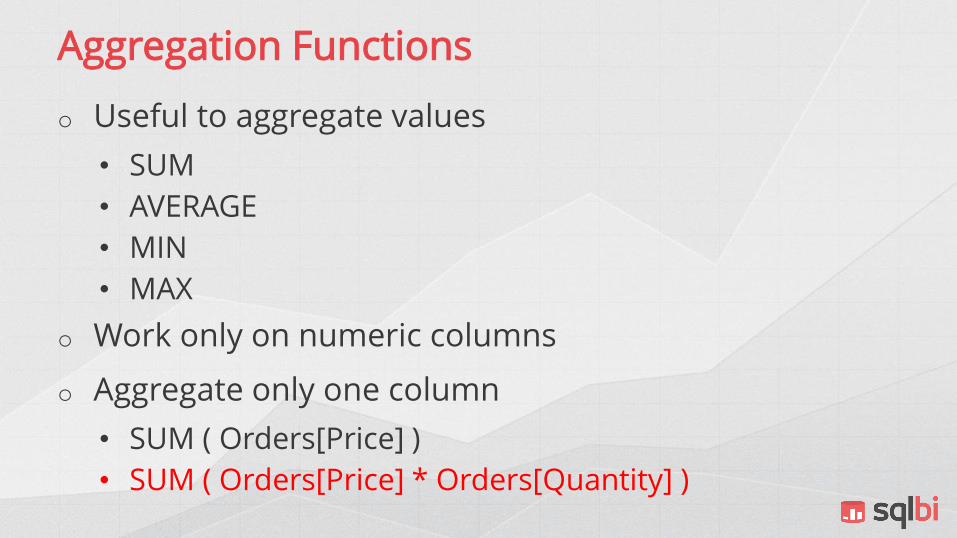
Aggregation Functions
o Useful to aggregate values
• SUM
• AVERAGE
• MIN
• MAX
o Work only on numeric columns
o Aggregate only one column
• SUM ( Orders[Price] )
• SUM ( Orders[Price] * Orders[Quantity] )

The «X» Aggregation Functions
o Iterators: useful to aggregate formulas
• SUMX• AVERAGEX• MINX• MAXX
o Iterate over the table and evaluate the expression for each row
o Always receive two parameters
• Table to iterate• Formula to evaluate for each row

Example of SUMX
For each row in the Sales table, evaluates the formula, then sum up all the resultsInside the formula, there is a «current row»
SUMX (Sales, Sales[Price] * Sales[Quantity]
)

Counting Values
o Useful to count values
• COUNT (only for numeric columns)
• COUNTA (counts anything but blanks)
• COUNTBLANK (counts blanks)
• COUNTROWS (rows in a table)
• DISTINCTCOUNT (performs distinct count)
o COUNTROWS ( Sales )= COUNTA ( Sales[SalesID] )+ COUNTBLANK ( Sales[SalesID] )

Logical Functions
o Provide Boolean logic
• AND
• OR
• NOT
• IF
• IFERROR
o IF / IFERROR are very useful
o AND/OR/NOT can be expressed with operators:
• AND (A, B) = A && B

The Switch Function
Makes it easier to perform nested IFInternally, it is converted into a set of nested IF
SizeDesc =
SWITCH (Product[Size],"S", "Small","M", "Medium","L", "Large","XL", "Extra Large", "Other"
)

Switch to perform CASE WHEN
Creative usage of SWITCH might be very useful
DiscountPct =
SWITCH (TRUE (),Product[Size] = "S", 0.5,AND ( Product[Size] = "L", Product[Price] < 100 ), 0.2,Product[Size] = "L", 0.35,0
)

Information Functions
o Provide information about expressions
• ISBLANK
• ISNUMBER
• ISTEXT
• ISNONTEXT
• ISERROR
o Not very useful, you should know the type of the expressions you are using

MAX and MIN
Used both as aggregators and to compare values
---- Computes the maximum of sales amount--MAX ( Sales[SalesAmount] )
---- Computes the maximum between amount and listprice--MAX ( Sales[Amount], Sales[ListPrice] )
2015
MAXX ( Sales, Sales[SalesAmount] )
IF ( Sales[Amount] > Sales[ListPrice],Sales[Amount], Sales[ListPrice
)

Mathematical Functions
o Provide… math
• ABS, EXP
• FACT, LN
• LOG, LOG10
• MOD, PI
• POWER, QUOTIENT
• SIGN, SQRT
o Work exactly as you would expect

The DIVIDE Function
Divide is useful to avoid using IF inside an expression to check for zero denominators
IF (Sales[SalesAmount] <> 0,Sales[GrossMargin] / Sales[SalesAmount],0
)
You can write it better with DIVIDE
DIVIDE (Sales[GrossMargin],Sales[SalesAmount],0
)
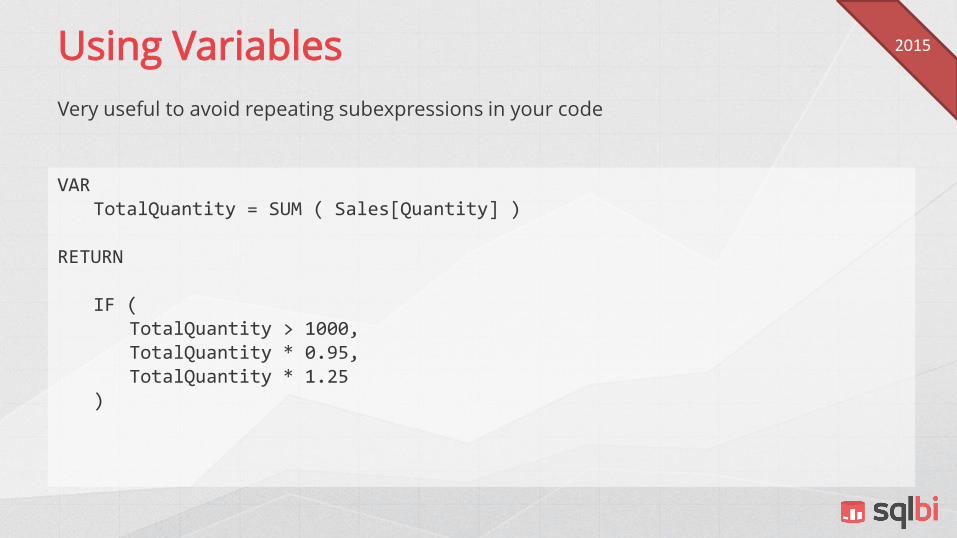
Using Variables
Very useful to avoid repeating subexpressions in your code
VARTotalQuantity = SUM ( Sales[Quantity] )
RETURN
IF (TotalQuantity > 1000,TotalQuantity * 0.95,TotalQuantity * 1.25
)
2015

Rounding Functions
o Many different rounding functions:
• FLOOR ( Value, 0.01 )
• TRUNC ( Value, 2 )
• ROUNDDOWN ( Value, 2 )
• MROUND ( Value, 0.01 )
• ROUND ( Value, 2 )
• CEILING ( Value, 0.01 )
• ISO.CEILING ( Value, 0.01 )
• ROUNDUP ( Value, 2 )
• INT ( Value )

Text Functions
o Very similar to Excel ones
• CONCATENATE,
• FIND, FIXED, FORMAT,
• LEFT, LEN, LOWER, MID,
• REPLACE, REPT, RIGHT,
• SEARCH, SUBSTITUTE, TRIM,
• UPPER, VALUE, EXACT
• CONCATENATE, CONCATENATEX

Date Functions
o Many useful functions
• DATE, DATEVALUE, DAY, EDATE,
• EOMONTH, HOUR, MINUTE,
• MONTH, NOW, SECOND, TIME,
• TIMEVALUE, TODAY, WEEKDAY,
• WEEKNUM, YEAR, YEARFRAC
o Time Intelligence functions will be covered later

Relational Functions
o RELATED
• Follows relationships and returns the value of a column
o RELATEDTABLE
• Follows relationships and returns all the rows in relationship with the current one
o It does not matter how long the chain of relationships is
First Steps with DAX
The goal of this lab is to gain some confidence with the basics of DAX.
Start with a simple model from the Contoso database and author your first DAX formulas.
Refer to lab number 1 on the hands-on manual.

Table Functions
Some functions return tables instead of values

Table Functions
o Basic functions that work on full tables
• FILTER• ALL• VALUES• DISTINCT• RELATEDTABLE
o Their result is often used in other functions
o They can be combined together to form complex expressions
o We will discover many other table functions later in the course

Filtering a Table
SUMX (FILTER (
Orders, Orders[Price] > 1
), Orders[Quantity] * Orders[Price]
)

The FILTER Function
o FILTER
• Adds a new condition
• Restricts the number of rows of a table
• Returns a table
• Can be iterated by an «X» function
o Needs a table as input
o The input can be another FILTER

Removing Filters
SUMX (ALL ( Orders ),Orders[Quantity] * Orders[Price]
)

The ALL Function
o ALL
• Returns all the rows of a table
• Ignores the filter context
• Returns a table
• That can be iterated by an «X» function
o Needs a table as input
o Can be used with a single column
• ALL ( Customers[CustomerName] )
• The result contains a table with one column

ALL with many columns
Returns a table with all the values of all the columns passed as parameters
COUNTROWS ( ALL (
Orders[Channel], Orders[Color], Orders[Size]
))
Columns of the same table

ALLEXCEPT
Removes the filter from all but a few columns
ALL ( Orders[Channel], Orders[Color], Orders[Size],Orders[Quantity], Orders[Price], Orders[Amount]
)
ALLEXCEPT ( Orders, Orders[City] )
Orders[City] not listed here

Mixing Filters
o Table functions can be mixed
o Each one requires a table
o Each one returns a table
o FILTER ( ALL ( Table ), Condition )
• Puts a filter over the entire table
• Ignores the current filter context

Mixing Filters
SUMX ( FILTER (
ALL( Orders ), Orders[Channel]="Internet"
), Orders[Quantity] * Orders[Price]
)
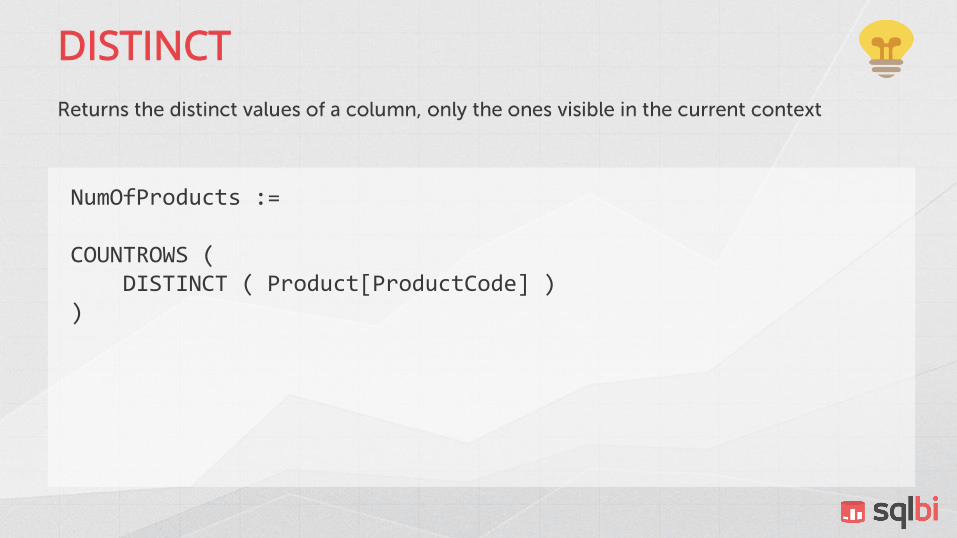
DISTINCT
NumOfProducts :=
COUNTROWS (DISTINCT ( Product[ProductCode] )
)

How many values for a column?
ProductId Product
1 Coffee
2 Pasta
3 Tomato
Amount ProductId
25.00 1
12.50 2
2.25 3
2.50 3
14.00 4
Relationship
BLANK BLANK
Tables with an incoming relationship might contain an additional blank row, created by DAX to guarantee referential integrity

VALUES
NumOfProducts :=
COUNTROWS (VALUES ( Product[ProductCode] )
)

ALLNOBLANKROW
---- Returns only the existing products--
= COUNTROWS (ALLNOBLANKROW ( Products[ProductKey] )
)
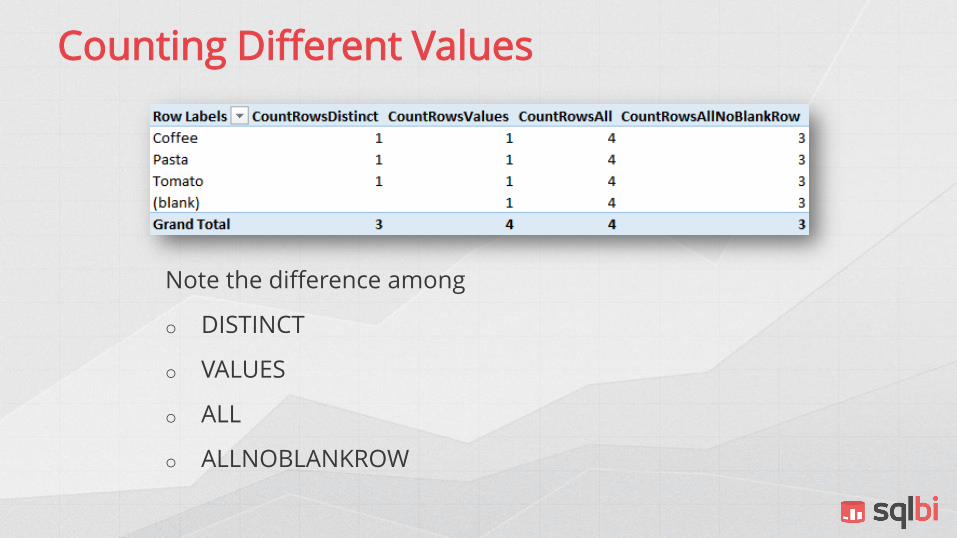
Counting Different Values
Note the difference among
o DISTINCT
o VALUES
o ALL
o ALLNOBLANKROW

ISEMPTY
Checks if a table is empty, might be faster than the equivalent expression with COUNTROWS
ISEMPTY ( VALUES ( Product[Unit Price] ) )
is equivalent to
COUNTROWS ( VALUES ( Product[Unit Price] ) ) = 0
2015
Works since SQL 2012 SP1, does not work with Excel 2013, but it works on Excel
2010 with the latest Power Pivot add-in, in Excel 2016 and in Power BI Desktop

RELATEDTABLE
Returns a table with all the rows related with the current one.
NumOfProducts =
COUNTROWS (RELATEDTABLE ( Product )
)

Example of RELATEDTABLE
Compute the number of red products for a category. Build a calculated column in the Categories table:
NumOfRedProducts =
COUNTROWS (FILTER (
RELATEDTABLE ( Product ),Product[Color] = "Red"
))

Tables and Relationships
Result of table function inherits the relationships of their columns
=SUMX (FILTER (
ProductCategory,COUNTROWS (
RELATEDTABLE ( Product )) > 10
),SUMX (
RELATEDTABLE ( Sales ),Sales[SalesAmount]
))

CALCULATED TABLES
o In the newest versions of Tabular (and in Power BI Desktop), you can create calculated tables
o User interface is different in different products

Table Functions
o The goal of this lab is to gain some confidence with the basics of data modeling.
o Load some tables from AdventureWorks and author your first DAX formulas.
o Please refer to lab number 2 on the hands-on manual.

Evaluation Contexts
Let us take a look at how DAX works

Evaluation Contexts
o Simple concepts, hard to learn
o Refine the concept over time
• First, this introduction
• Next, several examples
• Last, the unifying theory of expanded tables
o At the beginning, it looks very easy
o When you use it, it turns into a nightmare

What is an Evaluation Context?
TotalSales := SUM ( Sales[SalesAmount] )
Numbers are sliced by color, i.e. the formula is NOT computingsum of sales, it is computing itfor only a subset of the data model
The value of a formula depends on its context

Sources of the Context
PivotTable Filter
Slicers
Rows
Columns

Example of a Filter Context
Filter Context
o Defined by
• Row Selection
• Column Selection
• Report Filters
• Slicers Selection
o Rows outside of the filter context
• Are not considered for the computation
o Defined automatically by PivotTable, can be created with specific functions too

Row Context
o Defined by
• Calculated column definition
• Defined automatically for each row
• Row Iteration functions
• SUMX, AVERAGEX …
• All «X» functions and iterators
• Defined by the user formulas
o Needed to evaluate column values, it is the concept of “current row”

SUMX ( Orders, Orders[Quantity] * Orders[Price] )
16x7=11232x5=16064x3=192
128x1=128
SUM = 592

There Are Always Two Contexts
o Filter context
• Filters tables
• Might be empty• All the tables are visible
• But this never happens in the real world
o Row context
• Iterates rows
• For the rows active in the filter context
• Might be empty• There is no iteration running
o Both are «evaluation contexts»

Context Errors
o Orders[Quantity] * Orders[Price]
o In a calculated column
• Works fine
o In a measure
• «Cannot be determined in the current context»
• You cannot evaluate a column value outside of a row context

Working with Evaluation Contexts
o Evaluation contexts
• Modified by the user
• With the PivotTable
• Modified Programmatically
• Adding / Removing filters
• Creating row contexts
• Creating new filter contexts
o Using contexts is the key to many DAX advanced formulas

Filtering a Table
SUMX (FILTER (
Orders, Orders[Price] > 1
), Orders[Quantity] * Orders[Price]
)

Removing Filters
SUMX (ALL ( Orders ),Orders[Quantity] * Orders[Price]
)

Nesting Row Contexts
Row contexts can be nested, on the same or on different tables
SUMX (Categories,SUMX (
RELATEDTABLE ( Products ), SUMX (
RELATEDTABLE ( Sales )…
))
)
Three row contexts:• Categories• Products of category• Sales of product

Ranking by Price
o Create a calculated column
o Ranks products by list price
o Most expensive product is ranked 1

EARLIER in Nested Loops
Another way to understand the EARLIER function
Classical nested loop
FOR I = 1 TO 100FOR J = 1 TO 100
IF I < J THEN ...NEXT
NEXT
With EARLIER, if we have only 1 letter available…
FOR I = 1 TO 100FOR I = 1 TO 100
IF EARLIER (I) < I THEN ...NEXT
NEXT

Nesting Row Contexts
Nesting row contexts on the same table makes writing some expression harder.
SUMX (Sales,SUMX (
Sales, IF (
Sales[ItemNo] = Sales[ItemNo],…
))
)
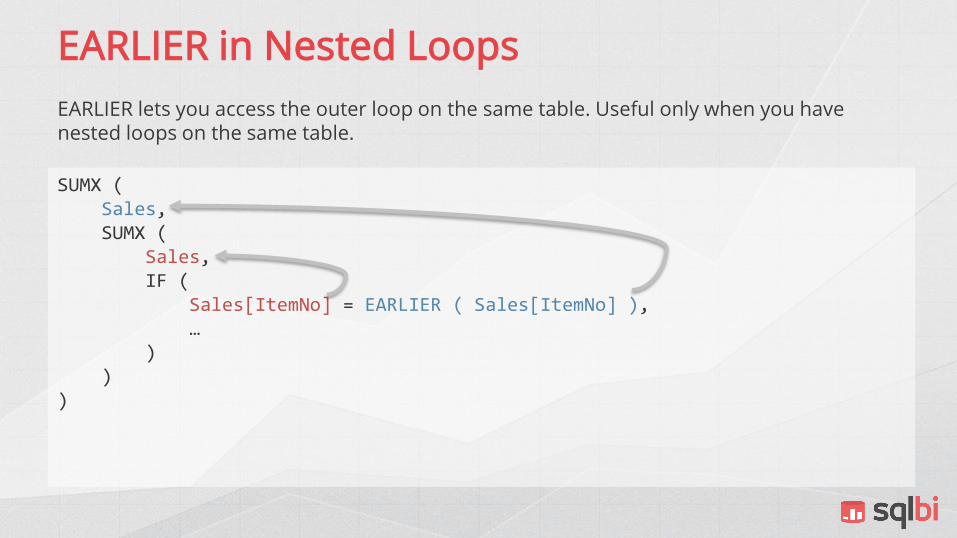
EARLIER in Nested Loops
EARLIER lets you access the outer loop on the same table. Useful only when you have nested loops on the same table.
SUMX (Sales,SUMX (
Sales, IF (
Sales[ItemNo] = EARLIER ( Sales[ItemNo] ),…
))
)

EARLIER
o Useful when two or more row contexts exist for the same table
o Its original name (much better) was OUTER
o EARLIER
• Returns values from the previous row context
• 2nd parameter: number of steps to jump out
o EARLIEST
• Returns values from the first row context
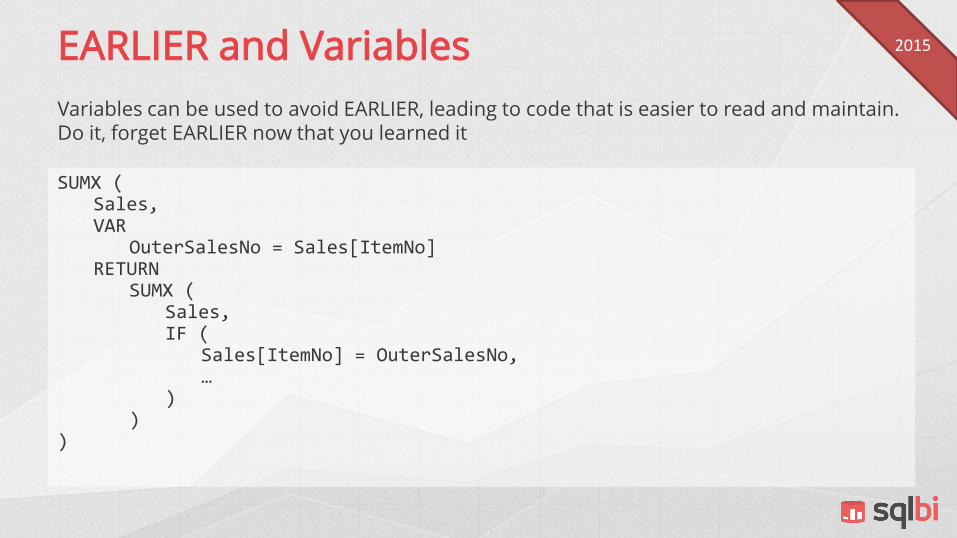
EARLIER and Variables
Variables can be used to avoid EARLIER, leading to code that is easier to read and maintain. Do it, forget EARLIER now that you learned it
SUMX (Sales,VAR
OuterSalesNo = Sales[ItemNo]RETURN
SUMX (Sales,IF (
Sales[ItemNo] = OuterSalesNo,…
))
)
2015

CALCULATE
The queen of all DAX functions

CALCULATE Syntax
Filters are evaluated in the outer filter context, then combined together in AND and finally used to build a new filter context into which DAX evaluates the expression
CALCULATE (Expression, Filter1,…Filtern
)
Repeated many times, as needed

CALCULATE Examples
NumOfBigSales :=
CALCULATE (SUM ( Sales[SalesAmount] ), Sales[SalesAmount] > 100
)
Filter and SUM are on the same table.
You can obtain the same result using FILTER
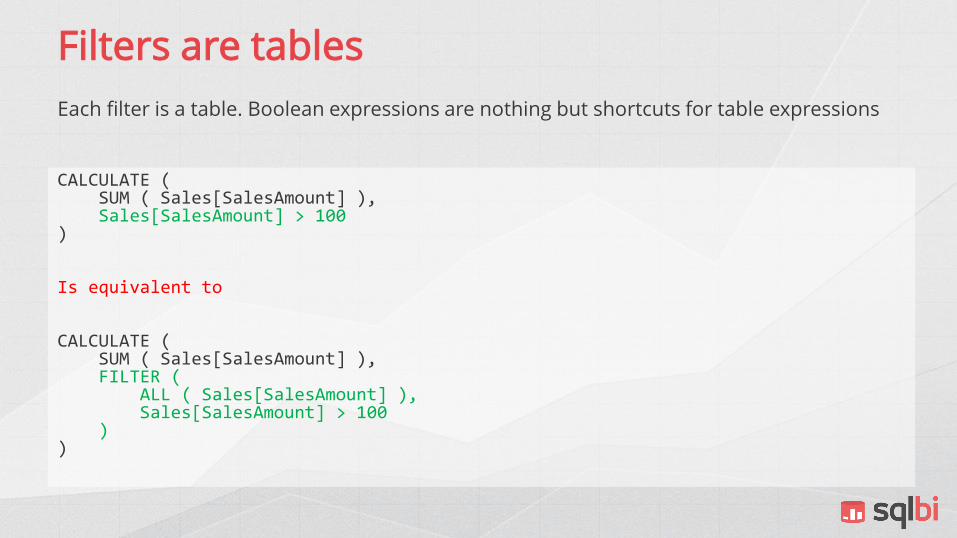
Filters are tables
Each filter is a table. Boolean expressions are nothing but shortcuts for table expressions
CALCULATE (SUM ( Sales[SalesAmount] ), Sales[SalesAmount] > 100
)
Is equivalent to
CALCULATE (SUM ( Sales[SalesAmount] ), FILTER (
ALL ( Sales[SalesAmount] ),Sales[SalesAmount] > 100
))

CALCULATE Examples
SalesInAllColors :=
CALCULATE (SUM ( Sales[SalesAmount] ), ALL ( Product[Color] )
)
The condition is the list of acceptable values

CALCULATE Examples
NumOfRedProducts :=
CALCULATE (SUM ( Sales[SalesAmount] ), Product[Color] = "Red"
)Filter and SUM are on different tables, here CALCULATE is your best option
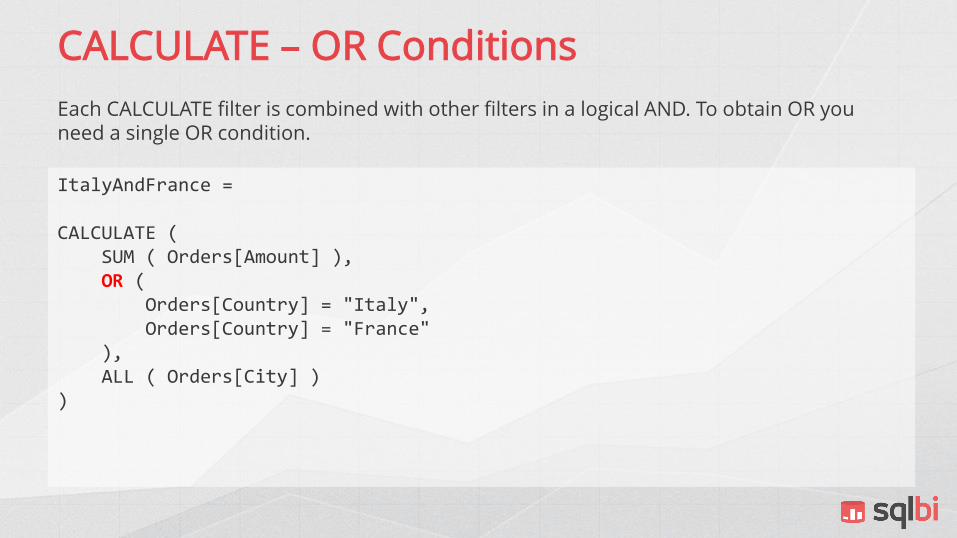
CALCULATE – OR Conditions
Each CALCULATE filter is combined with other filters in a logical AND. To obtain OR you need a single OR condition.
ItalyAndFrance =
CALCULATE (SUM ( Orders[Amount] ),OR (
Orders[Country] = "Italy",Orders[Country] = "France"
),ALL ( Orders[City] )
)
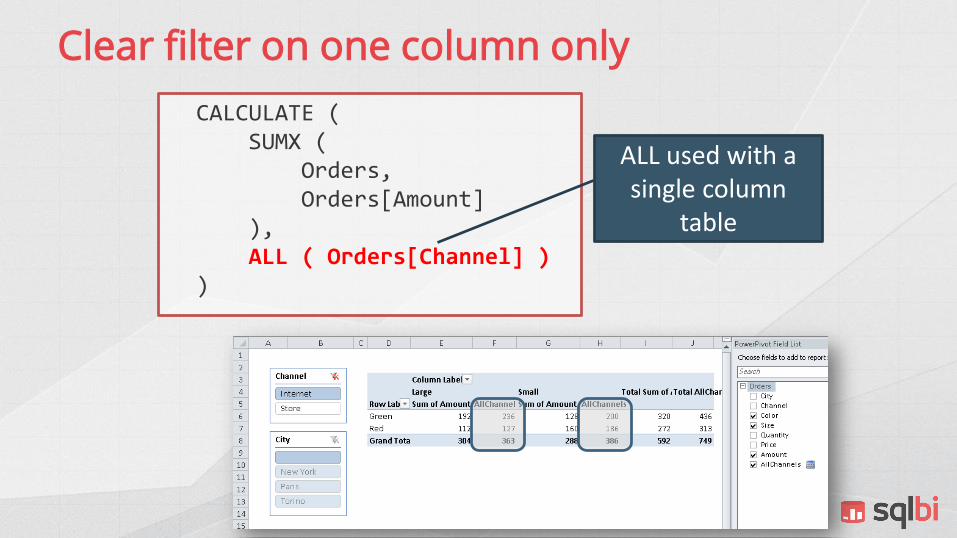
Clear filter on one column only
CALCULATE (SUMX (
Orders, Orders[Amount]
),ALL ( Orders[Channel] )
)
ALL used with a single column
table

Single column filter in action
CALCULATE (SUMX (
Orders, Orders[Amount]
),ALL (Orders[Channel])
)

CALCULATE Tasks
o Partially replaces the filter context
o Conditions
• Can replace a whole table
• Can replace a single column
o CALCULATE works on the filter context
o It performs other tasks
• Which will be described later

Ratios and Percentages

Ratios and Percentages

Ratios and Percentages
Measure based on CALCULATE, creates a new context for the denominator
Perc :=
DIVIDE (
SUM ( Orders[SalesAmount] ),
CALCULATE (SUM ( Orders[SalesAmount] ),ALL ( Orders[SalesTerritoryCountry] )
))

Variables and Evaluation Contexts
Variables are computed in the evaluation where they are defined, not in the one where they are used
WrongRatio :=
VARAmt = SUM ( Sales[SalesAmount] )
RETURNDIVIDE (
Amt, CALCULATE ( Amt, ALL ( Sales ) )
)
2015
Result is always 1

Evaluation Contexts And Relationships
DimCustomer
PK CustomerKey
Customer Gender
DimProduct
PK ProductKey
ProductName ColorFK1 ProductSubcategoryKey
DimProductCategory
PK ProductCategoryKey
ProductCategory
DimProductSubcategory
PK ProductSubcategoryKey
ProductSubcategoryFK1 ProductCategoryKey
FactSales
PK,FK1 CustomerKeyPK,FK2 ProductKey
SalesAmount GrossMargin
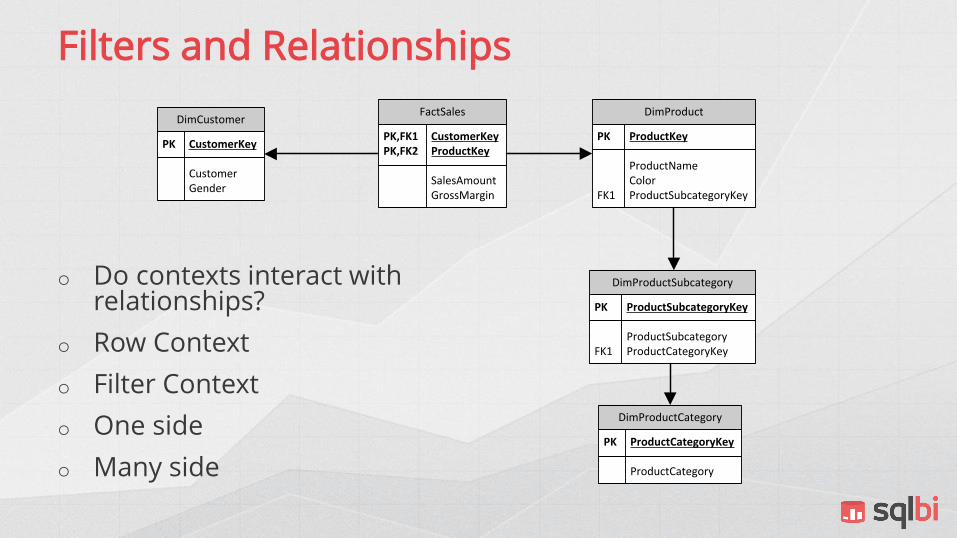
Filters and Relationships
o Do contexts interact with relationships?
o Row Context
o Filter Context
o One side
o Many side

Row Context – Many Tables
o Row Context
• Does not propagate over relationships

RELATED
o RELATED ( table[column] )
• Opens a new row context on the target table
• Following relationships
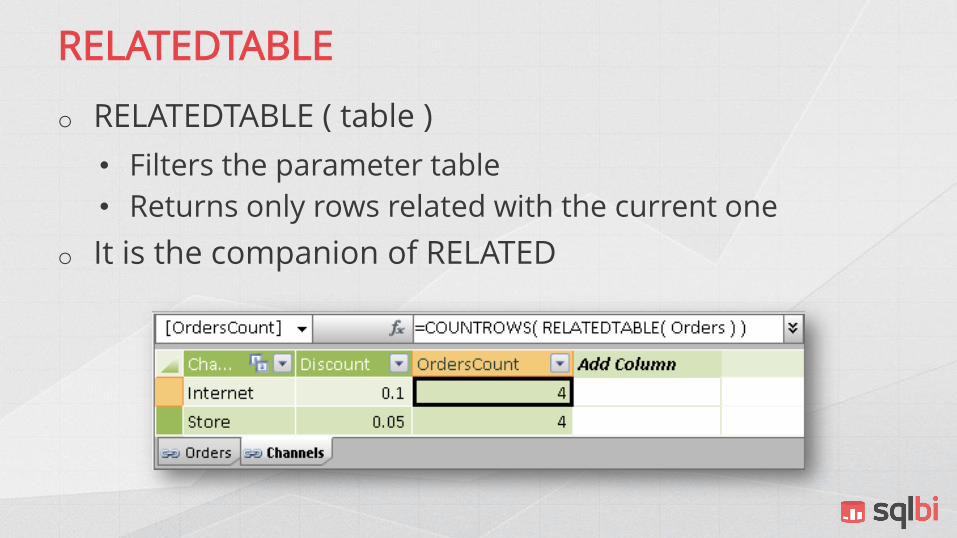
RELATEDTABLE
o RELATEDTABLE ( table )
• Filters the parameter table
• Returns only rows related with the current one
o It is the companion of RELATED

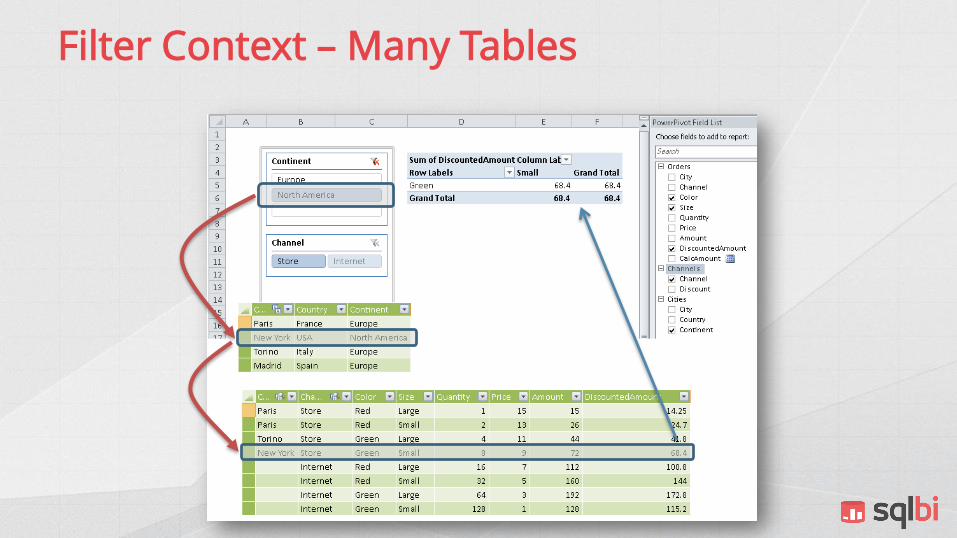
Filter Context – Many Tables
o Filter Context and Relationships
• Relationships affect filter context
o Orders Products
• Filter context on Orders
• Follows the relationship
• Shows only products of the selected orders
o Different from Row Context
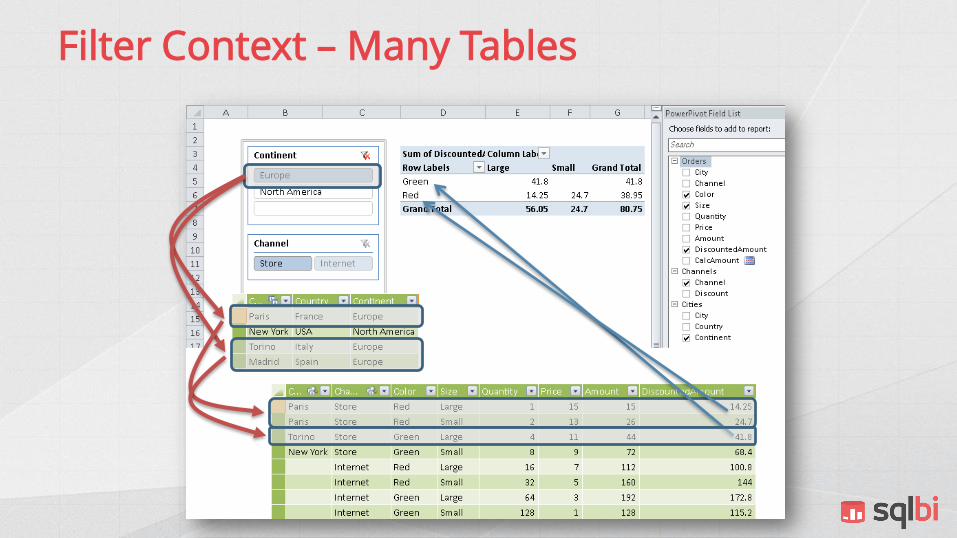
Filter Context – Many Tables
Filter Context – Many Tables

DimCustomer
PK CustomerKey
Customer Gender
DimProduct
PK ProductKey
ProductName ColorFK1 ProductSubcategoryKey
DimProductCategory
PK ProductCategoryKey
ProductCategory
DimProductSubcategory
PK ProductSubcategoryKey
ProductSubcategoryFK1 ProductCategoryKey
FactSales
PK,FK1 CustomerKeyPK,FK2 ProductKey
SalesAmount GrossMargin
Filters and Relationships
Filter context propagates following the available
directions of each relationship

Filter Context – Many Tables
o The interaction with relationships
• Makes things harder
• To follow
• And to understand
o The filter context
• Is propagated through relationships
o The row context
• Is not propagated

CALCULATE Examples
EuropeSales := CALCULATE(
SUM( Orders[Amount] ),Cities[Continent] = "Europe"
)
North America is selected, but
calculation is on Europe
France selection on Country slicer
filters EuropeSales total, ignoring Italy and
Spain. USA is selected but ignored in EuropeSalescalculation
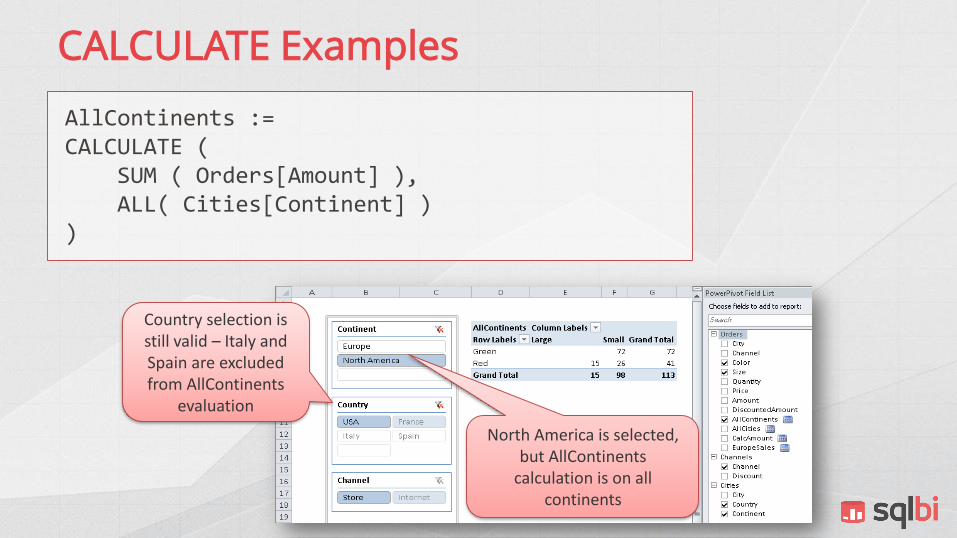
CALCULATE Examples
AllContinents :=CALCULATE (
SUM ( Orders[Amount] ),ALL( Cities[Continent] )
)
North America is selected, but AllContinents
calculation is on all continents
Country selection is still valid – Italy and Spain are excluded from AllContinents
evaluation

CALCULATE Examples
AllCities := CALCULATE (
SUM ( Orders[Amount] ),ALL ( Cities )
)
Continent slicer selection ignored in AllCities calculation
Country slicer selection ignored in
AllContinentscalculation

CALCULATE Examples
AllCities := CALCULATE (
SUM ( Orders[Amount] ),ALL ( Cities ), ALL ( Channels )
)
ALL( Channels ) in CALCULATE filters would ignore also the Channel
slicer selection
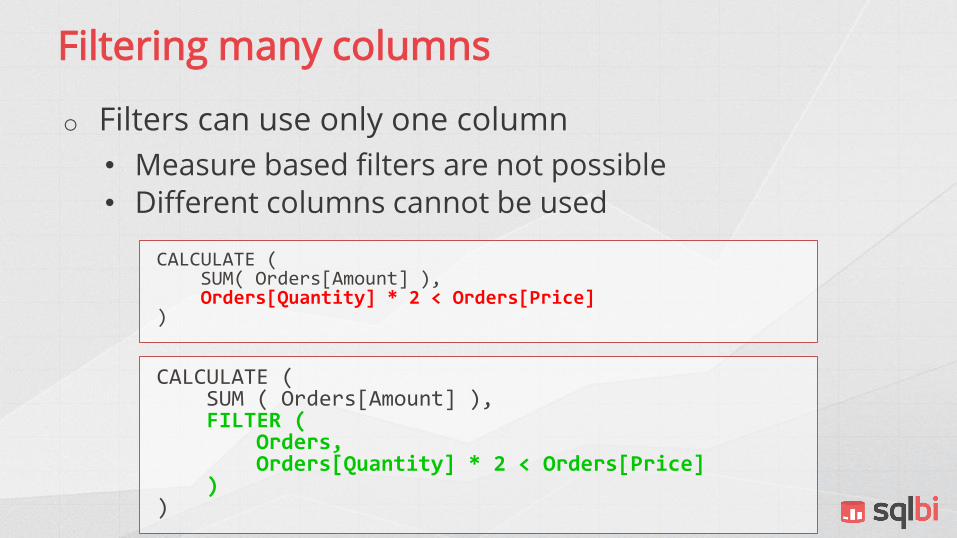
Filtering many columns
o Filters can use only one column
• Measure based filters are not possible• Different columns cannot be used
CALCULATE (SUM( Orders[Amount] ),Orders[Quantity] * 2 < Orders[Price]
)
CALCULATE (SUM ( Orders[Amount] ),FILTER (
Orders, Orders[Quantity] * 2 < Orders[Price]
))

CALCULATE – Filter equivalency
CALCULATE (SUM ( Orders[Amount] ),OR (
Cities[Country] = "Italy",Cities[Country] = "France"
))
CALCULATE ( SUM ( Orders[Amount] ),FILTER(
ALL ( Cities[Country] ),OR(
Cities[Country] = "Italy",Cities[Country] = "France"
))
)

Filter in current selection
CALCULATE (SUM ( Orders[Amount] ),OR (
Cities[Country] = "Italy",Cities[Country] = "France"
),VALUES ( Cities[Country] )
)
CALCULATE ( SUM ( Orders[Amount] ),FILTER(
VALUES ( Cities[Country] ),OR(
Cities[Country] = "Italy",Cities[Country] = "France"
))
)

FILTER and CROSSFILTER«One» Side «Many» Side
Occupation=«BI Pro»
• ISFILTERED ( DimCustomer[Occupation] ) = TRUE
• ISFILTERED ( DimCustomer[FirstName] ) = FALSE• ISCROSSFILTERED ( DimCustomer[FirstName] ) = TRUE• ISCROSSFILTERED ( DimCustomer ) = TRUE (Only DAX 2015)
• ISFILTERED ( FactInternetSales[SalesOrderNumber] ) = FALSE• ISCROSSFILTERED ( FactInternetSales[SalesOrderNumber] ) = TRUE• ISCROSSFILTERED ( FactInternetSales) = TRUE (Only DAX 2015)

FILTER and CROSSFILTER«One» Side «Many» Side
TaxAmt = 100
• ISFILTERED ( FactInternetSales[TaxAmt] ) = TRUE
• ISFILTERED ( FactInternetSales[SalesAmount] ) = FALSE• ISCROSSFILTERED ( FactInternetSales[SalesAmount] ) = TRUE• ISCROSSFILTERED ( FactInternetSales ) = TRUE (Only DAX 2015)
• ISFILTERED ( DimCustomer[CustomerKey] ) = FALSE• ISCROSSFILTERED ( DimCustomer[CustomerKey] ) = FALSE• ISCROSSFILTERED ( DimCustomer ) = FALSE (Only DAX 2015)

HASONEVALUE
HASONEVALUE checks if a column has a single visible value in the current context
HASONEVALUE ( Sales[ProductId] )
is equivalent to
COUNTROWS ( VALUES ( Sales[ProductId] ) ) = 1
ALLSELECTED
CALCULATE modifier, not a table function, intuitively restores the original filter context (slicer and filter, not rows and columns)
The internal behavior is much different, use it with care (we will dive into the details the third day)
ALLSELECTED ( table[column] )
ALLSELECTED ( table )
ALLSELECTED ()
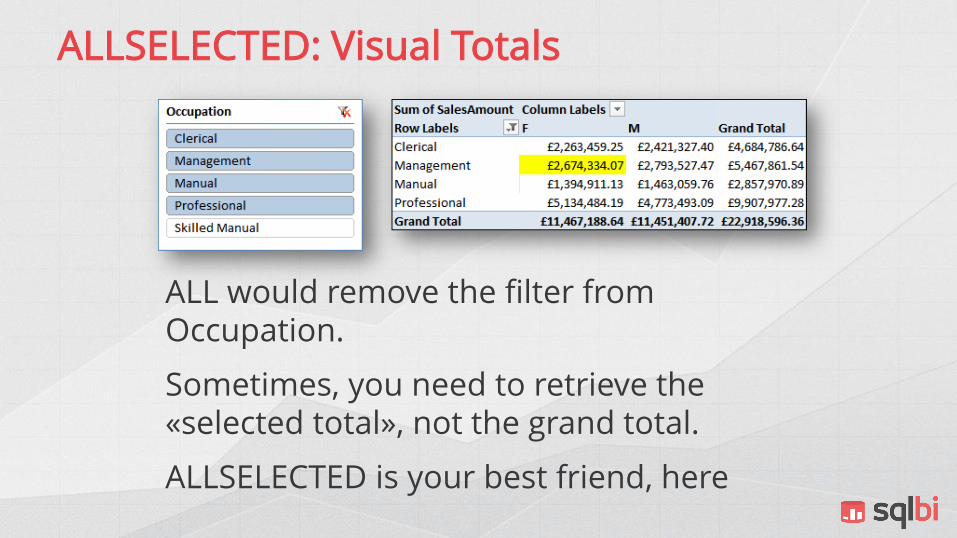
ALLSELECTED: Visual Totals
ALL would remove the filter from Occupation.
Sometimes, you need to retrieve the «selected total», not the grand total.
ALLSELECTED is your best friend, here
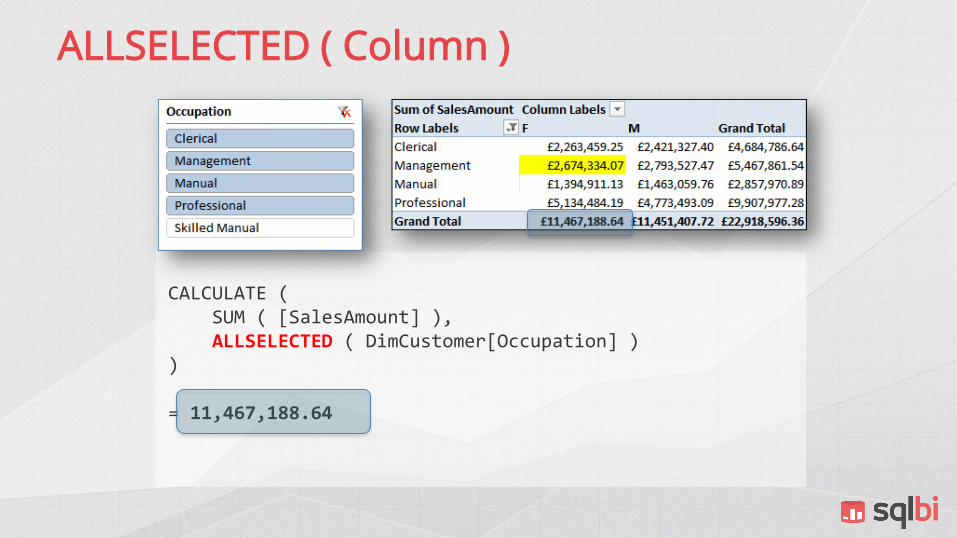
ALLSELECTED ( Column )
CALCULATE (SUM ( [SalesAmount] ),ALLSELECTED ( DimCustomer[Occupation] )
)
= 11,467,188.64

ALLSELECTED ( )
CALCULATE (SUM ( [SalesAmount] ),ALLSELECTED ( )
)
= 22,918,596,36

Context Transition
o Calculate performs another task
o If executed inside a row context
• It takes the row context
• Transforms it into an equivalent filter context
• Applies it to the data model
• Before computing its expression
o Very important and useful feature
• Better to learn it writing some code…

Automatic CALCULATE
Whenever a measure is computed, an automatic CALCULATE is added around the measure
SUMX (Orders,[Sales Amount]
)
SUMX (Orders,CALCULATE ( [Sales Amount] )
)

Equivalent Filter Context
The filter context created during context transition filters all equivalent rows. By «equivalent» we mean all columns identical (possible duplicated rows).
TotalNetSales :=SUMX ( Sales, Sales[Quantity] * Sales[Net Price] )
SalesWrong :=SUMX (
FILTER ( Sales, Sales[Unit Discount] > 0 ),[TotalNetSales]
)
SalesCorrect :=SUMX (
FILTER ( Sales, Sales[Unit Discount] > 0 ),Sales[Quantity] * Sales[Net Price]
)

Circular Dependency
DimProduct[ProfitPct] :=
DimProduct[Profit] / DimProduct[ListPrice]
DimProduct[Profit] :=
DimProduct[ProfitPct] * DimProduct[StandardCost]

CALCULATE Dependencies
Sum the value of ListPrice for all the row in the DimProduct table which have the same value for ProductKey, ProductAlternateKey, StandardCost and ListPrice.
SumOfListPrice =
CALCULATE ( SUM ( Products[ListPrice] )
)

Circular Dependencies
SumOfListPrice Sum the value of ListPrice for all the row in the DimProducttable which have the same value for ProductKey, ProductAlternateKey, StandardCost, ListPrice and NewSumOfListPrice.
NewSumOfListPrice Sum the value of ListPrice for all the row in the DimProducttable which have the same value for ProductKey, ProductAlternateKey, StandardCost, ListPrice and
NewSumOfListPrice =
CALCULATE ( SUM ( Products[ListPrice] )
)

Circular Dependency Solution
o Either:
• Mark a column as the row identifier• Create an incoming relationship• Use ALLEXCEPT to remove dependencies
o With a row identifier
• CALCULATE columns depend on the row id• All of them, no circular dependency
o Row Identifiers are expensive for fact tables
• Maximum number of distinct values• Use with care, avoid if possible

Relationships: Conclusions
o Evaluation Contexts and Relationships
• Make things harder to follow
• Due to interaction between them
o Row context: no relationship handling
o Filter context: follows relationships
o CALCULATE performs context transition
o In a single formula, you may have many different contexts

Evaluation Contexts
o Time to write some DAX code by yourself.
o Next exercise session is focuses on some DAX code that uses evaluation contexts.
o Please refer to lab number 3 on the hands-on manual.

Working with Iterators
Time to start thinking in DAX
Daily Average
o Daily averages are very common
• Stock quantity
• Quantity on-hand
• Daily sales
o AVERAGE is not enough, need to consolidate the daily amount and then average it

Useful Iterators
There are many useful iterators, they all behave in the same way: iterate on a table, compute an expression and aggregate its value
MAXXMINXAVERAGEXSUMXPRODUCTXCONCATENATEXVARXSTDEVXPERCENTILEX.EXC | .INCGEOMEANX
2015

MIN-MAX Sales per Customer
MinSalesPerCustomer :=MINX ( Customer, [Sales Amount] )
MaxSalesPerCustomer :=MAXX ( Customer, [Sales Amount] )

VAR and STDEV Functions
Flavor depends from the algorithm (S | P) and iterative behaviors (X)
VAR.S ( <column> )VAR.P ( <column> )VARX.S ( <table>, <expression> )VARX.P ( <table>, <expression> )STDEV.S ( <column> )STDEV.P ( <column> )STDEVX.S ( <table>, <expression> )STDEVX.P ( <table>, <expression> )

PERCENTILE Functions
Returns the k-th percentile of values in a range, where k is in the range 0..1 (Exclusive or Inclusive)
PERCENTILE.EXCPERCENTILE.INC
PERCENTILEX.EXCPERCENTILEX.INC
2015
Alternative version available on www.daxpatterns.com for users of
previous DAX versions

MEDIAN Functions
Return the median of an expression evaluated for each row in a table
MEDIANMEDIANX
2015
Alternative version available on www.daxpatterns.com for users of
previous DAX versions

Financial Functions
Set of functions typically used in financial applications
GEOMEANGEOMEANX
XIRRXNPV
PRODUCTX
2015

The RANKX Function
Useful to compute ranking, not so easy to master…
---- Syntax is easy… --
Ranking :=
RANKX (Products,Products[ListPrice]
)

How RANKX Works
RANKX ( Table, Expression )
Row Expression
1 120
3 350
2 490
4 560
Computed in a row context on Table, one value for each row during iteration and sorted by Expression
Compute Expression for the current filter context and find the position in the lookup table
2
1Build LookupTable

RANKX ( Table, Expression )
o Table
• Evaluated in the external filter context
o Expression
• Evaluated in the row context of Table during the iteration
• Evaluated in the external filter context for the rank calculation
o These features make it a hard function, at first sight

RANKX Most Common Pitfall
Products is evaluated in the filter context of the cell, thus the lookup table, in each cell, contains a single row
RankOnSales := RANKX ( Products, [SumOfSales] )
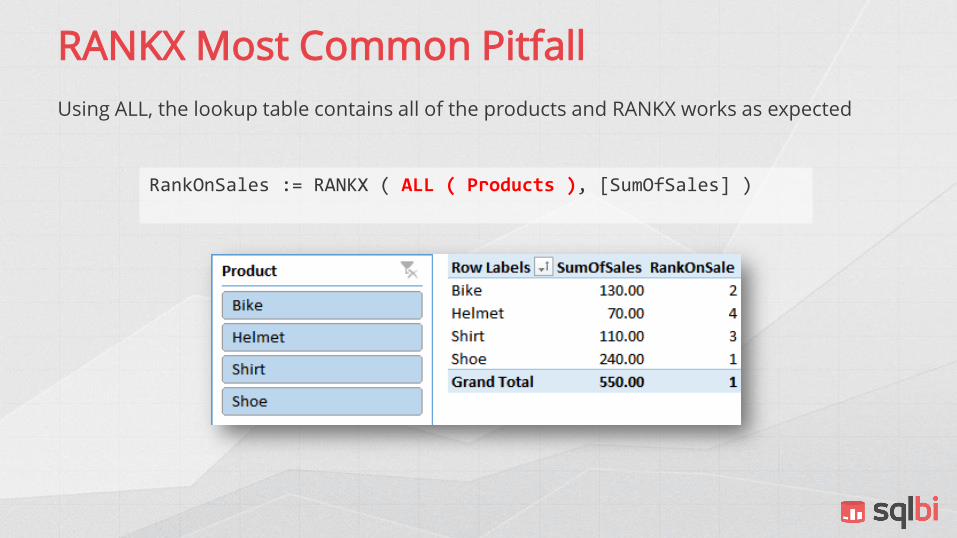
RANKX Most Common Pitfall
Using ALL, the lookup table contains all of the products and RANKX works as expected
RankOnSales := RANKX ( ALL ( Products ), [SumOfSales] )

RANKX and Context Transition
RANKX somewhat relies on context transition, if it is missing, then wrong values will be computed.
RankOnSales := RANKX ( ALL ( Products ), SUM ( Sales[Sales] ) )
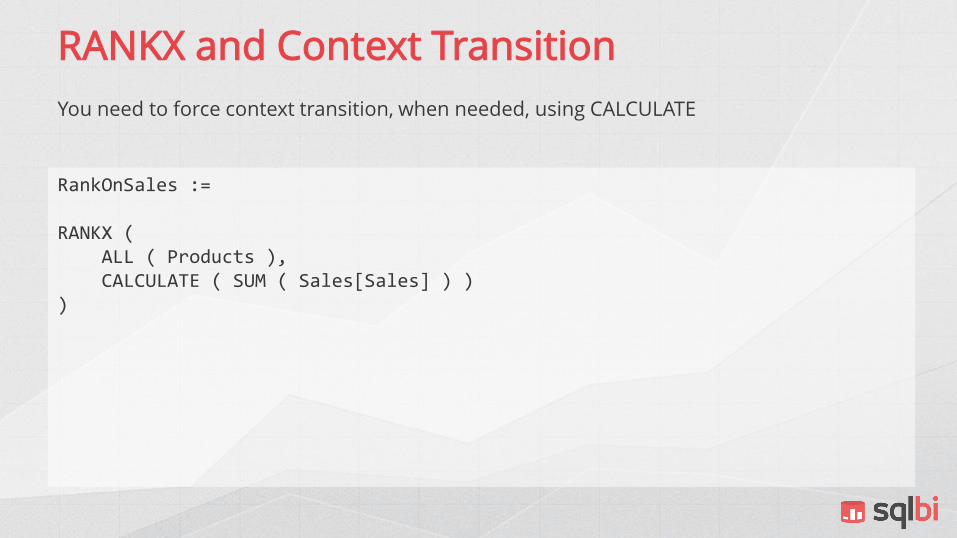
RANKX and Context Transition
You need to force context transition, when needed, using CALCULATE
RankOnSales :=
RANKX (ALL ( Products ), CALCULATE ( SUM ( Sales[Sales] ) )
)
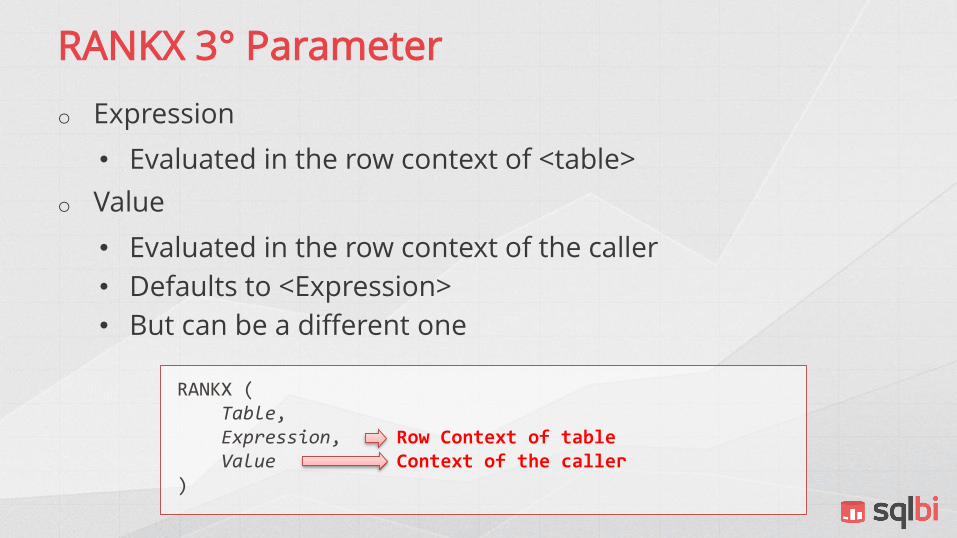
RANKX 3° Parameter
o Expression
• Evaluated in the row context of <table>
o Value
• Evaluated in the row context of the caller
• Defaults to <Expression>
• But can be a different one
RANKX ( Table,Expression, Row Context of tableValue Context of the caller
)

RANKX 3° Parameter Need
Sometimes the expression can be invalid in one of the contexts.
RankOnPrice:=IF (
HASONEVALUE ( Products[Product] ),RANKX (
ALLSELECTED ( Products ),Products[Price], VALUES ( Products[Price] )
))

Working with Iterators
Time to write some DAX code by yourself.
Next exercise session is focuses on some simple and not-so-simple DAX code. Choose the exercise that best fit your skills.
Please refer to lab number 4 on the hands-on manual.

Building a Date Table
Probably the most important table in your model

Date Table
o Time intelligence needs a date table
• Built in DAX
• Or in a SQL Table
o Date table properties
• All dates should be present
• From 1° of January, to 31° of December
• No holes
• Otherwise time intelligence will not work

Create a Date Table
o Stored in a SQL table inside the DWH
o Optional
• Create a holidays table
• Useful for working days calculations
o Set all the necessary attributes
• Do not create them in DAX
• SQL is the best place for all attributes
o Building a view is always the best option

2015CALENDAR
CALENDAR (DATE ( 2005, 1, 1 ), DATE ( 2015, 12, 31 )
)
CALENDAR (MIN ( Sales[Order Date] ),MAX ( Sales[Order Date] )
)
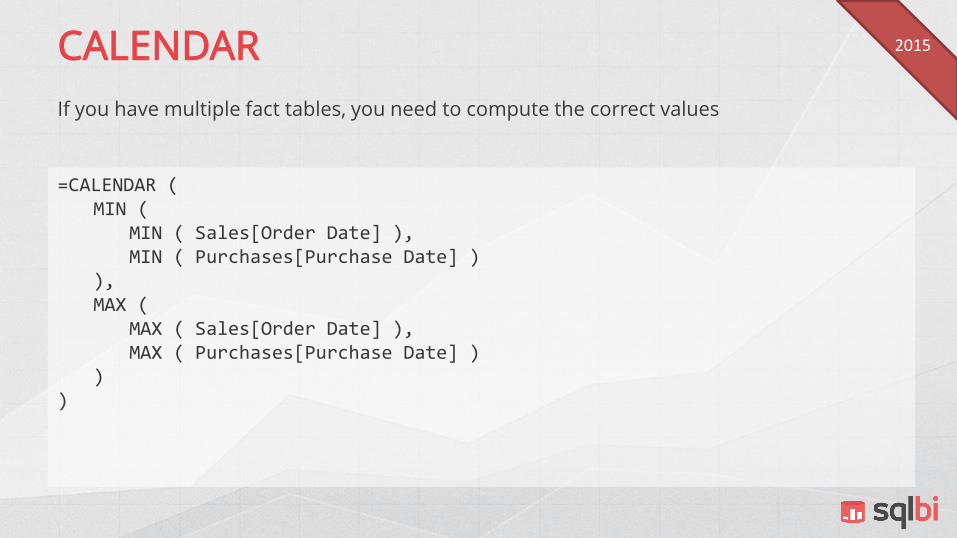
CALENDAR
If you have multiple fact tables, you need to compute the correct values
=CALENDAR (MIN (
MIN ( Sales[Order Date] ),MIN ( Purchases[Purchase Date] )
),MAX (
MAX ( Sales[Order Date] ),MAX ( Purchases[Purchase Date] )
))
2015

CALENDARAUTO
---- The parameter is the starting month-- of the fiscal year--= CALENDARAUTO (
7) Beware: CALENDARAUTO uses
all the dates in your model, excluding only calculated
columns and tables
2015

Mark as Date Table
o Need to mark the calendar as date table
o Set the column containing the date
o Needed to make time intelligence works
o Used by client tools as metadata information
• Power View
• Q&A
• Excel
o Multiple tables can be marked as date table

Set Sorting Options
o Month names do not sort alphabetically
• April is not the first month of the year
o Use Sort By Column
o Set all sorting options in the proper way
o Beware of sorting granularity
• 1:1 between names and sort keys

Multiple Dates
o Date is often a role dimension
• Many roles for a date
• Many date tables
o How many date tables?
• Try to use only one table
• Use many, only if needed by the model
• Many date tables lead to confusion
• And issues when slicing
o Use proper naming convention

Time Intelligence in DAX
Time intelligence functions

What is Time Intelligence?
o Many different topics in one name
• Year To Date
• Quarter To Date
• Running Total
• Same period previous year
• Working days computation
• Fiscal Year
o In short: anything related with time
• Handled in an intelligent way
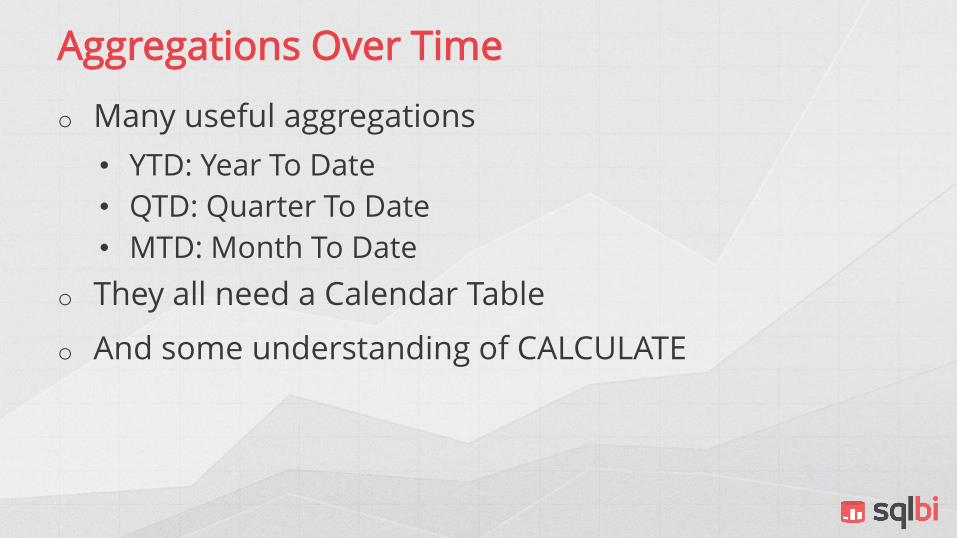
Aggregations Over Time
o Many useful aggregations
• YTD: Year To Date
• QTD: Quarter To Date
• MTD: Month To Date
o They all need a Calendar Table
o And some understanding of CALCULATE

Sales 2015 up to 05-15 (v1)
Using CALCULATE you can filter the dates of the period to summarize
SalesAmount20150515 :=
CALCULATE (SUM ( Sales[SalesAmount] ),FILTER (
ALL ( 'Date'[Date] ),AND (
'Date'[Date] >= DATE ( 2015, 1, 1 ),'Date'[Date] <= DATE ( 2015, 5, 15 )
))
)
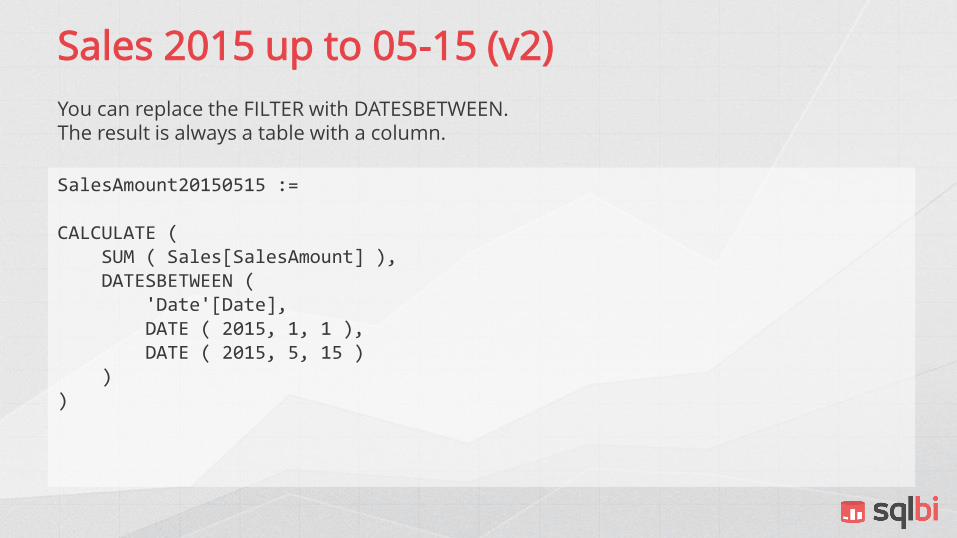
Sales 2015 up to 05-15 (v2)
You can replace the FILTER with DATESBETWEEN.The result is always a table with a column.
SalesAmount20150515 :=
CALCULATE (SUM ( Sales[SalesAmount] ),DATESBETWEEN (
'Date'[Date],DATE ( 2015, 1, 1 ),DATE ( 2015, 5, 15 )
))

Sales Year-To-Date (v1)
Replace the static dates using DAX expressions that retrieve the last day in the current filter
SalesAmountYTD :=
CALCULATE (SUM ( Sales[SalesAmount] ),DATESBETWEEN (
'Date'[Date],DATE ( YEAR ( MAX ( 'Date'[Date] ), 1, 1 ),MAX ( 'Date'[Date] )
))

Year To Date (Time Intelligence)
DATESYTD makes filtering much easier
SalesAmountYTD :=
CALCULATE (SUM ( Sales[SalesAmount] ),DATESYTD ( 'Date'[Date] )
)

Year To Date: the easy way
TOTALYTD: the “DAX for dummies” version
SalesAmountYTD :=
TOTALYTD (SUM ( Sales[SalesAmount] ),'Date'[Date]
)

Use the Correct Parameter
LineTotalYTD :=
TOTALYTD (SUM ( Sales[SalesAmount] ),Sales[OrderDate]
)

Handling Fiscal Year
The last, optional, parameter is the end of the fiscal yearDefault: 12-31 (or 31/12 - locale dependent)
SalesAmountYTD :=TOTALYTD (
SUM ( Sales[SalesAmount] ),'Date'[Date],"06-30"
)
SalesAmountYTD :=CALCULATE (
SUM ( Sales[SalesAmount] ),DATESYTD ( 'Date'[Date], "06-30" )
)

Same Period Last Year
Same period in previous year. CALCULATE is needed
Specialized version of DATEADD
Sales_SPLY :=
CALCULATE (SUM ( Sales[SalesAmount] ),SAMEPERIODLASTYEAR ( 'Date'[Date] )
)

Mixing Time Intelligence Functions
YTD on the previous year. In DAX, it is very simple, just mix the functions to obtain the result
Sales_YTDLY :=
CALCULATE (SUM ( Sales[SalesAmount] ),DATESYTD (
SAMEPERIODLASTYEAR ( 'Date'[Date] ))
)

DATEADD
Similar as SAMEPERIODLASTYEAR, used to calculate different periods: YEAR, MONTH, DAY …
Does not sum dates, it shifts periods over time
Sales_SPLY :=
CALCULATE (SUM( Sales[SalesAmount] ),DATEADD ( 'Date'[Date] , -1, YEAR )
)

PARALLELPERIOD
Returns a set of dates (a table) shifted in time
The whole period is returned, regardless dates in the first parameter
Sales_PPLY :=
CALCULATE (SUM ( Sales[SalesAmount] ),PARALLELPERIOD ( 'Date'[Date] , -1, YEAR )
)

Running Total
Running total requires an explicit filter
SalesAmountRT :=
CALCULATE (SUM ( Sales[SalesAmount] ),FILTER (
ALL ( 'Date' ),'Date'[Date] <= MAX ( 'Date'[Date] )
))

Moving Annual Total (v1)
Moving window from the current date back one year
CALCULATE (SUM ( Sales[SalesAmount] ),DATESBETWEEN (
'Date'[Date],NEXTDAY (
SAMEPERIODLASTYEAR (LASTDATE ( 'Date'[Date] )
)),LASTDATE ( 'Date'[Date] )
))

Beware of function order!
Time intelligence functions return sets of dates, and the set of dates need to exist.
CALCULATE (SUM ( Sales[SalesAmount] ),DATESBETWEEN (
'Date'[Date],SAMEPERIODLASTYEAR (
NEXTDAY (LASTDATE ( 'Date'[Date] )
)),LASTDATE ( 'Date'[Date] )
))

Moving Annual Total (v2)
DATESINPERIOD makes everything much easier.
CALCULATE (SUM ( Sales[SalesAmount] ),DATESINPERIOD (
'Date'[Date],LASTDATE ( 'Date'[Date] ),-1,YEAR
))

Semi Additive Measures
o Additive Measure
• SUM over all dimensions
o Semi Additive Measure
• SUM over some dimensions
• Different function over other dimensions
• Time is the standard exception for aggregations
• Examples
• Warehouse stocking
• Current account balance

Current Account Balance
o Month level correct
o Quarter level wrong
o Year level wrong

Semi additive measures
o Aggregation depends on the filter
• LastChild over time
• SUM for the other dimensions

SemiAdditive Measures
CALCULATE: to set the filterLASTDATE: to find the last child
LastBalance :=
CALCULATE (SUM ( Balances[Balance] ), LASTDATE ( Date[Date] )
)

Last Non Blank
Searches in the fact table for the last non empty date.Remember: LASTNONBLANK is an iterator
LastBalanceNonBlank :=
CALCULATE (SUM ( Balances[Balance] ), LASTNONBLANK (
Date[Date], CALCULATE ( COUNTROWS ( Balances ) )
) )

Opening and Closing Balance
ClosingBalanceMonth = CLOSINGBALANCEMONTH ( SUM ( Balances[Balance] ), BalanceDate[Date] )
ClosingBalanceQuarter = CLOSINGBALANCEQUARTER ( SUM ( Balances[Balance] ), BalanceDate[Date] )
ClosingBalanceYear = CLOSINGBALANCEYEAR ( SUM ( Balances[Balance] ), BalanceDate[Date] )

Opening and Closing Balance
DAX Function Equivalent date filter in CALCULATE
OPENINGBALANCEMONTH STARTOFMONTH
OPENINGBALANCEQUARTER STARTOFQUARTER
OPENINGBALANCEYEAR STARTOFYEAR
CLOSINGBALANCEMONTH ENDOFMONTH
CLOSINGBALANCEQUARTER ENDOFQUARTER
CLOSINGBALANCEYEAR ENDOFYEAR

Calculations Over Weeks
There are many week scenarios, depending on what you mean by «week»… CALCULATE is your best friend here

Custom Calendars
o Time Intelligence functions
• One day belong to the same quarter every day
• Not true if you use week calculations
o 4-4-5, 4-5-4, 5-4-4 ?????
• One quarter is made of three months
• Two of 4 weeks
• One of 5 weeks
• Difference only in position of the 5 weeks month
o No support in DAX for these calendars

Create Week Numbers
o Usually stored in the database
o If not, use Excel to compute them
o Or, as a better solution, use Power Query
• M code is included in the attendee’s pack!
• Just copy and paste in Power Query

Week Calculations
o Fine, so how to work with weeks?
o Easier to look at a demo

Time Intelligence: Conclusions
o Based on evaluation contexts
• Replace filter on date
• Many predefined functions
• You can author your own functions
o Basic Time Intelligence
o Semi Additive Measures
o Working with ISO weeks

Time Intelligence
Next exercise session if focused on some common scenarios where time intelligence is required, along with some evaluation context skills.
Please refer to lab number 5 on the exercise book.
Querying with DAX
Querying with DAX, and a lot of new table functions

Tools to Query Tabular
o SQL Server Management Studio
• Inside MDX Query
• Metadata pane shows Multidimensional model
• Intellisense does not work
o Excel, Power View, Power BI Designer
• Remember: Excel uses MDX

DAX Studio
o http://daxstudio.codeplex.com
• Free add-in for Excel
• Standalone executable for Tabular and Power BI
o It can query
• Tabular
• Power Pivot data models
• Power BI Designer data models
• Both DAX and MDX queries

EVALUATE Syntax
EVALUATE is the statement to use to write DAX queries
DEFINE
MEASURE <table>[<col>] = <expression>
EVALUATE <Table Expression>
ORDER BY <expression> [ASC | DESC], …
START AT <value>, …

EVALUATE Example
EVALUATEStore
ORDER BYStore[Continent],Store[Country],Store[City]
START AT "North America"
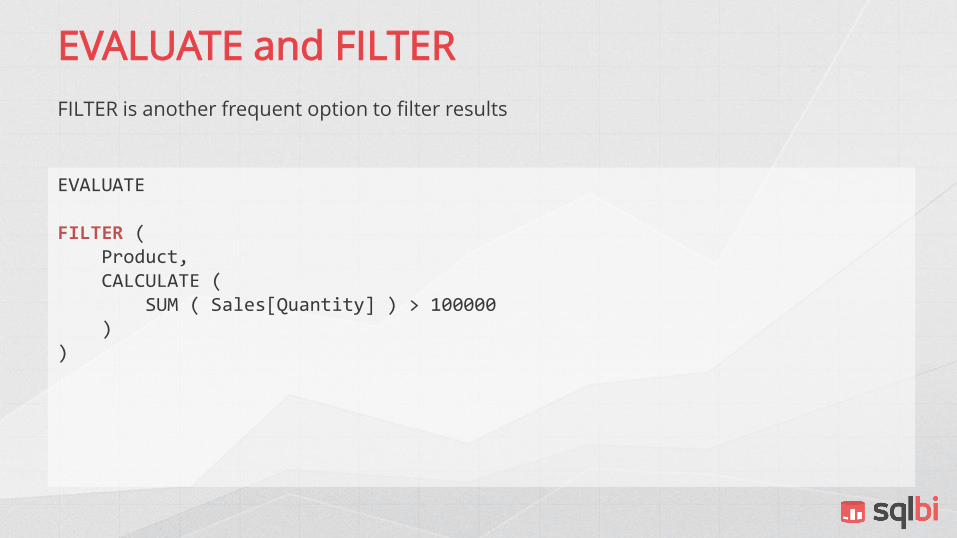
EVALUATE and FILTER
FILTER is another frequent option to filter results
EVALUATE
FILTER (Product,CALCULATE (
SUM ( Sales[Quantity] ) > 100000)
)

CALCULATETABLE
CALCULATETABLE is often used to apply filters to the query
EVALUATE
CALCULATETABLE (Product,Product[Color] = "Red"
)

Evaluation Order of CALCULATE
CALCULATE and CALCULATETABLE evaluate the first parameter only after the latter ones have been computed
EVALUATE
CALCULATETABLE (CALCULATETABLE (
Product,ALL ( Product[Color] )
),Product[Color] = "Red"
)1
23
The result is ALL Product[Color]
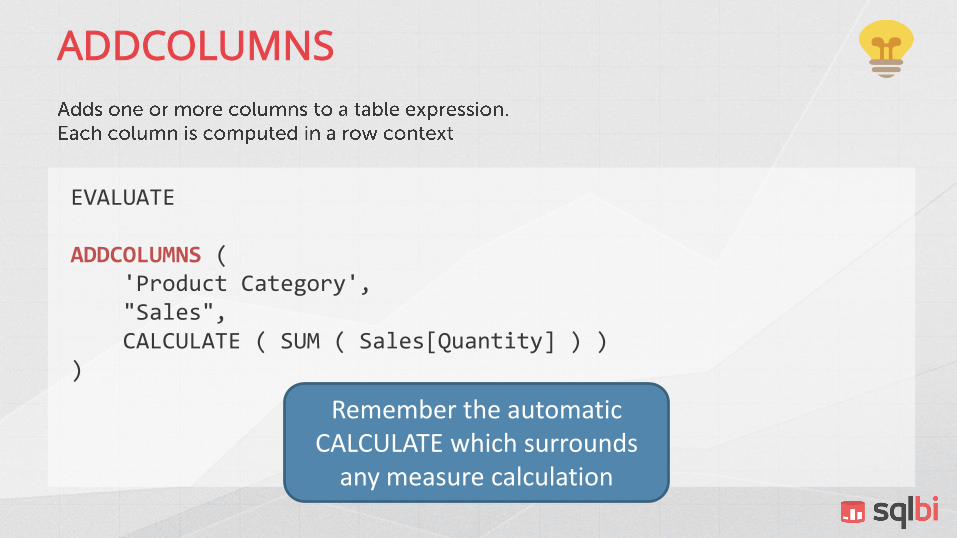
ADDCOLUMNS
EVALUATE
ADDCOLUMNS ('Product Category',"Sales",CALCULATE ( SUM ( Sales[Quantity] ) )
)
Remember the automatic CALCULATE which surrounds
any measure calculation

SUMMARIZE
EVALUATE
SUMMARIZE (Sales,'Product Category'[Category],"Sales", SUM ( Sales[Quantity] )
)
Source Table
GROUP BY Column(s)
Result Expression(s) added to the source table
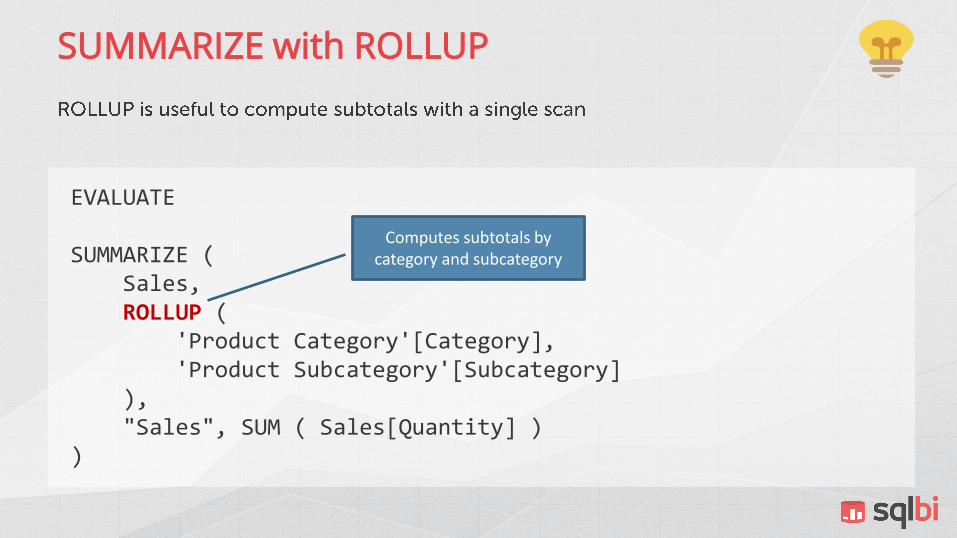
SUMMARIZE with ROLLUP
EVALUATE
SUMMARIZE (Sales,ROLLUP (
'Product Category'[Category],'Product Subcategory'[Subcategory]
),"Sales", SUM ( Sales[Quantity] )
)
Computes subtotals by category and subcategory
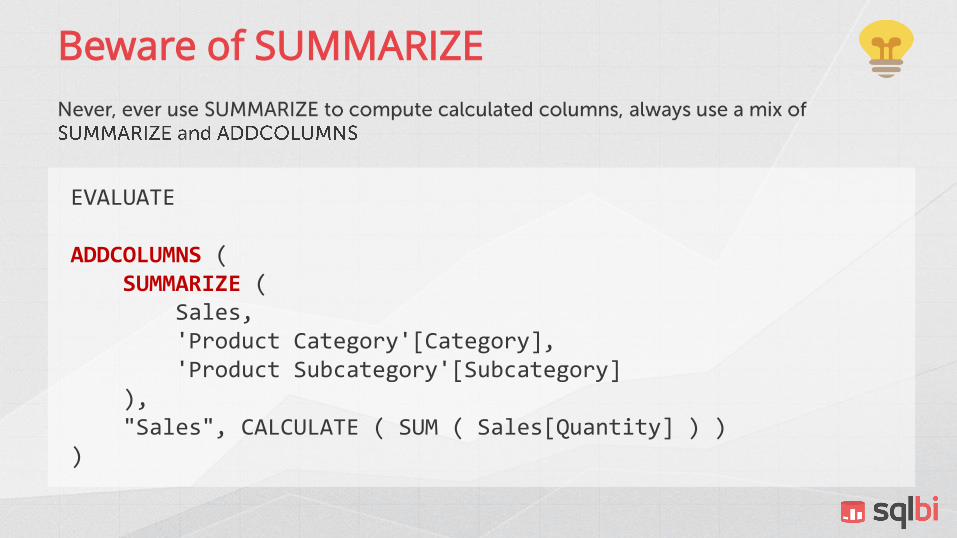
Beware of SUMMARIZE
EVALUATE
ADDCOLUMNS (SUMMARIZE (
Sales,'Product Category'[Category],'Product Subcategory'[Subcategory]
),"Sales", CALCULATE ( SUM ( Sales[Quantity] ) )
)

SELECTCOLUMNS
EVALUATE
SELECTCOLUMNS (Product,"Color", Product[Color],"ProductKey", Product[ProductKey]
)
2015

Using CROSSJOIN
EVALUATE
ADDCOLUMNS (CROSSJOIN (
DISTINCT ( 'Product'[Color] ),DISTINCT ( 'Product'[Size] )
),"Products",COUNTROWS ( RELATEDTABLE ( Product ) )
)

Using GENERATE
EVALUATE
GENERATE (VALUES ( 'Product Category'[Category] ),SELECTCOLUMNS (
RELATEDTABLE ( 'Product Subcategory' ),"Subcategory", 'Product Subcategory'[Subcategory]
))ORDER BY [Category], [Subcategory]

Tables and Relationships
EVALUATEADDCOLUMNS (
CROSSJOIN (VALUES ( 'Date'[Calendar Year] ),VALUES ( Product[Color] )
),"Sales Amount",CALCULATE (
SUM ( Sales[Quantity] ))
)
Which sales?
Sales of the given year and color

Columns and Expressions
EVALUATEADDCOLUMNS (
SELECTCOLUMNS (FILTER (
Product,Product[Color] = "Red"
),"ProductKey", Product[ProductKey]
),"Sales", CALCULATE ( SUM ( Sales[Quantity] ) )
)
+ 0
Becoming an expression, ProductKey no longer has
relationships

Using ROW
EVALUATE
ROW ("Jan Sales", CALCULATE (
SUM ( Sales[Quantity] ),'Date'[Month] = "January"
),"Feb Sales", CALCULATE (
SUM ( Sales[Quantity] ),'Date'[Month] = "February"
))

Using DATATABLE
Creates a full table with a single function call, useful to build temporary tables
EVALUATEDATATABLE (
"Price Range", STRING,"Min Price", CURRENCY,"Max Price", CURRENCY,{
{ "Low", 0, 10 },{ "Medium", 10, 100 },{ "High", 100, 9999999 }
})

Using CONTAINS
Check for the existence of a row in a table
EVALUATE
FILTER (Product,CONTAINS (
RELATEDTABLE ( Sales ),Sales[Unit Price], 56
))

Using LOOKUPVALUE
Lookups a value in a table, can be done with CALCULATE (VALUES()) but reads much better. Often used in calculated columns to perform lookups
EVALUATE
ROW ( "Country", LOOKUPVALUE (
Geography[Country Region Name], Geography[Country Region Code], "CA"
) )

Using TOPN
EVALUATE
CALCULATETABLE (TOPN (
10,SUMMARIZE (
Sales,Product[Product Name],"Sales", SUM ( Sales[Quantity] )
),[Sales]
),Product[Color] = "Red"
)

TOPN and GENERATE
EVALUATE
GENERATE (VALUES ( 'Product Category'[Category] ),CALCULATETABLE (
TOPN (3,SUMMARIZE (
Sales,Product[Product Name],"Sales", SUM ( Sales[Quantity] )
),[Sales]
))
)

UNION
EVALUATE
UNION (SUMMARIZE (
CALCULATETABLE ( Sales,'Date'[Calendar Year] = "CY 2008"
),Product[ProductKey]
),SELECTCOLUMNS (
FILTER ( Product,Product[Color] = "Red"
),"ProductKey", Product[ProductKey]
))ORDER BY Product[ProductKey]
2015

Columns in UNION
EVALUATE
UNION (ROW ( "DAX", 1 ),ROW ( "is a", 1 ),ROW ( "Language", 2 )
)
2015

INTERSECT
EVALUATE
INTERSECT (VALUES ( Product[ProductKey] ),SUMMARIZE (
FILTER ( Product,Product[Color] = "Red" ),
Product[ProductKey])
)
2015

UNION and INTERSECT
INTERSECT gets column names and lineage from the first table, whereas UNION only keep lineage if all the tables have the same one.
EVALUATEINTERSECT (
SUMMARIZE (FILTER (
Product,Product[Color] = "Red"
),Product[ProductKey]
),SELECTCOLUMNS (
VALUES ( Product[ProductKey] ),"Test", Product[ProductKey] + 1
))
2015

EXCEPT
Computes the difference between two sets
EVALUATEEXCEPT (
SELECTCOLUMNS (VALUES ( Product[ProductKey] ),"Test", Product[ProductKey]
),SUMMARIZE (
FILTER ( Product,Product[Color] = "Red"
),Product[ProductKey]
))
2015

SUMMARIZECOLUMNS
EVALUATE
SUMMARIZECOLUMNS ('Date'[Calendar Year],Product[Color],"Sales",SUM ( Sales[Quantity] )
)
EVALUATEFILTER (
SUMMARIZE (CROSSJOIN (
VALUES ( 'Date'[Calendar Year] ),VALUES ( Product[Color] )
),'Date'[Calendar Year],Product[Color],"Sales", SUM ( Sales[Quantity] )
),NOT ( ISBLANK ( [Sales] ) )
)
2015

SUMMARIZECOLUMNS
o Simpler syntax
o Empty rows are automatically removed
o Multiple fact tables scanned at once
o Cannot be used in CALCULATE/CALCULATETABLE
o Few additional features
• IGNORE
• ROLLUPGROUP
• ROLLUPADDISSUBTOTAL
2015

SUMMARIZECOLUMNS
SUMMARIZECOLUMNS (Customer[Company Name],ROLLUPADDISSUBTOTAL (
ROLLUPGROUP ( Customer[City] ),"CityTotal"
),FILTER (
Customer,Customer[Country] = "France"
),"Sales", SUM ( Sales[Quantity] )
)
2015

GROUPBY
EVALUATEGROUPBY (
Sales,'Date'[Calendar Year],Product[Color],"Sales",SUMX (
CURRENTGROUP (),Sales[Quantity] * Sales[Unit Price]
))
2015

GROUPBY
EVALUATEFILTER (
SUMMARIZE (CROSSJOIN (
VALUES ( 'Date'[Calendar Year] ),VALUES ( Product[Color] )
),'Date'[Calendar Year],Product[Color],"Sales",SUMX (
CALCULATETABLE ( Sales ),Sales[Quantity] * Sales[Unit Price]
)),NOT ( ISBLANK ( [Sales] ) )
)
2015

Query Measures
DEFINEMEASURE Sales[Subcategories] =
COUNTROWS ( RELATEDTABLE ( 'Product Subcategory' ) )MEASURE Sales[Products] =
COUNTROWS ( RELATEDTABLE ( 'Product' ) )
EVALUATE
ADDCOLUMNS ('Product Category',"SubCategories", [Subcategories],"Products Count", [Products]
)

Query Measures are Fast
o Multidimensional
• Calculated members in query may be slow
• Mainly for cache usage limitations
o Tabular
• Query Measures identical to model measures
• No loss in performance
o Very useful feature when developing
• Test for performance
• Quick look at values returned

Parameters in Queries
EVALUATE
CALCULATETABLE('Product Subcategory',[Product Category Name] = @Category
)

Querying with MDX
o Tabular understands MDX
o Any MDX client tool can query Tabular
Tabular Multidimensional
TableDimension, plus a measure group for each Tabular table containing at least one measure
Column Attribute
Sort By Column Attribute OrderBy
MeasureMeasure, plus a measure group for each Tabular table containing at least one measure
Table Relationship Dimension Relationship
KPI KPI
Hierarchy User Hierarchy

Missing Features in Tabular
o Attribute Key / Value / Name
• No difference in Tabular
o Attribute Relationships
• Missing in Tabular
• All attributes are independent
• Natural hierarchies are automatically detected in Tabular, in order to optimize MDX Formula Engine
o MDX Script
• Not supported in Tabular

MDX for Hierarchies
MDX makes it simple to navigate hierarchies, whereas DAX does not have corresponding features, complex DAX code will be needed
SELECT [Measures].[Internet Total Sales] ON COLUMNS,NON EMPTY DESCENDANTS (
[Date].[Calendar].[All], [Date].[Calendar].[Semester], SELF_AND_BEFORE
) ON ROWSFROM [Model]

MDX is Usually a bit Slower
o Single MDX Many DAX queries
o Many VertiPaq Scans
o Translation layer
• An MDX query is not converted in DAX
• An MDX query generates DAX query plans
• Not a single corresponding DAX query

Differences in Caching
o xVelocity in-memory Cache
• Caches results from VertiPaq scans
• MDX, DAX
o Formula Cache
• Caches values of measures
• MDX Only
o MDX
• Better cache options
• Worse query plans

DAX Measures in MDX
An interesting option is the ability to define DAX measures inside an MDX query
WITH
MEASURE 'Internet Sales'[Ship Sales Amount] =CALCULATE(
'Internet Sales'[Internet Total Sales],USERELATIONSHIP( 'Internet Sales'[Ship Date Id], 'Date'[Date Id] )
)
MEMBER Measures.[Ship Sales 2003]AS ([Measures].[Ship Sales Amount], [Date].[Calendar Year].&[2003] )
SELECT{ Measures.[Ship Sales 2003] } ON COLUMNS,NON EMPTY
[Product Category].[Product Category Name].[Product Category Name] ON ROWS
FROM [Model]

Querying: Conclusions
o DAX as a query language
• Is very powerful
• Pretty simple to author
• Reminds
• SQL
• MDX
• But it is different from both
o Some functions are used more in queries than in code
• SUMMARIZE, ADDCOLUMNS…

Querying in DAX
Querying is not very complex, but requires a good DAX mood.
Next set of exercises is all about authoring some DAX queries, from simple to more complex ones.
Please refer to lab number 6 on the exercise book.

Advanced Filter Context
Let us go deeper in the analysis of filter contexts

Filter Propagation
o Filter is on Products
o SubCategories is not filtered
o The result is 44

Filters are tables
Each filter is a table. Boolean expressions are shortcuts for more complex table expressions
CALCULATE (SUM ( Sales[SalesAmount] ), Sales[SalesAmount] > 100
)
Is equivalent to
CALCULATE (SUM ( Sales[SalesAmount] ), FILTER (
ALL ( Sales[SalesAmount] ),Sales[SalesAmount] > 100
))
What happens, if we use a full table in a
CALCULATE expression?

Strange results!
What is happening here?
Cross table filtering is in action, and… well, it’s not easy.

Key Topics
The key to really understand filter context is to understand
o Base Tables
o Expanded Tables
o What Filters in the context are
o Filter Operators
o Block semantic of ALL

Base Tables
Label Product Name SubCat
0101001 512MB MP3 Player E51 Silver 1
0101002 512MB MP3 Player E51 Blue 1
0101003 1G MP3 Player E100 White 2
0101004 2G MP3 Player E200 Silver 4
0101005 2G MP3 Player E200 Red 2
0101006 2G MP3 Player E200 Black 3
0101007 2G MP3 Player E200 Blue 3
SubCategory Name
1 MP4&MP3
2 Recorder
3 Radio
4 Recording Pen
5 Headphones
6 Bluetooth Headphones
Left Outer Join
Remember: the relationship might be bi-directional

Expanded Tables
Label Product Name SubCat
0101001 512MB MP3 Player E51 Silver 1
0101002 512MB MP3 Player E51 Blue 1
0101003 1G MP3 Player E100 White 2
0101004 2G MP3 Player E200 Silver 4
0101005 2G MP3 Player E200 Red 2
0101006 2G MP3 Player E200 Black 3
0101007 2G MP3 Player E200 Blue 3
Each base table is «expanded» with the columns of related tables following a LEFT OUTER JOIN, as indicated by the existing relationship
SubCategory Name
1 MP4&MP3
1 MP4&MP3
2 Recorder
4 Recording Pen
2 Recorder
3 Radio
3 Radio

Expanded Tables
o Each Table
• Contains all of its columns
• «Native Columns»
• Plus all of the columns in all related tables
• «Related Columns»
o This does not happen physically, but greatly helps in understanding how filters work
o Hint: RELATED does not follow relationships: it simply grants you access to the related columns

Sample Model

Table Expansion

Context Propagation
Thinking at expanded tables, filter context propagation becomes extremely simple to understand
CALCULATE ( SUM ( Sales[Quantity] ), Product[Color] = "Red" )
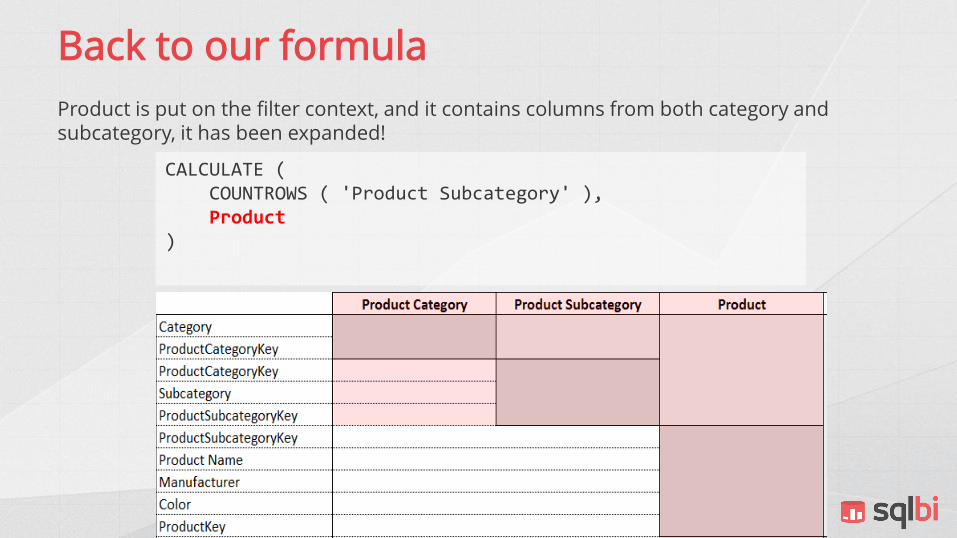
Back to our formula
Product is put on the filter context, and it contains columns from both category and subcategory, it has been expanded!
CALCULATE (COUNTROWS ( 'Product Subcategory' ),Product
)

Calculate Expanded Tables
Tables used by CALCULATE are always expanded when used in the filter context.Counts the categories of the selection

What is happening here?
Here we have a filter on Products but the result is 44, why is it that if Products contains columns from SubCategory?

Filter is on columns, not tables

Filtering Columns
Filtering a column of DimProduct, which is not in common with other tables, does not affect other tables.
Filtering a table is very different from filtering a column!

Compute a simple percentage
Filter on Category
Percentage of subcategory against the total of category

The first trial is wrong…
DIVIDE (SUM ( Sales[SalesAmount] ),CALCULATE (
SUM ( Sales[SalesAmount] ),ALL ( ProductSubcategory )
))

Wrong formula in actionDIVIDE (
SUM ( Sales[SalesAmount] ),CALCULATE (
SUM ( Sales[SalesAmount] ),ALL ( ProductSubcategory )
))
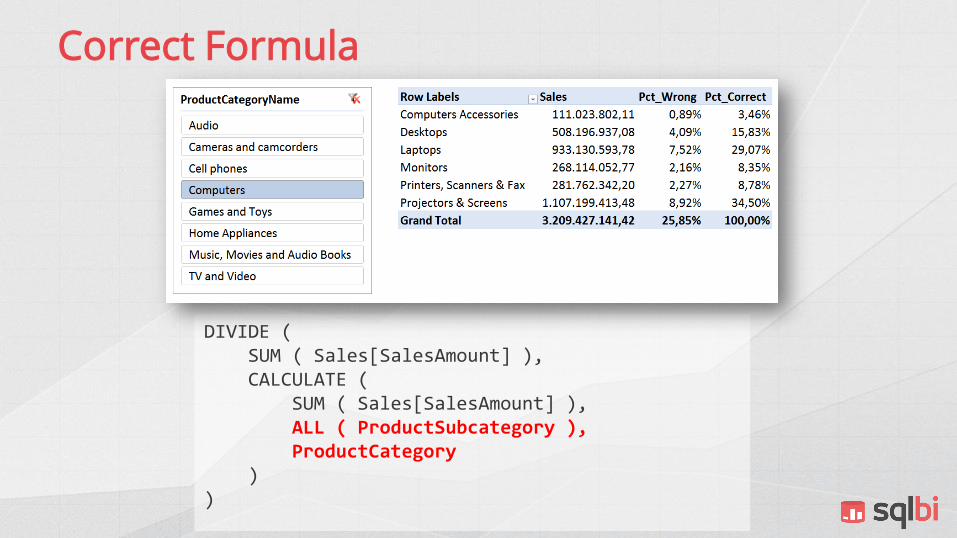
Correct Formula
DIVIDE (SUM ( Sales[SalesAmount] ),CALCULATE (
SUM ( Sales[SalesAmount] ),ALL ( ProductSubcategory ),ProductCategory
))

Correct formula in actionDIVIDE (
SUM ( Sales[SalesAmount] ),CALCULATE (
SUM ( Sales[SalesAmount] ),ALL ( ProductSubcategory ),ProductCategory
))

Filter Context first recap
o Column Filter
• Works on the base table
• Does not refer to related columns
o Table Filter
• Works on the expanded table
• Always includes related columns
o Table interactions
• When the same column (native or related) is referred by different contexts, last filter wins

What is a filter context?CALCULATE (
…OR ( Product[Color] = "Red", Product[Color] = "Black" ) ),FILTER (
CROSSJOIN (ALL ( Date[Year] ),ALL ( Date[Month] )
),OR (
AND ( Date[Year] = 2006, Date[Month] = "December" ),AND ( Date[Year] = 2007, Date[Month] = "January" )
))
)
Year Month
2006 December
2007 January
Color
Red
Black

Filter Context Definition
Tuple: value for a set of columns
Year Month
2006 December
2007 January
Color
Red
Black

Filter Context Operators
o INTERSECT
• Performs intersection
o OVERWRITE
• Overwrites a filter with a new one
o REMOVE
• Removes a filter from an existing one
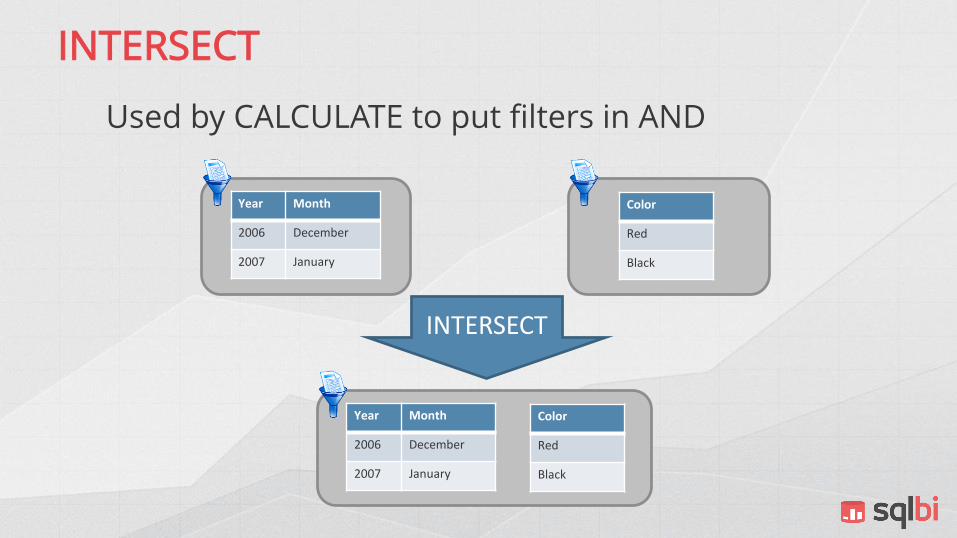
INTERSECT
Used by CALCULATE to put filters in AND
Year Month
2006 December
2007 January
Color
Red
Black
Year Month
2006 December
2007 January
Color
Red
Black
INTERSECT

INTERSECT
Intersection is used by CALCULATE, easy to understand because it has an intuitive behavior
CALCULATE (…FILTER (
CROSSJOIN (ALL ( Date[Year] ),ALL ( Date[Month] )
),OR (
AND ( Date[Year] = 2007, Date[Month] = "January" ),AND ( Date[Year] = 2006, Date[Month] = "December" )
)),FILTER (
ALL ( Date[Date] ),CALCULATE ( SUM (Sales[Quantity] ) ) > 100)
))

OVERWRITE
Nested CALCULATE do not use INTERSECT, they use another operator, called OVERWRITE.
In fact, the Yellow filter wins against the Black one, being the innermost.
Yellow overwrites Black.
CALCULATE (CALCULATE (
…,Product[Color] = "Yellow"
),Product[Color] = "Black"
)

OVERWRITE
Used by CALCULATE to merge the new filter context with the previous one
Color
Black
OVERWRITE
Color
Yellow
Color
Yellow

REMOVE Operator
o Sorry… ALL has a wrong name
• ALL is a table function
• But, in a CALCULATE filter it is different
o Should be named REMOVEFILTER
• Removes the filters from all the columns contained in the table it returns
o Only when used in CALCULATE – otherwise, it is a table function
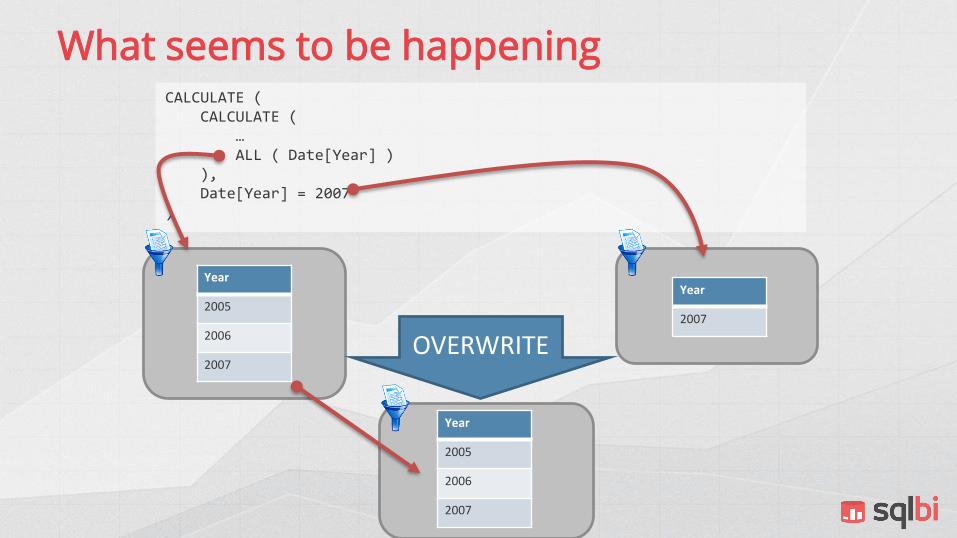
What seems to be happeningCALCULATE (
CALCULATE (…ALL ( Date[Year] )
),Date[Year] = 2007
)
Year
2007
OVERWRITE
Year
2005
2006
2007
Year
2005
2006
2007

What really happensCALCULATE (
CALCULATE (…ALL ( Date[Year] )
),Date[Year] = 2007
)
Year Year
2007
Empty Filter
REMOVE
Removes Year from the filter

Operators for Filter Context
o INTERSECT
• Puts the filters in AND
• «A intersect B» = «B intersect A»
o OVERWRITE
• Replaces filters in B
• «A overwrites B» ≠ «B overwrites A»
o REMOVE
• Special operator used by ALL
• Removes columns from the filter context

Operator Equivalence
o OVERWRITE (Color = Red) equivalent to
• REMOVE Color
• INTERSECT (Color = Red)
o Easier to think at three operators
o The important part is that ALL does not use INTERSECT, it uses REMOVE
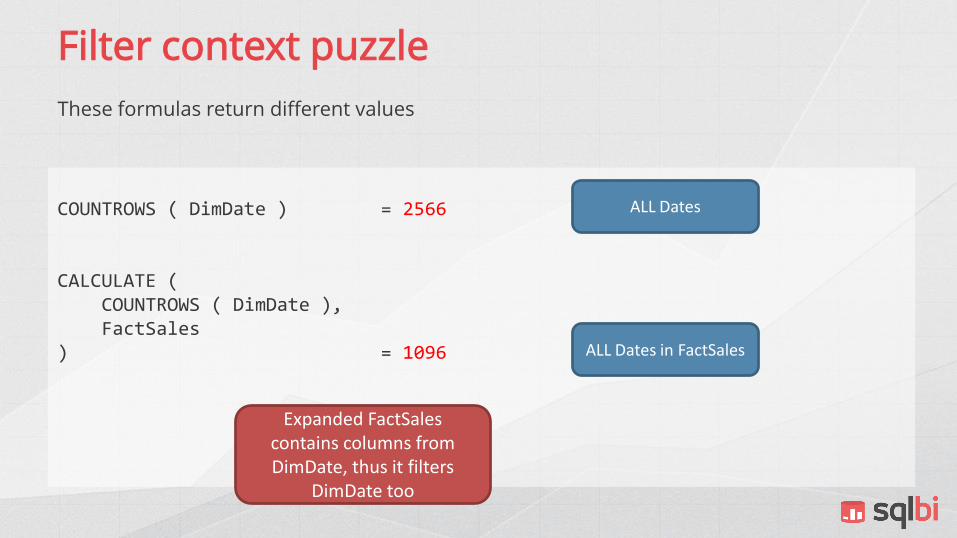
Filter context puzzle
These formulas return different values
COUNTROWS ( DimDate ) = 2566
CALCULATE (COUNTROWS ( DimDate ), FactSales
) = 1096
ALL Dates
ALL Dates in FactSales
Expanded FactSalescontains columns from DimDate, thus it filters
DimDate too

Filter context puzzle
But… why do these two return different values?
CALCULATE (COUNTROWS ( DimDate ), ALL ( FactSales )
) = 2566
CALCULATE (COUNTROWS ( DimDate ), FILTER ( ALL ( FactSales ), TRUE)
) = 1096

Filter context puzzle
ALL removes any filter from Sales
But… there is already no filter on Sales
In other words, ALL is useless here, it does nothing at all, Sales was not filtered, and it will not be filtered
CALCULATE (COUNTROWS ( DimDate ), ALL ( FactSales )
) = 2566

Filter context puzzle
This time, ALL is inside a FILTER expression
FILTER returns a table, which overwrites the filter context, resulting in columns of the expanded Sales being filtered
Expanded Sales contains Date
Thus, the result, this time, shows dates where there are sales
CALCULATE (COUNTROWS ( DimDate ), FILTER ( ALL ( FactSales ), TRUE )
) = 1096

KEEPFILTERS
A useful and complex feature to handle arbitrary shaped sets
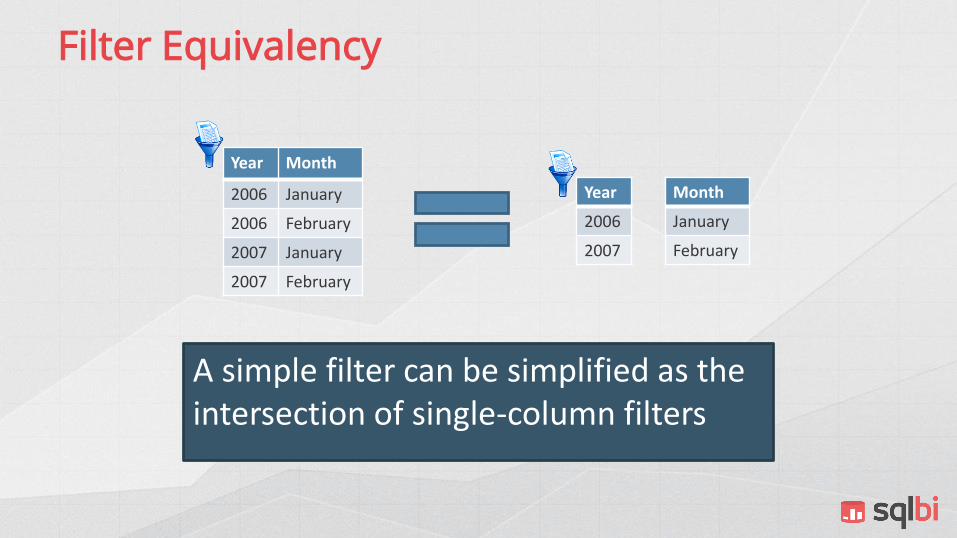
Filter Equivalency
A simple filter can be simplified as the intersection of single-column filters
Year Month
2006 January
2006 February
2007 January
2007 February
Year
2006
2007
Month
January
February

Arbitrarily Shaped SetsExample of a filter context built with complex features of the UI. Can be created by code too
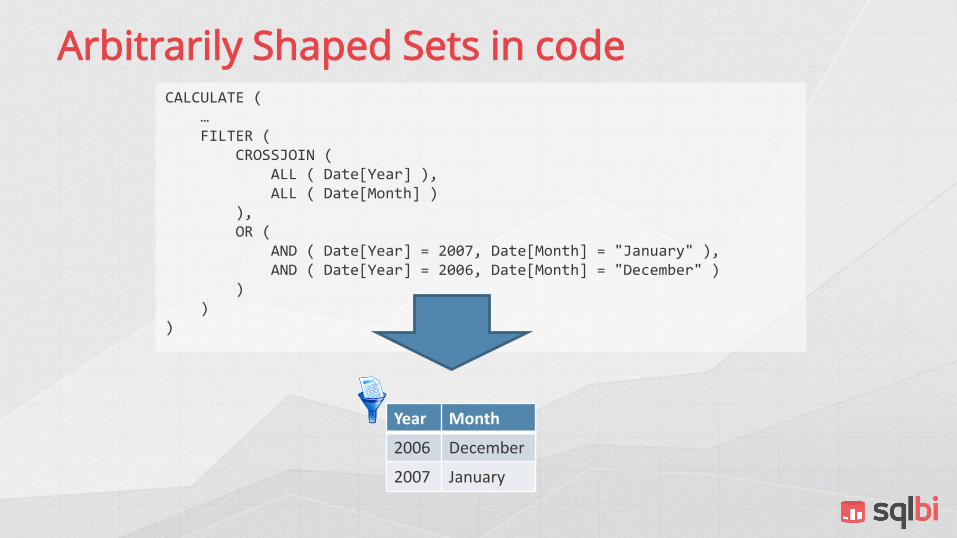
Arbitrarily Shaped Sets in codeCALCULATE (
…FILTER (
CROSSJOIN (ALL ( Date[Year] ),ALL ( Date[Month] )
),OR (
AND ( Date[Year] = 2007, Date[Month] = "January" ),AND ( Date[Year] = 2006, Date[Month] = "December" )
))
)
Year Month
2006 December
2007 January

o Cannot be simplified
o Stores the relationshipbetween the columns
o In the example, month depends from year:
• 2006 December
• 2007 January
o Need to understand how the filter operators handle arbitrarily shaped sets
Arbitrarily Shaped Set
Year Month
2006 December
2007 January

Average of monthly sales
Simple calculated field that computes the average of sales at the month granularity
MonthlyAverageSales :=
AVERAGEX (VALUES ( DimDate[EnglishMonthName] ),[Sum of SalesAmount]
)
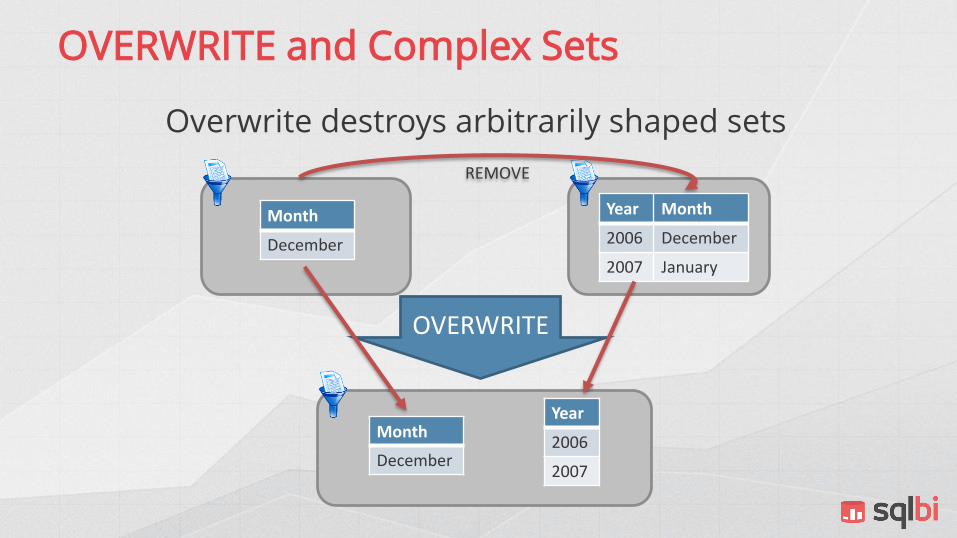
OVERWRITE and Complex Sets
Overwrite destroys arbitrarily shaped sets
Month
December
Year
2006
2007
Month
December
OVERWRITE
Year Month
2006 December
2007 January
REMOVE

OVERWRITE
o OVERWRITE
• Potentially destroys arbitrarily shaped sets
• If the column overwritten was part of a relationship
o Behavior very complex to predict
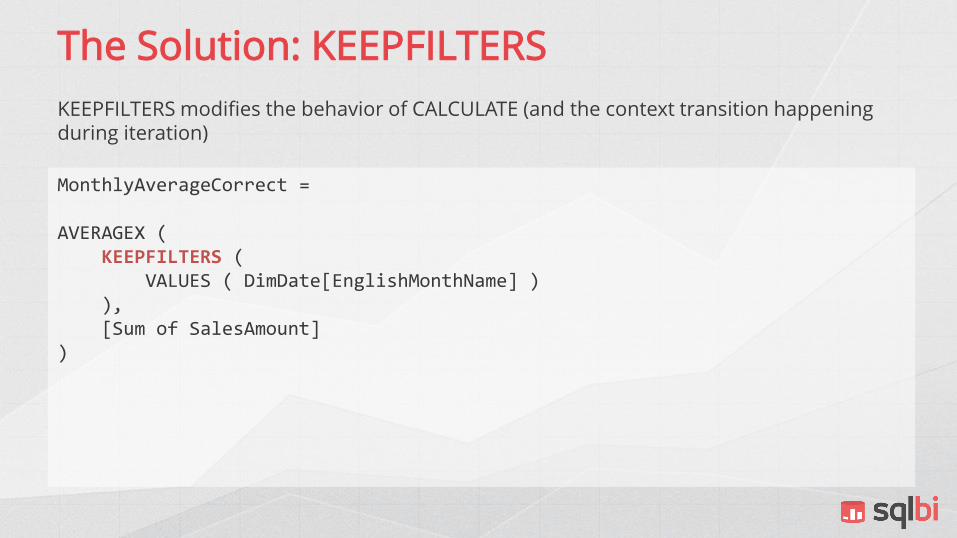
The Solution: KEEPFILTERS
KEEPFILTERS modifies the behavior of CALCULATE (and the context transition happening during iteration)
MonthlyAverageCorrect =
AVERAGEX (KEEPFILTERS (
VALUES ( DimDate[EnglishMonthName] )),[Sum of SalesAmount]
)

KEEPFILTERS
Instructs CALCULATE to use INTERSECT instead of OVERWRITE to merge the new filter context with the previous one
CALCULATE ( ....,KEEPFILTERS ( Color = "Red" )
)
SUMX (KEEPFILTERS ( Products ),...
)

KEEPFILTERS and Complex Sets
KEEPFILTERS preserves arbitrarily shaped sets
Month
December
Month
December
KEEPFILTERS
Year Month
2006 December
2007 January
Year Month
2006 December
2007 January

SUMMARIZE
SUMMARIZE creates both a row context and a filter context, this might lead to very complex behaviors, due to context transition
EVALUATE
SUMMARIZE (Product,Product[Unit Price],"Price doubled", Product[Unit Price] * 2
)
GROUP BY columns are used for a row context AND
for a filter context
The row context created by SUMMARIZE might be used by CALCULATE for context transition. Beware
of that, context transition might disrupt an arbitrarily shaped set because of OVERWRITE

Advanced Filter Context
o Tables are expanded
o Filtering a column filters all the tables containing that column
o Filter contexts are sets of lists of tuples
o Operators: INTERSECT, OVERWRITE, REMOVE
o ALL uses REMOVE if used at top-level in a filter
o KEEPFILTERS uses INTERSECT instead of OVERWRITE

ALLSELECTED
Looks like an innocent function… don’t be fooled!
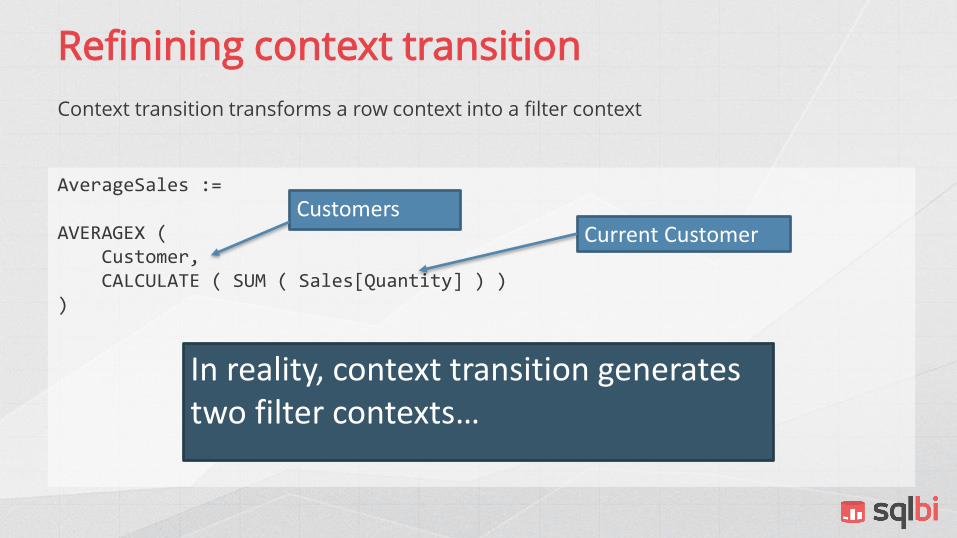
Refinining context transition
Context transition transforms a row context into a filter context
AverageSales :=
AVERAGEX ( Customer,CALCULATE ( SUM ( Sales[Quantity] ) )
)
In reality, context transition generates two filter contexts…
CustomersCurrent Customer

AverageSales :=
AVERAGEX ( Customer,CALCULATE ( SUM ( Sales[Quantity] ) )
)
Outer context
Customers
Refinining context transition
The innermost filter context is always more restrictive than the outer one. Thus, the outer is almost useless and you do not worry about it
Current Customer
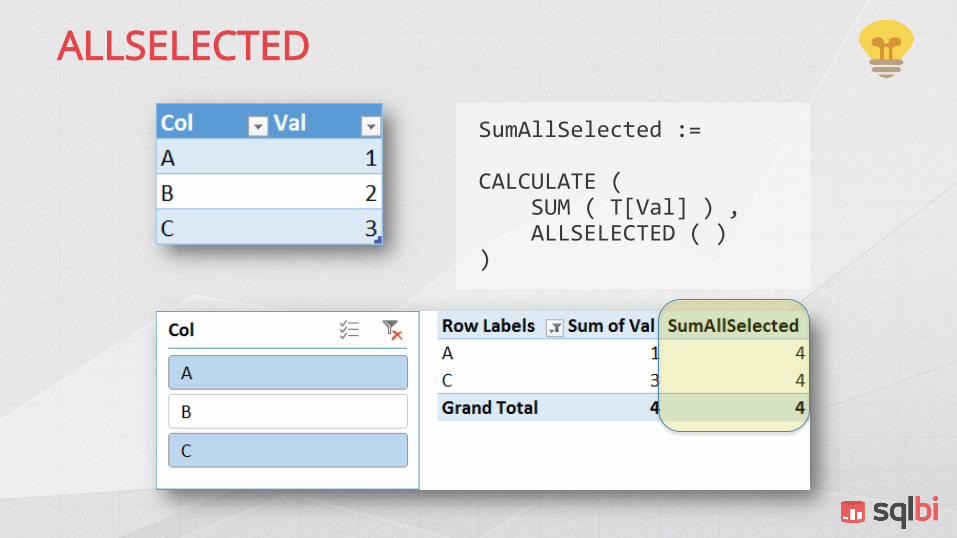
ALLSELECTED
SumAllSelected :=
CALCULATE ( SUM ( T[Val] ) , ALLSELECTED ( )
)

Wait… but…
o How does ALLSELECTED know about the pivot table?
• What if it is an MDX query?
• Or a DAX query?
o The answer is simple: ALLSELECTED has no clue about your pivot table
o ALLSELECTED removes the last filter context that was generated by context transition
o Fine…where is context transition in a pivot table?

Pivot table: inner rows
EVALUATECALCULATETABLE (
ADDCOLUMNS (VALUES ( Table[Col] ),"Sum of Val", [Sum of Val],"SumAllSelected", [SumAllSelected]
),OR ( Table[Col] = "A", Table[Col] = "C" )
)
CONTEXT TRANSITION

Inner rows: the contexts
EVALUATECALCULATETABLE (
ADDCOLUMNS (VALUES ( Table[Col] ),"Sum of Val", [Sum of Val],"SumAllSelected", [SumAllSelected]
),OR ( Table[Col] = "A", Table[Col] = "C" )
)1
2

Pivot table: grand total
EVALUATECALCULATETABLE (
ROW ("Grand Total Sum of Val", [Sum of Val],"Grand Total SumAllSelected", [SumAllSelected]
),OR ( Table[Col] = "A", Table[Col] = "C" )
)
No context transition

Grand total: the context
EVALUATECALCULATETABLE (
ROW ("Grand Total Sum of Val", [Sum of Val],"Grand Total SumAllSelected", [SumAllSelected]
),OR ( Table[Col] = "A", Table[Col] = "C" )
)1

SUMXALLSELECTED
SumxAllSelected:=
SUMX (Table,[SumAllSelected]
)

Pivot table: inner rows
EVALUATECALCULATETABLE (
ADDCOLUMNS (VALUES ( Table[Col] ),"SumxAllSelected", CALCULATE (
SUMX (Table,CALCULATE (
SUM ( Table[Val] ),ALLSELECTED ()
))
)),OR ( Table[Col] = "A", Table[Col] = "C" )
)1
2
3

Pivot table: grand total
EVALUATECALCULATETABLE (
ROW ("Grand Total SumxAllSelected", CALCULATE (
SUMX (Table,CALCULATE (
SUM ( Table[Val] ),ALLSELECTED ()
))
)),OR ( Table[Col] = "A", Table[Col] = "C" )
)1
2
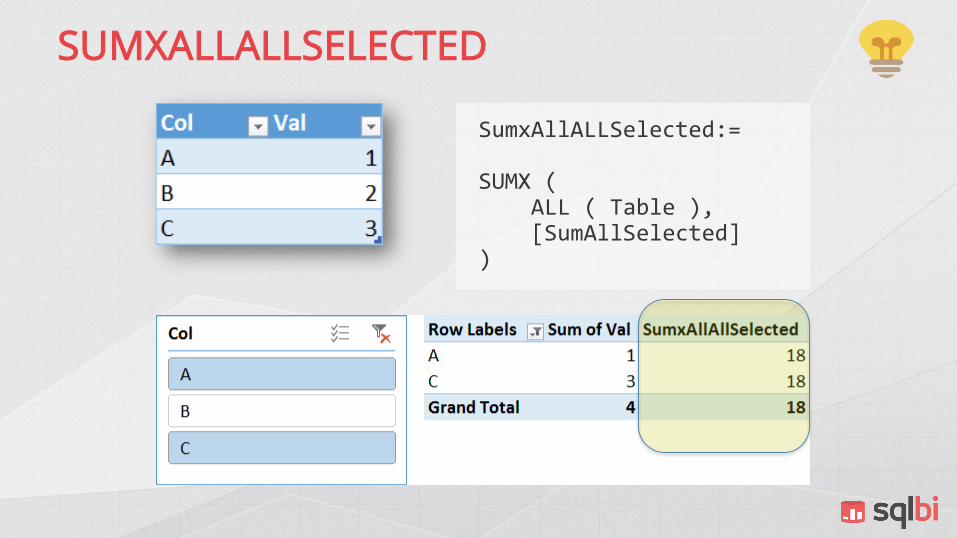
SUMXALLALLSELECTED
SumxAllALLSelected:=
SUMX (ALL ( Table ),[SumAllSelected]
)

The outer filter context
SumxAllSelectedOnAll :=
SUMX ( ALL ( Table ),CALCULATE (
SUM ( Table[Val] ), ALLSELECTED ( )
))

Pivot table: inner rows
EVALUATECALCULATETABLE (
ADDCOLUMNS (VALUES ( Table[Col] ),"SumxAllSelected", CALCULATE (
SUMX (ALL ( Table ),CALCULATE (
SUM ( Table[Val] ),ALLSELECTED ()
))
)),OR ( Table[Col] = "A", Table[Col] = "C" )
)1
2
3

SumxAllSelectedOnAll :=
SUMX ( ALL ( Table ),CALCULATE (
SUM ( Table[Val] ), ALLSELECTED ( )
))
Outer context
ALL ( Customers )
Outer context becomes visible
Current Customer

Advanced Filter Context
Next exercise session is composed of only a couple of formulas, nothing complex. To solve them, you need to stretch your mind and use all the knowledge of this last module. Good luck and… don’t look at the solution too early.
Please refer to lab number 7 on the hands-on manual.

Hierarchies in DAX
Let us discover how DAX handles hierarchies

What Are Hierarchies?
o Predefined exploration paths
• Year – Month – Day• Category – Subcategory – Product
o Make browsing a model easier
o Natural: there exists a 1:M relationship between parent and children
o Unnatural: data is shuffled
o Works better with natural hierarchies
• Detection happens during processing

Hierarchies Across Tables
o All columns in a hierarchy need to belong to the same table
o Use RELATED to move columns in the right place
o Optionally hide original tables

Percentages over hierarchiess
o For a given hierarchy
• Percentage over grand total
• Percentage over selection
• Percentage over Parent
o Plus: show everything in a single measure
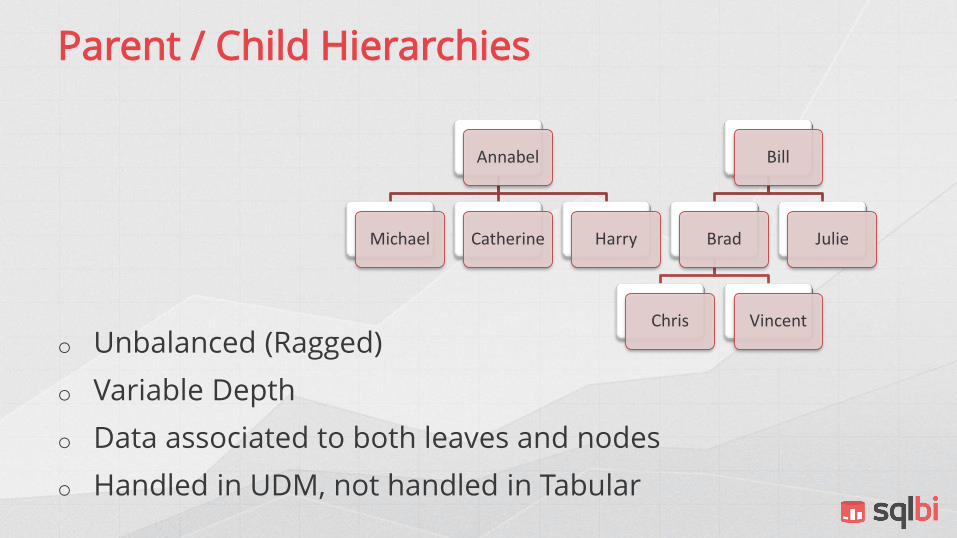
Parent / Child Hierarchies
o Unbalanced (Ragged)
o Variable Depth
o Data associated to both leaves and nodes
o Handled in UDM, not handled in Tabular
Annabel
Michael Catherine Harry
Bill
Brad
Chris Vincent
Julie
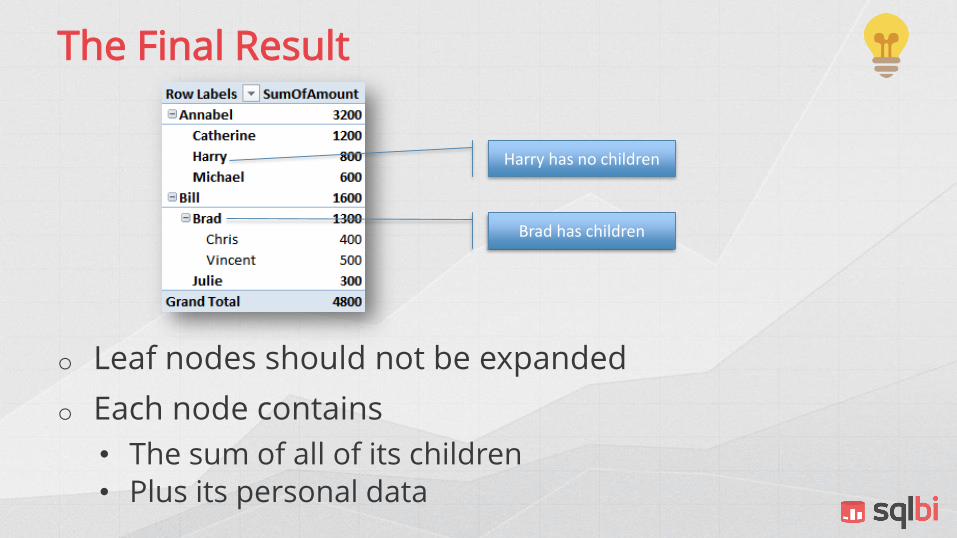
The Final Result
o Leaf nodes should not be expanded
o Each node contains
• The sum of all of its children• Plus its personal data
Harry has no children
Brad has children

The PATH Function
Path performs P/C navigation recursively
HierarchyPath =
PATH (Hiearchy[NodeId],Hiearchy[ParentNodeID]
)
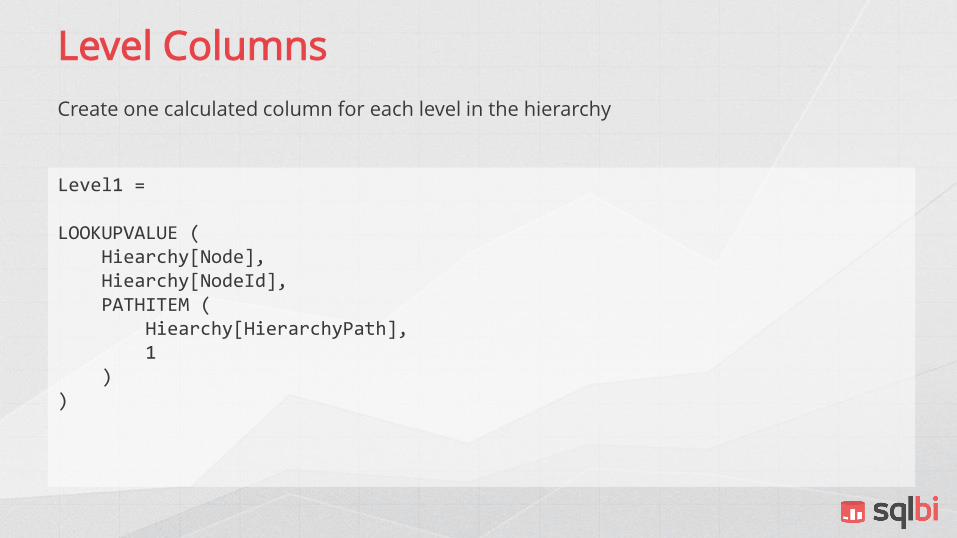
Level Columns
Create one calculated column for each level in the hierarchy
Level1 =
LOOKUPVALUE (Hiearchy[Node],Hiearchy[NodeId],PATHITEM (
Hiearchy[HierarchyPath],1
))

The «HideMemberIf» Issue
o P/C are often ragged, i.e. unbalanced
o Tabular does not handle ragged hierarchies
o Some DAX acrobatics needed

NodeDepth Column
Add a calculated column to the hierarchy which computes the node depth
NodeDepth = PATHLENGTH ( [HierarchyPath] )
Annabel
Michael Catherine Harry
Bill
Brad
Chris Vincent
Julie
Depth = 1
Depth = 2
Depth = 3

Create a BrowseDepth Measure
BrowseDepth computes the maximum filtered level in the hierarchy, i.e. the depth reached by the user browsing data
[BrowseDepth] :=
ISFILTERED ( 'Hierarchy'[Level1] ) + ISFILTERED ( 'Hierarchy'[Level2] ) +ISFILTERED ( 'Hierarchy'[Level3] ) +…ISFILTERED ( 'Hierarchy'[LevelN] ) +

Hide Unwanted Rows
When the MIN of the NodeDepth is less than the BrowseDepth, it means that we are below the current node NodeDepth, and the measure should be BLANKed
SumOfAmount :=
IF ([BrowseDepth] <= MIN ( 'Hierarchy'[NodeDepth] ), SUM ( Invoices[Amount] ),BLANK ()
)

Parent/Child: Conclusions
o Parent/Child are challenging
• Yet they can be solved
• Complexity is in the formulas
o Unary Operators are really complex
• Scenario where Multidimensional works better
o No DAX function to handle hierarchies
• They are only UI items, no DAX available
• Very different from MDX

Hierarchies
Time to write some DAX code by yourself.
Next exercise session is focuses on some simple and not-so-simple DAX code. Choose the exercise that best fit your skills.
Please refer to lab number 8 on the hands-on manual.

Advanced Relationships
Let’s move a step further from plain vanilla relationships

What is ambiguity?

Solving ambiguityThe filter is not intuitive at all

Ambiguous model
Sales Inventory
Product Warehouse
Store
Region

No ambiguity, still too complex
Sales Inventory
Product Warehouse
Store
Region
Store = “A”
Sales Store = “A”
Of sales Store = “A”
Sold where Store = “A”
Inventory Store = “A”
Of Inventory Store = “A”

No ambiguity, still too complex
Sales Inventory
Product Warehouse
Store
Region
Country=“USA”
SalesCountry=“USA”
Sold whereCountry=“USA”
With salesCountry=“USA”
Of stores with salesCountry=“USA”
Of stores with salesCountry=“USA”

Relationship rules
o Single star schema
• Enable bidirectional filtering
• Beware of performance
o Any other model, including multiple star schemas
• Keep all relationship unidirectional
• Enable bidirectional when needed
• Only when needed

USERELATIONSHIP
DueAmount :=
CALCULATE ([SalesAmount],USERELATIONSHIP (
Sales[DueDateKey],Date[DateKey]
))

CROSSFILTER
Changes the direction of a relationship for the duration of a CALCULATE statement
DueAmount :=
CALCULATE ([SalesAmount],CROSSFILTER (
Sales[DueDateKey],Date[DateKey],BOTH
))
Options:
NONE, ONEWAY, BOTH
2015

Multi-Column Relationships
o Tabular supports standard 1:N relationships
o Sometimes you need relationships than span over more than a single column

Multi-Column Relationships

1st Solution: Create Relationship
If the relationship is needed in the model, then you need to create a calculated column to set the relationship
ProductAndReseller =
Discounts[ProductKey] & "-" & Discounts[ResellerKey]

2nd solution: Calculated Column
Using LOOKUPVALUE you can avoid setting the relationship and you denormalize the attribute in the fact table
Discount =
LOOKUPVALUE ( Discounts[MaxDiscount], Discounts[ProductKey], FactResellerSales[ProductKey], Discounts[ResellerKey], FactResellerSales[ResellerKey]
)

Static Segmentation

Segmenting the prices
o Price changes over time
• Discounts
• Price variations
o Continuous dimension
o High fragmentation
o Segmentation
• From 0 to 100 USD
• From 101 to 500

The quick and dirty solution
= IF (
Sales[UnitPrice] <= 5,
"01 LOW",
IF (
Sales[UnitPrice] <=30,
"02 MEDIUM LOW",
IF (
Sales[UnitPrice] <=100,
"03 MEDIUM HIGH",
IF (
Sales[UnitPrice] <= 500,
"04 HIGH",
"05 VERY HIGH" ) ) ) )
Quick and dirty, but it works.Very useful for prototyping a data model with the customer

Segmentation in SQL
SELECTP.BandName,SUM ( S.ExtendedAmount )
FROM dbo.FactResellerSales S JOIN PriceBands P ON S.UnitPrice BETWEEN P.FromPrice AND P.ToPrice
GROUP BYP.BandName
Building a data driven model with SQL is very easy because you can leverage the BETWEEN JOIN, which is not available in Tabular
BandName FromPrice ToPrice
VERY LOW 0 5
LOW 5 30
MEDIUM 30 100
HIGH 100 500
VERY HIGH 500 9999

Segmentation: the data model
NO RELATIONSHIP CAN BE CREATED

Static segmentation in DAX
Leverage CALCULATE and set the relationship inside the formula, producing a materialized version of the calculated relationship
PriceBand =
CALCULATE (VALUES ( PriceBands[PriceBand] ),FILTER (
PriceBands, AND (
Sales[UnitPrice] >= PriceBands[MinPrice],Sales[UnitPrice] < PriceBands[MaxPrice]
))
)

Dynamic Segmentation
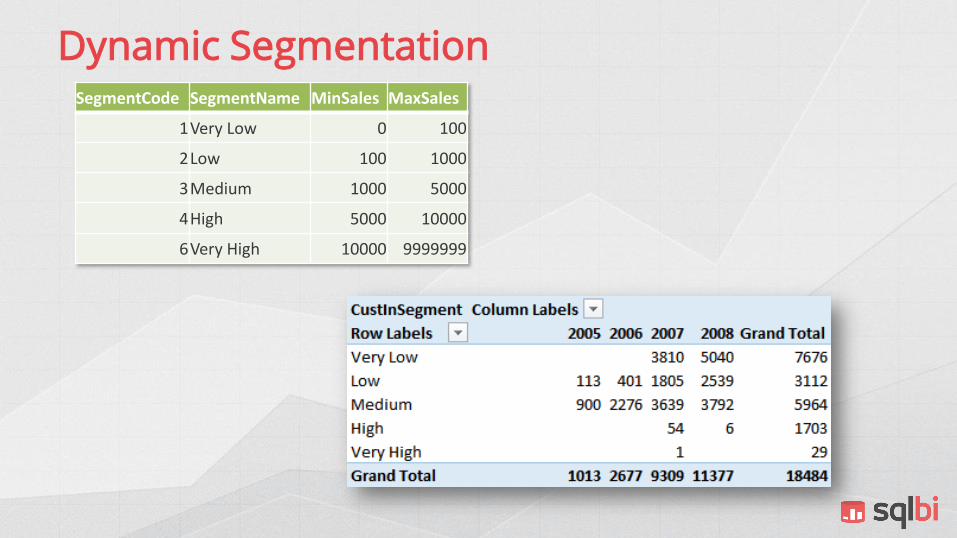
Dynamic SegmentationSegmentCode SegmentName MinSales MaxSales
1Very Low 0 100
2Low 100 1000
3Medium 1000 5000
4High 5000 10000
6Very High 10000 9999999
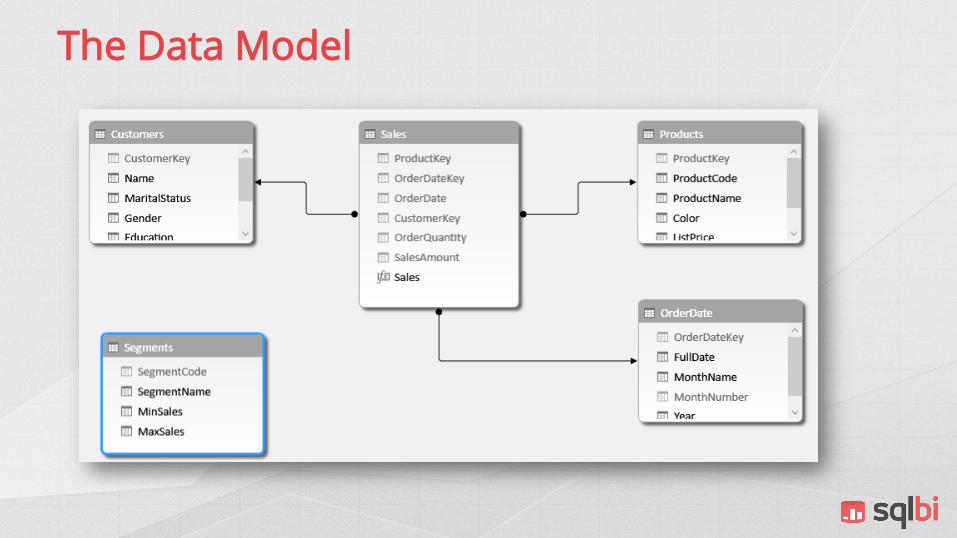
The Data Model

Dynamic Segmentation
This time, the relationship is “virtual”. It does not exists outside of the formula, no materialization
CustInSegment :=
CALCULATE (COUNTROWS ( Customers ),FILTER (
Customers,AND (
[Sales] > MIN ( Segments[MinSales] ),[Sales] <= MAX ( Segments[MaxSales] )
))
)

Working at different granularity
Relationships at different granularities are a challenge

Different Granularity
o Sales recorded at day level
o Advertising at month level

Options for granularity
o Change the data model
• Create tables for the required granularity• Might create an unclear data model
o Force granularity with one element
• 1° of the month• Not an option for all the data models
o Rely on more complex DAX code
• A bit harder to implement• Much more flexible• Might be slow on large data models
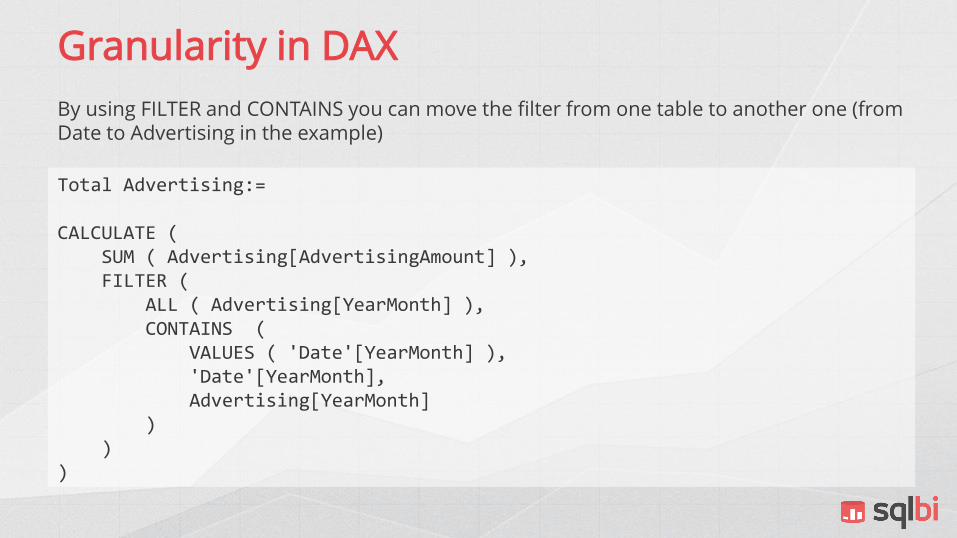
Granularity in DAX
By using FILTER and CONTAINS you can move the filter from one table to another one (from Date to Advertising in the example)
Total Advertising:=
CALCULATE (SUM ( Advertising[AdvertisingAmount] ),FILTER (
ALL ( Advertising[YearMonth] ),CONTAINS (
VALUES ( 'Date'[YearMonth] ), 'Date'[YearMonth],Advertising[YearMonth]
) )
)

Many-to-many
Many ways to handle many-to-many relationships

Many-to-many Relationships
Many to Many Account – Customer
Bridge_AccountCustomer
PK,FK1 ID_Account
PK,FK2 ID_Customer
Dim_Account
PK ID_Account
Account
Dim_Customer
PK ID_Customer
CustomerName
Dim_Date
PK ID_Date
Date
Dim_Type
PK ID_Type
Type
Fact_Transaction
PK ID_Transaction
FK1 ID_Account
FK3 ID_Type
FK2 ID_Date
Amount

Two-way Relationships
o Many-to-many require a bridge table
• Enable two-way relationship
• On both relationships
o Issues
• Bridge table must be complete
• i.e. no unmatched rows in the fact table
• Standard, plain, many-to-many
o Advanced many-to-many requires a bit more coding
2015

Direct Table Filtering
AmountM2M :=
CALCULATE (SUM ( Transaction[Amount] ),AccountCustomer
)

MANY-TO-MANY with SUMMARIZE
Instead of using a table name, you can use any table expression that can filter the fact table.In this example, we obtain the same result using SUMMARIZE
AmountM2M :=
CALCULATE (SUM ( Transaction[Amount] ),SUMMARIZE (
AccountCustomer,Account[ID_Account]
))

MANY-TO-MANY and Iterators
SUMMARIZE is fast, but by leveraging iterators you can obtain much more flexibility
AmountM2M :=
CALCULATE(SUM ( Transaction[Amount] ),FILTER (
Account,CALCULATE (
NOT ( ISEMPTY ( AccountCustomer ) ))
))

New Customers
o Many useful calculations
• Customers
• Buying customers
• New Customers
• Returning customers
o Not very simple, but not «advanced»
o Once you learn the pattern
• Sales of new customers
• Sales of returning customers

Many-to-many
o Handled by the engine natively since 2015
o In previous versions, you need to write code
o By writing code you gain more flexibility
• Find existing relationships with further constraints (e.g. relationship valid in some periods in time)
• Find missing relationships (new customers)

Advanced Relationships
Time to write some DAX code by yourself.
Next exercise session is focuses on some simple and not-so-simple DAX code. Choose the exercise that best fit your skills.
Please refer to lab number 9 on the hands-on manual.

Thank you!
Check our articles, whitepapers and courses on
www.sqlbi.com