© 2002 Society of Industrial and Office REALTORS® Wealth Building Robert J. Nahigian, FRICS, SIOR,...
57
© 2002 Society of Industr ial and Office REALTORS® Wealth Building Robert J. Nahigian, FRICS, SIOR, CRE
-
Upload
isaac-bryant -
Category
Documents
-
view
214 -
download
0
Transcript of © 2002 Society of Industrial and Office REALTORS® Wealth Building Robert J. Nahigian, FRICS, SIOR,...
© 2002 Society of Industrial and Office REALTORS®
Wealth BuildingWealth BuildingRobert J. Nahigian, FRICS, SIOR, CRERobert J. Nahigian, FRICS, SIOR, CRE
© 2002 Society of Industrial and Office REALTORS®Wealth BuildingWealth Building
This session is sponsored by:
Landon R. Wyatt, III, Partner
© 2002 Society of Industrial and Office REALTORS®
WEALTH BUILDINGWEALTH BUILDINGin the 21in the 21stst CENTURY CENTURY
ROBERT J. NAHIGIAN, FRICS, SIOR, CREROBERT J. NAHIGIAN, FRICS, SIOR, CRE SIOR 2006 FALL SIOR 2006 FALL AUBURNDALE REALTY CO. CONFERENCENEWTON, MASS.
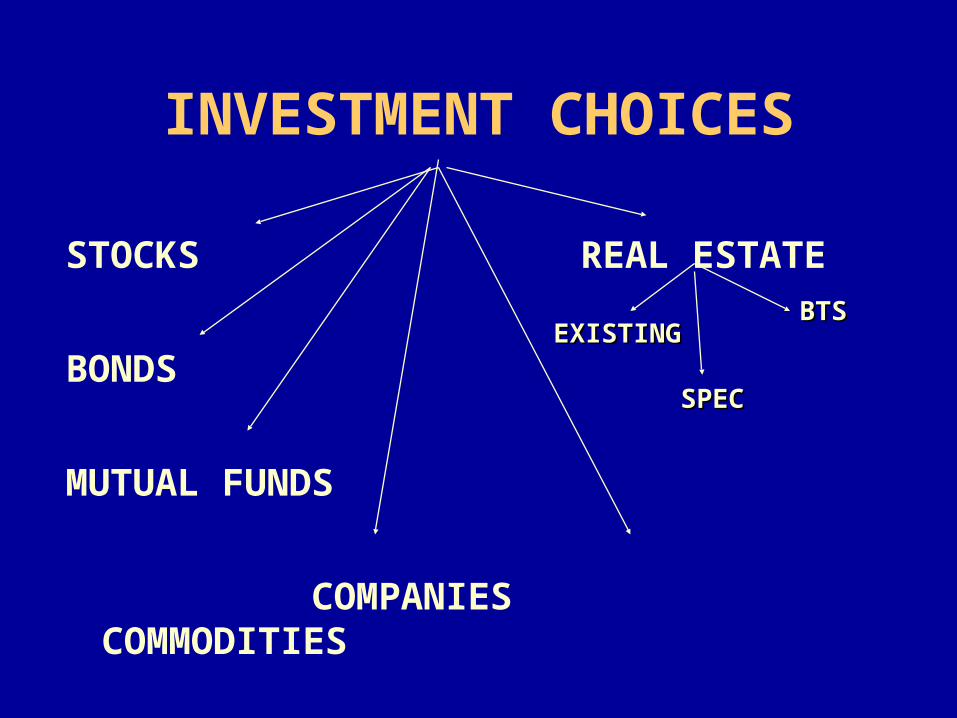
INVESTMENT CHOICES
STOCKS REAL ESTATE
BONDS
MUTUAL FUNDS
COMPANIES COMMODITIES
BTSBTSEXISTINGEXISTING
SPECSPEC
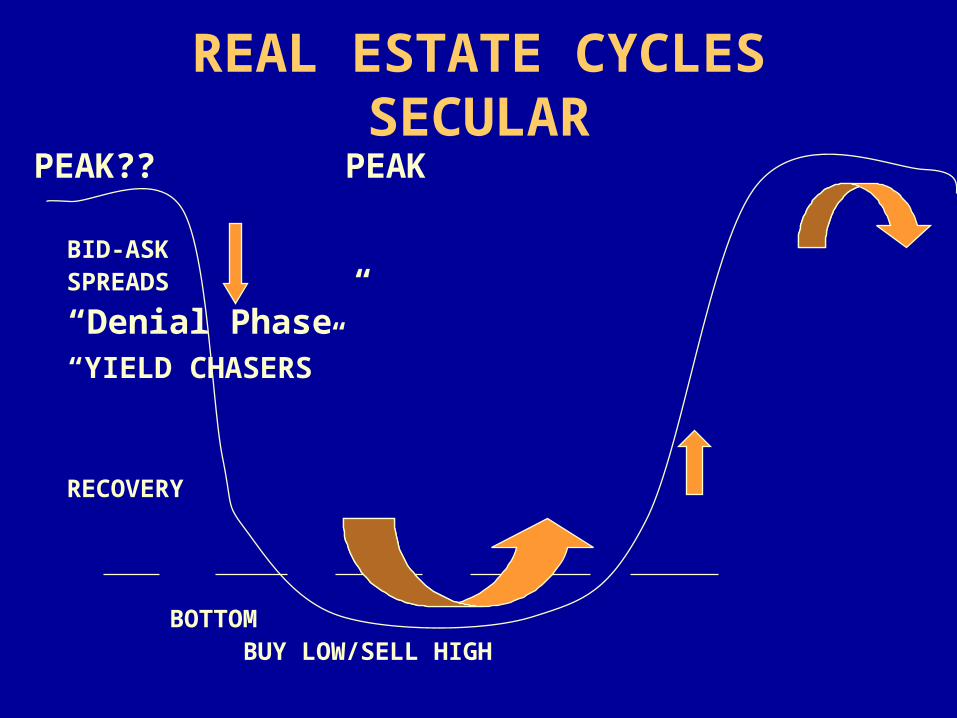
REAL ESTATE CYCLESSECULAR
PEAK?? PEAK
BID-ASK SPREADS
“Denial Phase”“YIELD CHASERS”
RECOVERY
BOTTOM
BUY LOW/SELL HIGH
© 2002 Society of Industrial and Office REALTORS®
Why Real Estate?
• Why do people invest in real estate?
• TO MAKE MONEY?
• Really?
© 2002 Society of Industrial and Office REALTORS®
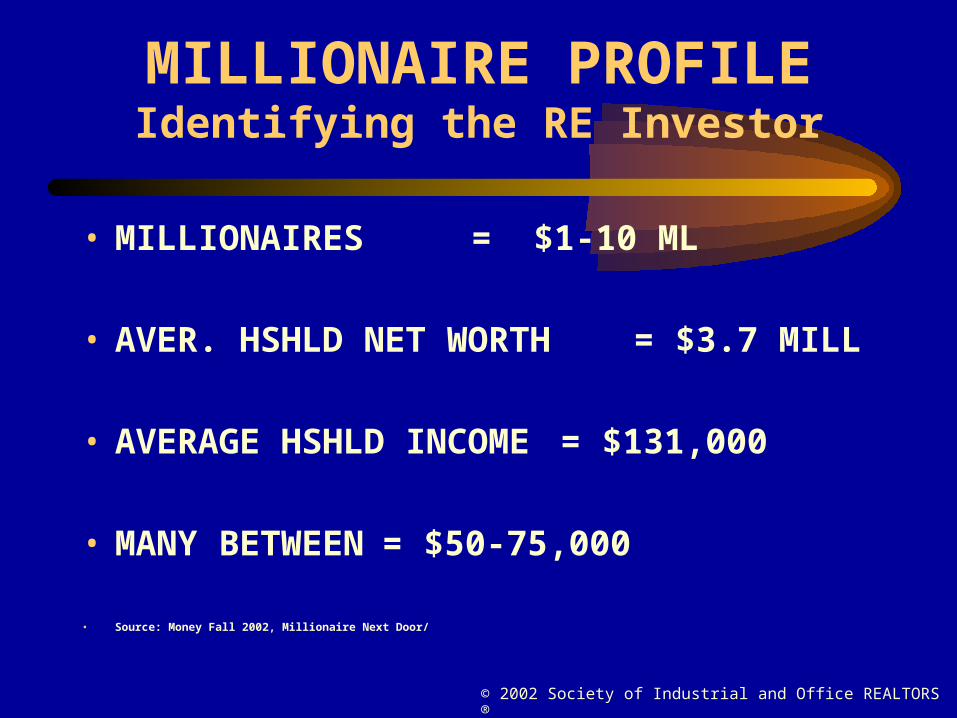
MILLIONAIRE PROFILEIdentifying the RE Investor
• MILLIONAIRES = $1-10 ML
• AVER. HSHLD NET WORTH = $3.7 MILL
• AVERAGE HSHLD INCOME = $131,000
• MANY BETWEEN = $50-75,000
• Source: Money Fall 2002, Millionaire Next Door/
© 2002 Society of Industrial and Office REALTORS®
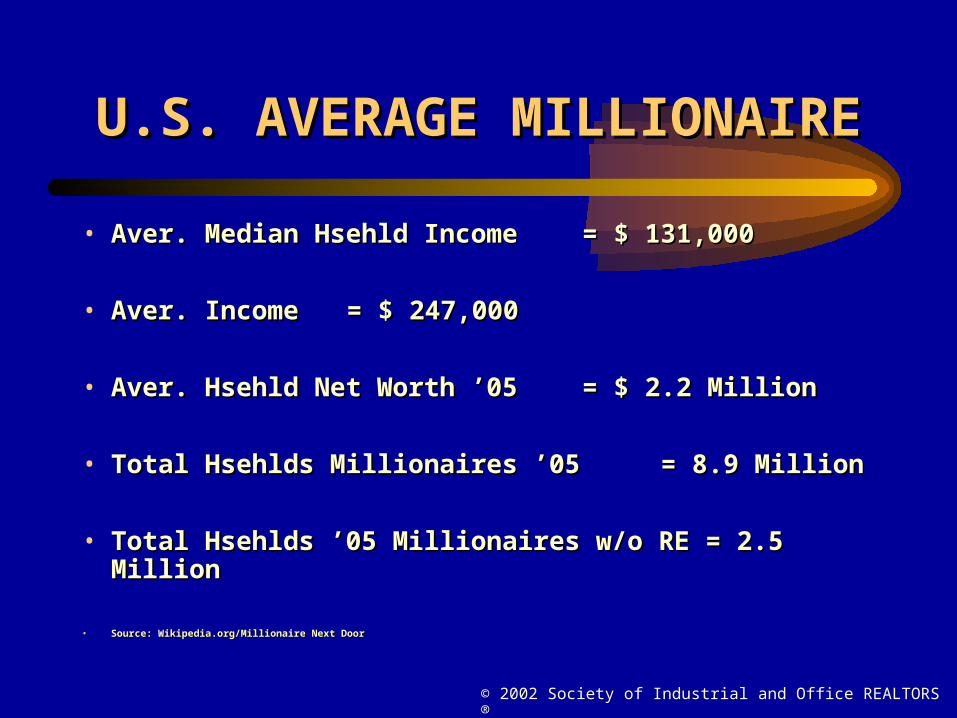
U.S. AVERAGE MILLIONAIREU.S. AVERAGE MILLIONAIRE
• Aver. Median Hsehld Income Aver. Median Hsehld Income = $ 131,000= $ 131,000
• Aver. Income Aver. Income = $ 247,000= $ 247,000
• Aver. Hsehld Net Worth ’05 Aver. Hsehld Net Worth ’05 = $ 2.2 Million= $ 2.2 Million
• Total Hsehlds Millionaires ’05 Total Hsehlds Millionaires ’05 = 8.9 Million= 8.9 Million
• Total Hsehlds ’05 Millionaires w/o RE = 2.5 MillionTotal Hsehlds ’05 Millionaires w/o RE = 2.5 Million
• Source: Wikipedia.org/Millionaire Next DoorSource: Wikipedia.org/Millionaire Next Door
© 2002 Society of Industrial and Office REALTORS®
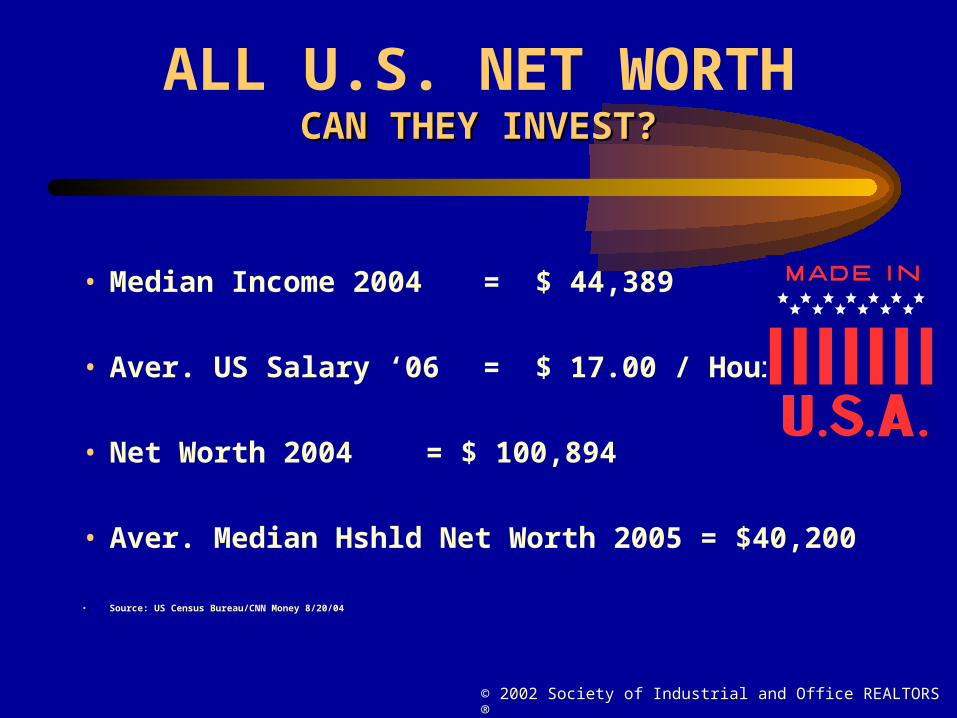
ALL U.S. NET WORTHCAN THEY INVEST?CAN THEY INVEST?
• Median Income 2004 = $ 44,389
• Aver. US Salary ‘06 = $ 17.00 / Hour
• Net Worth 2004 = $ 100,894
• Aver. Median Hshld Net Worth 2005 = $40,200
• Source: US Census Bureau/CNN Money 8/20/04

© 2002 Society of Industrial and Office REALTORS®
BIG HAT, NO CATTLEBIG HAT, NO CATTLE
© 2002 Society of Industrial and Office REALTORS®
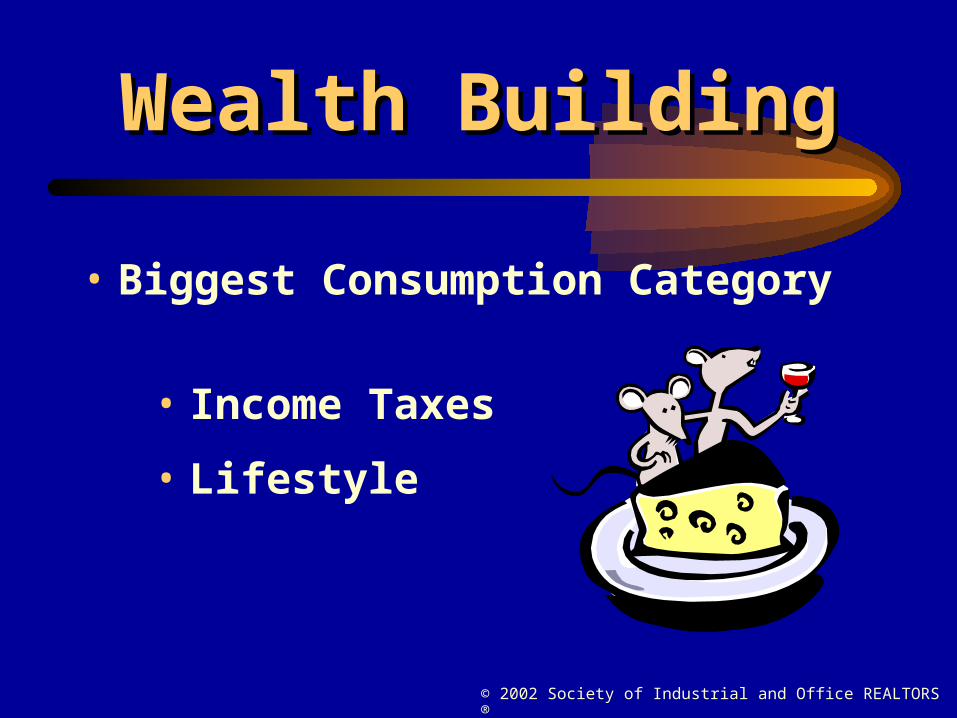
Wealth BuildingWealth Building
• Biggest Consumption Category
• Income Taxes
• Lifestyle

© 2002 Society of Industrial and Office REALTORS®
HOW DID THEY GET HOW DID THEY GET THERE?THERE?
© 2002 Society of Industrial and Office REALTORS®
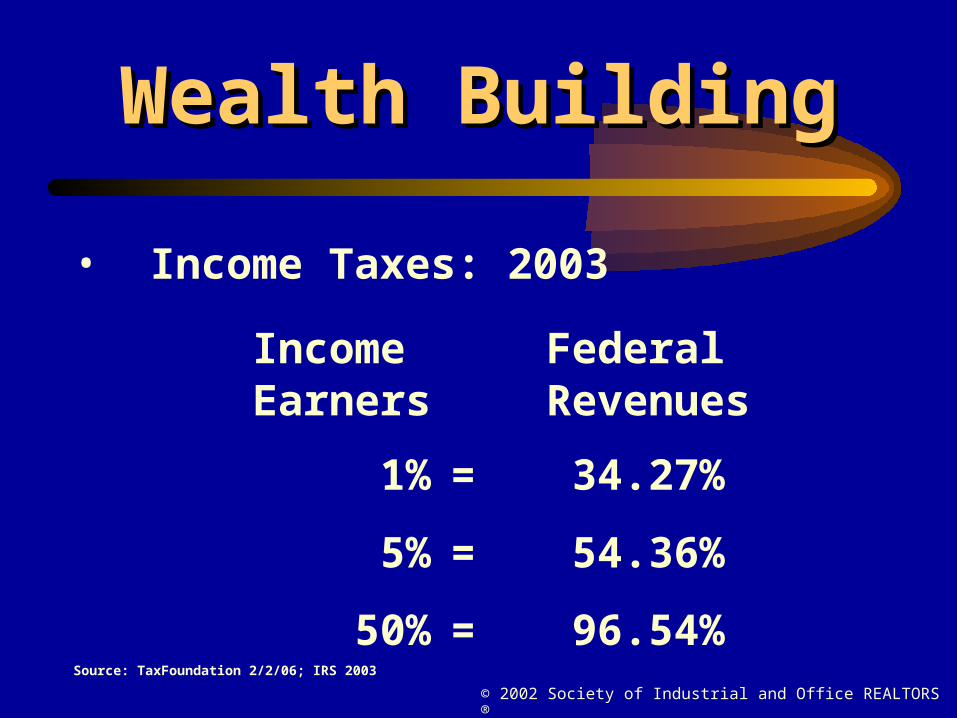
Wealth BuildingWealth Building
• Income Taxes: 2003
Income FederalEarners Revenues
1% = 34.27%
5% = 54.36%
50% = 96.54%Source: TaxFoundation 2/2/06; IRS 2003
© 2002 Society of Industrial and Office REALTORS®
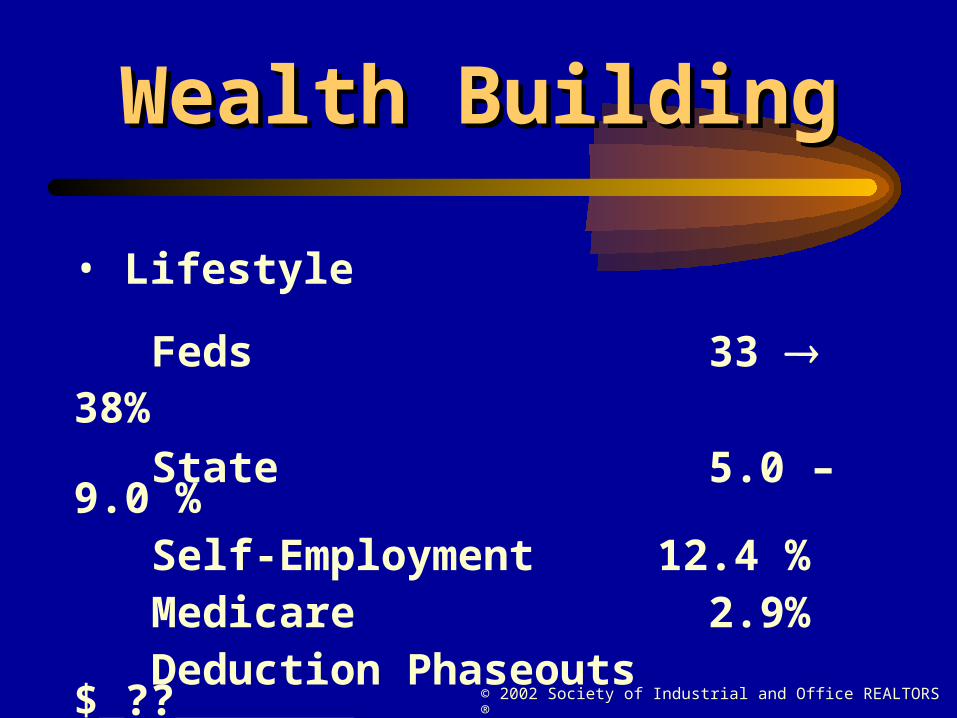
Wealth BuildingWealth Building
• Lifestyle
Feds 33 38%
State 5.0 –9.0 %Self-Employment 12.4 %Medicare 2.9%Deduction Phaseouts $_??_______
60%/92%
© 2002 Society of Industrial and Office REALTORS®
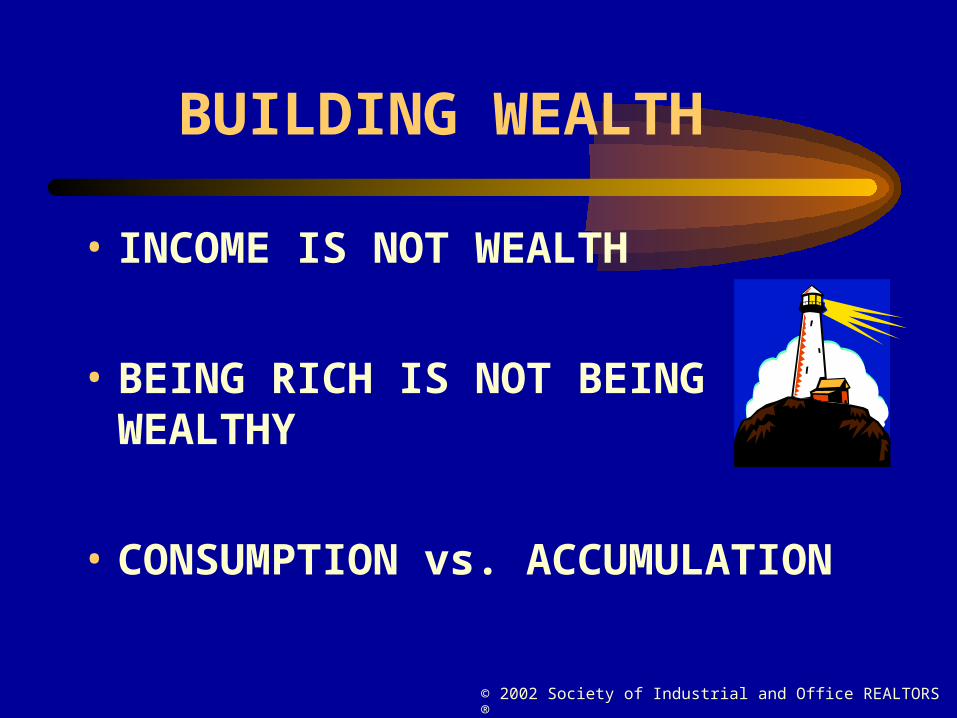
BUILDING WEALTH
• INCOME IS NOT WEALTH
• BEING RICH IS NOT BEING WEALTHY
• CONSUMPTION vs. ACCUMULATION
© 2002 Society of Industrial and Office REALTORS®
Investing
• Discretionary Income (Surplus)
• Placing It/ Commodity
• Future Consumption
© 2002 Society of Industrial and Office REALTORS®
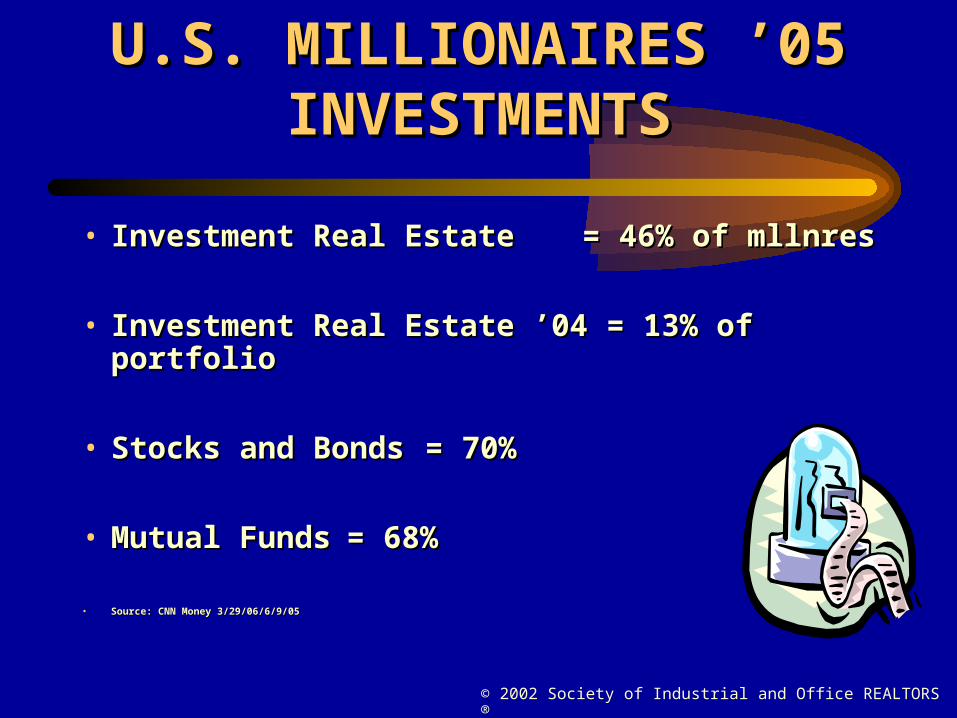
U.S. MILLIONAIRES ’05 U.S. MILLIONAIRES ’05 INVESTMENTSINVESTMENTS
• Investment Real Estate Investment Real Estate = 46% of mllnres= 46% of mllnres
• Investment Real Estate ’04 = 13% of portfolioInvestment Real Estate ’04 = 13% of portfolio
• Stocks and BondsStocks and Bonds = 70%= 70%
• Mutual FundsMutual Funds = 68%= 68%
• Source: CNN Money 3/29/06/6/9/05Source: CNN Money 3/29/06/6/9/05
© 2002 Society of Industrial and Office REALTORS®
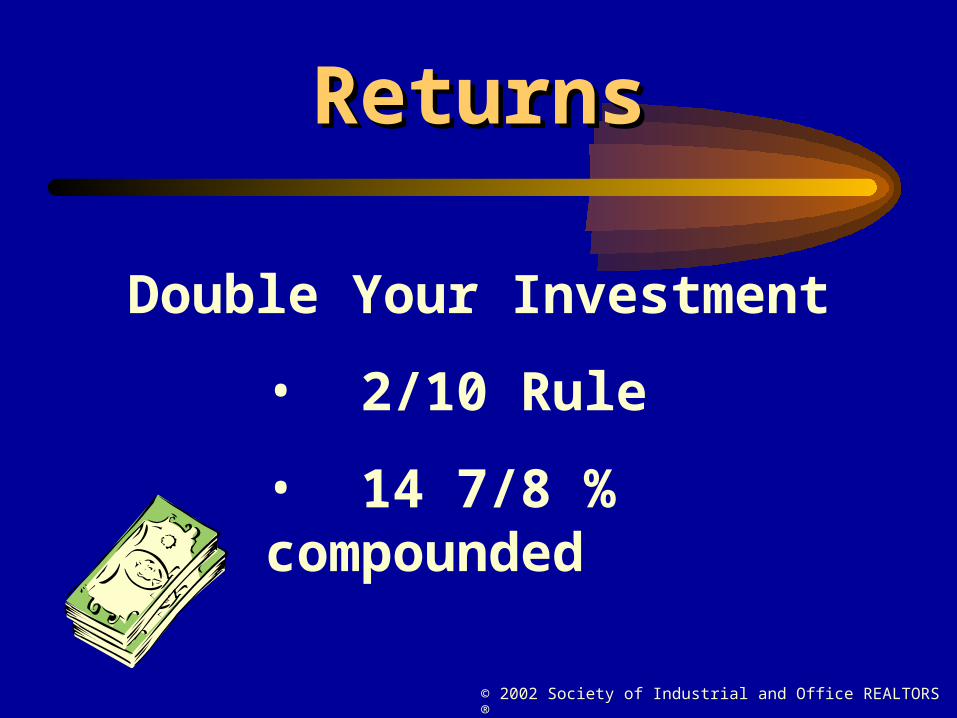
ReturnsReturns
Double Your Investment
• 2/10 Rule
• 14 7/8 % compounded
© 2002 Society of Industrial and Office REALTORS®
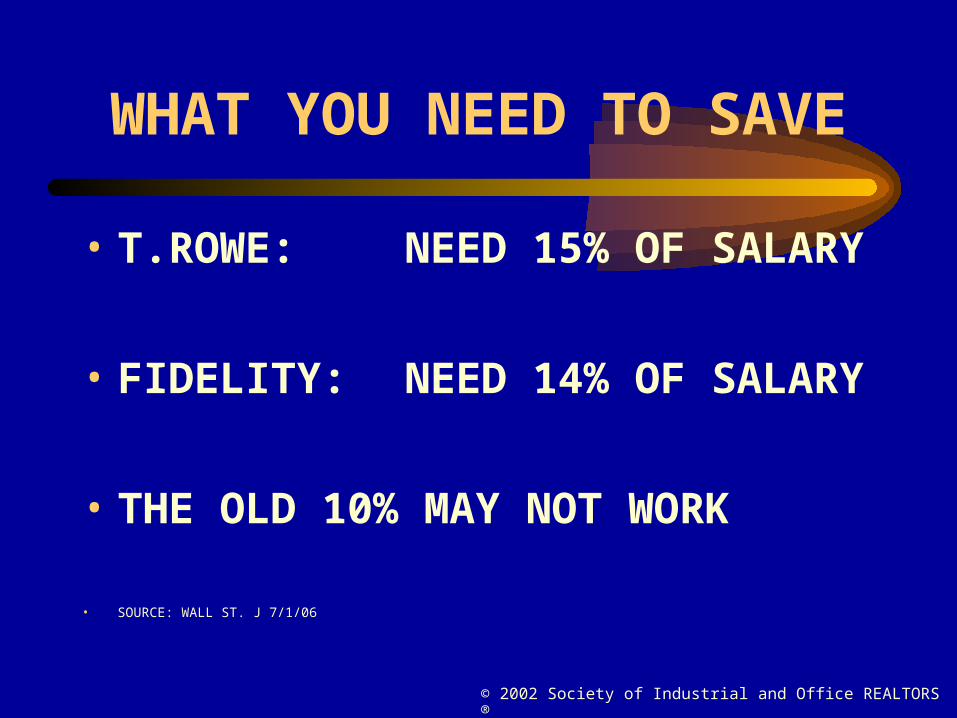
WHAT YOU NEED TO SAVE
• T.ROWE: NEED 15% OF SALARY
• FIDELITY: NEED 14% OF SALARY
• THE OLD 10% MAY NOT WORK
• SOURCE: WALL ST. J 7/1/06
© 2002 Society of Industrial and Office REALTORS®
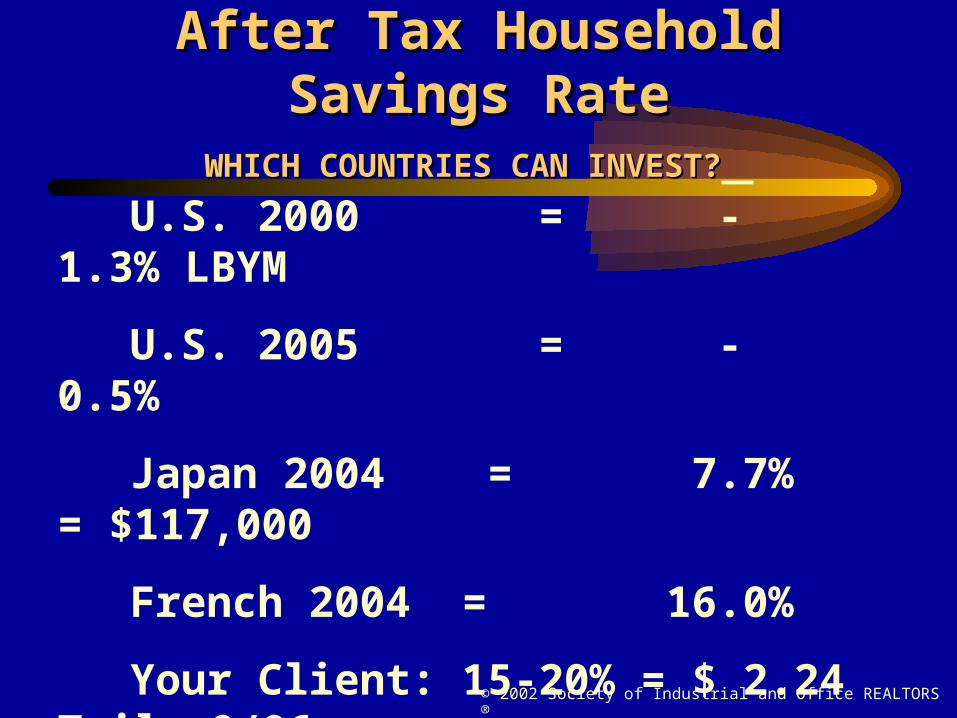
After Tax Household Savings RateAfter Tax Household Savings RateWHICH COUNTRIES CAN INVEST?WHICH COUNTRIES CAN INVEST?
U.S. 2000 = - 1.3% LBYM
U.S. 2005 = - 0.5%
Japan 2004 = 7.7% = $117,000
French 2004 = 16.0%
Your Client: 15-20% = $ 2.24 Tril. 9/06
Source: US New 2/10/03; 3/24/03; MSNBC 1/30/06/Las Vegas Journal 3/2/06
© 2002 Society of Industrial and Office REALTORS®
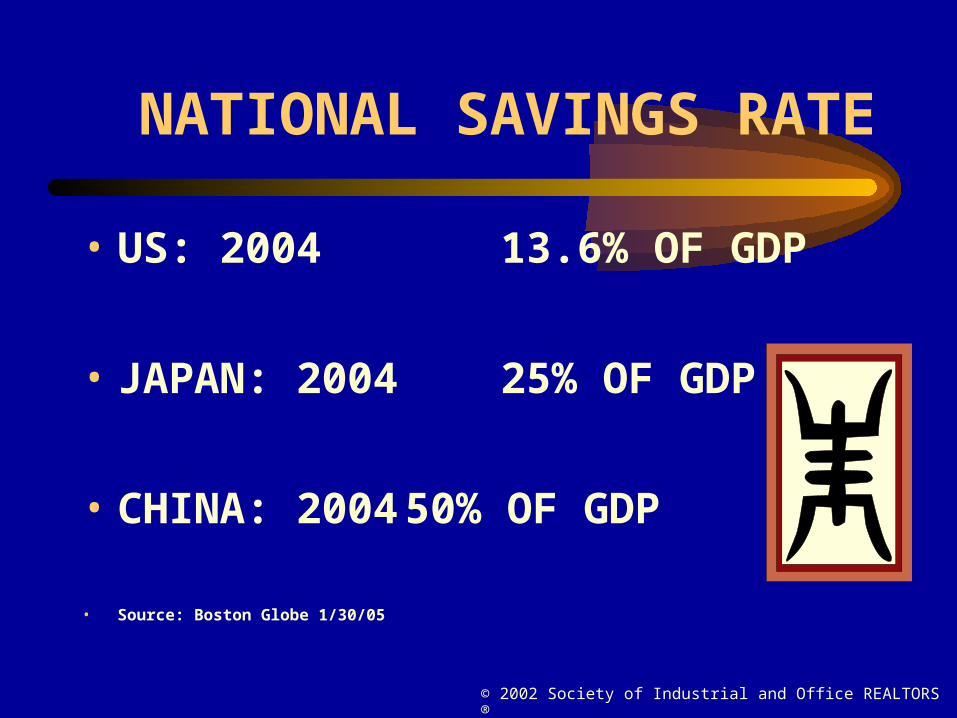
NATIONAL SAVINGS RATE
• US: 2004 13.6% OF GDP
• JAPAN: 2004 25% OF GDP
• CHINA: 2004 50% OF GDP
• Source: Boston Globe 1/30/05
© 2002 Society of Industrial and Office REALTORS®
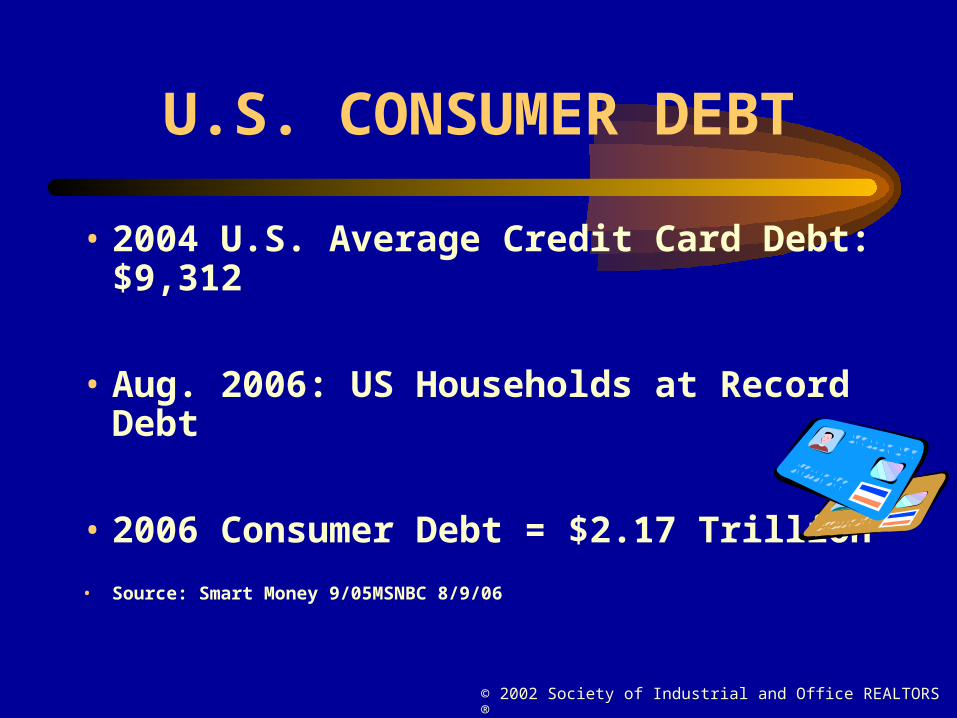
U.S. CONSUMER DEBT
• 2004 U.S. Average Credit Card Debt: $9,312
• Aug. 2006: US Households at Record Debt
• 2006 Consumer Debt = $2.17 Trillion
• Source: Smart Money 9/05MSNBC 8/9/06
© 2002 Society of Industrial and Office REALTORS®
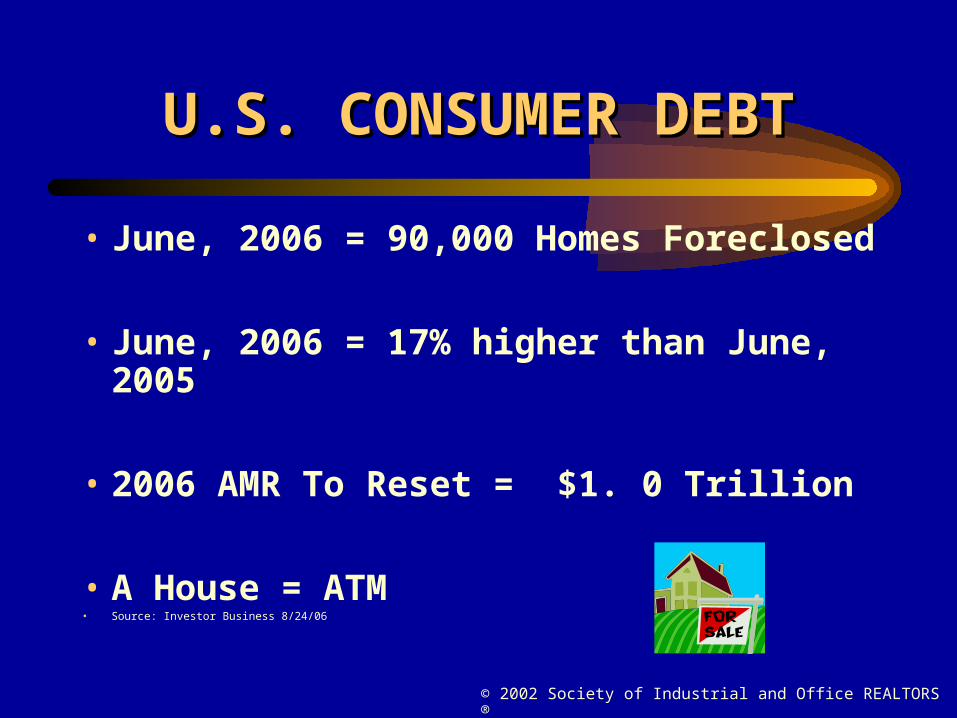
U.S. CONSUMER DEBTU.S. CONSUMER DEBT
• June, 2006 = 90,000 Homes Foreclosed
• June, 2006 = 17% higher than June, 2005
• 2006 AMR To Reset = $1. 0 Trillion
• A House = ATM • Source: Investor Business 8/24/06
© 2002 Society of Industrial and Office REALTORS®
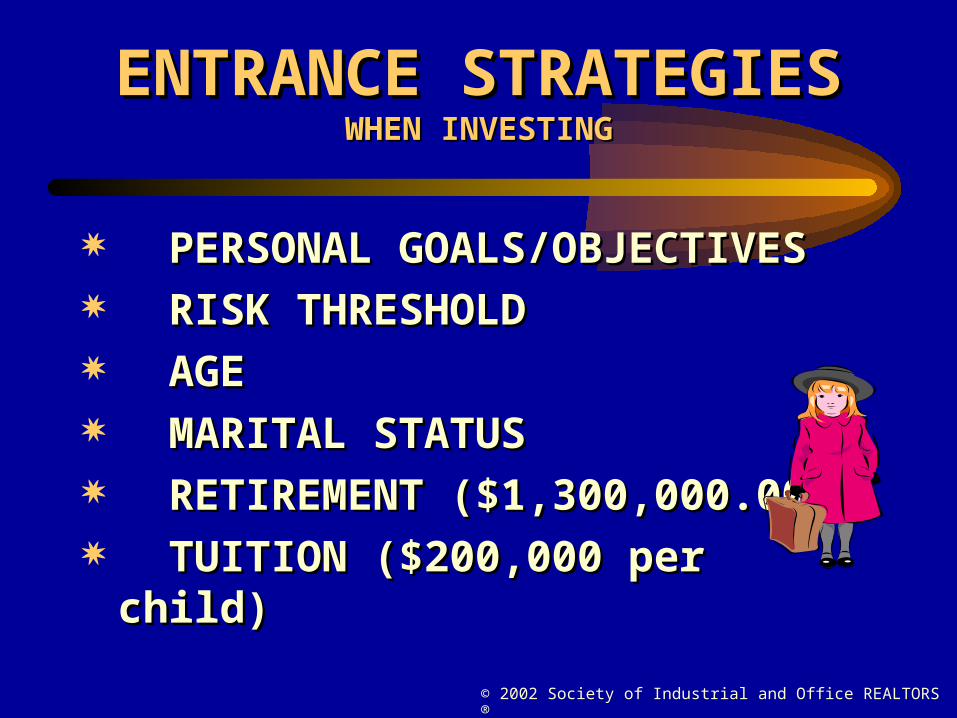
ENTRANCE STRATEGIESENTRANCE STRATEGIESWHEN INVESTINGWHEN INVESTING
PERSONAL GOALS/OBJECTIVESPERSONAL GOALS/OBJECTIVES RISK THRESHOLDRISK THRESHOLD AGEAGE MARITAL STATUSMARITAL STATUS RETIREMENT ($1,300,000.00)RETIREMENT ($1,300,000.00) TUITION ($200,000 per child)TUITION ($200,000 per child)
© 2002 Society of Industrial and Office REALTORS®
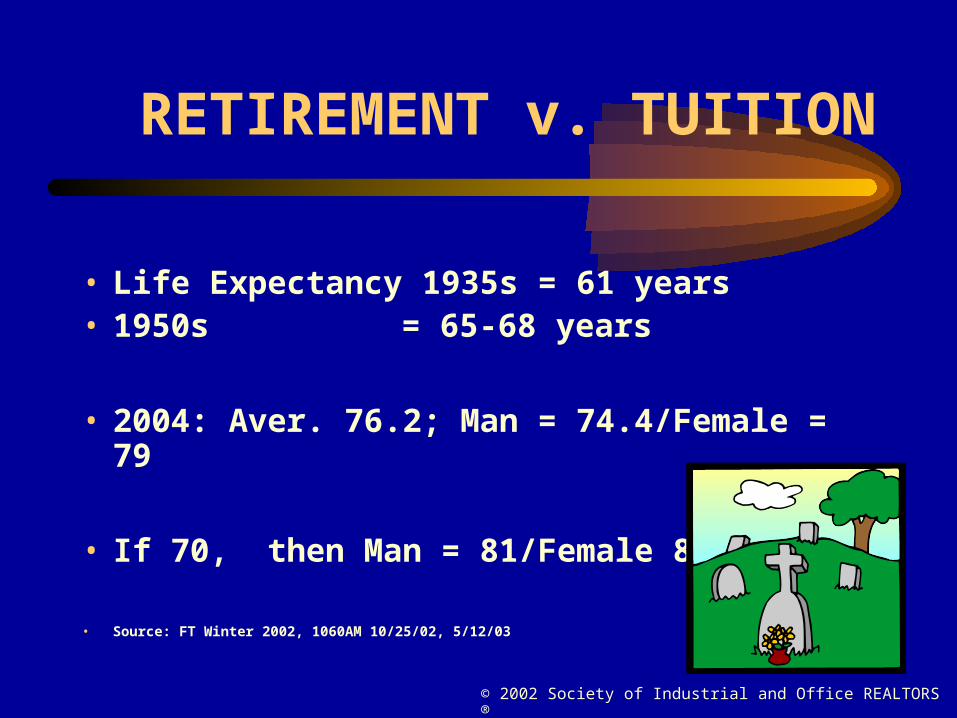
RETIREMENT v. TUITION
• Life Expectancy 1935s = 61 years• 1950s = 65-68 years
• 2004: Aver. 76.2; Man = 74.4/Female = 79
• If 70, then Man = 81/Female 84
• Source: FT Winter 2002, 1060AM 10/25/02, 5/12/03
© 2002 Society of Industrial and Office REALTORS®
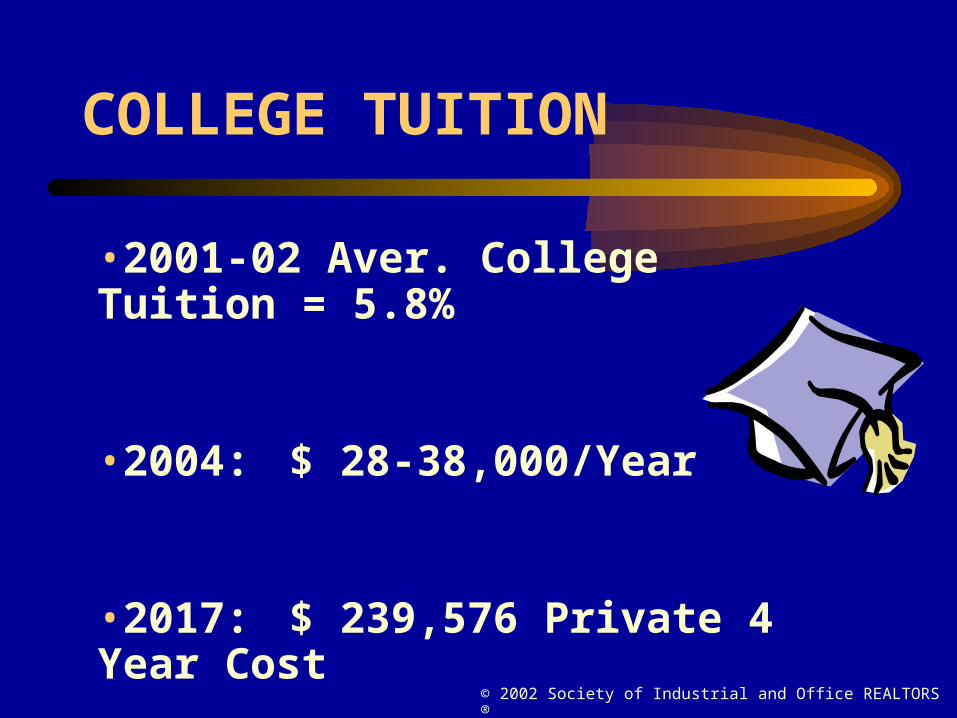
COLLEGE TUITION
•2001-02 Aver. College Tuition = 5.8%
•2004: $ 28-38,000/Year
•2017: $ 239,576 Private 4 Year Cost
•Source: Barrons 4/21/03; Money 1/03; US News 1/01
© 2002 Society of Industrial and Office REALTORS®
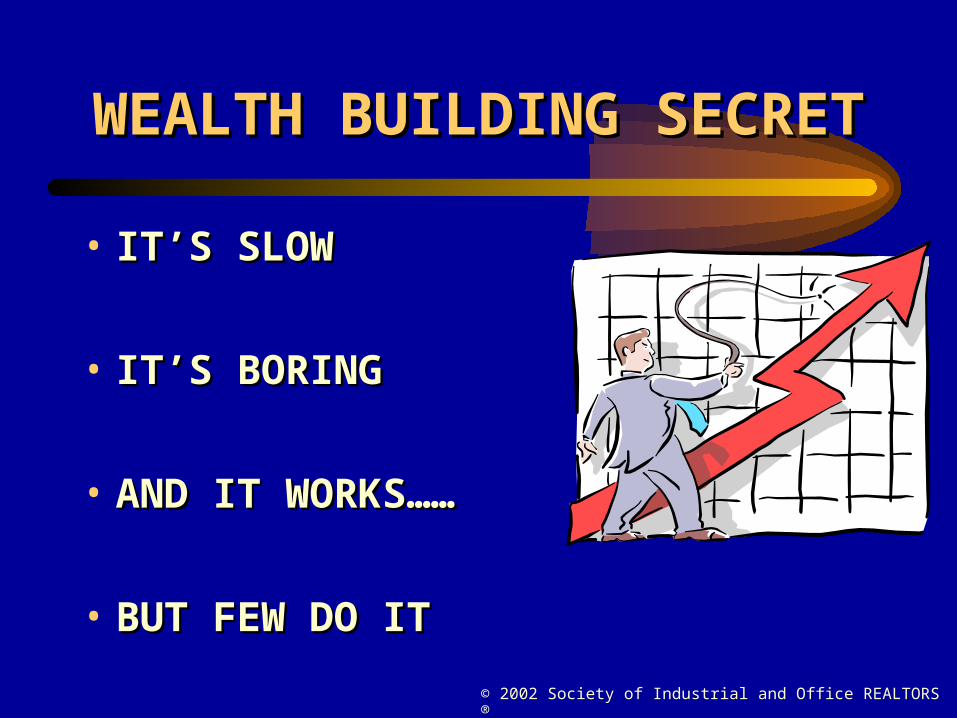
WEALTH BUILDING WEALTH BUILDING SECRETSECRET
• IT’S SLOWIT’S SLOW
• IT’S BORINGIT’S BORING
• AND IT WORKS……AND IT WORKS……
• BUT FEW DO ITBUT FEW DO IT
© 2002 Society of Industrial and Office REALTORS®
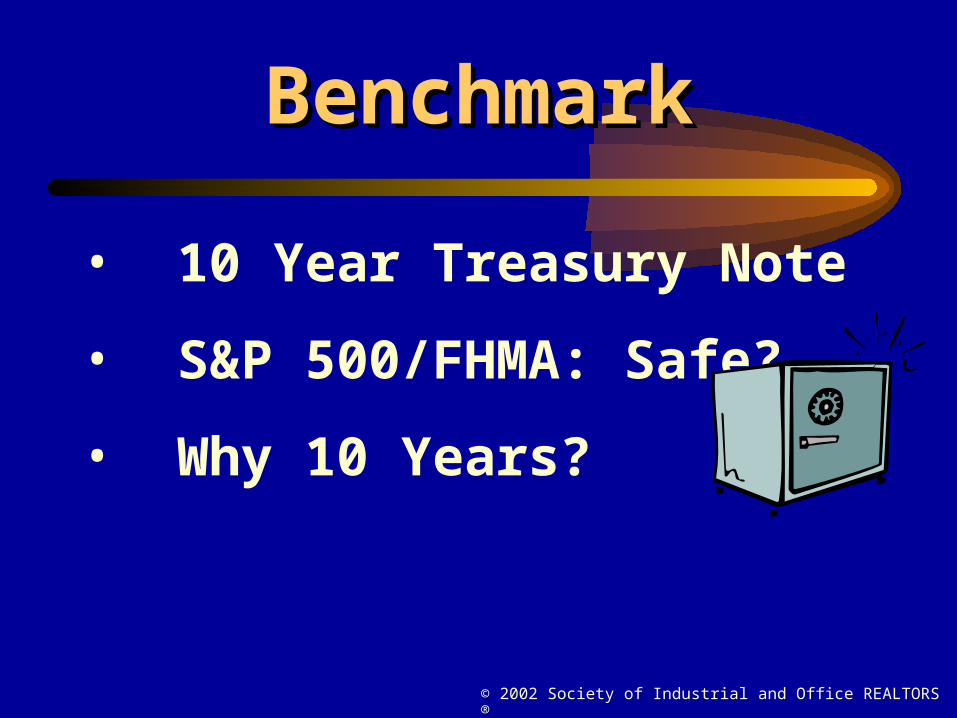
BenchmarkBenchmark
• 10 Year Treasury Note
• S&P 500/FHMA: Safe?
• Why 10 Years?
© 2002 Society of Industrial and Office REALTORS®
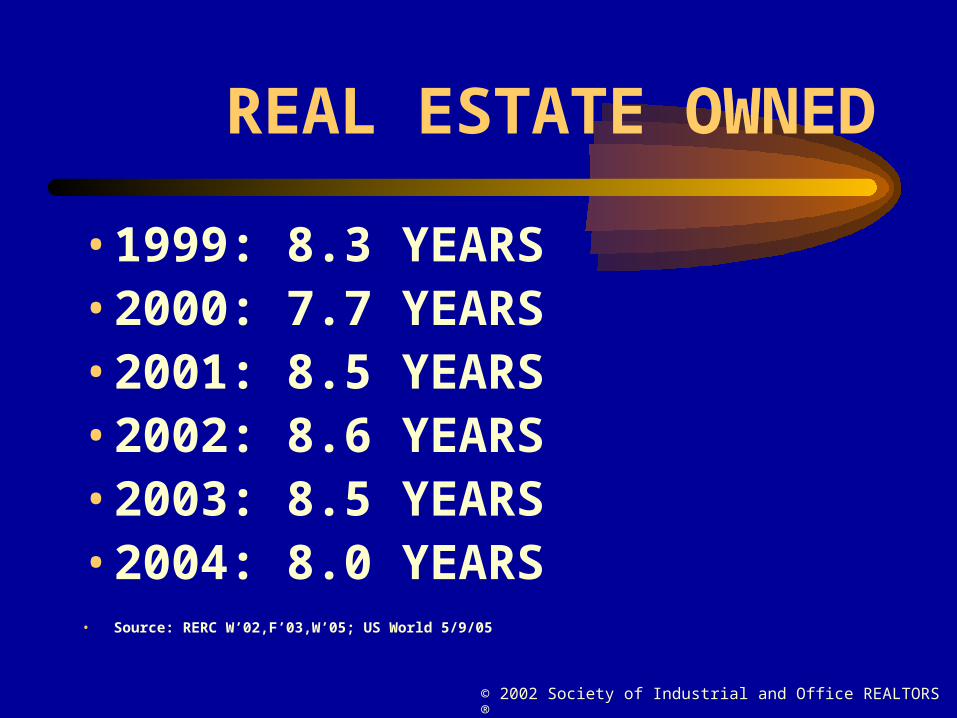
REAL ESTATE OWNED
• 1999: 8.3 YEARS• 2000: 7.7 YEARS• 2001: 8.5 YEARS• 2002: 8.6 YEARS• 2003: 8.5 YEARS• 2004: 8.0 YEARS• Source: RERC W’02,F’03,W’05; US World 5/9/05
© 2002 Society of Industrial and Office REALTORS®
BENCHMARK
• Risk v. Reward
• What is Risk?
• Year 1654
• “Dead Capital”
© 2002 Society of Industrial and Office REALTORS®
RISK DEFINITION
• PROBABILITY OF NOT
• Achieving the Return One Initially Expects
• Investors Dislike LOSSES MORE Than Gains
• CRE: Fall’03
© 2002 Society of Industrial and Office REALTORS®
BEHAVORIAL RESEARCH
• Humans Are Risk Averse When It Comes to Gains
• BUT RECKLESS When Trying To Avoid Losses
• SO….They Lock into Profits Too EARLY And HOLD Losers Too LONG
• Barrons 6/28/04
© 2002 Society of Industrial and Office REALTORS®
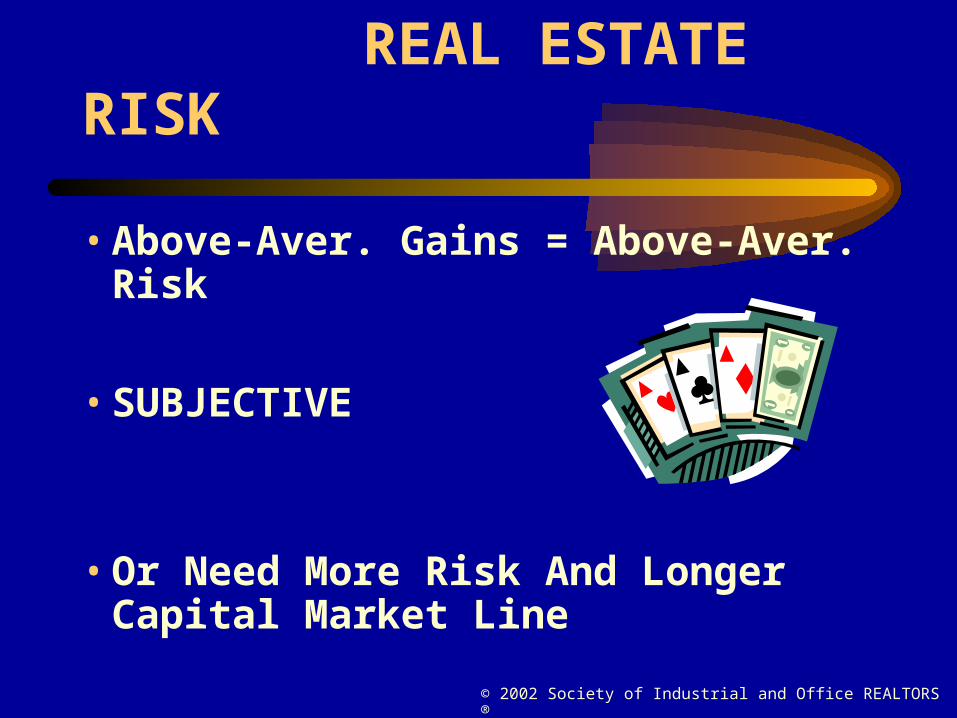
REAL ESTATE RISK
• Above-Aver. Gains = Above-Aver. Risk
• SUBJECTIVE
• Or Need More Risk And Longer Capital Market Line
© 2002 Society of Industrial and Office REALTORS®
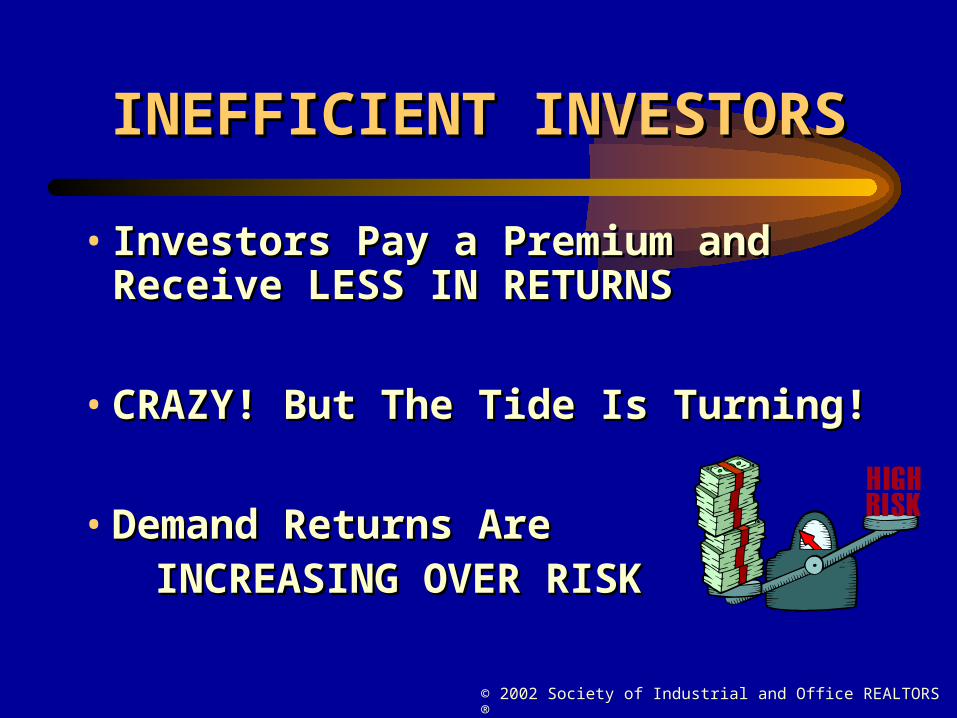
INEFFICIENT INVESTORSINEFFICIENT INVESTORS
• Investors Pay a Premium and Investors Pay a Premium and Receive LESS IN RETURNSReceive LESS IN RETURNS
• CRAZY! But The Tide Is Turning!CRAZY! But The Tide Is Turning!
• Demand Returns Are Demand Returns Are INCREASING OVER RISKINCREASING OVER RISK
© 2002 Society of Industrial and Office REALTORS®
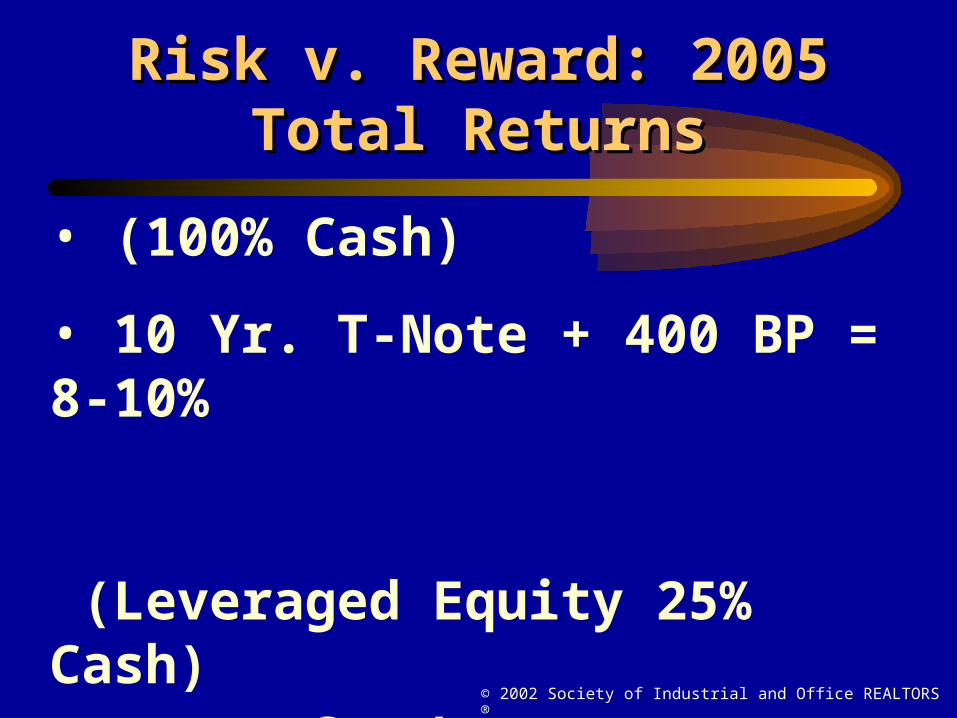
Risk v. Reward: 2005Risk v. Reward: 2005Total ReturnsTotal Returns
• (100% Cash)
• 10 Yr. T-Note + 400 BP = 8-10%
(Leveraged Equity 25% Cash) • Cost of Debt + 600 BP = 12%-13% Source: RERC ‘05
© 2002 Society of Industrial and Office REALTORS®
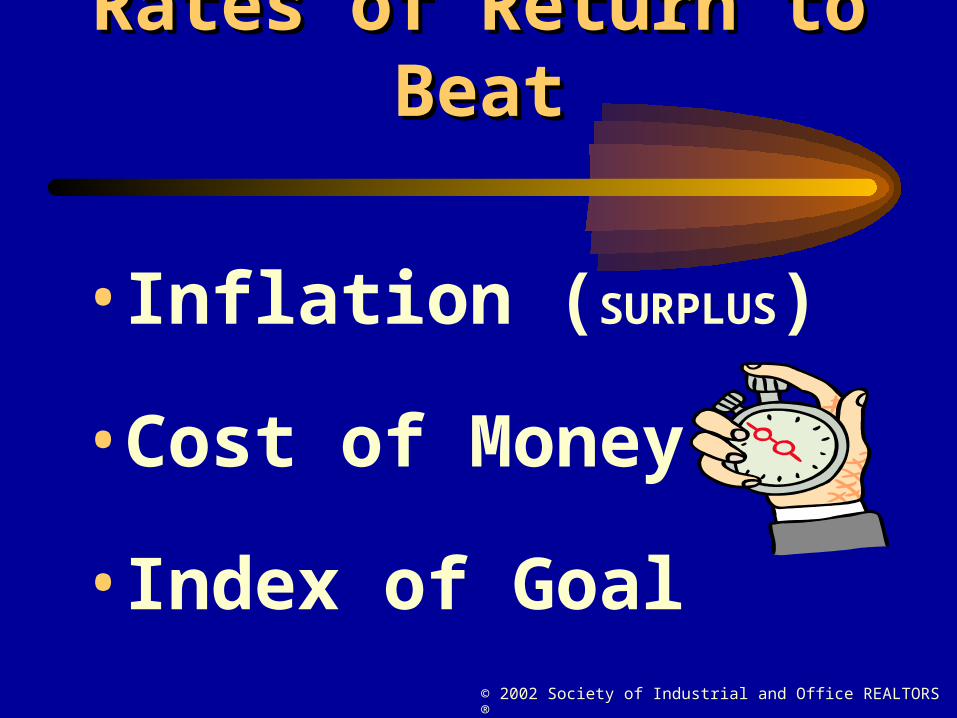
Rates of Return to BeatRates of Return to Beat
• Inflation (SURPLUS)
• Cost of Money
• Index of Goal
© 2002 Society of Industrial and Office REALTORS®
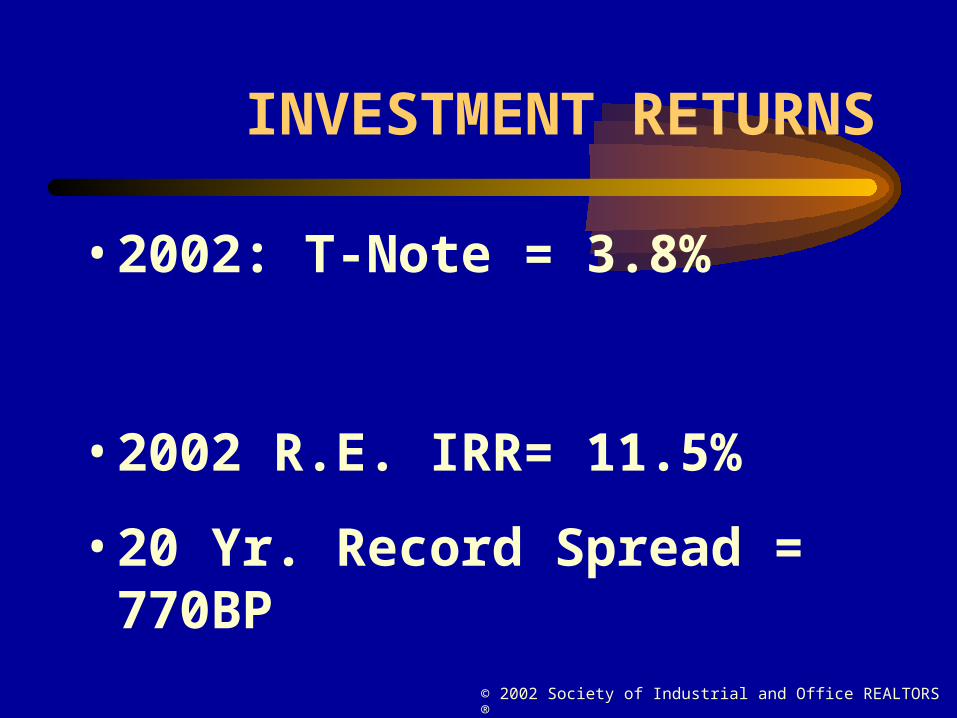
INVESTMENT RETURNS
• 2002: T-Note = 3.8%
• 2002 R.E. IRR= 11.5%
• 20 Yr. Record Spread = 770BP
© 2002 Society of Industrial and Office REALTORS®
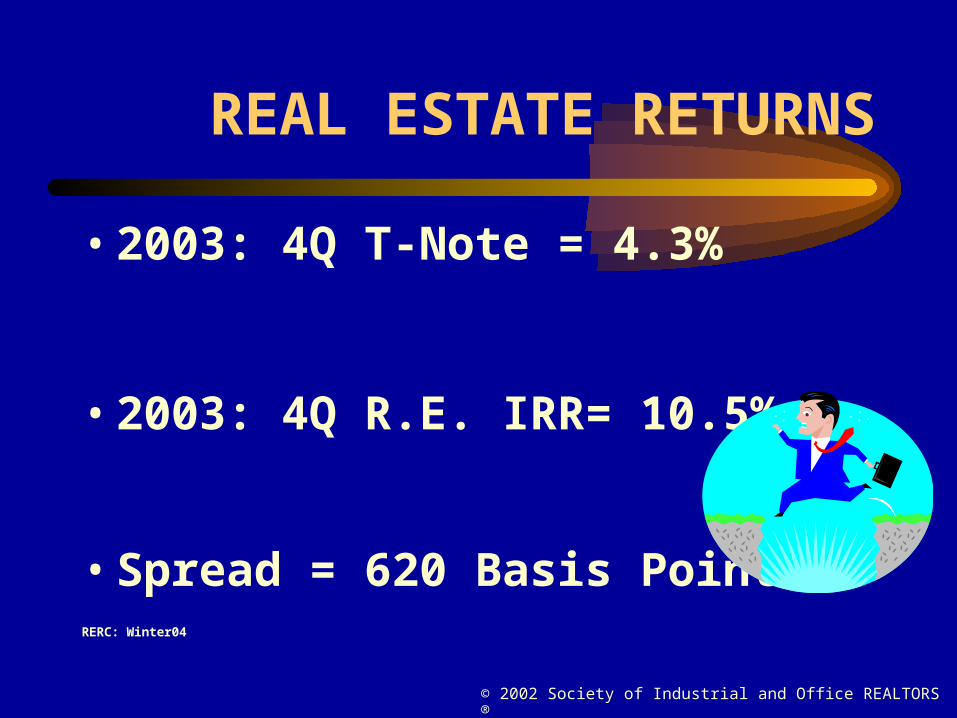
REAL ESTATE RETURNS
• 2003: 4Q T-Note = 4.3%
• 2003: 4Q R.E. IRR= 10.5%
• Spread = 620 Basis PointsRERC: Winter04
© 2002 Society of Industrial and Office REALTORS®
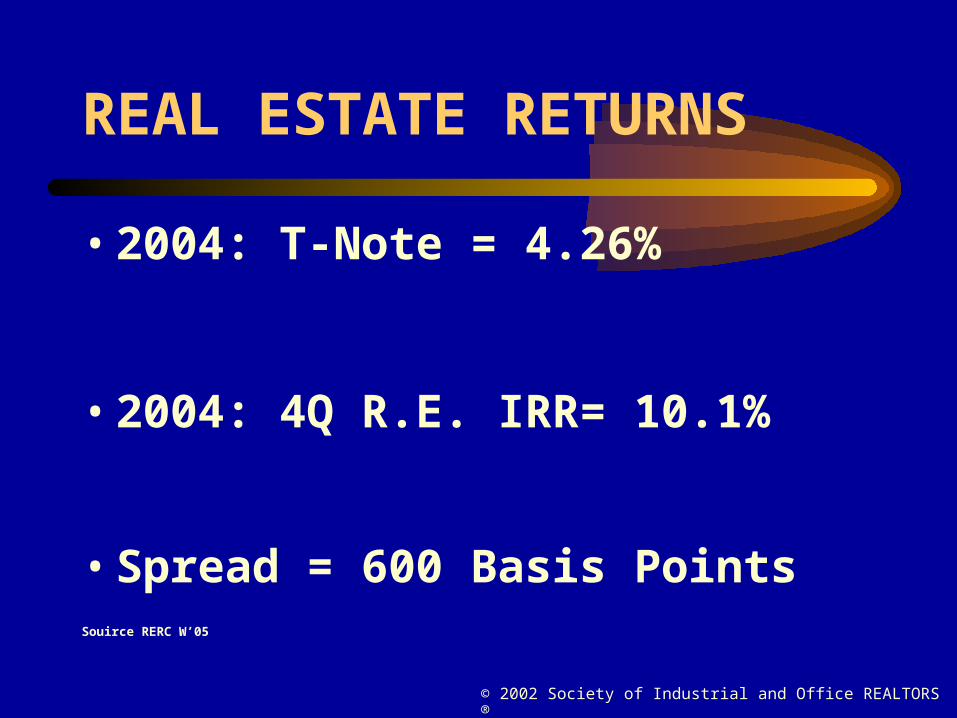
REAL ESTATE RETURNS
• 2004: T-Note = 4.26%
• 2004: 4Q R.E. IRR= 10.1%
• Spread = 600 Basis PointsSouirce RERC W’05
© 2002 Society of Industrial and Office REALTORS®
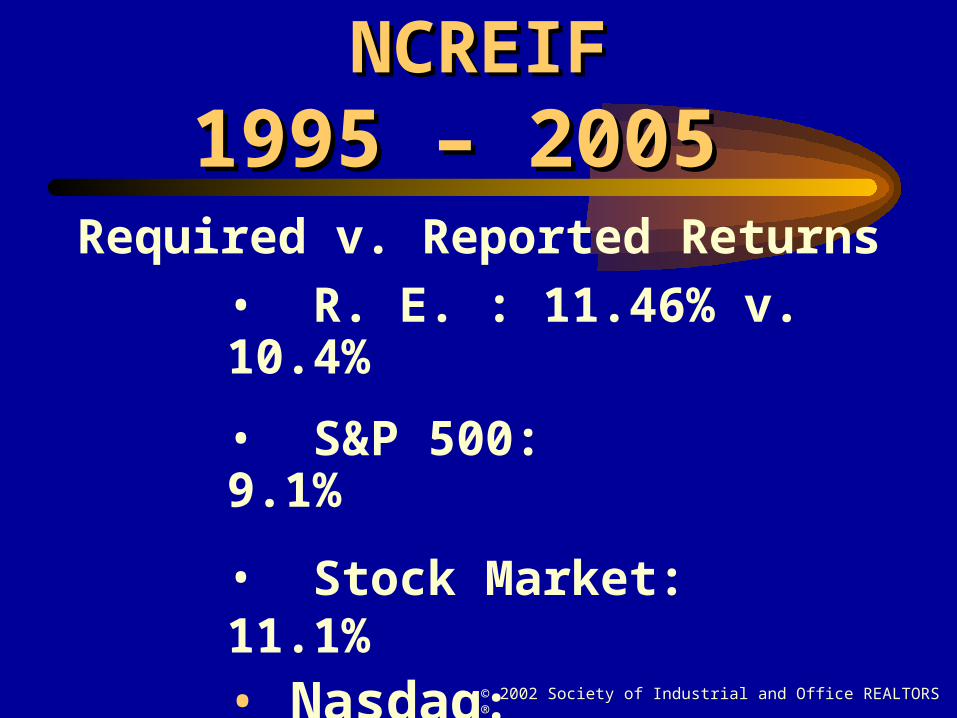
NCREIFNCREIF1995 – 2005 1995 – 2005
Required v. Reported Returns• R. E. : 11.46% v. 10.4%
• S&P 500: 9.1%
• Stock Market: 11.1%• Nasdaq: 8.1%• Dow: 9.8%
•RERC: Winter’04; Morningstar1/05/Wall St. Journal 4/19/06
Source: LM Annual 2002 Report
© 2002 Society of Industrial and Office REALTORS®
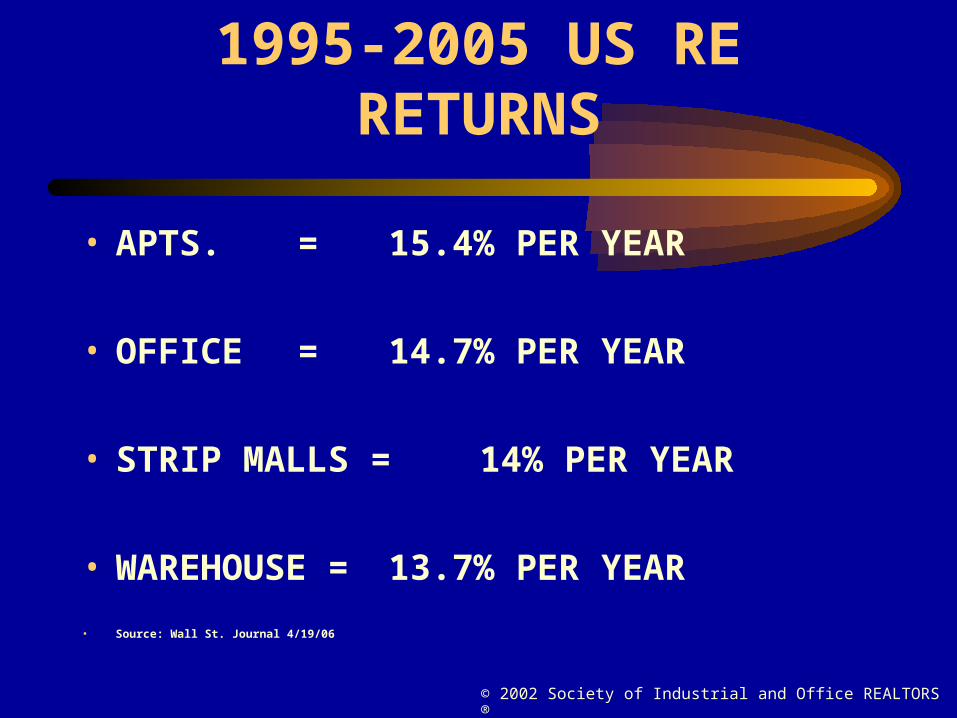
1995-2005 US RE RETURNS
• APTS. = 15.4% PER YEAR
• OFFICE = 14.7% PER YEAR
• STRIP MALLS = 14% PER YEAR
• WAREHOUSE = 13.7% PER YEAR
• Source: Wall St. Journal 4/19/06
© 2002 Society of Industrial and Office REALTORS®
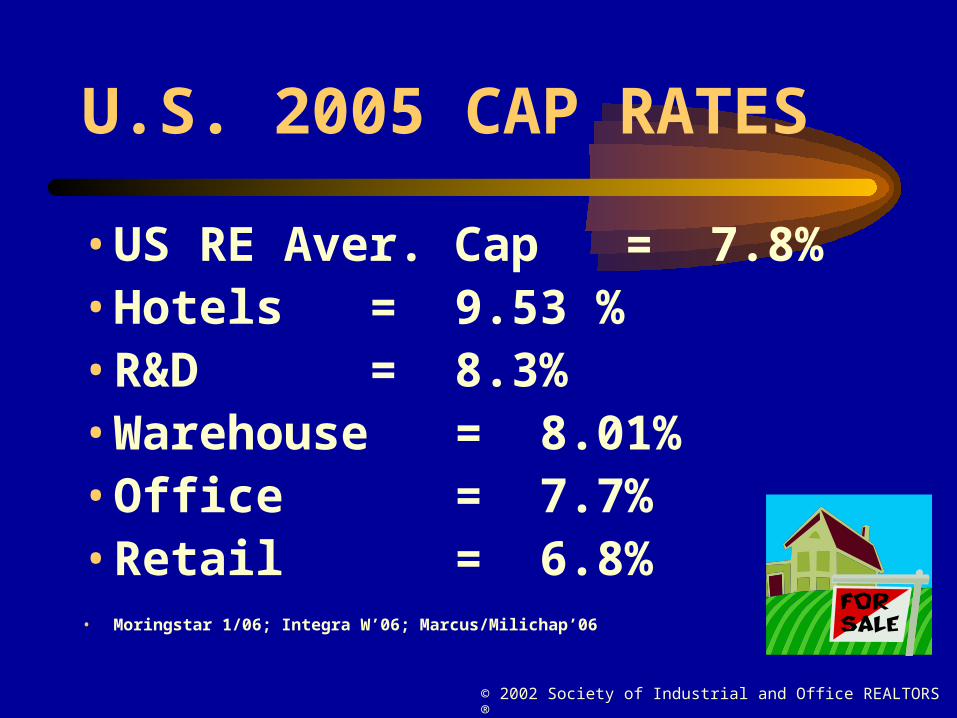
U.S. 2005 CAP RATES
• US RE Aver. Cap = 7.8%• Hotels = 9.53 % • R&D = 8.3%• Warehouse = 8.01% • Office = 7.7%• Retail = 6.8%• Moringstar 1/06; Integra W’06; Marcus/Milichap’06
© 2002 Society of Industrial and Office REALTORS®
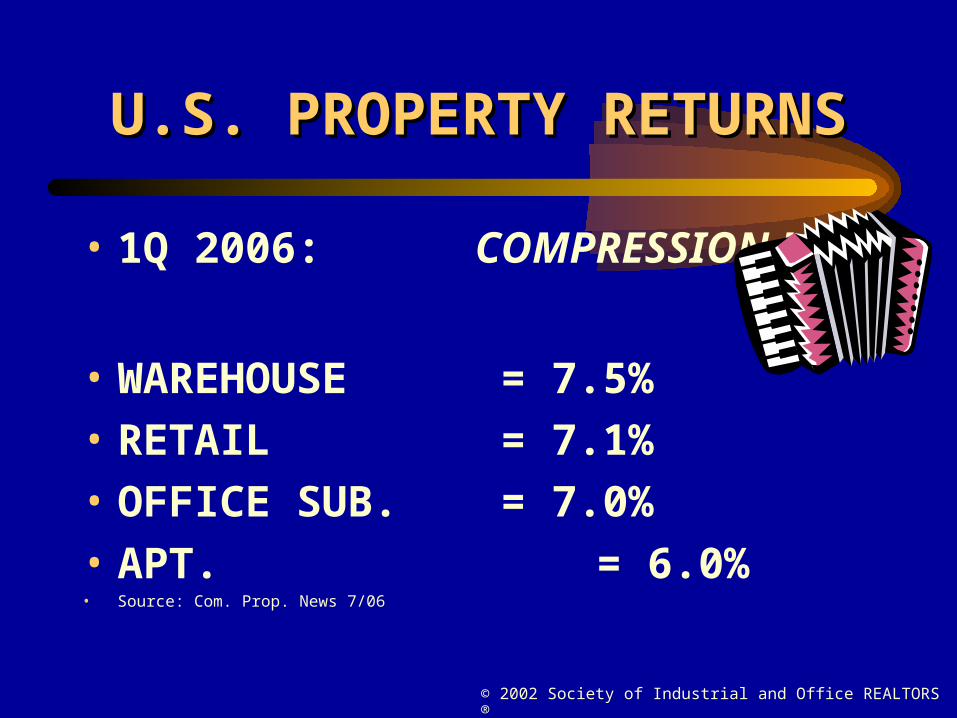
U.S. PROPERTY RETURNSU.S. PROPERTY RETURNS
• 1Q 2006: COMPRESSION !
• WAREHOUSE = 7.5%
• RETAIL = 7.1%
• OFFICE SUB. = 7.0%
• APT. = 6.0%• Source: Com. Prop. News 7/06
© 2002 Society of Industrial and Office REALTORS®
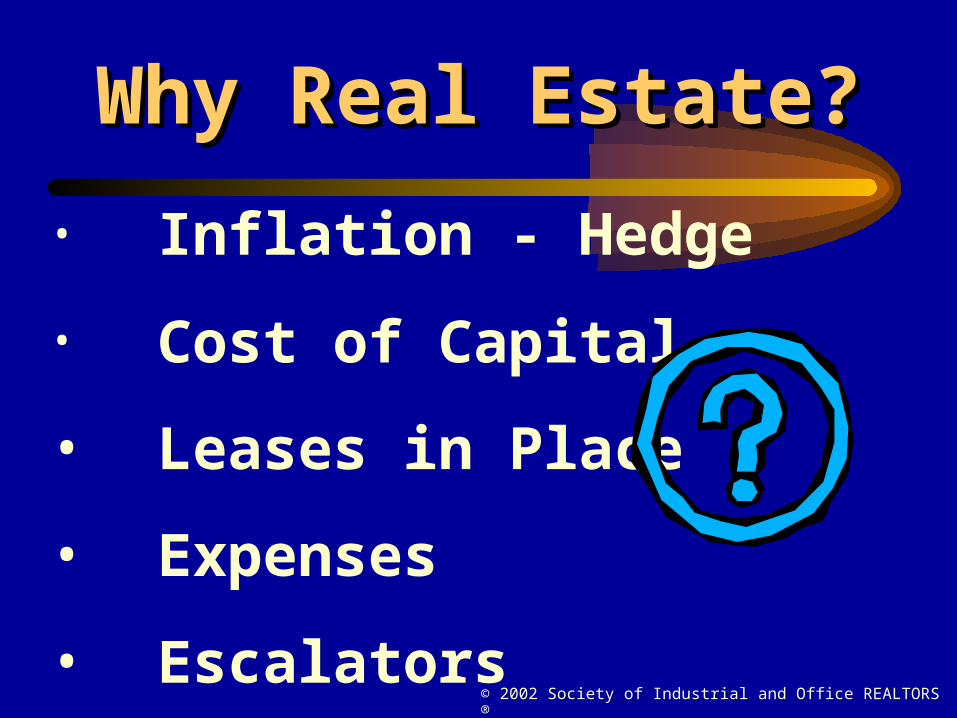
Why Real Estate?Why Real Estate?
• Inflation - Hedge
• Cost of Capital
• Leases in Place
• Expenses
• Escalators
© 2002 Society of Industrial and Office REALTORS®
WHY REAL ESTATE?
• No Taxes on Appreciation
• Less Volatile
• It is Cyclical: Bubbles
© 2002 Society of Industrial and Office REALTORS®
WHY REAL ESTATE?
• Stable Return
• Diversification
• Hard Assets vs. Financial
• High Yields
• No Scandals
© 2002 Society of Industrial and Office REALTORS®
WHY REAL ESTATE?
• It is Trust-Worthy
• Easy to Understand
• Positive Leverage
• Other Choices Still Stink !!! Source: CRE Dallas Convention-2002
© 2002 Society of Industrial and Office REALTORS®
DOWNSIDE: 2005
• Too Many Buyers
• Values Up/Cap Rates To 4.9-5% (1960’s/1981)
• Look at Tot. Returns/Not Caps• Source: Ken Riggs, 4/05 CRE; Sam Zell CRE Chicago ‘05
© 2002 Society of Industrial and Office REALTORS®
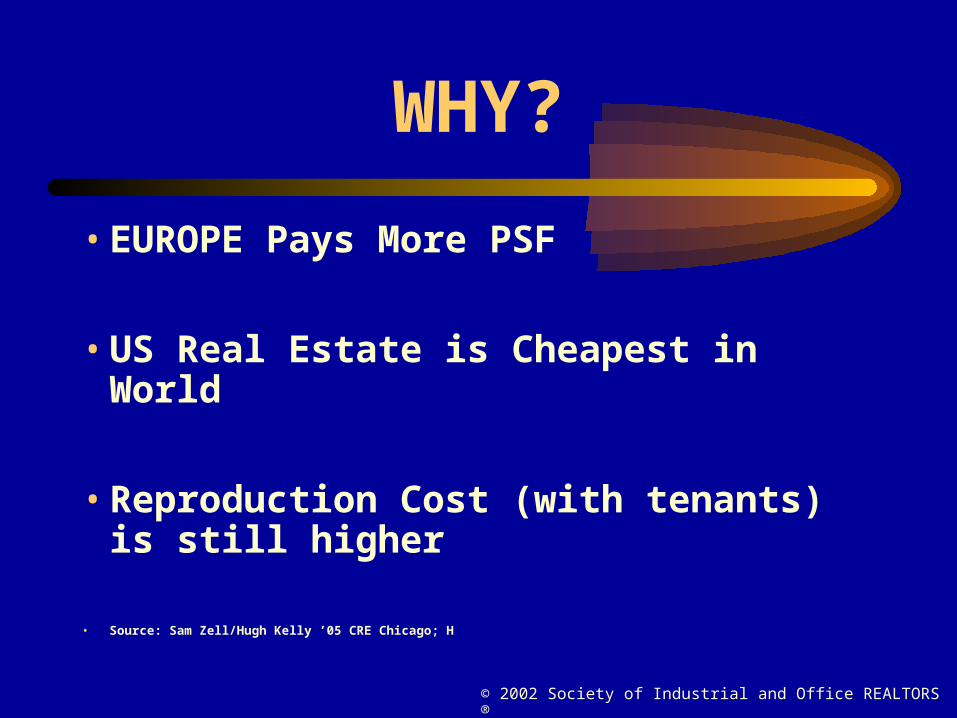
WHY?
• EUROPE Pays More PSF
• US Real Estate is Cheapest in World
• Reproduction Cost (with tenants) is still higher
• Source: Sam Zell/Hugh Kelly ’05 CRE Chicago; H
© 2002 Society of Industrial and Office REALTORS®
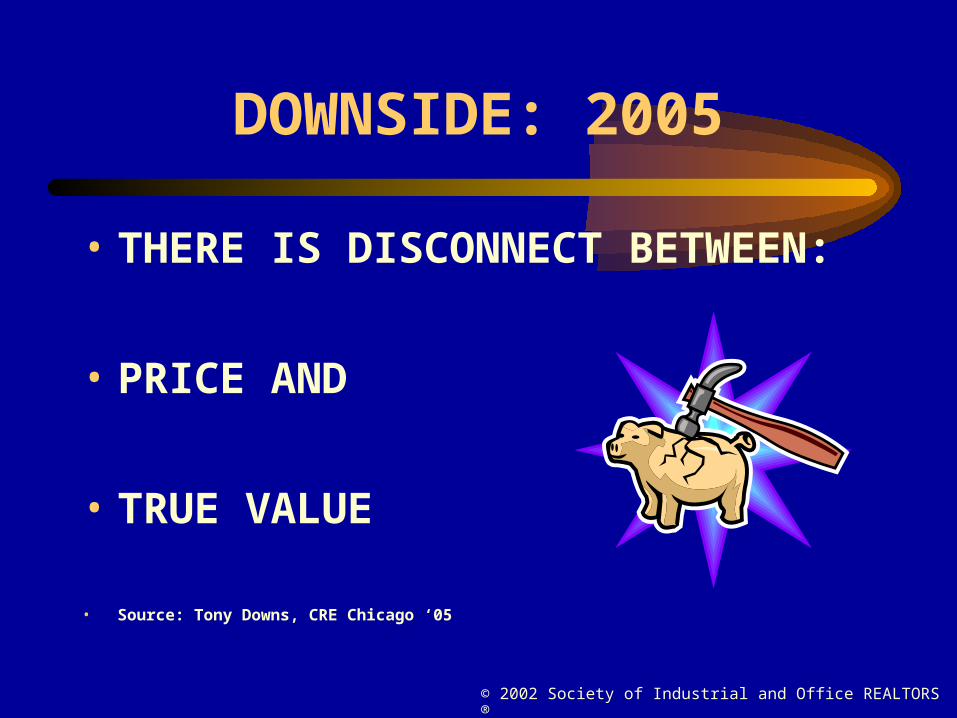
DOWNSIDE: 2005
• THERE IS DISCONNECT BETWEEN:
• PRICE AND
• TRUE VALUE
• Source: Tony Downs, CRE Chicago ‘05
© 2002 Society of Industrial and Office REALTORS®
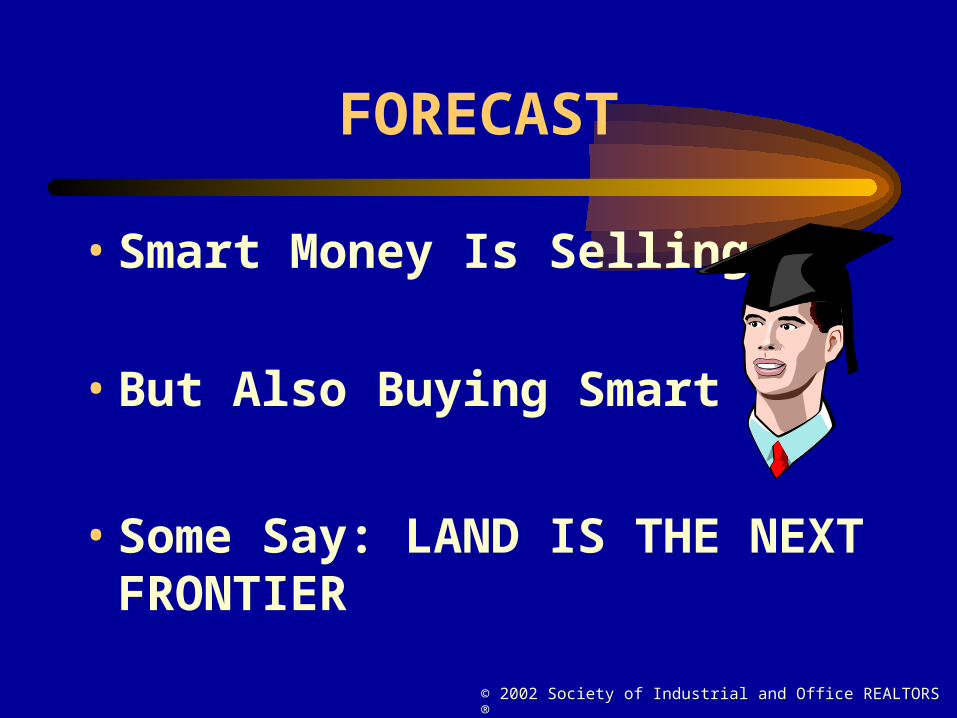
FORECAST
• Smart Money Is Selling
• But Also Buying Smart
• Some Say: LAND IS THE NEXT FRONTIER
© 2002 Society of Industrial and Office REALTORS®
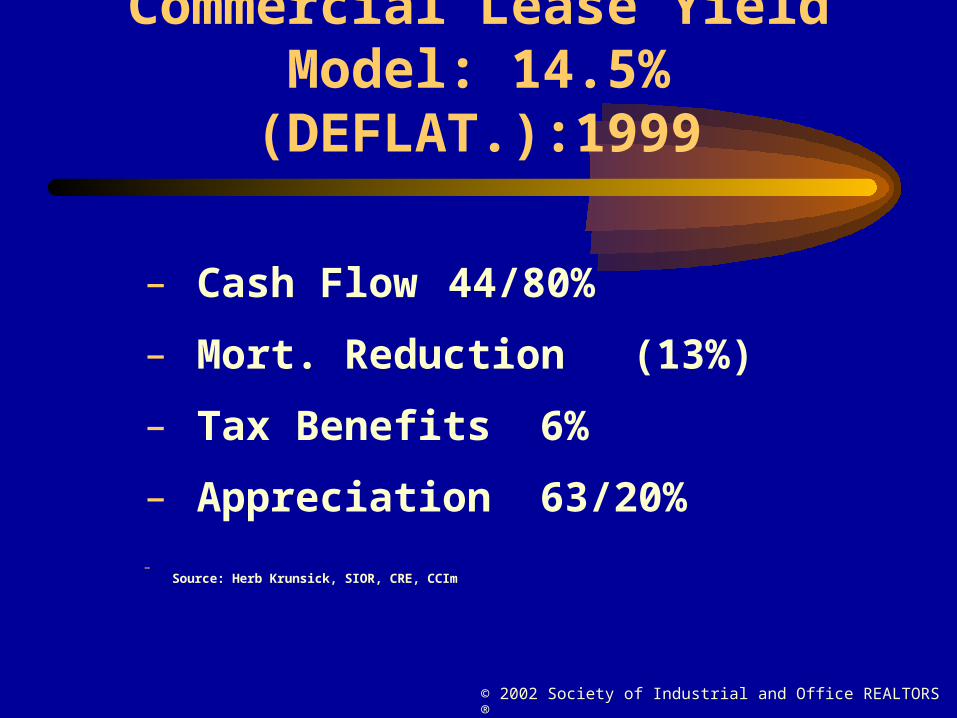
Commercial Lease Yield Model: 14.5% (DEFLAT.):1999
– Cash Flow 44/80%
– Mort. Reduction (13%)
– Tax Benefits 6%
– Appreciation 63/20%
–Source: Herb Krunsick, SIOR, CRE, CCIm
© 2002 Society of Industrial and Office REALTORS®
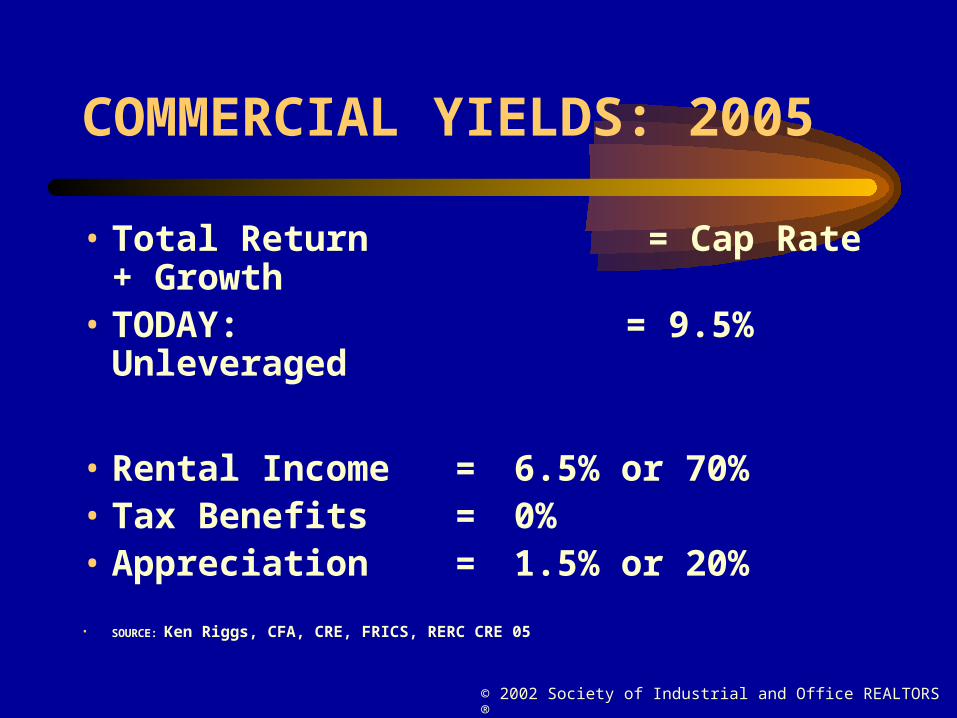
COMMERCIAL YIELDS: 2005
• Total Return = Cap Rate + Growth
• TODAY: = 9.5% Unleveraged
• Rental Income = 6.5% or 70%• Tax Benefits = 0%• Appreciation = 1.5% or 20%
• SOURCE: Ken Riggs, CFA, CRE, FRICS, RERC CRE 05
© 2002 Society of Industrial and Office REALTORS®
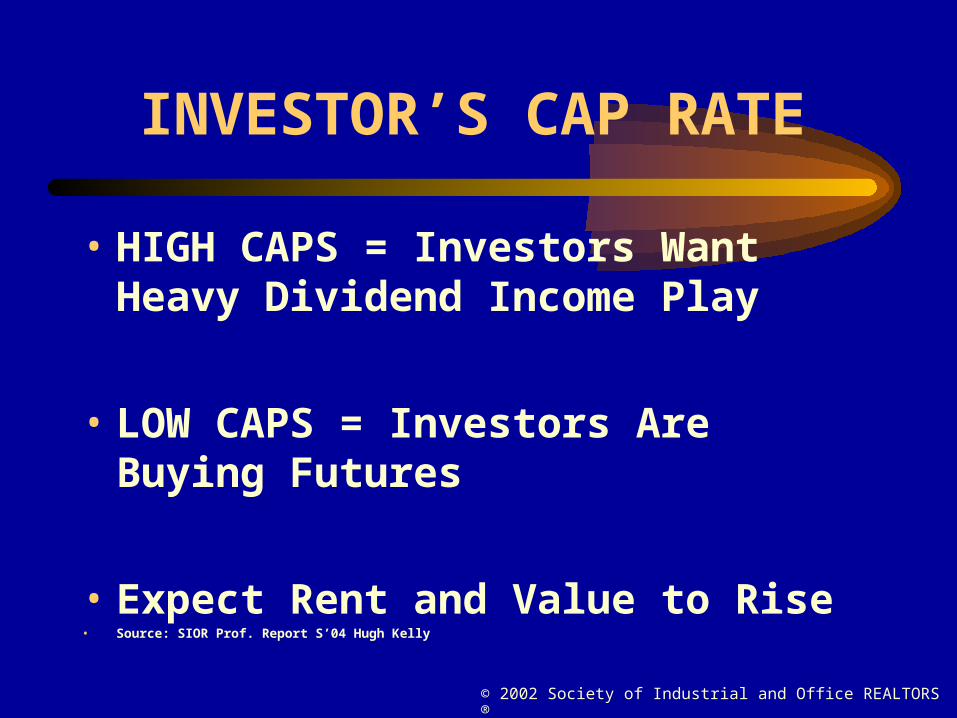
INVESTOR’S CAP RATE
• HIGH CAPS = Investors Want Heavy Dividend Income Play
• LOW CAPS = Investors Are Buying Futures
• Expect Rent and Value to Rise• Source: SIOR Prof. Report S’04 Hugh Kelly
© 2002 Society of Industrial and Office REALTORS®
DISCLAIMER
• CHAOS
• WAR
• GOVT. INTERVENTION
© 2002 Society of Industrial and Office REALTORS®
HAPPINESS DEFINED:
• EXPECTATION = REALITY
• OR
• REALITY IS GREATER THAN EXPECTATION
© 2002 Society of Industrial and Office REALTORS®
THANK YOU
SIOR SIOR