Stellar, solar, and lunar demonstrators -...
14
58 Stellar, solar, and lunar demonstrators Rosa M. Ros, Francis Berthomieu International Astronomical Union, Technical University of Catalonia (Barcelona, España), CLEA (Nice, France) Summary is worksheet presents a simple method to explain how the apparent motions of stars, the Sun, and the Moon are observed from different places on Earth. e procedure consists of building a simple model that allows us to demonstrate how these movements are ob- served from different latitudes. Goals Understand the apparent motions of stars as seen from different latitudes. Understand the apparent motions of the Sun as seen from different latitudes. Understand the Moon’s movement and shapes as seen from different latitudes. The idea behind the demonstrator It is not simple to explain how the apparent motions of the Sun, the Moon, or stars are observed from the Earth. Students know that the Sun rises and sets every day, but they are surprised to learn that the Sun rises and sets at a different point every day or that solar tra- jectories can vary according to the local latitude. e demonstrators simplify and explain the phenomenon of the midnight sun and the solar zenith passage. In particular, the demonstrators can be very useful for understanding the movement of translation and jus- tify some latitude differences. It is easy to remember the shape and appearance of each constellation by learning the mythological stories and memorizing the geometric rules for finding the constellation in the sky. However, this only works at a fixed location on Earth. Because of the motion of the Celestial Sphere, an observer that lives at the North Pole can see all the stars in the Northern Hemisphere and one who lives at the South Pole can see all the stars in the Southern Hemisphere. But what do observers see that live at different latitudes? The stellar demonstrator: why are there invisible stars? Everything gets complicated when the observer lives in a zone that is not one of the two poles. In fact, this is true for most observers. In this case, stars fall into three different categories depending on their observed motions (for each latitude): circumpolar stars, stars that rise and set, and invisible stars (figure 1). We all have experienced the surprise of discovering that one can see some stars of the Southern Hemisphere while living in the Northern Hemisphere. Of course it is similar to the surprise that it is felt when the phenom- enon of the midnight sun is discovered. Depending on their age, most students can understand fairly easily why some stars appear circumpolar from the city where they live. However, it is much more dif- ficult for them to imagine which ones would appear circumpolar as seen from other places in the world. If we ask whether one specific star (e.g., Sirius) appears to rise and set as seen from Buenos Aires, it is difficult for students to figure out the answer. erefore, we will use the stellar demonstrator to study the observed motions of different stars depending on the latitude of the place of observation. Fig. 1: Three different types of stars (as seen from a specific latitude): circumpolar, stars that rise and set, and invisible stars.
-
Upload
duonghuong -
Category
Documents
-
view
236 -
download
0
Transcript of Stellar, solar, and lunar demonstrators -...
58
Stellar, solar, andlunar demonstratorsRosa M. Ros, Francis BerthomieuInternational Astronomical Union, Technical University of Catalonia (Barcelona, España),
CLEA (Nice, France)
Summary�is worksheet presents a simple method to explain how the apparent motions of stars, the Sun, and the Moon are observed from different places on Earth. �e procedure consists of building a simple model that allows us to demonstrate how these movements are ob-served from different latitudes.
Goals Understand the apparent motions of stars as seen
from different latitudes. Understand the apparent motions of the Sun as seen
from different latitudes. Understand the Moon’s movement and shapes as seen
from different latitudes.
The idea behind the demonstratorIt is not simple to explain how the apparent motions of the Sun, the Moon, or stars are observed from the Earth. Students know that the Sun rises and sets every day, but they are surprised to learn that the Sun rises and sets at a different point every day or that solar tra-jectories can vary according to the local latitude. �e demonstrators simplify and explain the phenomenon of the midnight sun and the solar zenith passage. In particular, the demonstrators can be very useful for understanding the movement of translation and jus-tify some latitude differences.
It is easy to remember the shape and appearance of each constellation by learning the mythological stories and memorizing the geometric rules for finding the constellation in the sky. However, this only works at a fixed location on Earth. Because of the motion of the Celestial Sphere, an observer that lives at the North Pole can see all the stars in the Northern Hemisphere and one who lives at the South Pole can see all the stars in the Southern Hemisphere. But what do observers see that live at different latitudes?
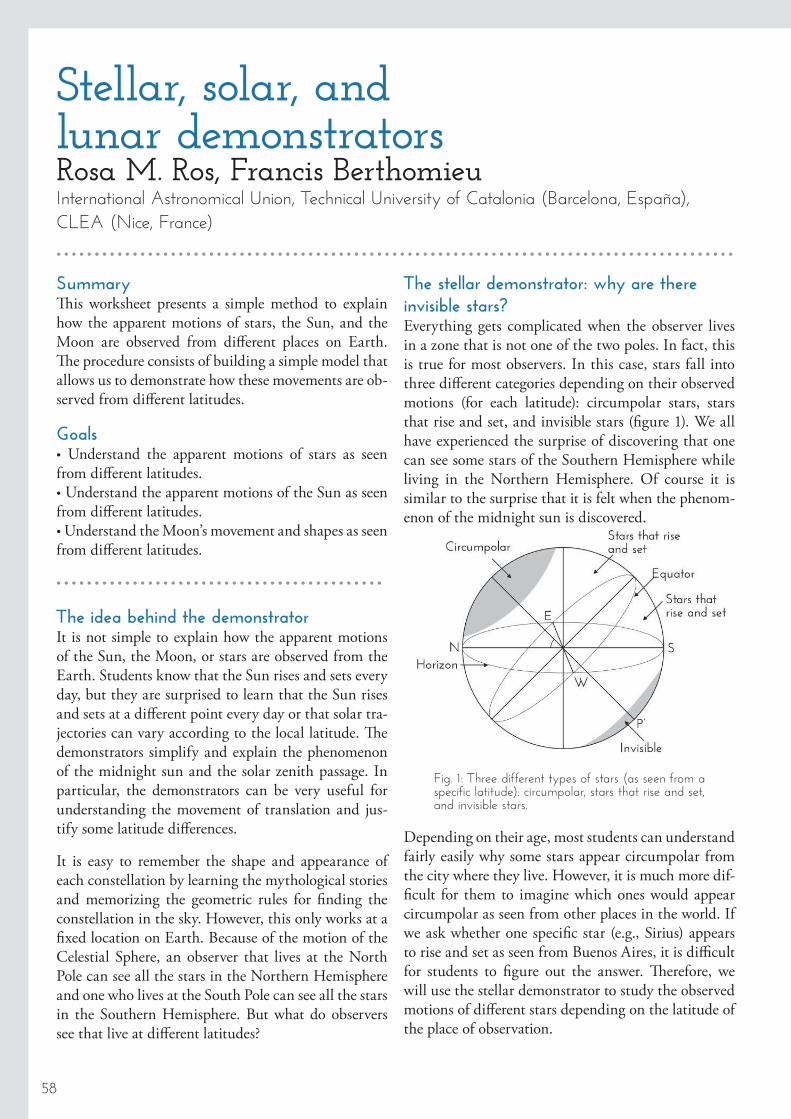
The stellar demonstrator: why are there invisible stars?Everything gets complicated when the observer lives in a zone that is not one of the two poles. In fact, this is true for most observers. In this case, stars fall into three different categories depending on their observed motions (for each latitude): circumpolar stars, stars that rise and set, and invisible stars (figure 1). We all have experienced the surprise of discovering that one can see some stars of the Southern Hemisphere while living in the Northern Hemisphere. Of course it is similar to the surprise that it is felt when the phenom-enon of the midnight sun is discovered.
Depending on their age, most students can understand fairly easily why some stars appear circumpolar from the city where they live. However, it is much more dif-ficult for them to imagine which ones would appear circumpolar as seen from other places in the world. If we ask whether one specific star (e.g., Sirius) appears to rise and set as seen from Buenos Aires, it is difficult for students to figure out the answer. �erefore, we will use the stellar demonstrator to study the observed motions of different stars depending on the latitude of the place of observation.
Fig. 1: Three different types of stars (as seen from a specific latitude): circumpolar, stars that rise and set, and invisible stars.
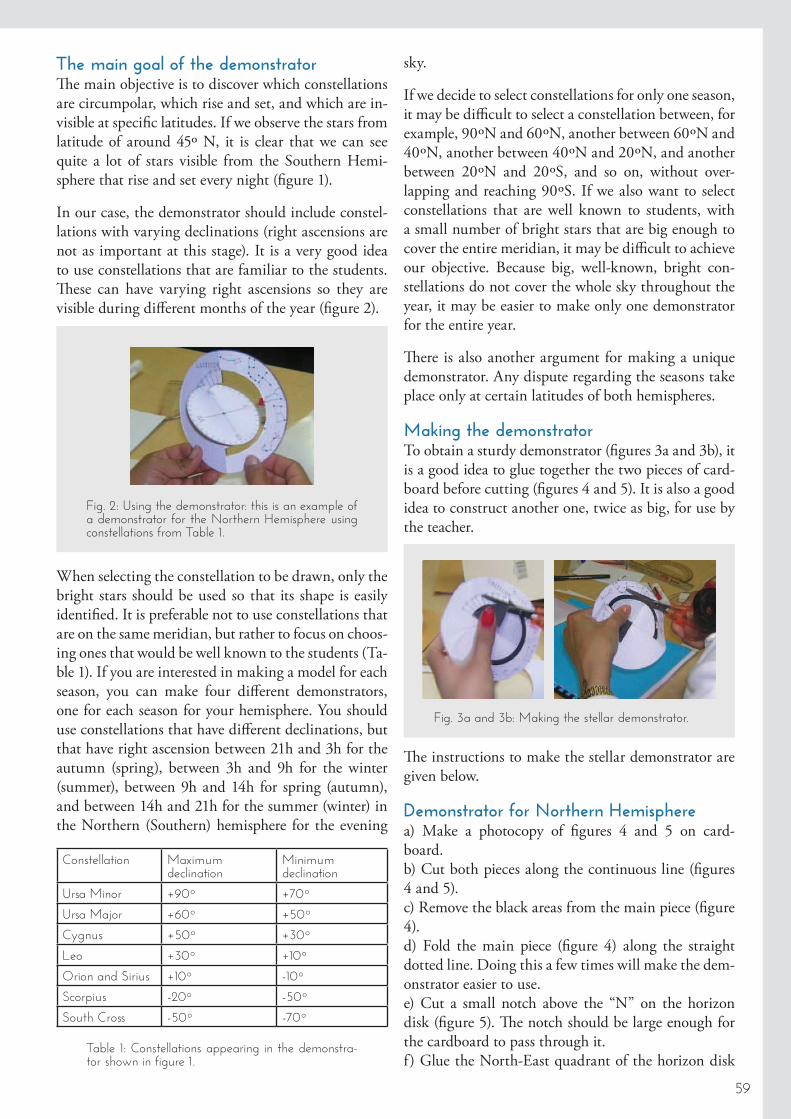
Fig. 2: Using the demonstrator: this is an example of a demonstrator for the Northern Hemisphere using constellations from Table 1.
Constellation Maximumdeclination
Minimumdeclination
Ursa Minor +90º +70º
Ursa Major +60º +50º
Cygnus +50º +30º
Leo +30º +10º
Orion and Sirius +10º -10º
Scorpius -20º -50º
South Cross -50º -70º
Table 1: Constellations appearing in the demonstra-tor shown in figure 1.
Fig. 3a and 3b: Making the stellar demonstrator.
59
The main goal of the demonstrator�e main objective is to discover which constellations are circumpolar, which rise and set, and which are in-visible at specific latitudes. If we observe the stars from latitude of around 45º N, it is clear that we can see quite a lot of stars visible from the Southern Hemi-sphere that rise and set every night (figure 1).
In our case, the demonstrator should include constel-lations with varying declinations (right ascensions are not as important at this stage). It is a very good idea to use constellations that are familiar to the students. �ese can have varying right ascensions so they are visible during different months of the year (figure 2).
When selecting the constellation to be drawn, only the bright stars should be used so that its shape is easily identified. It is preferable not to use constellations that are on the same meridian, but rather to focus on choos-ing ones that would be well known to the students (Ta-ble 1). If you are interested in making a model for each season, you can make four different demonstrators, one for each season for your hemisphere. You should use constellations that have different declinations, but that have right ascension between 21h and 3h for the autumn (spring), between 3h and 9h for the winter (summer), between 9h and 14h for spring (autumn), and between 14h and 21h for the summer (winter) in the Northern (Southern) hemisphere for the evening
sky.
If we decide to select constellations for only one season, it may be difficult to select a constellation between, for example, 90ºN and 60ºN, another between 60ºN and 40ºN, another between 40ºN and 20ºN, and another between 20ºN and 20ºS, and so on, without over-lapping and reaching 90ºS. If we also want to select constellations that are well known to students, with a small number of bright stars that are big enough to cover the entire meridian, it may be difficult to achieve our objective. Because big, well-known, bright con-stellations do not cover the whole sky throughout the year, it may be easier to make only one demonstrator for the entire year.
�ere is also another argument for making a unique demonstrator. Any dispute regarding the seasons take place only at certain latitudes of both hemispheres.
Making the demonstratorTo obtain a sturdy demonstrator (figures 3a and 3b), it is a good idea to glue together the two pieces of card-board before cutting (figures 4 and 5). It is also a good idea to construct another one, twice as big, for use by the teacher.
�e instructions to make the stellar demonstrator are given below.
Demonstrator for Northern Hemispherea) Make a photocopy of figures 4 and 5 on card-board.b) Cut both pieces along the continuous line (figures 4 and 5).c) Remove the black areas from the main piece (figure 4).d) Fold the main piece (figure 4) along the straight dotted line. Doing this a few times will make the dem-onstrator easier to use.e) Cut a small notch above the “N” on the horizon disk (figure 5). �e notch should be large enough for the cardboard to pass through it. f) Glue the North-East quadrant of the horizon disk
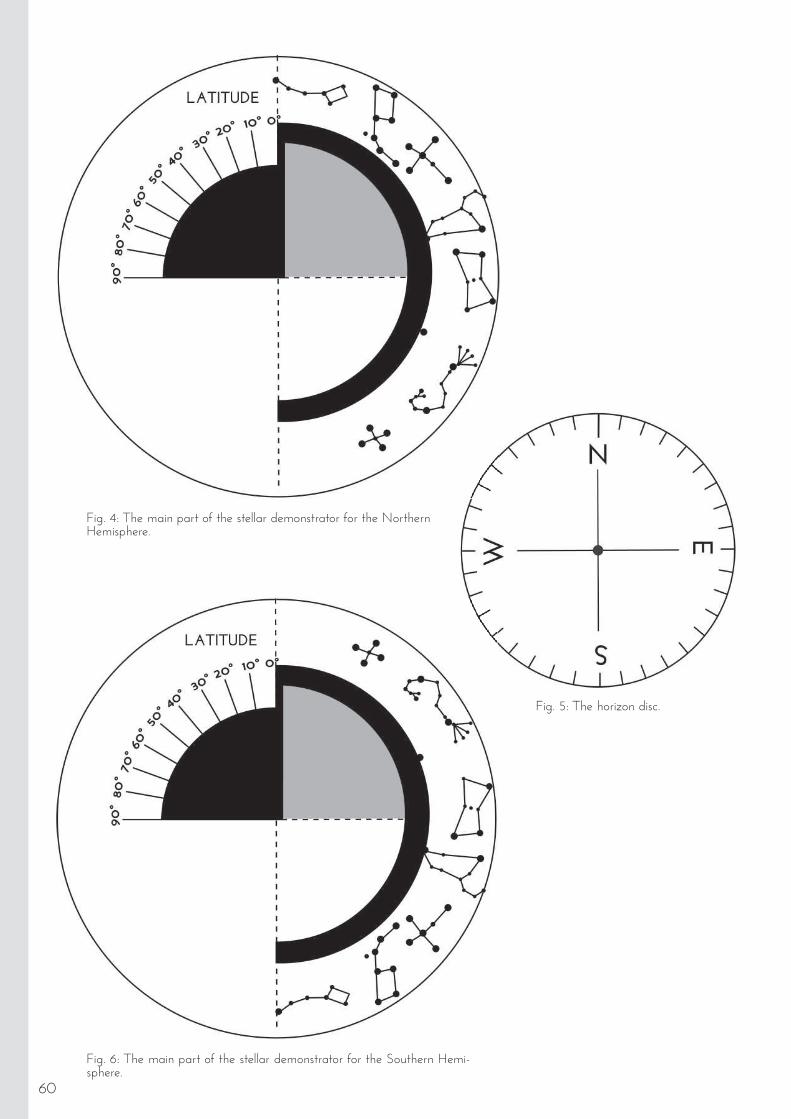
Fig. 6: The main part of the stellar demonstrator for the Southern Hemi-sphere.
Fig. 4: The main part of the stellar demonstrator for the Northern Hemisphere.
Fig. 5: The horizon disc.
60
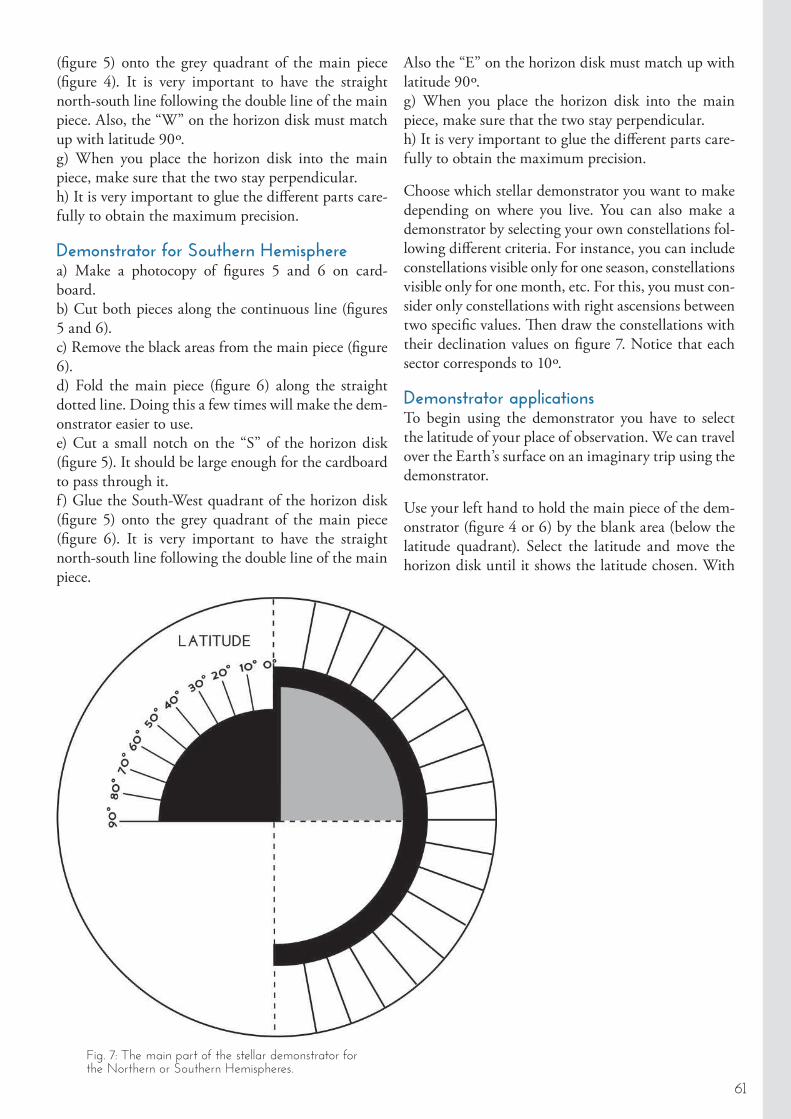
Fig. 7: The main part of the stellar demonstrator for the Northern or Southern Hemispheres.
61
Also the “E” on the horizon disk must match up with latitude 90º.g) When you place the horizon disk into the main piece, make sure that the two stay perpendicular.h) It is very important to glue the different parts care-fully to obtain the maximum precision.
Choose which stellar demonstrator you want to make depending on where you live. You can also make a demonstrator by selecting your own constellations fol-lowing different criteria. For instance, you can include constellations visible only for one season, constellations visible only for one month, etc. For this, you must con-sider only constellations with right ascensions between two specific values. �en draw the constellations with their declination values on figure 7. Notice that each sector corresponds to 10º.
Demonstrator applications To begin using the demonstrator you have to select the latitude of your place of observation. We can travel over the Earth’s surface on an imaginary trip using the demonstrator.
Use your left hand to hold the main piece of the dem-onstrator (figure 4 or 6) by the blank area (below the latitude quadrant). Select the latitude and move the horizon disk until it shows the latitude chosen. With
(figure 5) onto the grey quadrant of the main piece (figure 4). It is very important to have the straight north-south line following the double line of the main piece. Also, the “W” on the horizon disk must match up with latitude 90º.g) When you place the horizon disk into the main piece, make sure that the two stay perpendicular. h) It is very important to glue the different parts care-fully to obtain the maximum precision.
Demonstrator for Southern Hemispherea) Make a photocopy of figures 5 and 6 on card-board.b) Cut both pieces along the continuous line (figures 5 and 6).c) Remove the black areas from the main piece (figure 6).d) Fold the main piece (figure 6) along the straight dotted line. Doing this a few times will make the dem-onstrator easier to use.e) Cut a small notch on the “S” of the horizon disk (figure 5). It should be large enough for the cardboard to pass through it.f) Glue the South-West quadrant of the horizon disk (figure 5) onto the grey quadrant of the main piece (figure 6). It is very important to have the straight north-south line following the double line of the main piece.
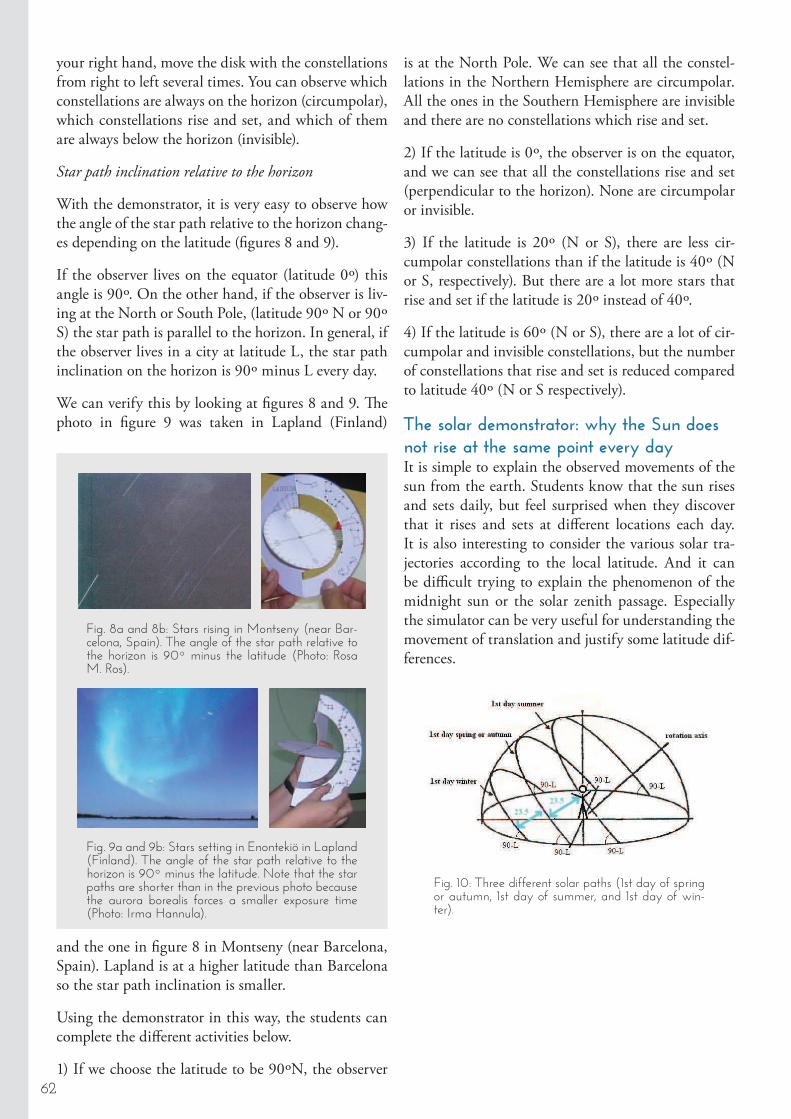
Fig. 8a and 8b: Stars rising in Montseny (near Bar-celona, Spain). The angle of the star path relative to the horizon is 90º minus the latitude (Photo: Rosa M. Ros).
Fig. 10: Three different solar paths (1st day of spring or autumn, 1st day of summer, and 1st day of win-ter).
Fig. 9a and 9b: Stars setting in Enontekiö in Lapland (Finland). The angle of the star path relative to the horizon is 90º minus the latitude. Note that the star paths are shorter than in the previous photo because the aurora borealis forces a smaller exposure time (Photo: Irma Hannula).
62
your right hand, move the disk with the constellations from right to left several times. You can observe which constellations are always on the horizon (circumpolar), which constellations rise and set, and which of them are always below the horizon (invisible).
Star path inclination relative to the horizon
With the demonstrator, it is very easy to observe how the angle of the star path relative to the horizon chang-es depending on the latitude (figures 8 and 9).
If the observer lives on the equator (latitude 0º) this angle is 90º. On the other hand, if the observer is liv-ing at the North or South Pole, (latitude 90º N or 90º S) the star path is parallel to the horizon. In general, if the observer lives in a city at latitude L, the star path inclination on the horizon is 90º minus L every day.
We can verify this by looking at figures 8 and 9. !e photo in figure 9 was taken in Lapland (Finland)
and the one in figure 8 in Montseny (near Barcelona, Spain). Lapland is at a higher latitude than Barcelona so the star path inclination is smaller.
Using the demonstrator in this way, the students can complete the different activities below.
1) If we choose the latitude to be 90ºN, the observer
is at the North Pole. We can see that all the constel-lations in the Northern Hemisphere are circumpolar. All the ones in the Southern Hemisphere are invisible and there are no constellations which rise and set.
2) If the latitude is 0º, the observer is on the equator, and we can see that all the constellations rise and set (perpendicular to the horizon). None are circumpolar or invisible.
3) If the latitude is 20º (N or S), there are less cir-cumpolar constellations than if the latitude is 40º (N or S, respectively). But there are a lot more stars that rise and set if the latitude is 20º instead of 40º.
4) If the latitude is 60º (N or S), there are a lot of cir-cumpolar and invisible constellations, but the number of constellations that rise and set is reduced compared to latitude 40º (N or S respectively).
The solar demonstrator: why the Sun does not rise at the same point every dayIt is simple to explain the observed movements of the sun from the earth. Students know that the sun rises and sets daily, but feel surprised when they discover that it rises and sets at different locations each day. It is also interesting to consider the various solar tra-jectories according to the local latitude. And it can be difficult trying to explain the phenomenon of the midnight sun or the solar zenith passage. Especially the simulator can be very useful for understanding the movement of translation and justify some latitude dif-ferences.
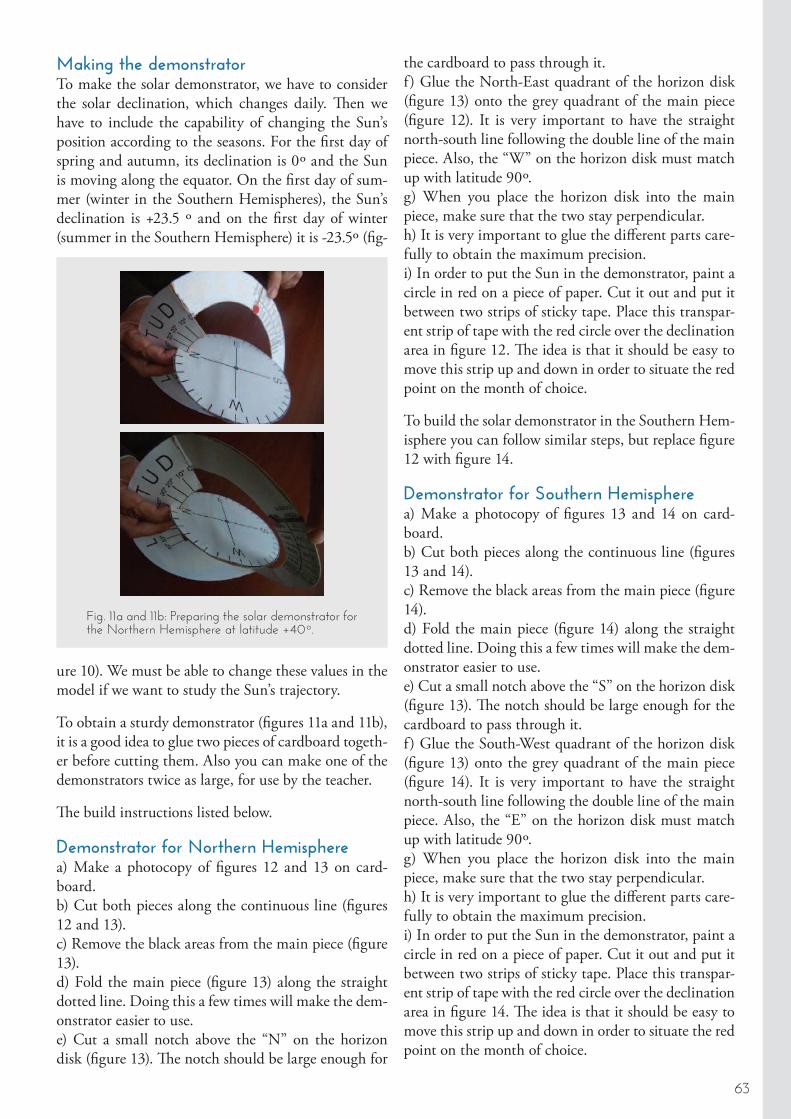
Fig. 11a and 11b: Preparing the solar demonstrator for the Northern Hemisphere at latitude +40º.
63
ure 10). We must be able to change these values in the model if we want to study the Sun’s trajectory.
To obtain a sturdy demonstrator (figures 11a and 11b), it is a good idea to glue two pieces of cardboard togeth-er before cutting them. Also you can make one of the demonstrators twice as large, for use by the teacher.
�e build instructions listed below.
Demonstrator for Northern Hemispherea) Make a photocopy of figures 12 and 13 on card-board.b) Cut both pieces along the continuous line (figures 12 and 13).c) Remove the black areas from the main piece (figure 13).d) Fold the main piece (figure 13) along the straight dotted line. Doing this a few times will make the dem-onstrator easier to use.e) Cut a small notch above the “N” on the horizon disk (figure 13). �e notch should be large enough for
Making the demonstratorTo make the solar demonstrator, we have to consider the solar declination, which changes daily. �en we have to include the capability of changing the Sun’s position according to the seasons. For the first day of spring and autumn, its declination is 0º and the Sun is moving along the equator. On the first day of sum-mer (winter in the Southern Hemispheres), the Sun’s declination is +23.5 º and on the first day of winter (summer in the Southern Hemisphere) it is -23.5º (fig-
the cardboard to pass through it. f) Glue the North-East quadrant of the horizon disk (figure 13) onto the grey quadrant of the main piece (figure 12). It is very important to have the straight north-south line following the double line of the main piece. Also, the “W” on the horizon disk must match up with latitude 90º.g) When you place the horizon disk into the main piece, make sure that the two stay perpendicular. h) It is very important to glue the different parts care-fully to obtain the maximum precision.i) In order to put the Sun in the demonstrator, paint a circle in red on a piece of paper. Cut it out and put it between two strips of sticky tape. Place this transpar-ent strip of tape with the red circle over the declination area in figure 12. �e idea is that it should be easy to move this strip up and down in order to situate the red point on the month of choice.
To build the solar demonstrator in the Southern Hem-isphere you can follow similar steps, but replace figure 12 with figure 14.
Demonstrator for Southern Hemispherea) Make a photocopy of figures 13 and 14 on card-board.b) Cut both pieces along the continuous line (figures 13 and 14).c) Remove the black areas from the main piece (figure 14).d) Fold the main piece (figure 14) along the straight dotted line. Doing this a few times will make the dem-onstrator easier to use.e) Cut a small notch above the “S” on the horizon disk (figure 13). �e notch should be large enough for the cardboard to pass through it. f) Glue the South-West quadrant of the horizon disk (figure 13) onto the grey quadrant of the main piece (figure 14). It is very important to have the straight north-south line following the double line of the main piece. Also, the “E” on the horizon disk must match up with latitude 90º.g) When you place the horizon disk into the main piece, make sure that the two stay perpendicular. h) It is very important to glue the different parts care-fully to obtain the maximum precision.i) In order to put the Sun in the demonstrator, paint a circle in red on a piece of paper. Cut it out and put it between two strips of sticky tape. Place this transpar-ent strip of tape with the red circle over the declination area in figure 14. �e idea is that it should be easy to move this strip up and down in order to situate the red point on the month of choice.
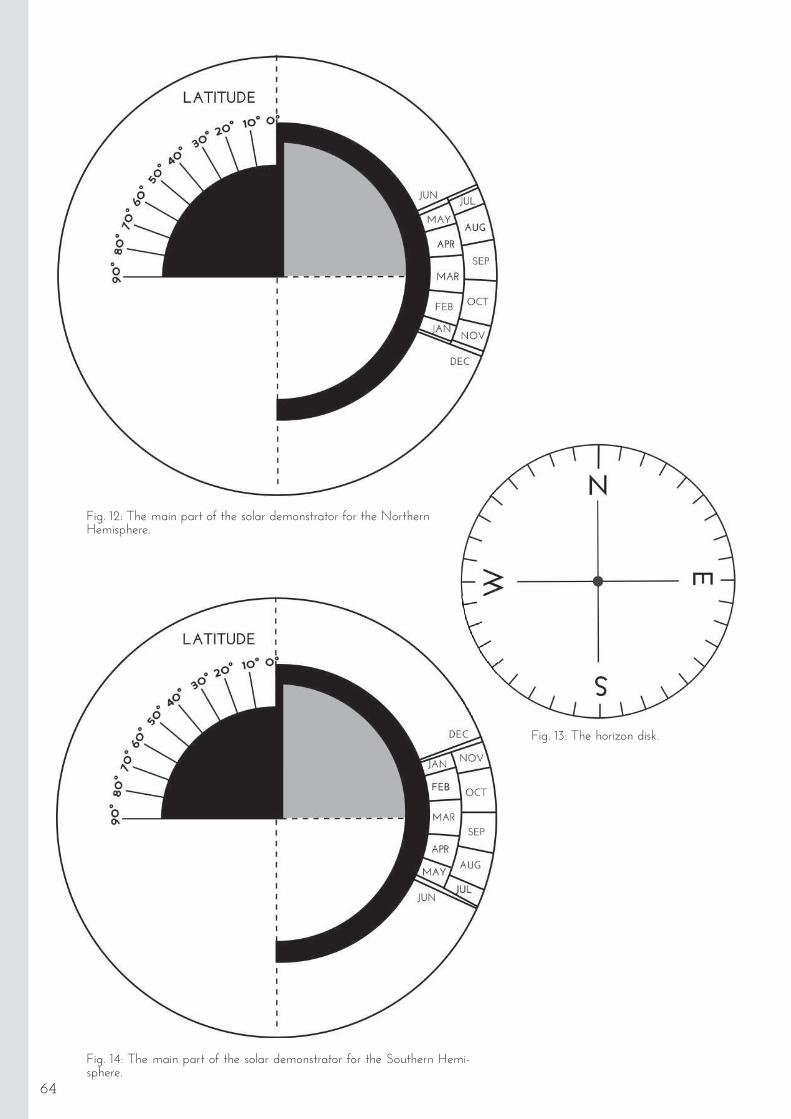
Fig. 14: The main part of the solar demonstrator for the Southern Hemi-sphere.
Fig. 12: The main part of the solar demonstrator for the Northern Hemisphere.
Fig. 13: The horizon disk.
64
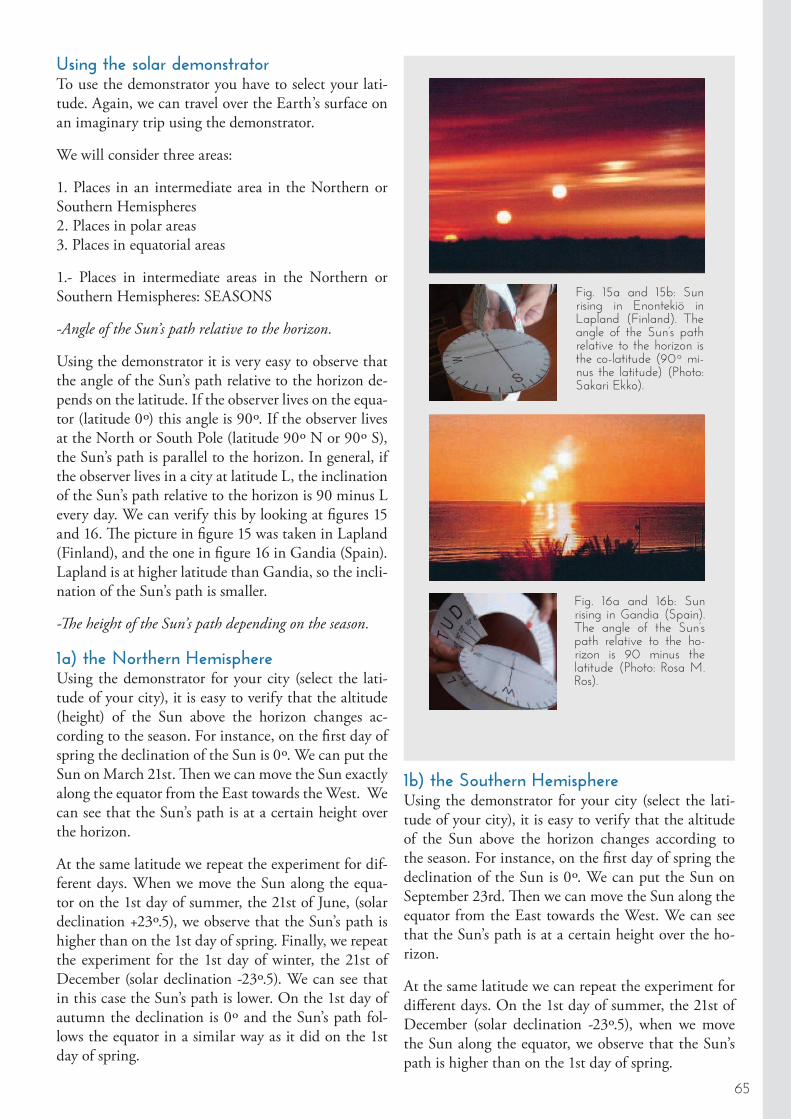
Fig. 15a and 15b: Sun rising in Enontekiö in Lapland (Finland). The angle of the Sun’s path relative to the horizon is the co-latitude (90º mi-nus the latitude) (Photo: Sakari Ekko).
Fig. 16a and 16b: Sun rising in Gandia (Spain). The angle of the Sun’s path relative to the ho-rizon is 90 minus the latitude (Photo: Rosa M. Ros).
65
Using the solar demonstrator To use the demonstrator you have to select your lati-tude. Again, we can travel over the Earth’s surface on an imaginary trip using the demonstrator.
We will consider three areas:
1. Places in an intermediate area in the Northern or Southern Hemispheres2. Places in polar areas 3. Places in equatorial areas
1.- Places in intermediate areas in the Northern or Southern Hemispheres: SEASONS
-Angle of the Sun’s path relative to the horizon.
Using the demonstrator it is very easy to observe that the angle of the Sun’s path relative to the horizon de-pends on the latitude. If the observer lives on the equa-tor (latitude 0º) this angle is 90º. If the observer lives at the North or South Pole (latitude 90º N or 90º S), the Sun’s path is parallel to the horizon. In general, if the observer lives in a city at latitude L, the inclination of the Sun’s path relative to the horizon is 90 minus L every day. We can verify this by looking at figures 15 and 16. !e picture in figure 15 was taken in Lapland (Finland), and the one in figure 16 in Gandia (Spain). Lapland is at higher latitude than Gandia, so the incli-nation of the Sun’s path is smaller.
-!e height of the Sun’s path depending on the season.
1a) the Northern HemisphereUsing the demonstrator for your city (select the lati-tude of your city), it is easy to verify that the altitude (height) of the Sun above the horizon changes ac-cording to the season. For instance, on the first day of spring the declination of the Sun is 0º. We can put the Sun on March 21st. !en we can move the Sun exactly along the equator from the East towards the West. We can see that the Sun’s path is at a certain height over the horizon.
At the same latitude we repeat the experiment for dif-ferent days. When we move the Sun along the equa-tor on the 1st day of summer, the 21st of June, (solar declination +23º.5), we observe that the Sun’s path is higher than on the 1st day of spring. Finally, we repeat the experiment for the 1st day of winter, the 21st of December (solar declination -23º.5). We can see that in this case the Sun’s path is lower. On the 1st day of autumn the declination is 0º and the Sun’s path fol-lows the equator in a similar way as it did on the 1st day of spring.
1b) the Southern HemisphereUsing the demonstrator for your city (select the lati-tude of your city), it is easy to verify that the altitude of the Sun above the horizon changes according to the season. For instance, on the first day of spring the declination of the Sun is 0º. We can put the Sun on September 23rd. !en we can move the Sun along the equator from the East towards the West. We can see that the Sun’s path is at a certain height over the ho-rizon.
At the same latitude we can repeat the experiment for different days. On the 1st day of summer, the 21st of December (solar declination -23º.5), when we move the Sun along the equator, we observe that the Sun’s path is higher than on the 1st day of spring.
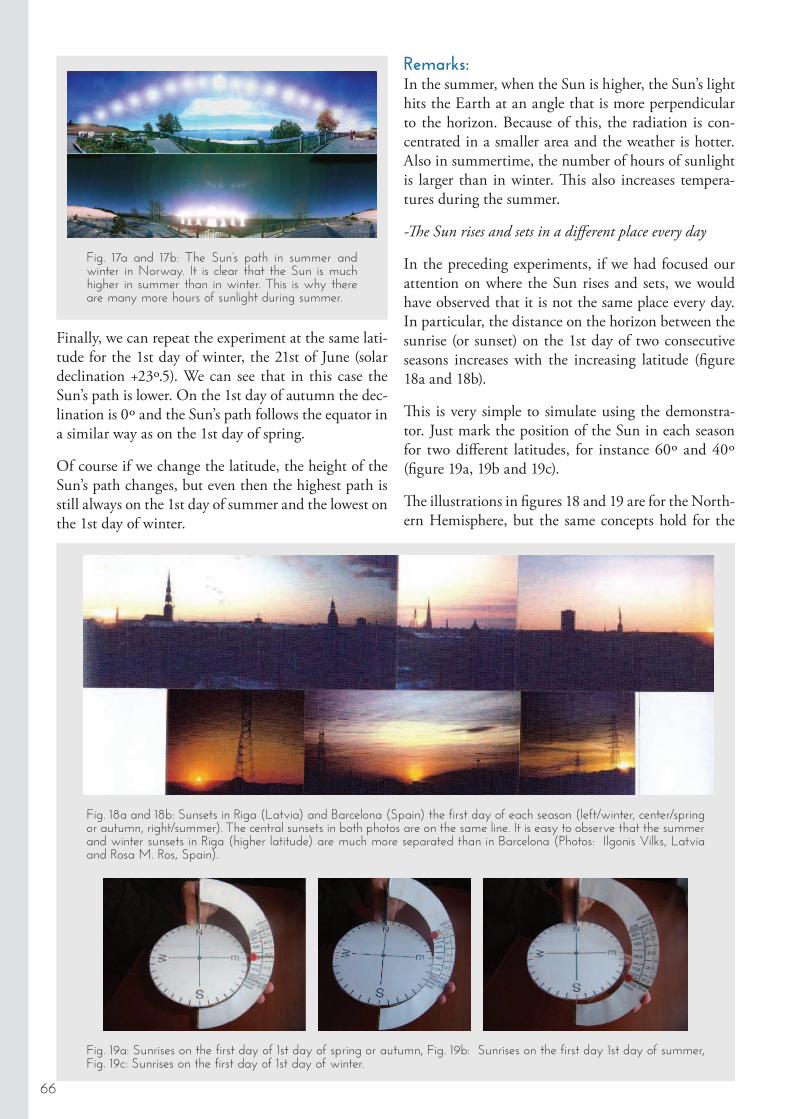
Fig. 17a and 17b: The Sun’s path in summer and winter in Norway. It is clear that the Sun is much higher in summer than in winter. This is why there are many more hours of sunlight during summer.
Fig. 18a and 18b: Sunsets in Riga (Latvia) and Barcelona (Spain) the first day of each season (left/winter, center/spring or autumn, right/summer). The central sunsets in both photos are on the same line. It is easy to observe that the summer and winter sunsets in Riga (higher latitude) are much more separated than in Barcelona (Photos: Ilgonis Vilks, Latvia and Rosa M. Ros, Spain).
Fig. 19a: Sunrises on the first day of 1st day of spring or autumn, Fig. 19b: Sunrises on the first day 1st day of summer, Fig. 19c: Sunrises on the first day of 1st day of winter.
66
Finally, we can repeat the experiment at the same lati-tude for the 1st day of winter, the 21st of June (solar declination +23º.5). We can see that in this case the Sun’s path is lower. On the 1st day of autumn the dec-lination is 0º and the Sun’s path follows the equator in a similar way as on the 1st day of spring.
Of course if we change the latitude, the height of the Sun’s path changes, but even then the highest path is still always on the 1st day of summer and the lowest on the 1st day of winter.
Remarks: In the summer, when the Sun is higher, the Sun’s light hits the Earth at an angle that is more perpendicular to the horizon. Because of this, the radiation is con-centrated in a smaller area and the weather is hotter. Also in summertime, the number of hours of sunlight is larger than in winter. !is also increases tempera-tures during the summer.
-�e Sun rises and sets in a different place every day
In the preceding experiments, if we had focused our attention on where the Sun rises and sets, we would have observed that it is not the same place every day. In particular, the distance on the horizon between the sunrise (or sunset) on the 1st day of two consecutive seasons increases with the increasing latitude (figure 18a and 18b).
!is is very simple to simulate using the demonstra-tor. Just mark the position of the Sun in each season for two different latitudes, for instance 60º and 40º (figure 19a, 19b and 19c).
!e illustrations in figures 18 and 19 are for the North-ern Hemisphere, but the same concepts hold for the
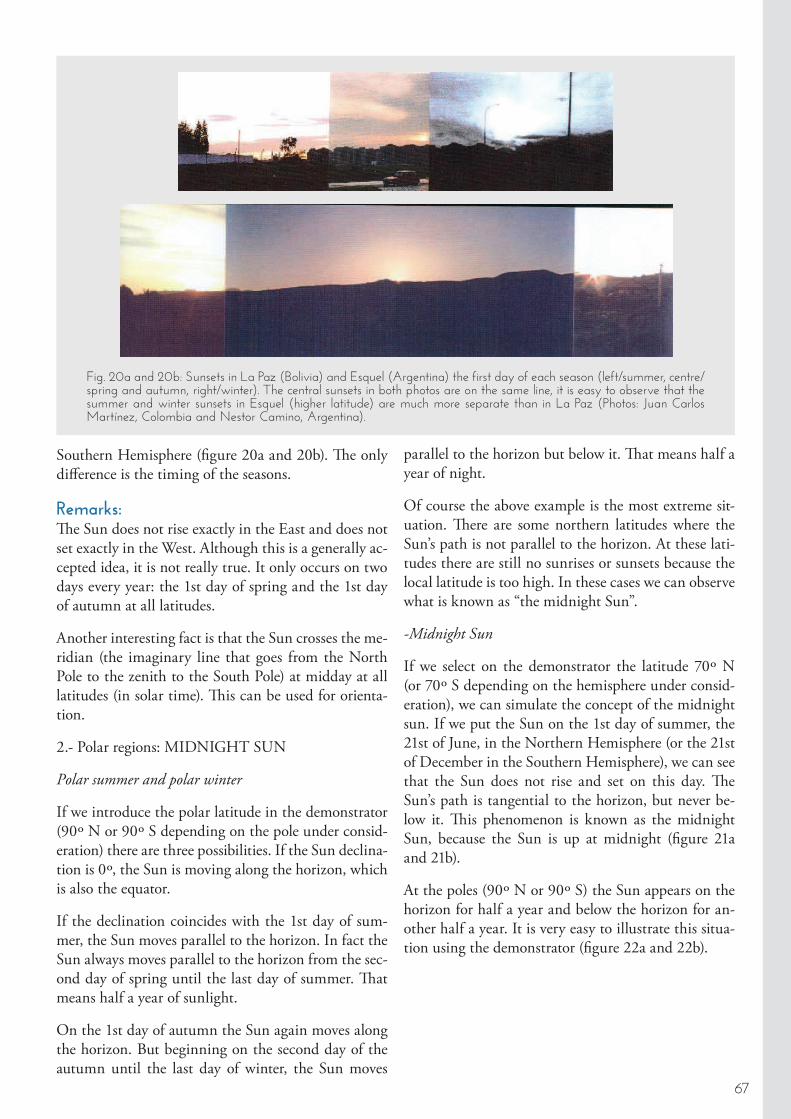
Fig. 20a and 20b: Sunsets in La Paz (Bolivia) and Esquel (Argentina) the first day of each season (left/summer, centre/spring and autumn, right/winter). The central sunsets in both photos are on the same line, it is easy to observe that the summer and winter sunsets in Esquel (higher latitude) are much more separate than in La Paz (Photos: Juan Carlos Martínez, Colombia and Nestor Camino, Argentina).
67
Southern Hemisphere (figure 20a and 20b). �e only difference is the timing of the seasons.
Remarks: �e Sun does not rise exactly in the East and does not set exactly in the West. Although this is a generally ac-cepted idea, it is not really true. It only occurs on two days every year: the 1st day of spring and the 1st day of autumn at all latitudes.
Another interesting fact is that the Sun crosses the me-ridian (the imaginary line that goes from the North Pole to the zenith to the South Pole) at midday at all latitudes (in solar time). �is can be used for orienta-tion.
2.- Polar regions: MIDNIGHT SUN
Polar summer and polar winter
If we introduce the polar latitude in the demonstrator (90º N or 90º S depending on the pole under consid-eration) there are three possibilities. If the Sun declina-tion is 0º, the Sun is moving along the horizon, which is also the equator.
If the declination coincides with the 1st day of sum-mer, the Sun moves parallel to the horizon. In fact the Sun always moves parallel to the horizon from the sec-ond day of spring until the last day of summer. �at means half a year of sunlight.
On the 1st day of autumn the Sun again moves along the horizon. But beginning on the second day of the autumn until the last day of winter, the Sun moves
parallel to the horizon but below it. �at means half a year of night.
Of course the above example is the most extreme sit-uation. �ere are some northern latitudes where the Sun’s path is not parallel to the horizon. At these lati-tudes there are still no sunrises or sunsets because the local latitude is too high. In these cases we can observe what is known as “the midnight Sun”.
-Midnight Sun
If we select on the demonstrator the latitude 70º N (or 70º S depending on the hemisphere under consid-eration), we can simulate the concept of the midnight sun. If we put the Sun on the 1st day of summer, the 21st of June, in the Northern Hemisphere (or the 21st of December in the Southern Hemisphere), we can see that the Sun does not rise and set on this day. �e Sun’s path is tangential to the horizon, but never be-low it. �is phenomenon is known as the midnight Sun, because the Sun is up at midnight (figure 21a and 21b).
At the poles (90º N or 90º S) the Sun appears on the horizon for half a year and below the horizon for an-other half a year. It is very easy to illustrate this situa-tion using the demonstrator (figure 22a and 22b).
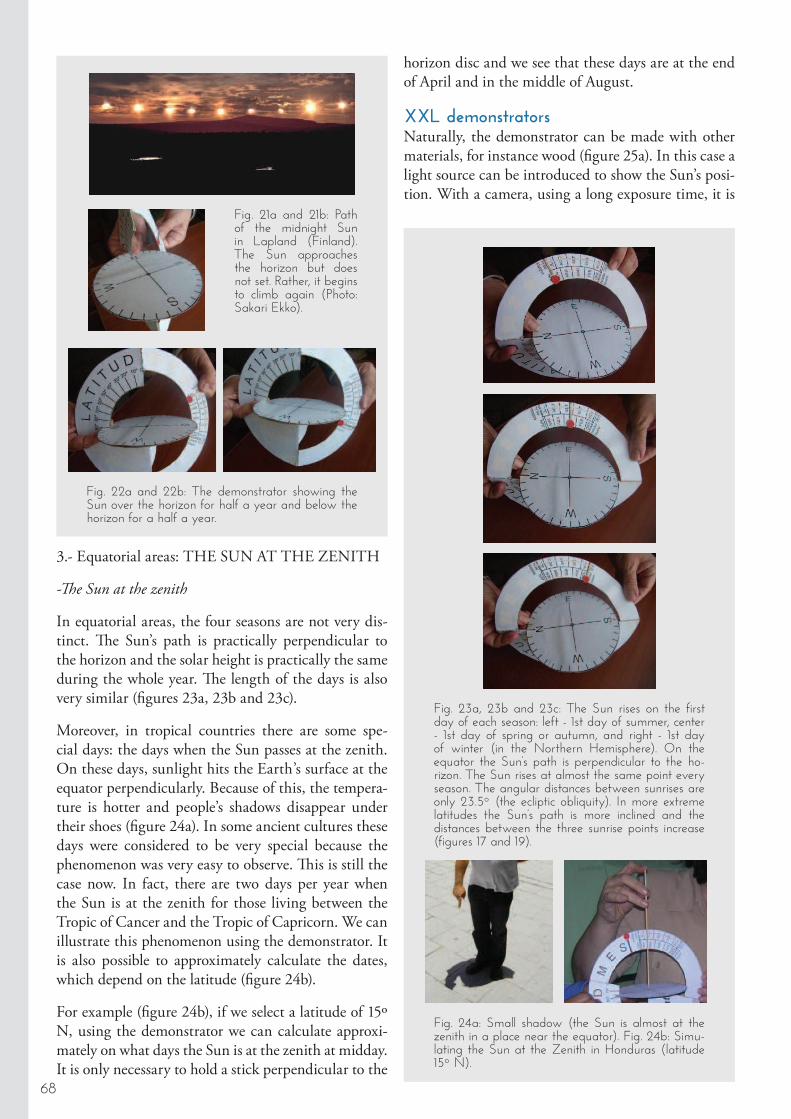
Fig. 21a and 21b: Path of the midnight Sun in Lapland (Finland). The Sun approaches the horizon but does not set. Rather, it begins to climb again (Photo: Sakari Ekko).
Fig. 22a and 22b: The demonstrator showing the Sun over the horizon for half a year and below the horizon for a half a year.
Fig. 23a, 23b and 23c: The Sun rises on the first day of each season: left - 1st day of summer, center - 1st day of spring or autumn, and right - 1st day of winter (in the Northern Hemisphere). On the equator the Sun’s path is perpendicular to the ho-rizon. The Sun rises at almost the same point every season. The angular distances between sunrises are only 23.5º (the ecliptic obliquity). In more extreme latitudes the Sun’s path is more inclined and the distances between the three sunrise points increase (figures 17 and 19).
Fig. 24a: Small shadow (the Sun is almost at the zenith in a place near the equator). Fig. 24b: Simu-lating the Sun at the Zenith in Honduras (latitude 15º N).
68
3.- Equatorial areas: THE SUN AT THE ZENITH
-�e Sun at the zenith
In equatorial areas, the four seasons are not very dis-tinct. !e Sun’s path is practically perpendicular to the horizon and the solar height is practically the same during the whole year. !e length of the days is also very similar (figures 23a, 23b and 23c).
Moreover, in tropical countries there are some spe-cial days: the days when the Sun passes at the zenith. On these days, sunlight hits the Earth’s surface at the equator perpendicularly. Because of this, the tempera-ture is hotter and people’s shadows disappear under their shoes (figure 24a). In some ancient cultures these days were considered to be very special because the phenomenon was very easy to observe. !is is still the case now. In fact, there are two days per year when the Sun is at the zenith for those living between the Tropic of Cancer and the Tropic of Capricorn. We can illustrate this phenomenon using the demonstrator. It is also possible to approximately calculate the dates, which depend on the latitude (figure 24b).
For example (figure 24b), if we select a latitude of 15º N, using the demonstrator we can calculate approxi-mately on what days the Sun is at the zenith at midday. It is only necessary to hold a stick perpendicular to the
horizon disc and we see that these days are at the end of April and in the middle of August.
XXL demonstratorsNaturally, the demonstrator can be made with other materials, for instance wood (figure 25a). In this case a light source can be introduced to show the Sun’s posi-tion. With a camera, using a long exposure time, it is
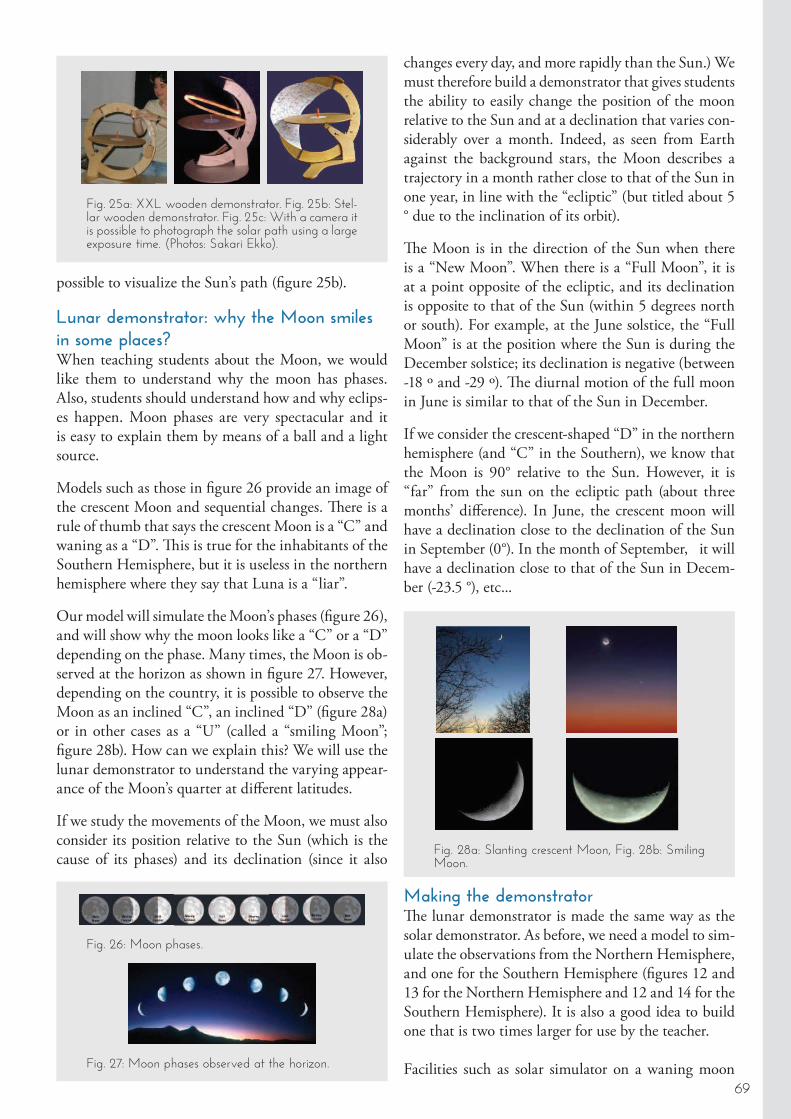
Fig. 25a: XXL wooden demonstrator. Fig. 25b: Stel-lar wooden demonstrator. Fig. 25c: With a camera it is possible to photograph the solar path using a large exposure time. (Photos: Sakari Ekko).
Fig. 26: Moon phases.
Fig. 27: Moon phases observed at the horizon.
Fig. 28a: Slanting crescent Moon, Fig. 28b: Smiling Moon.
69
possible to visualize the Sun’s path (figure 25b).
Lunar demonstrator: why the Moon smiles in some places?When teaching students about the Moon, we would like them to understand why the moon has phases. Also, students should understand how and why eclips-es happen. Moon phases are very spectacular and it is easy to explain them by means of a ball and a light source.
Models such as those in figure 26 provide an image of the crescent Moon and sequential changes. !ere is a rule of thumb that says the crescent Moon is a “C” and waning as a “D”. !is is true for the inhabitants of the Southern Hemisphere, but it is useless in the northern hemisphere where they say that Luna is a “liar”.
Our model will simulate the Moon’s phases (figure 26), and will show why the moon looks like a “C” or a “D” depending on the phase. Many times, the Moon is ob-served at the horizon as shown in figure 27. However, depending on the country, it is possible to observe the Moon as an inclined “C”, an inclined “D” (figure 28a) or in other cases as a “U” (called a “smiling Moon”; figure 28b). How can we explain this? We will use the lunar demonstrator to understand the varying appear-ance of the Moon’s quarter at different latitudes.
If we study the movements of the Moon, we must also consider its position relative to the Sun (which is the cause of its phases) and its declination (since it also
changes every day, and more rapidly than the Sun.) We must therefore build a demonstrator that gives students the ability to easily change the position of the moon relative to the Sun and at a declination that varies con-siderably over a month. Indeed, as seen from Earth against the background stars, the Moon describes a trajectory in a month rather close to that of the Sun in one year, in line with the “ecliptic” (but titled about 5 ° due to the inclination of its orbit).
!e Moon is in the direction of the Sun when there is a “New Moon”. When there is a “Full Moon”, it is at a point opposite of the ecliptic, and its declination is opposite to that of the Sun (within 5 degrees north or south). For example, at the June solstice, the “Full Moon” is at the position where the Sun is during the December solstice; its declination is negative (between -18 º and -29 º). !e diurnal motion of the full moon in June is similar to that of the Sun in December.
If we consider the crescent-shaped “D” in the northern hemisphere (and “C” in the Southern), we know that the Moon is 90° relative to the Sun. However, it is “far” from the sun on the ecliptic path (about three months’ difference). In June, the crescent moon will have a declination close to the declination of the Sun in September (0°). In the month of September, it will have a declination close to that of the Sun in Decem-ber (-23.5 °), etc...
Making the demonstrator!e lunar demonstrator is made the same way as the solar demonstrator. As before, we need a model to sim-ulate the observations from the Northern Hemisphere, and one for the Southern Hemisphere (figures 12 and 13 for the Northern Hemisphere and 12 and 14 for the Southern Hemisphere). It is also a good idea to build one that is two times larger for use by the teacher.
Facilities such as solar simulator on a waning moon
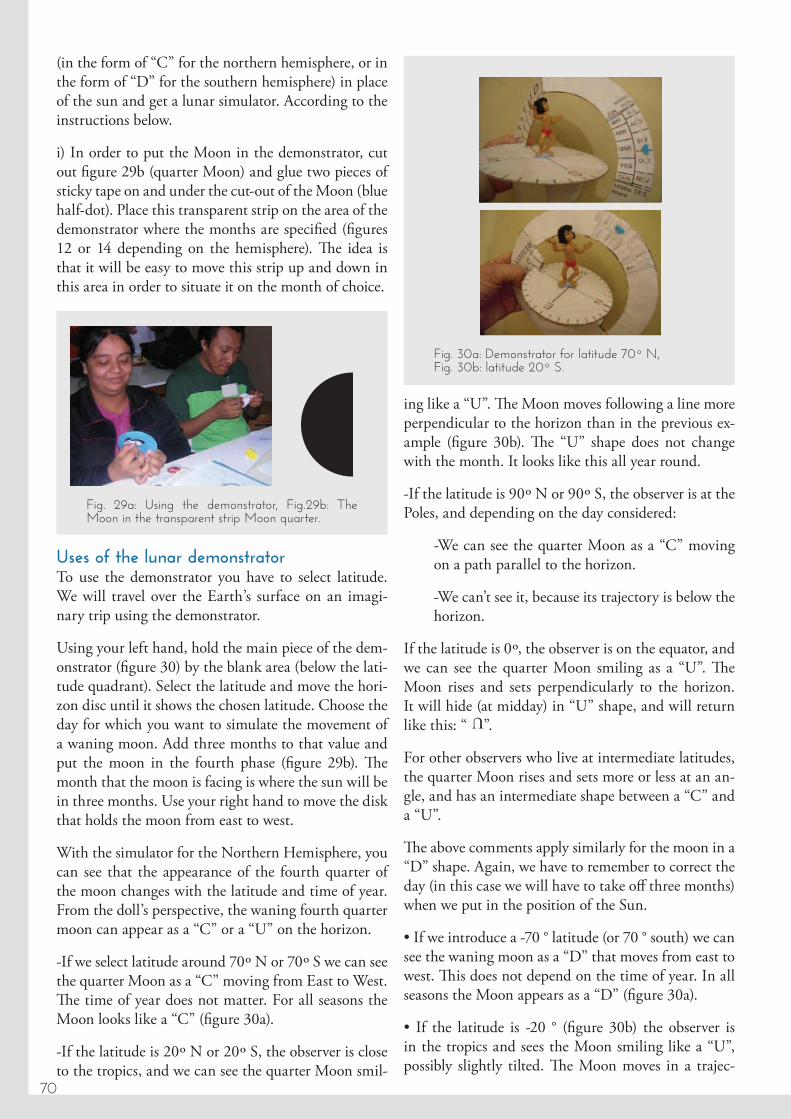
Fig. 29a: Using the demonstrator, Fig.29b: The Moon in the transparent strip Moon quarter.
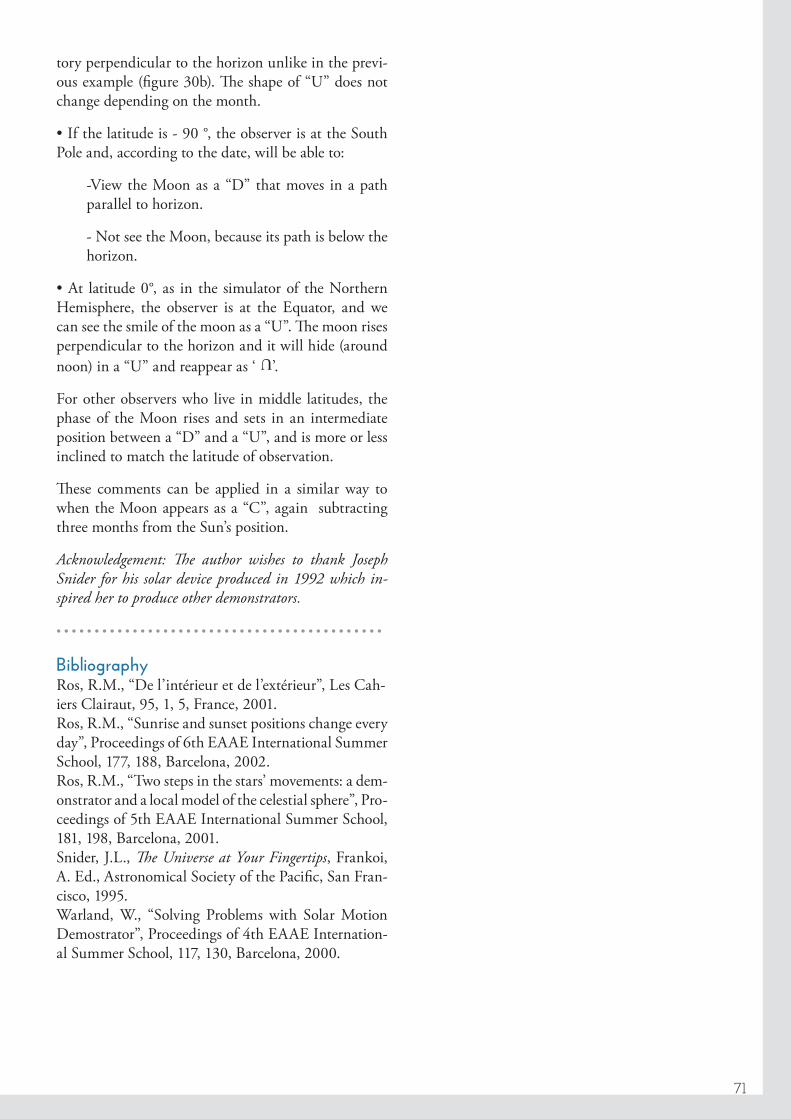
Fig. 30a: Demonstrator for latitude 70º N,Fig. 30b: latitude 20º S.
70
(in the form of “C” for the northern hemisphere, or in the form of “D” for the southern hemisphere) in place of the sun and get a lunar simulator. According to the instructions below.
i) In order to put the Moon in the demonstrator, cut out figure 29b (quarter Moon) and glue two pieces of sticky tape on and under the cut-out of the Moon (blue half-dot). Place this transparent strip on the area of the demonstrator where the months are specified (figures 12 or 14 depending on the hemisphere). �e idea is that it will be easy to move this strip up and down in this area in order to situate it on the month of choice.
Uses of the lunar demonstrator To use the demonstrator you have to select latitude. We will travel over the Earth’s surface on an imagi-nary trip using the demonstrator.
Using your left hand, hold the main piece of the dem-onstrator (figure 30) by the blank area (below the lati-tude quadrant). Select the latitude and move the hori-zon disc until it shows the chosen latitude. Choose the day for which you want to simulate the movement of a waning moon. Add three months to that value and put the moon in the fourth phase (figure 29b). �e month that the moon is facing is where the sun will be in three months. Use your right hand to move the disk that holds the moon from east to west.
With the simulator for the Northern Hemisphere, you can see that the appearance of the fourth quarter of the moon changes with the latitude and time of year. From the doll’s perspective, the waning fourth quarter moon can appear as a “C” or a “U” on the horizon.
-If we select latitude around 70º N or 70º S we can see the quarter Moon as a “C” moving from East to West. �e time of year does not matter. For all seasons the Moon looks like a “C” (figure 30a).
-If the latitude is 20º N or 20º S, the observer is close to the tropics, and we can see the quarter Moon smil-
ing like a “U”. �e Moon moves following a line more perpendicular to the horizon than in the previous ex-ample (figure 30b). �e “U” shape does not change with the month. It looks like this all year round.
-If the latitude is 90º N or 90º S, the observer is at the Poles, and depending on the day considered:
-We can see the quarter Moon as a “C” moving on a path parallel to the horizon.
-We can’t see it, because its trajectory is below the horizon.
If the latitude is 0º, the observer is on the equator, and we can see the quarter Moon smiling as a “U”. �e Moon rises and sets perpendicularly to the horizon. It will hide (at midday) in “U” shape, and will return like this: “
U
”.
For other observers who live at intermediate latitudes, the quarter Moon rises and sets more or less at an an-gle, and has an intermediate shape between a “C” and a “U”.
�e above comments apply similarly for the moon in a “D” shape. Again, we have to remember to correct the day (in this case we will have to take off three months) when we put in the position of the Sun.
see the waning moon as a “D” that moves from east to west. �is does not depend on the time of year. In all seasons the Moon appears as a “D” (figure 30a).
in the tropics and sees the Moon smiling like a “U”, possibly slightly tilted. �e Moon moves in a trajec-
71
tory perpendicular to the horizon unlike in the previ-ous example (figure 30b). �e shape of “U” does not change depending on the month.
Pole and, according to the date, will be able to:
-View the Moon as a “D” that moves in a path parallel to horizon.
- Not see the Moon, because its path is below the horizon.
Hemisphere, the observer is at the Equator, and we can see the smile of the moon as a “U”. �e moon rises perpendicular to the horizon and it will hide (around
noon) in a “U” and reappear as ‘
U
’.
For other observers who live in middle latitudes, the phase of the Moon rises and sets in an intermediate position between a “D” and a “U”, and is more or less inclined to match the latitude of observation.
�ese comments can be applied in a similar way to when the Moon appears as a “C”, again subtracting three months from the Sun’s position.
Acknowledgement: �e author wishes to thank Joseph Snider for his solar device produced in 1992 which in-spired her to produce other demonstrators.
BibliographyRos, R.M., “De l’intérieur et de l’extérieur”, Les Cah-iers Clairaut, 95, 1, 5, France, 2001.Ros, R.M., “Sunrise and sunset positions change every day”, Proceedings of 6th EAAE International Summer School, 177, 188, Barcelona, 2002.Ros, R.M., “Two steps in the stars’ movements: a dem-onstrator and a local model of the celestial sphere”, Pro-ceedings of 5th EAAE International Summer School, 181, 198, Barcelona, 2001.Snider, J.L., �e Universe at Your Fingertips, Frankoi, A. Ed., Astronomical Society of the Pacific, San Fran-cisco, 1995.Warland, W., “Solving Problems with Solar Motion Demostrator”, Proceedings of 4th EAAE Internation-al Summer School, 117, 130, Barcelona, 2000.