Gene Expression Analysis Comparing Two RNA … · Gene Expression Analysis Comparing Two RNA...
8
High Pure FFPET Application Note 1 Gene Expression Analysis Comparing Two RNA Isolation Methods from Recent and Older Archived Formalin-Fixed, Paraffin-Embedded Tissue (FFPET) Samples Abstract Formalin-fixed, paraffin-embedded tissue samples are widely available for retrospective studies. However the quantity and the quality of the isolated RNA can limit downstream applications. Our aims were to compare the High Pure FFPET RNA Isolation Kit with a commercially available FFPE RNA isolation kit with regard to the quality and quantity of the isolated RNA. RNA isolation was performed using High Pure FFPET RNA Isolation Kit and RNeasy FFPE Kit (Qiagen), from slides cut from FFPE blocks containing human colorectal cancer (CRC) and normal adjacent colon tissue (NAT) with different storage time, archived samples older than 5 years and recent samples younger than 6 months. After quantity and quality assessment, gene expression analysis of three colorectal cancer markers was performed using RT-qPCR to evaluate the performance of the isolated RNA samples. The High Pure FFPET RNA Isolation Kit purification resulted in higher yield and RIN values compared to the RNeasy FFPE Kit from both archived and recent FFPE samples. Samples isolated using the High Pure FFPET RNA Isolation Kit are highly suited for comparison of marker gene expression levels. In all settings (archived/recent tissue, normal/tumor tissue, all marker genes), earlier absolute Cq values were achieved with High Pure FFPET RNA Isolation Kit, indicating higher sensitivity and amplificability. Differences in marker gene expression levels are clearly detectable between normal and tumor tissue. Relative expression of marker genes is lower in normal tissue compared to tumor tissue. In conclusion, high quality and quantity of total RNA can be isolated from FFPE blocks using High Pure FFPET RNA Isolation Kit, providing reliable starting material for gene expression studies. For life science research only. Not for use in diagnostic procedures. October 2012 Alexandra Kalmar*, Kinga Tóth, Katalin Leiszter, Árpád V. Patai, Andrea Schöller 2 nd Department of Internal Medicine, Semmelweis University, Budapest, Hungary Barnabás Wichmann*, Orsolya Galamb, Sándor Spisák, Zsolt Tulassay, Béla Molnár Molecular Medicine Research Unit, Hungarian Academy of Sciences, Budapest, Hungary *These authors contributed equally to this work
Transcript of Gene Expression Analysis Comparing Two RNA … · Gene Expression Analysis Comparing Two RNA...
High Pure FFPET Application Note 1
Gene Expression Analysis Comparing Two RNA Isolation Methods from Recent and Older Archived Formalin-Fixed, Paraffin-Embedded Tissue (FFPET) Samples
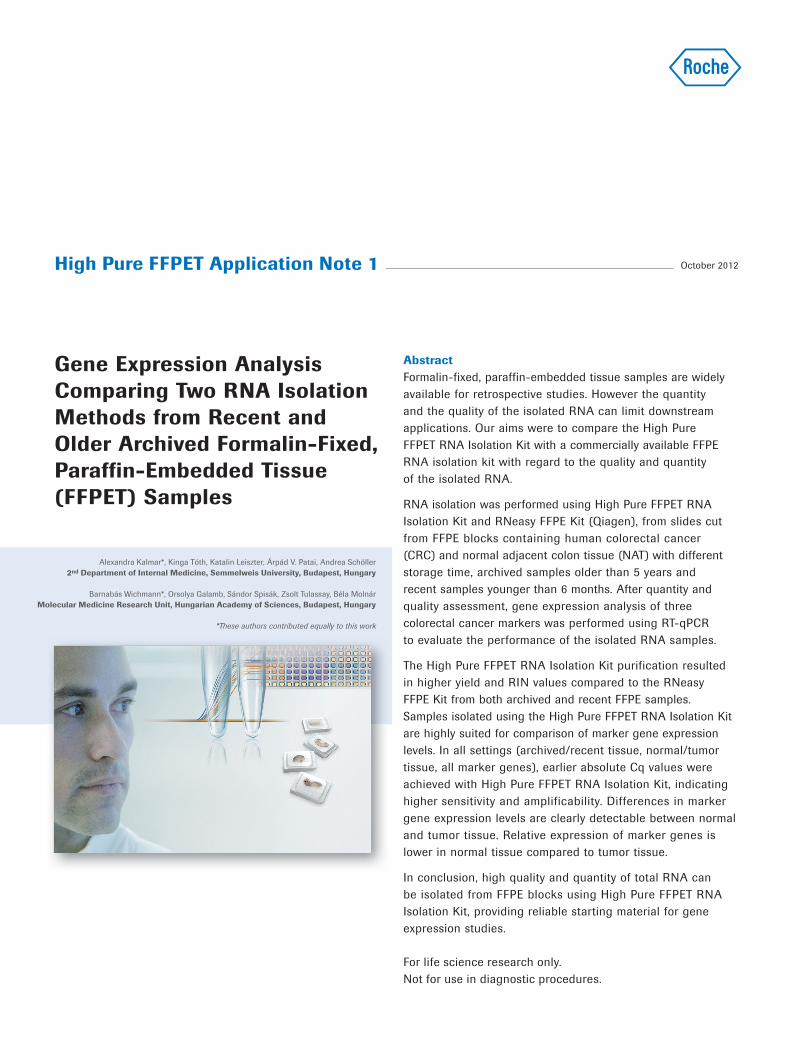
AbstractFormalin-fixed, paraffin-embedded tissue samples are widely available for retrospective studies. However the quantity and the quality of the isolated RNA can limit downstream applications. Our aims were to compare the High Pure FFPET RNA Isolation Kit with a commercially available FFPE RNA isolation kit with regard to the quality and quantity of the isolated RNA.
RNA isolation was performed using High Pure FFPET RNA Isolation Kit and RNeasy FFPE Kit (Qiagen), from slides cut from FFPE blocks containing human colorectal cancer (CRC) and normal adjacent colon tissue (NAT) with different storage time, archived samples older than 5 years and recent samples younger than 6 months. After quantity and quality assessment, gene expression analysis of three colorectal cancer markers was performed using RT-qPCR to evaluate the performance of the isolated RNA samples.
The High Pure FFPET RNA Isolation Kit purification resulted in higher yield and RIN values compared to the RNeasy FFPE Kit from both archived and recent FFPE samples. Samples isolated using the High Pure FFPET RNA Isolation Kit are highly suited for comparison of marker gene expression levels. In all settings (archived/recent tissue, normal/tumor tissue, all marker genes), earlier absolute Cq values were achieved with High Pure FFPET RNA Isolation Kit, indicating higher sensitivity and amplificability. Differences in marker gene expression levels are clearly detectable between normal and tumor tissue. Relative expression of marker genes is lower in normal tissue compared to tumor tissue.
In conclusion, high quality and quantity of total RNA can be isolated from FFPE blocks using High Pure FFPET RNA Isolation Kit, providing reliable starting material for gene expression studies.
For life science research only. Not for use in diagnostic procedures.
October 2012
Alexandra Kalmar*, Kinga Tóth, Katalin Leiszter, Árpád V. Patai, Andrea Schöller 2nd Department of Internal Medicine, Semmelweis University, Budapest, Hungary
Barnabás Wichmann*, Orsolya Galamb, Sándor Spisák, Zsolt Tulassay, Béla Molnár Molecular Medicine Research Unit, Hungarian Academy of Sciences, Budapest, Hungary
*These authors contributed equally to this work

Formalin-fixed, paraffin-embedded (FFPE) tissue is the most widely available sample type. This makes it a valuable starting material for retrospective studies. However, the applicability of this type of sample in gene expression studies is limited due to the low yield and purity of the isolated RNA samples. In addition to tissue fixation, subsequent storage time of the tissue blocks is one of the main factors that can influence the quality and quantity of the isolated nucleic acids, as long-term storage can result in lower yield [1].
Introduction
2
Materials and Methods
Sample material and sample collectionFormalin-fixed, paraffin-embedded tissue blocks were prepared from surgically removed colorectal cancer (CRC, Dukes B-C), and from the belonging normal adjacent (NAT) tissue specimens (referred to as "normal" in the text).
Two groups of FFPE blocks were analyzed with different storage time, archived samples older than 5 years (n = 24; 12 CRC, 12 NAT), and recent samples younger than 6 months (n = 24; 12 CRC, 12 NAT). Written informed consent was provided by all patients. The study was approved by the local ethics committee.
RNA isolation10 µm thick sections were cut from formalin-fixed, paraffin-embedded blocks. Each section was transferred into micro-centrifuge tubes. Before both isolations, deparaffinization was performed with 1 ml xylene with 10 minutes incubation time twice, and 1 ml absolute ethanol for 10 minutes twice. Total RNA isolation was performed from each air dried
Quantitative and qualitative analysis of the isolated RNA samples The concentration of the isolated RNA was measured using the NanoDrop 1000 spectrophotometer (Thermo Fisher Scientific Inc., USA, Waltham). RNA quality was assessed using the RNA Integrity Number (RIN) measured by RNA 6000 Pico LabChip kit on a microcapillary electrophoresis system (Agilent BioAnalyzer 2100).
deparaffinized section with High Pure FFPET RNA Isolation Kit (Roche Applied Science, Penzberg, Germany) and RNeasy FFPE Kit (QIAGEN GmbH, Hilden, Germany) in duplicates, according to the manufacturers’ instructions. Both protocols include DNase treatment. To avoid any sample bias, sequential sections were used for RNA isolation with High Pure FFPET RNA Isolation Kit and RNeasy FFPE Kit.
To analyze possible contamination of genomic DNA in the isolated RNA samples, RT-qPCR reactions were performed using a cyclophilin A (CycA) assay with 4 normal and 4 CRC total RNA samples isolated with both methods. Dilution series of human genomic DNA (20 ng, 2 ng, 0.2 ng, 0.02 ng, 0.002 ng final concentrations) were prepared as standards. After denaturation at +95 ºC for 10 min, 45 cycles of ampli-fication were performed: +95 ºC for 5 sec, +55 ºC for 10 sec and signal detection at +72 ºC for 18 sec, and cooling at +40 ºC for 30 sec.
Downstream applications require high quality RNA, which is largely influenced by the isolation procedure [2]. Here we present a comparative study using two commercially available kits for RNA isolation from FFPE tissue using older archived and recent tissue samples. For testing the downstream appli-cability of the isolated samples, gene expression of three recently identified colorectal cancer-specific discriminatory transcripts [3] was determined using real-time PCR.

Materials and Methods
3
Table 1: Analyzed markers with amplicon lengths.
Real-time PCR analysisUsing the Transcriptor First Strand cDNA Synthesis Kit (Roche Diagnostics), 250 ng of total RNA were reverse transcribed with a combination of anchored-oligo(dT) and random hexamer primers. Gene expression analysis was performed for three colorectal cancer specific markers [3] (COL12A1, CXCL2, CHI3L1), and 18S ribosomal RNA as housekeeping gene. RealTime ready assays from Universal Probe Library (Roche Applied Science) were used with forward and reverse primers (400 nM), and fluorescently labeled hydrolysis probes (200 nM) lyophilized into 384 well plates (Table 1).
Statistical analysis of OD ratiosAnalytical OD ratio data of the RNA eluates were represen-ted in boxplots, with red dots for each individual value. Boxplots indicate five number summaries of data such as sample minimum, lower quartile (Q1), median (Q2), upper quartile (Q3) and sample maximum. It also displays the full range of variation and likely range of variation (IQR). This later is the difference of Q1 and Q3. Outliers are data points
Gene symbol Gene name Amplicon length RealTime ready Assay ID
CHI3L1 chitinase 3-like 1 76 103035
COL12A1 collagen, type XII, alpha 1 66 103045
CXCL2 chemokine (C-X-C motif) ligand 2 95 103070
RN18S1 RNA, 18S ribosomal 1, 18S ribosomal RNA 73 104092
Real-time PCR reactions were performed in a final volume of 10 µl using 5 ng cDNA/well and 5 µl LightCycler® 480 Probes Master. The epMotion 5070 liquid handling robot (Eppendorf, Hamburg, Germany) was used for pipetting. Thermal cycling conditions on the LightCycler® 480 System were the following: Enzyme activation: +95 ºC for 10 min, 45 cycles of amplification: +95 ºC for 10 sec, +60 ºC for 30 sec, and signal detection at +72 ºC for 1 sec, and cooling at +40 ºC for 30 sec.
which are either 3xIQR or more above Q3 or 3xIQR or more below Q1. Box represents 50% of data, whiskers represent 24.65 – 24.65% of data either above or below the boxplot. Data points which are beyond each quartile with 1.5 IQR are deemed as potential outliers. Gene expression analysis was performed with relative quantification using the ddCq method with 18S ribosomal RNA housekeeping gene.

30
25
20
15
10
5
0
Quantity and quality of the isolated RNA samplesTotal RNA was isolated from 12 archived and 12 recent CRC and normal FFPE blocks. Isolations were performed in duplicates. Altogether 96 isolations were performed with
RNA yield by OD260
The High Pure FFPET RNA Isolation Kit resulted in significantly higher yield (archived tissue: 6.96 ± 3.9 µg RNA/slide; recent tissue: 7.67 ± 4.8 µg RNA/slide) compared to the RNeasy FFPE Kit (archived tissue 2.27 ± 1.57 µg RNA/slide; recent tissue: 2.95 ± 2.34 µg RNA/slide) (Table 2). Yield was consistently higher using the High Pure Kit (Figure 1).
Results and Discussion
4
Table 2. Comparison of the two isolation methods from older archived and recent FFPE tissue samples. Mean values ± standard deviation are shown.
Figure 1. Comparison of RNA yields from individual sequential FFPE sections. RNA yields are presented for each of the 24 replicates, resulting in mean yields in Table 2. As expected, RNA yields vary between sections. The High Pure FFPET RNA Isolation Kit consistently generated higher yields compared to RNeasy FFPE Kit.
High Pure FFPET RNA Isolation Kit and 96 with Qiagen's RNeasy FFPE Kit. Comparison of the RNA quantity and quality results are summarized in Table 2.
Archived FFPE tissue Recent FFPE tissue
High Pure Kit RNeasy FFPE Kit P value High Pure Kit RNeasy FFPE Kit P value
Normal samples
Yield (µg) 4.19 ± 2.45 1.65 ± 1.4 1.41 10-5 5.69 ± 5.09 3.45 ± 4.17 0.08
OD260/280 1.86 ± 0.01 1.90 ± 0.08 0.13 1.92 ± 0.05 1.94 ± 0.07 0.34
OD260/230 1.69 ± 0.35 1.82 ± 0.33 0.14 1.83 ± 0.23 1.75 ± 0.29 0.27
RIN 2.36 ± 0.32 1.97 ± 0.5 0.08 2.85 ± 0.21 2.70 ± 1.05 0.85
Tumor samples
Yield (µg) 9.72 ± 3.03 2.59 ± 1.4 8.23 10-16 9.65 ± 3.59 3.97 ± 3.31 1.79 10-7
OD260/280 1.90 ± 0.05 1.88 ± 0.08 0.42 1.95 ± 0.03 1.98 ± 0.03 0.01
OD260/230 1.90 ± 0.08 1.91 ± 0.25 0.74 2.02 ± 0.08 1.92 ± 0.16 0.01
RIN 2.20 ± 0.00 2.10 ± 0.24 0.72 3.70 ± 1.1 2.37 ± 0.63 0.55
The differences in the yield from the same slides with the two methods were more pronounced in case of the archived tissue samples, where the High Pure FFPET RNA Isolation Kit resulted in significantly higher RNA yield.
No
rmal
tis
sue
Tum
or
tiss
ue
Archived FFPE tissue Recent FFPE tissue
Yie
ld (
µg
)
12
10
8
6
4
2
0
1.1
1.2
2.1
2.2
3.1
3.2
4.1
4.2
5.1
5.2
6.1
6.2
7.1
7.2
8.1
8.2
9.1
9.2
10.1
10.2
11
.1
11.2
12
.1
12.2
High Pure Kit RNeasy FFPE Kit
Yie
ld (
µg
)
20
16
12
8
4
0
1.1
1.2
2.1
2.2
3.1
3.2
4.1
4.2 5.1
5.2
6.1
6.2
7.1
7.2
8.1
8.2
9.1
9.2
10.1
10
.2
11.1
11
.2
12.1
12
.2
High Pure Kit RNeasy FFPE Kit
1.1
1.2
2.1
2.2
3.1
3.2
4.1
4.2 5.1
5.2
6.1
6.2
7.1
7.2
8.1
8.2
9.1
9.2
10.1
10
.2
11.1
11
.2
12.1
12
.2
Yie
ld (
µg
)
20
16
12
8
4
0
High Pure Kit RNeasy FFPE Kit
1.1
1.2
2.1
2.2
3.1
3.2
4.1
4.2
5.1
5.2
6.1
6.2
7.1
7.2
8.1
8.2
9.1
9.2
10.1
10.2
11
.1
11.2
12
.1
12.2
Yie
ld (
µg
)
High Pure Kit RNeasy FFPE Kit
4.19 ± 2.45
1.86 ± 0.01
1.69 ± 0.35
2.36 ± 0.32
9.72 ± 3.03
1.90 ± 0.05
1.90 ± 0.08
2.20 ± 0.00
5.69 ± 5.09
1.92 ± 0.05
1.83 ± 0.23
2.85 ± 0.21
9.65 ± 3.59
1.95 ± 0.03
2.02 ± 0.08
3.70 ± 1.1

Results and Discussion
5
Figure 2. Comparison of a) OD260/280, and b) OD260/230 ratios. Analytical data of the RNA eluates were represented in boxplots, with red dots for each individual value. Box represents 50% of data, whiskers represent 24.65 – 24.65% of data either above or below the boxplot.
RNA quality by OD260/280 and OD260/230 ratiosRatio of OD260/280 and OD260/230 was assessed to evaluate the purity of the isolated RNA. The OD260/280 ratio should be 1.8 – 2.0 and OD260/230 ratio should be around 2.0. RNA samples isolated from recent tissue samples had slightly higher purity values compared to the archived samples.
The OD260/280 ratios were found to be similarly high in the RNA samples isolated with both methods from archived tissue
RNA integrityThe RNA integrity number (RIN) is calculated with an algorithm on the basis of capillary electrophoresis measure-ment and indicates the quality of the isolated RNA on a scale from 1 – 10. Due to the formalin fixation of the tissue samples, often highly degraded RNA is isolated from FFPE sample material. RNA samples had similar RIN values
Genomic DNA contamination According to the RT-qPCR results with CycA assay, no genomic DNA contamination could be observed in High Pure Kit or in RNeasy FFPE Kit eluates.
samples (High Pure Kit: 1.88 ± 0.08; RNeasy FFPE Kit: 1.89 ± 0.08), and also from recent tissue samples (High Pure Kit: 1.93 ± 0.05; RNeasy FFPE Kit: 1.95 ± 0.06) (Figure 2a).
RNA quality by OD260/230 ratio was also found to be similar with the different isolation methods from archived tissue samples (High Pure Kit: 1.79 ± 0.27; RNeasy FFPE Kit: 1.87 ± 0.29) and from recent tissue samples (High Pure Kit: 1.93 ± 0.2; RNeasy FFPE Kit: 1.77 ± 0.2); (Figure 2b).
isolated with both methods from archived material (High Pure Kit: 2.34 ± 0.3, RNeasy FFPE Kit: 2.05 ± 3.33). RIN values were slightly higher in the recent FFPE samples (High Pure Kit: 3.42 ± 1, RNeasy FFPE Kit: 2.34 ± 0.7), whereas the High Pure Kit resulted in moderately higher values compared to the RNeasy FFPE Kit.
b
normal normaltumor tumor normal normaltumor tumor
OD260/230
2.2
2.0
1.8
1.6
1.4
1.2
1.0
0.8
Qiagen Qiagen Qiagen Qiagen Roche Roche Roche Roche
aOD260/280
Archived FFPE tissue Archived FFPE tissueRecent FFPE tissue Recent FFPE tissue
2.0
1.9
1.8
1.7
1.6
Qiagen Qiagen Qiagen Qiagen Roche Roche Roche Roche
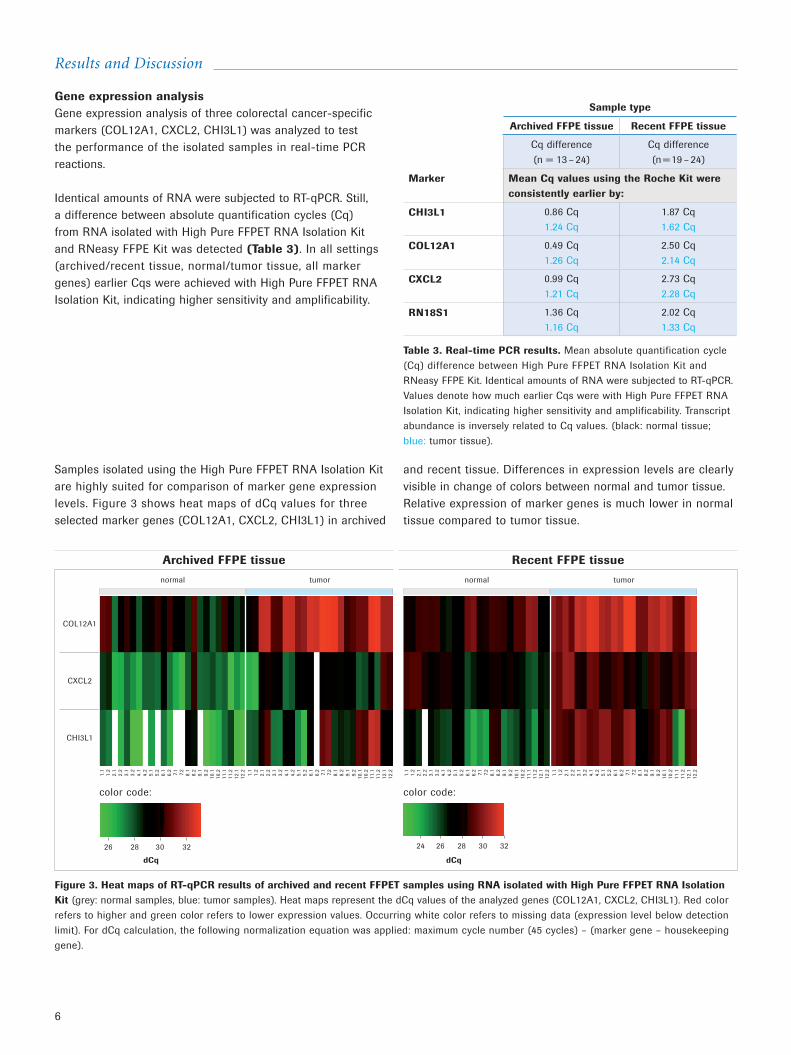
Gene expression analysisGene expression analysis of three colorectal cancer-specific markers (COL12A1, CXCL2, CHI3L1) was analyzed to test the performance of the isolated samples in real-time PCR reactions.
Identical amounts of RNA were subjected to RT-qPCR. Still, a difference between absolute quantification cycles (Cq) from RNA isolated with High Pure FFPET RNA Isolation Kit and RNeasy FFPE Kit was detected (Table 3). In all settings (archived/recent tissue, normal/tumor tissue, all marker genes) earlier Cqs were achieved with High Pure FFPET RNA Isolation Kit, indicating higher sensitivity and amplificability.
Samples isolated using the High Pure FFPET RNA Isolation Kit are highly suited for comparison of marker gene expression levels. Figure 3 shows heat maps of dCq values for three selected marker genes (COL12A1, CXCL2, CHI3L1) in archived
Results and Discussion
6
Table 3. Real-time PCR results. Mean absolute quantification cycle (Cq) difference between High Pure FFPET RNA Isolation Kit and RNeasy FFPE Kit. Identical amounts of RNA were subjected to RT-qPCR. Values denote how much earlier Cqs were with High Pure FFPET RNA Isolation Kit, indicating higher sensitivity and amplificability. Transcript abundance is inversely related to Cq values. (black: normal tissue; blue: tumor tissue).
Figure 3. Heat maps of RT-qPCR results of archived and recent FFPET samples using RNA isolated with High Pure FFPET RNA Isolation Kit (grey: normal samples, blue: tumor samples). Heat maps represent the dCq values of the analyzed genes (COL12A1, CXCL2, CHI3L1). Red color refers to higher and green color refers to lower expression values. Occurring white color refers to missing data (expression level below detection limit). For dCq calculation, the following normalization equation was applied: maximum cycle number (45 cycles) – (marker gene – housekeeping gene).
Sample type
Archived FFPE tissue Recent FFPE tissue
Cq difference (n = 13 – 24)
Cq difference (n = 19 – 24)
Marker Mean Cq values using the Roche Kit were consistently earlier by:
CHI3L1 0.86 Cq1.24 Cq
1.87 Cq1.62 Cq
COL12A1 0.49 Cq1.26 Cq
2.50 Cq2.14 Cq
CXCL2 0.99 Cq1.21 Cq
2.73 Cq2.28 Cq
RN18S1 1.36 Cq1.16 Cq
2.02 Cq1.33 Cq
and recent tissue. Differences in expression levels are clearly visible in change of colors between normal and tumor tissue. Relative expression of marker genes is much lower in normal tissue compared to tumor tissue.
COL12A1
CXCL2
CHI3L1
dCq
26 28 30 32
1.1
1.2
2.1
2.2
3.1
3.2
4.1
4.2
5.1
5.2
6.1
6.2
7.1
7.2
8.1
8.2
9.1
9.2
10.1
10.2
11.1
11.2
12.1
12.2 1.1
1.2
2.1
2.2
3.1
3.2
4.1
4.2
5.1
5.2
6.1
6.2
7.1
7.2
8.1
8.2
9.1
9.2
10.1
10.2
11.1
11.2
12.1
12.2
color code:
dCq
24 26 28 30 32
1.1
1.2
2.1
2.2
3.1
3.2
4.1
4.2
5.1
5.2
6.1
6.2
7.1
7.2
8.1
8.2
9.1
9.2
10.1
10.2
11.1
11.2
12.1
12.2 1.1
1.2
2.1
2.2
3.1
3.2
4.1
4.2
5.1
5.2
6.1
6.2
7.1
7.2
8.1
8.2
9.1
9.2
10.1
10.2
11.1
11.2
12.1
12.2
normal tumor normal tumor
color code:
Archived FFPE tissue Recent FFPE tissue

7
Conclusion
RNA samples isolated with High Pure FFPET RNA Isolation Kit from archived and recent FFPE blocks showed a higher yield, purity and RT-qPCR sensitivity compared to the RNeasy FFPE Kit. Due to the relatively high RNA integrity and the advantage of the pre-optimized RealTime ready assays with their short amplicon size and high specificity, a set of colorectal cancer-specific gene expression markers could correctly classify between the analyzed colorectal tumor and normal adjacent samples. Our results using the High Pure FFPET RNA Isolation Kit and RealTime ready RT-qPCR also show that gene expression analysis can be performed on older archived FFPE tissue material.
References
1. Ribeiro-Silva A, Zhang H, Jeffrey SS (2007) – RNA extraction from ten year old formalin-fixed paraffin-embedded breast cancer samples: a comparison of column purification and magnetic bead-based technologies. Molecular Biology 2007, 8:118
2. Chung JY, Braunschweig T, Hewitt SM.(2006) – Optimization of recovery of RNA from formalin-fixed, paraffin-embedded tissue. Diagn Mol Pathol 15(4):229-36
3. Galamb O, Spisák S, Sipos F, Tóth K, Solymosi N et al (2010) – Reversal of gene expression changes in the colorectal normal-adenoma pathway by NS398 selective COX2 inhibitor. Br J Cancer 102:765-773

For life science research only. Not for use in diagnostic procedures.
HIGH PURE, LIGHTCYCLER, and REALTIME READY are trademarks of Roche.Exiqon and ProbeLibrary are registered trademarks of Exiqon A/S, Vedbaek, Denmark.All other product names and trademarks are the property of their respective owners.
Published byRoche Diagnostics GmbHSandhofer Straße 11668305 MannheimGermany
© 2012 Roche Diagnostics. All rights reserved.
06891144001 1012