Does nudging intentions translate into action? Why nudging ...cege/Diskussionspapiere/DP318.pdf ·...
32
ISSN: 1439-2305 Number 318 – July 2017 DOES NUDGING INTENTIONS TRANSLATE INTO ACTION? WHY NUDGING PLEDGES TO CHARITIES DOES NOT RESULT IN INCREASED DONATIONS Alexia Gaudeul and Magdalena C. Kaczmarek
Transcript of Does nudging intentions translate into action? Why nudging ...cege/Diskussionspapiere/DP318.pdf ·...
ISSN: 1439-2305
Number 318 – July 2017
DOES NUDGING INTENTIONS
TRANSLATE INTO ACTION?
WHY NUDGING PLEDGES TO
CHARITIES DOES NOT RESULT IN
INCREASED DONATIONS
Alexia Gaudeul and Magdalena C. Kaczmarek

Does nudging intentions translate into action?
Why nudging pledges to charities does not result in
increased donations.*
Alexia Gaudeul† and Magdalena C. Kaczmarek‡
July 28, 2017
Abstract
Recent evidence suggests that nudges, i.e. alterations in the decisional context, can have large
effects on decisions and can improve individual and public welfare. This paper presents the results
of a controlled experiment that was designed to evaluate not only the effectiveness of a default
manipulation on decision making in a charity giving context, but also whether yielding or oppos-
ing a nudge affects attitudes, and whether nudging intentions (pledges) translate into behaviour
(donations). The results show that while making pledges the default increased pledges, it did not
increase donations because the nudge affected only participants who were close to indifference
between pledging and not pledging and were thus unlikely to actually do the effort of translating
their pledges into donations. Participants who were nudged to pledge pledged more often than
participants who were nudged to keep, but they were less likely to maintain their participation
in the experiment, and those who kept participating were less likely to pledge again. This, along
with high attrition among nudged pledgers explains why nudging pledges did not result in higher
actual donations. We interpret our findings in terms of a selection effect of nudges, and discuss
practical implications of our experiment in terms of the applicability of default-based nudges as a
tool for policy interventions.
Keywords: attitudes, decision making, charity giving, defaults, intentions, nudges, pro-social
behaviour, selection effect.
JEL: C9, D04, D10, D64, H41
*This research was funded as part of Magdalena C. Kaczmarek’s research fellowship at the Max Planck Institute of Eco-nomics, Jena (Germany). This paper was presented at the Workshop on Recent Advances in the Economics of Philanthropyat the WZB (Berlin, Germany), at the Faculty of Psychology at the University of Koblenz-Landau, Landau (Germany), atthe Behavioural Science Centre of the University of Stirling (UK), at the Grenoble Applied Economy Laboratory (GAEL) inGrenoble (France), at the Law and Economics Seminar of the University of Kassel (Germany), at the 2015 ESA Europeanmeeting in Heidelberg (Germany), and at the 2016 Annual Workshop of the Social Sciences Committee of the German Eco-nomic Association (Gottingen, Germany). We thank Maja Adena, Paolo Crosetto, Dirk Engelman, Meirav Furth, SteffenHuck, Oliver Kirchkamp, Leonhard Lades, Beatrice Roussillon, Melanie Steffens, Robert Sugden and Fabian Winter forvaluable insights and suggestions.
†Chair of Microeconomics, Faculty of Economic Sciences, Georg-August-University, Platz der Gottinger Sieben 3, 37073Gottingen, Germany. Email: [email protected].
‡Department of Psychosocial Medicine and Psychotherapy, Friedrich-Schiller-University Jena, University Hospital, Ger-many.
1
Most people value the environment, their health and pro-social behaviour, but they often persist
behaving in ways that undermine long term individual and public welfare. New types of policy
interventions target the automated component of human decision making by shaping the context
in which decisions are made without restricting the range of choices available to the individual.
This kind of decisional enhancement was labelled “nudging” by Thaler & Sunstein (2009) and
generates great interest among policymakers worldwide. However, there is only weak evidence
about the ability of such interventions to change behaviour in the general population in the long-
term (Marteau et al., 2011).
The most popular and effective nudges manipulate defaults (Willis, 2013; Momsen & Stoerk,
2014). A default option is the option an individual obtains when not actively stating otherwise.
Making an option the default increases the likelihood it is chosen (Samuelson & Zeckhauser, 1988;
Madrian & Shea, 2001; Johnson & Goldstein, 2004). This is because defaults may appear to be
normative statements, or recommended actions, or opposing them may involve some effort or come
with a cognitive and emotional cost—such as the fear of regret (Anderson, 2003; McKenzie et al.,
2006). This makes it likely that people will stick to them.
Default based nudges generally represent short-term interventions that affect behaviour di-
rectly, by targeting mainly the automatic component of human behaviour (Hansen & Jespersen,
2013). Dual process models assert that human behaviour is the result of the interplay of two
types of decision processes, which differentiate between reasoned/reflective/conscious thinking and
impulsive/reactive/automatic decisions (Schneider & Shiffrin, 1977). Traditional approaches to in-
duce behavioural change in the public health or welfare sector depend on engaging the reflective
system by providing information to alter beliefs and attitudes, or by motivating people with the
prospect of future benefits (Marteau et al., 2011). Novel approaches mainly target the automatic
component of decision making by guiding an individual’s behaviour into a certain direction without
restricting other available options. Such context framing techniques, including default nudges, are
commonly cost efficient, very effective, and better accepted by individuals than rules or sanctions
(Thaler & Sunstein, 2009).
Such an approach in shaping the environments to cue certain behaviours was used mainly in
consumer marketing in the past. For example, pre-packaged foods are presented, designed and
advertised to stimulate our automatic, affective system to consume more than we need (Marteau
et al., 2011). A one-time behaviour in this context is often enough to establish a behavioural habit
because the benefits of this behaviour are immediately salient (e.g. good feeling after eating a cer-
tain chocolate bar). When translating such techniques to a public policy context, however, one faces
the issue that benefits of the nudged behaviour are not immediately salient, and we may not even
be the beneficiaries of our own behaviour—such as in the domain of charity giving. Experiments
in promoting public donation to charity organizations have shown that default based nudges boost
charitable giving, at least in the short term (Schulz et al., 2015; Altmann et al., 2014; Andreoni &
Payne, 2013). However, can nudging establish habituated giving in such a public welfare context?
The answer depends on how nudges affect the three aspects that are crucial in determining indi-
vidual donations: a) the person’s attitudes towards the requested behaviour, b) the social norms
governing the action under consideration, and c) the situational conditions at the time of solici-
tation (Radley & Kennedy, 1995). Default nudges target the social norm component by making
social norms more salient, as well as the situational conditions by making it easier to choose the
pre-checked option than to actively choose a different one. However, to create a habit, one needs
attitudes to be positively modified along with the displayed behaviour. We describe later on how
a default nudge might lead to a change in attitude. Understanding those mechanisms might help
to deal more effectively with important social challenges such as promoting environmentally sen-
2
sitive behaviour and countering the obesity epidemic, as the solution to those needs more than a
one-time behavioural display and is not linked to immediate rewards.
With those objectives in mind, we present in this paper an experiment that deals with the effect
of default-based nudges on charity giving. Our experiment is designed to consider the extent to
which people who are pushed towards some specific behaviour in this way are then committed to it
afterwards. Rather than considering nudges that affect behaviour directly, we explore nudges that
affect the intention to act, and we consider whether those nudged intentions translate into action.
We also examine whether complying with or resisting a nudge affects the behaviour and attitudes
of individuals in different ways.
A first original contribution of our paper is to separate nudging intentions from realized action,
within the context of encouraging donations to charity. We nudge pledges to charities and consider
if those pledges result into actual donations. One reason for separating intentions from action
is to assess the level of motivation of participants when they follow or reject the nudge (in our
case, choosing the default option or not). We want to see if people who go with the nudge are less
committed to the default behaviour, and whether those who go against the nudge develop worse
attitude to the nudged behaviour and towards the nudgers. We separate the act of pledging a dona-
tion online after a survey and the act of actually going through with the donation, which requires
both pledgers and non-pledgers to physically collect the money from us, after which donors can put
the money in a piggy-bank corresponding to their charity. Making the expression of an intention
practically costless while requiring some effort into its realization provides us with an incentivized
measure of the motivation of our participants to either keep the money earned in the experiment
for themselves or to donate it to a charity. Our interest in the level of motivation of our participants
comes from an interesting finding in social influence research, whereby subjecting individuals to
a social influence technique which—like the default nudge—targets the automated component of
the decision process, fosters high compliance rates but lowers the degree of involvement with the
declared behaviour. For example, a fear-then-relief manipulation, whereby people were first sub-
jected to a fear then to a relief situation, increased the probability that subjects would take part
in a charity action, but did not affect their degree of involvement with that action, as expressed
by the number of days voluntarily devoted to work for the charity (Dolinski & Nawrat, 1998). The
participants of the control group were considerably less likely to participate, but those who did
were actually more willing to commit themselves for longer periods of time. The same was found
for money donations: people undergoing this kind of procedure declared more frequently their will-
ingness to participate in the charity action, but donated a considerably lower amount of money
than people who deliberately decided to do so.
While separating the expression of an intention to donate and the actual donation is interesting
from a methodological point of view because it allows us to measure the motivation to go through
with a nudged intention, it is also relevant from a policy point of view, as nudges often only affect
intentions. For example, people can be nudged to enrol into a retirement plan (Madrian & Shea,
2001), but this does not mean that they will save at an appropriate rate (Choi et al., 2006). They can
be encouraged to join a gym, but this does not mean that they will frequent it regularly (DellaVigna
& Malmendier, 2006). Healthy food can be displayed prominently in a cafeteria, thus encouraging
diners to put some on their plate, but that does not mean this food will be eaten (Bucher et al.,
2016). This is why it is also of practical importance to know if nudging intentions to behave in a
certain way translates into actual changes in behaviour.
A meta-analysis of research in psychology shows that “a medium-to-large change in intentions”
(0.66 of a standard deviation) “leads to a small-to-medium change in behaviour” (0.36 of a standard
deviation) (Webb & Sheeran, 2006). Nudging intentions should therefore translate into action,
3
but the type of interventions mentioned in Webb & Sheeran (2006) do not include mere changes
in default options (table 4, page 259). The interventions that are considered consist in giving
information, incentives, social pressure, monitoring, training, etc...1 Nudges differ from those forms
of interventions in that they do not focus on changing the mind of people, changing their incentives,
or on helping them make better conscious decisions. Rather, they merely change the context of
the decision, often without explaining to those affected why and how they are being influenced.
Our question is therefore whether simply manipulating intentions by changing defaults—which
is much less expensive than other type of interventions—can attain the same results in terms of
changes in behaviour.
Beyond considering whether nudged intentions translate into action, a second original contri-
bution of our experiment is to not only track behaviour after a nudge has been applied, but also
subsequent preferences and attitudes to the nudge and to the nudged behaviour. We thus con-
tribute to research on possible negative side-effects of nudges. We know already that people may
resent covert nudges (Felsen et al., 2013), that their acceptance of nudges is linked to their views on
paternalism (Pedersen et al., 2014), and that they resent the nudge if it turns out to have negative
consequences for them (Kataria et al., 2014). In our study, we are interested in whether individ-
uals who are nudged to adopt an action also come to adhere to it and approve of the nudge. This
question is related, but not identical, to the phenomenon of ask avoidance (Adena & Huck, 2016;
Andreoni et al., 2017), whereby people go along with the nudge when exposed to it but thereafter
avoid being exposed to the nudge. This could mean, for example, that people would avoid con-
tact with the nudging institution—for example, public services—if they have been exposed to their
nudge. A nudge may thus be effective in the short-term but self-defeating in the longer-term. We
ask participants to participate twice in the same experiment and consider the effect of the nudge
on the likelihood they maintain participation from the first to the second phase. We also measure
attitudes to charities to consider the wider question of whether imposing extrinsic motivations to
contribute to charities replaces and/or lowers intrinsic motivations to donate. We find that whether
participants maintain participation in the second phase does not depend so much on whether they
were nudged to pledge money to charities as to how they reacted to this nudge—by pledging or by
keeping the money. Our research thus complements and refines research on ask avoidance.2
A third original contribution is that we explore a way to alleviate the potentially negative effects
of nudges on preferences and attitudes by giving more choices for participants in how to respond
to the nudge. In one case, we provide the participants with only one option of which charity to give
to, in the other we provide them with a list of possible charities, thus requiring the participants
to take an active decision. This manipulation is relevant in many domains; for example, nudges
for healthy eating may work better if the choice of healthy alternatives is broader. Giving people a
bigger choice set maximizes the likelihood to meet participants preferences, and decision making
is easier when options are available (but not too many, see e.g. Schwartz, 2005). This is because
comparative decisions (“to which charity: charity A or charity B?”) tend to be easier than absolute
ones (“to give, or not to give?”). Dhar et al. (2000) argue that participants will exert effort to identify
the best possible choice, by focusing on relational characteristics of the alternatives at the expense
1Research in psychology does not explicitly mention default options, but does discriminate between framing-based tech-niques and belief-change strategies, such as message-based persuasion (giving information) (Wood, 2000).
2A related but different strand of research deals with the persistence of nudges, that is, whether repeatedly nudgingindividuals to adopt an action leads to persistent changes in behaviour that may be maintained even in the absence ofthe nudge. Allcott & Rogers (2014) show that the effect of providing comparisons of energy consumption with neighboursdecays at about 10 to 20% per year after an initial phase of two years of nudging. Altmann & Traxler (2014), who studynudges to get dental check-ups, find that later reminders neither increase nor decrease the likelihood to get a check-up.Other research shows that nudges can have adverse effects in the longer term however. de Haan & Linde (2017) show thatproviding a good quality default option in an initial phase of choices makes people too likely to choose the default in a laterphase where the default may also be a bad option.
4
of absolute characteristics of the option. Focusing their attention on comparative aspects of the
choice alternatives complicates the decision process (more information to process) and ought to
make them more susceptible to context effects (in our case, to the default option). Participants will
not focus on the yes/no decision, but rather on comparing the pros and cons of the given options.
This cognitive load will also increase affective decision making, which led to more altruistic choices
in a mini dictator game (Schulz et al., 2014). Furthermore, giving participants the possibility to
make an active choice may make them feel less manipulated: the mere presence of premeditation
in a decision making process, i.e. prior conscious deliberation of alternatives or consequences, leads
to the experience of self-control (Morewedge et al., 2010). This is true even if the premeditation
has no causal relation to the outcome. Merely engaging in effortful thinking before producing a
decision may engender the feeling of control and the sense of agency, consequently leading to more
satisfaction with one’s own choice.
1 The experiment
This study was performed at the Max Planck Institute of Economics in Jena (Germany). In accor-
dance with the Declaration of Helsinki all participants were requested to read an online consent
form and agree with its terms (by clicking) before completing the online experiment.
1.1 Procedure and Materials
The experiment consisted of three successive phases. In the two first phases, participants were
invited to fill out an online survey. They were sent a link to the survey via e-mail. The survey
was hosted on the servers of the Max Planck Institute of Economics and was administered using
the LimeSurvey Open Source survey tool (Schmitz, 2015). Participants were told they would be
remunerated with 2C for participating in each of the first two phases, but that they would obtain
the total amount of 4C only if they completed both phases. Furthermore, they were informed be-
forehand about the location and the dates for collecting their remuneration, which was the third
phase of the experiment.
Online survey. The online survey was only used as cover story for our real aim, which was to
observe how participants responded to the way they were asked to pledge their remuneration to a
charity. The survey consisted of various demographic questions, psychological questionnaires, and
filler tasks (see appendix B).
Phase 1 (Nudge) After completing the online survey subjects were asked to decide whether they
wanted to pledge their remuneration for participation (2C) to a charity, or to keep it for themselves.
Three out of a list of five most popular charities in Germany (Schulz et al., 2015) were chosen to
cover different areas of need (World Wildlife Fund, German Red Cross, Amnesty International).
Nudge. The way in which subjects were asked to pledge their earned money varied along two
dimensions: 1) The default option , which was either to pledge the money to a charity, or to keep
it, and 2) the choice set, whereby subjects were assigned one charity to pledge to, or were given
a choice between three charities to pledge to. The subjects had to exert some effort to avoid the
default option. Specifically, they were asked to type a sentence expressing their wish (either to get
the money themselves or to pledge it to a charity) in case their wish contradicted the default.
If the nudge was to keep the money, then participants read the following:
5
For participation in this first phase of the survey, you will receive from us 2 euros. You
can either keep the 2 euros or donate it to (charity + short description of what it does). If
you want to keep the money, please click on “continue” . If you want to donate the money,
then please write the following sentence in the free field below: “I want to donate the 2
euros to the (charity)”.
If the nudge was to pledge the money, then participants read the following:
For participation in this first phase of the survey, you will receive from us 2 euros. You
can either keep the 2 euros or donate it to (charity + short description of what it does). If
you want to donate the money, please click on “continue”. If you want to keep the money,
then please write the following sentence in the free field below: “I want to keep the 2 euros
for myself”.
Going against the default thus involves writing down one’s intention. The ideal default is such
that one option is chosen in advance by the “choice architect” but switching to the other option(s) is
costless. In our case, going against the default requires some typing, and writing down one’s inten-
tions may anchor the behaviour in a reflective thinking mode, whereby the intention is internalized
and consequently more likely to be followed through.3 However, default interventions as they are
implemented in practice seldom correspond to this ideal. If the default is not to donate one’s organ
after death, for example, then one must carry a card if one wishes to donate, while there is no need
to carry a card if one is satisfied with the default option. If the default is to enrol in a saving plan or
into health coverage, going against this may require filling additional forms to send an expression
to the contrary. If fruits are displayed prominently at the cafeteria, then less healthy options are
relegated to a less prominent display, which means one must exert more effort to reach them.
In all treatments, and in order to avoid that some participants decide to donate to save them-
selves the bother to come collect their remuneration after the experiment, the participants were
warned with the following text:
Note that whether you donate or not, you will need to come collect the money at the
University in order to sign a receipt. Only after this will we be able to pay you the money
or transfer it to the charity. Payment will be made anonymously, that is, the person who
will pay you will not know what option you chose.
The decision to pledge in phase 1 constitutes Dependent Variable 1 (“DV1”) “pledges phase 1”.
Phase 2 (No nudge). The second phase followed the first after an interval of two weeks. The
same participants were invited to fill another survey for 2C and were asked to actively decide
(without a default) how to proceed with the newly earned money (keep the money or pledge to
charity). Unlike in the first phase, choosing one option or the other required the same effort:
checking a box. Subjects who had a choice of charities in the first phase still had the same choices
in the second phase, while subjects with only one option in the first phase had the same option in
the second phase. Note that in our experiment, subjects cannot change their first phase decision in
the second phase. We therefore do not allow for reneging as in Andreoni & Serra-Garcia (2016).
Participants read the following:
For participation in the second phase of the survey, you will receive from us 2 euros.
Once again, you can decide what happens with your money. You can keep the money for
yourself, or donate it to (charity). Please decide for an option:
3We thank Steffen Huck for this remark.
6
• I want to keep the 2 euros for myself.
• I want to donate the 2 euros to the (charity).
Again, subjects were warned that they needed to come collect the money and sign a receipt even if
they chose to donate it.
The decision to pledge in phase 2 constitutes DV2 “pledges phase 2”.
Attitudes to charities. After the pledging decision in each of the two first phases, subjects were
asked to fill out a questionnaire measuring their attitude to the charities.
Due to a lack of an already validated measuring instrument, a questionnaire was designed to fit
the purpose of the study.4 We followed common principles of questionnaire design in attitude and
opinion research (Lietz, 2008). The items were chosen to measure an individual’s attitude towards
each tested charity, and included measures of trust towards the charity as outlined in Cheung &
Chan (2000).
To measure individual attitude towards each charity, we asked participants to answer a 10 item
questionnaire (see appendix A.1). Participants answered each of the questions on a 7 point Likert
scale (1= strongly disagree; 7= strongly agree). Some items were negatively worded. For analysis,
negatively worded items were recoded so that their valence matched the positively worded items.
DV3 “Attitude to charity” is the sum of recoded answers. Higher values of DV3 thus indicate a more
positive attitude.
We evaluated the psychometric properties of this questionnaire by assessing its internal consis-
tency and test-retest reliability. Internal consistency refers to the extent to which all of the items
in a scale measure different aspects of the same attribute. Cronbach’s α measures the reliability of
the test and is commonly used in questions with more than two possible responses. α ranges from
0 to 1, with α = .7 or greater being considered as sufficiently reliable (Hogan, 2013). Cronbach’s
α for the questionnaire ranged from 0.86 to 0.92 depending on the charity in the first phase, and
from 0.87 to 0.92 in the second phase. We compared answers in the first administration of the ques-
tionnaire (first phase of the experiment) with answers in the second administration (second phase)
so as to measure the internal consistency. Test-retest reliability involves administering the same
measure to the same group of test-takers under the same conditions on two different occasions and
correlating the scores (usually a Person’s correlation). The value for a Pearson’s coefficient can fall
between 0 (no correlation) and 1 (perfect correlation), with values higher than 0.8 being considered
as good (Hogan, 2013). Pearson’s correlation coefficient was calculated on the scores of participants
who participated in both phases. Test-retest reliability ranged from 0.66 to 0.75 depending on the
charity. Overall, this finding, in conjunction with the high Cronbach’s α demonstrate that our atti-
tude questionnaire has good psychometric properties. We denote DV3(1) and DV3(2) the answers
to this questionnaire in phase 1 and in phase 2.
Satisfaction with the drive for money donations. The attitude towards the drive for money do-
nations was elicited at the end of both phases and calculated as a sum of 8 questions (see appendix
A.2), again with negatively and positively coded questions. This is a modestly reliable measure,
with Cronbach’s α = 0.68 in the first phase and α = 0.75 in the second phase. Test-retest reliability
is 0.75. The satisfaction with the drive constitutes DV4 “Satisfaction” with higher values indicat-
ing higher satisfaction. We denote DV4(1) and DV4(2) the answers to this questionnaire in phase
1 and in phase 2.
4See Adena & Mesters (2017) for a recent alternative.
7
Phase 3: Money collection and donations. Participants were given two weeks to collect the
money and were instructed to give out what they had previously pledged in one of three piggy-
banks, each labelled with the name of a different charity. Collecting the money involved some
effort and therefore allowed us to assess the level of commitment to one’s own pledge. Whether the
subject donated (allocated money in a piggy-bank) or not occurred out of sight of the experimenter,
therefore DV5 “Donation” measures the pledges that those people who came to collect the money
had made, and is not a measure of actual donations. However, Table 4 in appendix C shows that the
sum of donations to each charity is consistent with pledges made by those participants who came
to collect the money. 77% of the amount of money pledged by collecting participants was indeed
donated (170C donated for 222C pledged, Table 4). A control questions was also included in phase
2 to test whether people remember the decision they made in phase 1: “Do you remember what
you pledged in the first phase of the experiment?”.5 We find that there was a good correspondence
between pledges and recall of pledges, and between pledges and actual donations. Only 10 subjects
did not remember their pledge of the first phase when completing the survey of the second phase.
97.6% of those who said they kept had indeed kept, and 100% of those who said they had pledged
had indeed pledged.
We kept the donation setting anonymous in order to reduce impression management and social
desirability concerns in participants. Attitudes that are expressed in public differ from private
attitudes as they may reflect normative pressures such as “What would others think about me if
I restrained from donation?” rather than actual preferences. Therefore the experiment was con-
structed in a way that allows us to relate an individual’s behaviour and attitudes to treatments,
but avoids putting their susceptibility to social pressure into the mix.
Control treatment. The procedure was supplemented with a control treatment where subjects
only took part in the first phase of the experiment and were asked to fill out the survey and to state
their attitudes towards the three charities, without being asked for donation. This treatment was
introduced to compare how a drive for money (with or without nudge) affects attitudes towards the
charity and the nudger as compared to a baseline without this request.
Control questions. To measure individual involvement with the study the same questions (demo-
graphic questions in online survey) were asked in the first and the second phase of the experiment.
Inconsistent subjects (inconsistency in more than 10% of questions between phase 1 and 2) would
be eliminated from the analysis. Subjects turned out to be very consistent between phase 1 and
phase 2, as shown in table 3 of appendix C.
Participants
3762 subjects from the ORSEE participant database of the Max Planck Institute of Economics
in Jena were invited via e-mail to take part in the experiment (Greiner, 2015). Termination of data
collection was decided in advance, based on a fixed amount of days (3 days). Our goal was to obtain
150-200 participants per treatment in order to have a probability higher than 80% of observing a
significant difference between pledges when the nudge is to keep and pledges when the nudge is to
pledge. Simulations were run assuming the nudge increased pledges by 10 to 15% from a level of
20 to 30%, and we required a 5% significance level with a Welch t-test with unequal variances.
790 participants (mean age 24; 65% female, 95% Germans; 56% high school degree) completed
5Possible answers were 1. Yes, I can remember, I pledged. 2. Yes, I can remember, I did not pledge. 3. I am not sure if I
pledged or not 4. No, I cannot remember what I decided.
8
the first phase (26% response rate).6 Of those, 679 (86%) went on to complete the second phase,7
and 366 (47%) came to collect their remuneration for participation (4C). A further 202 participants
went through phase 1 only and were not asked for donations. 94 (74%) came to collect their remu-
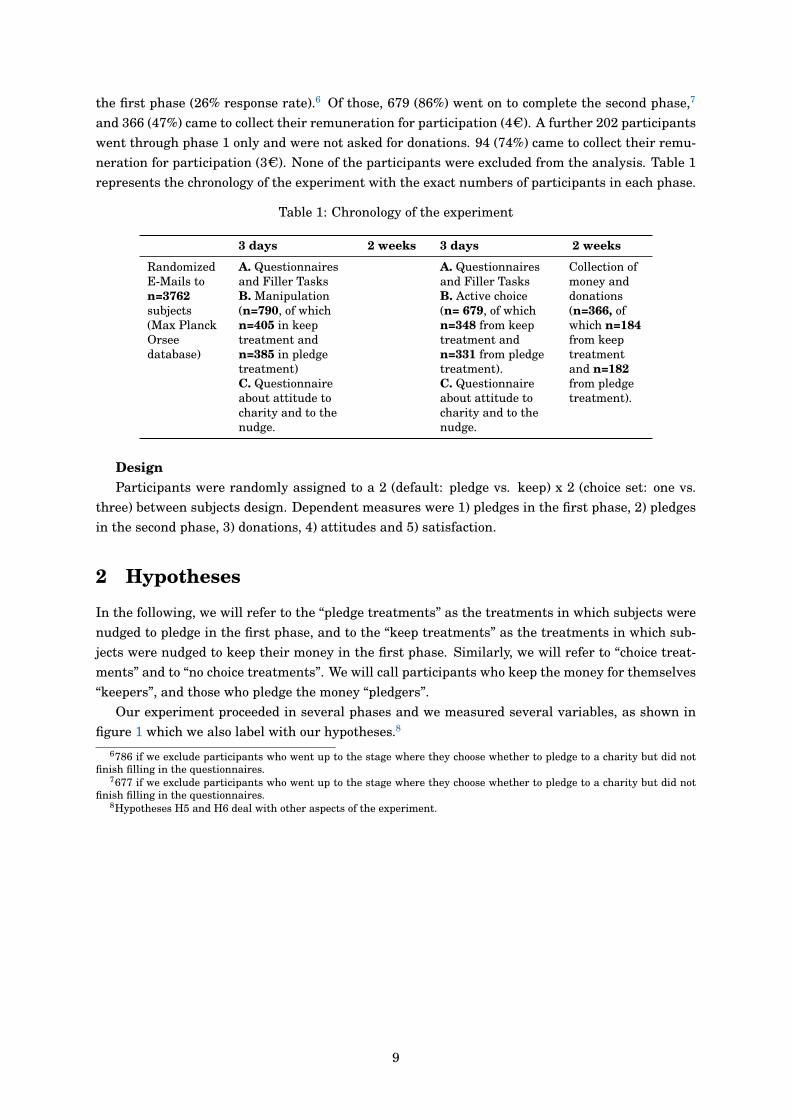
neration for participation (3C). None of the participants were excluded from the analysis. Table 1
represents the chronology of the experiment with the exact numbers of participants in each phase.
Table 1: Chronology of the experiment
3 days 2 weeks 3 days 2 weeks
RandomizedE-Mails ton=3762
subjects(Max PlanckOrseedatabase)
A. Questionnairesand Filler Tasks
A. Questionnairesand Filler Tasks
Collection ofmoney anddonations(n=366, ofwhich n=184
from keeptreatmentand n=182
from pledgetreatment).
B. Manipulation(n=790, of whichn=405 in keeptreatment andn=385 in pledgetreatment)
B. Active choice(n= 679, of whichn=348 from keeptreatment andn=331 from pledgetreatment).
C. Questionnaireabout attitude tocharity and to thenudge.
C. Questionnaireabout attitude tocharity and to thenudge.
Design
Participants were randomly assigned to a 2 (default: pledge vs. keep) x 2 (choice set: one vs.
three) between subjects design. Dependent measures were 1) pledges in the first phase, 2) pledges
in the second phase, 3) donations, 4) attitudes and 5) satisfaction.
2 Hypotheses
In the following, we will refer to the “pledge treatments” as the treatments in which subjects were
nudged to pledge in the first phase, and to the “keep treatments” as the treatments in which sub-
jects were nudged to keep their money in the first phase. Similarly, we will refer to “choice treat-
ments” and to “no choice treatments”. We will call participants who keep the money for themselves
“keepers”, and those who pledge the money “pledgers”.
Our experiment proceeded in several phases and we measured several variables, as shown in
figure 1 which we also label with our hypotheses.8
6786 if we exclude participants who went up to the stage where they choose whether to pledge to a charity but did notfinish filling in the questionnaires.
7677 if we exclude participants who went up to the stage where they choose whether to pledge to a charity but did notfinish filling in the questionnaires.
8Hypotheses H5 and H6 deal with other aspects of the experiment.
9
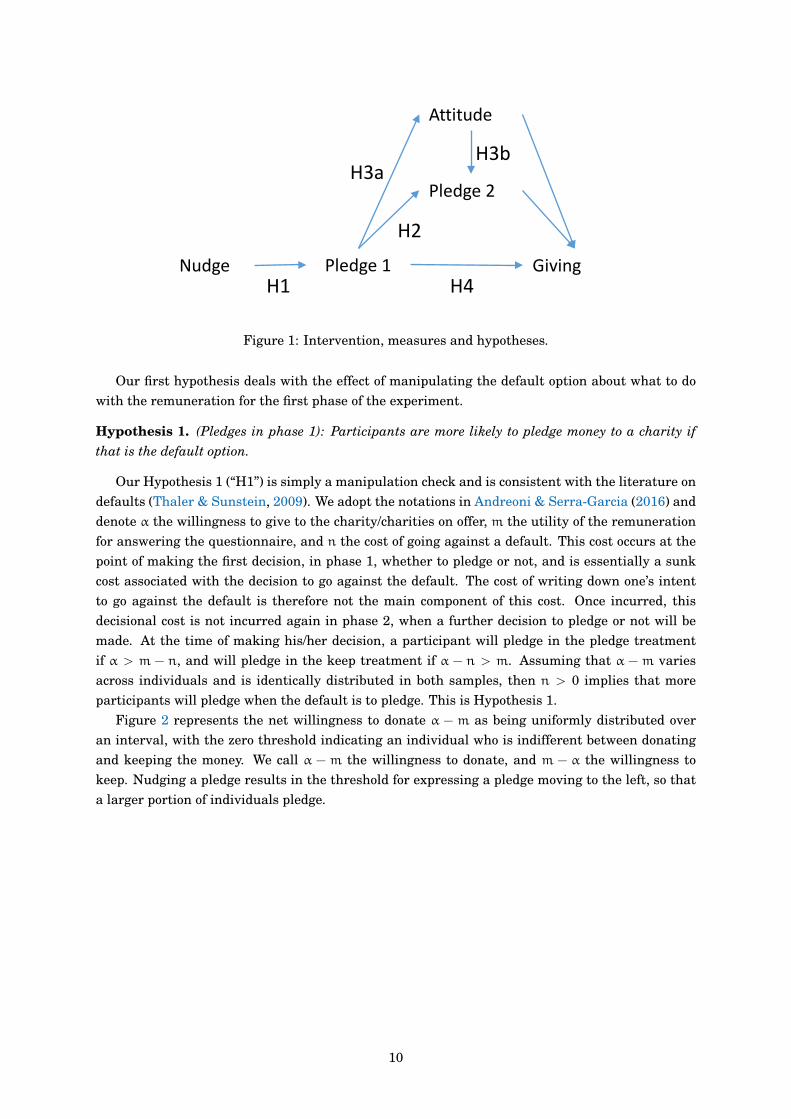
Pledge 1
Pledge 2
Attitude
GivingNudge
H1 H4
H2
H3aH3b
Figure 1: Intervention, measures and hypotheses.
Our first hypothesis deals with the effect of manipulating the default option about what to do
with the remuneration for the first phase of the experiment.
Hypothesis 1. (Pledges in phase 1): Participants are more likely to pledge money to a charity if
that is the default option.
Our Hypothesis 1 (“H1”) is simply a manipulation check and is consistent with the literature on
defaults (Thaler & Sunstein, 2009). We adopt the notations in Andreoni & Serra-Garcia (2016) and
denote α the willingness to give to the charity/charities on offer, m the utility of the remuneration
for answering the questionnaire, and n the cost of going against a default. This cost occurs at the
point of making the first decision, in phase 1, whether to pledge or not, and is essentially a sunk
cost associated with the decision to go against the default. The cost of writing down one’s intent
to go against the default is therefore not the main component of this cost. Once incurred, this
decisional cost is not incurred again in phase 2, when a further decision to pledge or not will be
made. At the time of making his/her decision, a participant will pledge in the pledge treatment
if α > m − n, and will pledge in the keep treatment if α − n > m. Assuming that α − m varies
across individuals and is identically distributed in both samples, then n > 0 implies that more
participants will pledge when the default is to pledge. This is Hypothesis 1.
Figure 2 represents the net willingness to donate α − m as being uniformly distributed over
an interval, with the zero threshold indicating an individual who is indifferent between donating
and keeping the money. We call α − m the willingness to donate, and m − α the willingness to
keep. Nudging a pledge results in the threshold for expressing a pledge moving to the left, so that
a larger portion of individuals pledge.
10
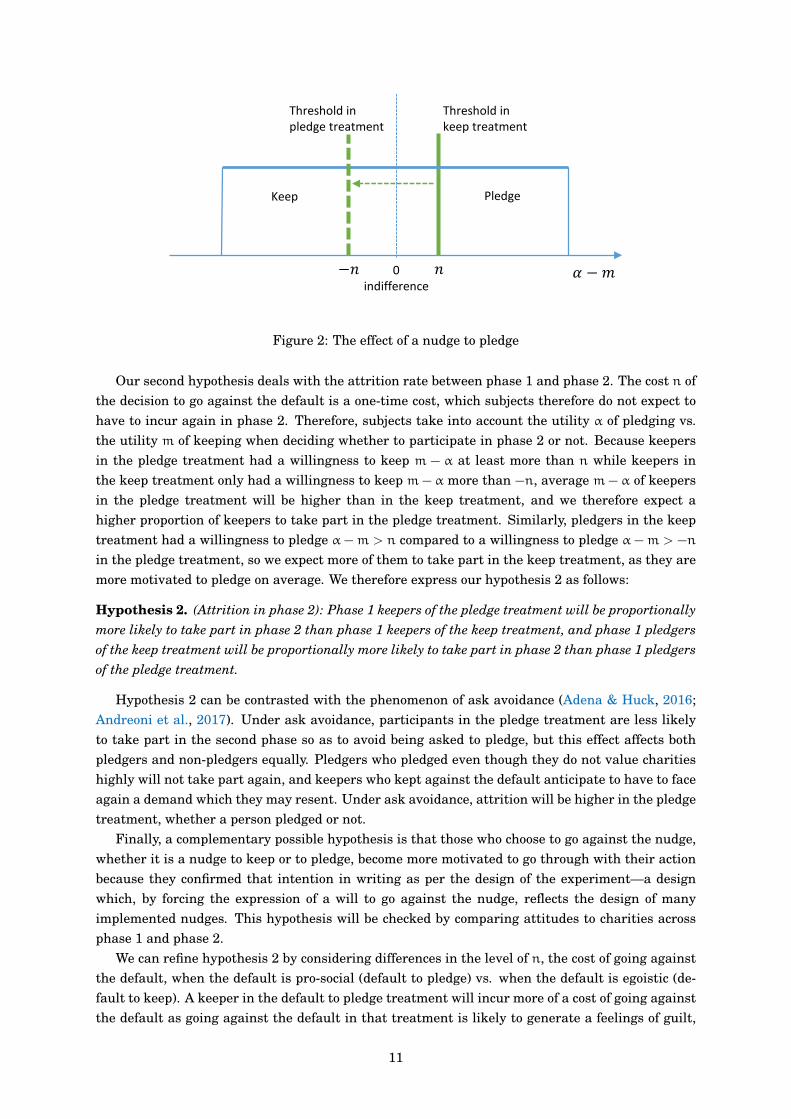
� −Keep Pledge
0
indifference
Threshold in
keep treatment
Threshold in
pledge treatment
−Figure 2: The effect of a nudge to pledge
Our second hypothesis deals with the attrition rate between phase 1 and phase 2. The cost n of
the decision to go against the default is a one-time cost, which subjects therefore do not expect to
have to incur again in phase 2. Therefore, subjects take into account the utility α of pledging vs.
the utility m of keeping when deciding whether to participate in phase 2 or not. Because keepers
in the pledge treatment had a willingness to keep m − α at least more than n while keepers in
the keep treatment only had a willingness to keep m − α more than −n, average m − α of keepers
in the pledge treatment will be higher than in the keep treatment, and we therefore expect a
higher proportion of keepers to take part in the pledge treatment. Similarly, pledgers in the keep
treatment had a willingness to pledge α −m > n compared to a willingness to pledge α −m > −n
in the pledge treatment, so we expect more of them to take part in the keep treatment, as they are
more motivated to pledge on average. We therefore express our hypothesis 2 as follows:
Hypothesis 2. (Attrition in phase 2): Phase 1 keepers of the pledge treatment will be proportionally
more likely to take part in phase 2 than phase 1 keepers of the keep treatment, and phase 1 pledgers
of the keep treatment will be proportionally more likely to take part in phase 2 than phase 1 pledgers
of the pledge treatment.
Hypothesis 2 can be contrasted with the phenomenon of ask avoidance (Adena & Huck, 2016;
Andreoni et al., 2017). Under ask avoidance, participants in the pledge treatment are less likely
to take part in the second phase so as to avoid being asked to pledge, but this effect affects both
pledgers and non-pledgers equally. Pledgers who pledged even though they do not value charities
highly will not take part again, and keepers who kept against the default anticipate to have to face
again a demand which they may resent. Under ask avoidance, attrition will be higher in the pledge
treatment, whether a person pledged or not.
Finally, a complementary possible hypothesis is that those who choose to go against the nudge,
whether it is a nudge to keep or to pledge, become more motivated to go through with their action
because they confirmed that intention in writing as per the design of the experiment—a design
which, by forcing the expression of a will to go against the nudge, reflects the design of many
implemented nudges. This hypothesis will be checked by comparing attitudes to charities across
phase 1 and phase 2.
We can refine hypothesis 2 by considering differences in the level of n, the cost of going against
the default, when the default is pro-social (default to pledge) vs. when the default is egoistic (de-
fault to keep). A keeper in the default to pledge treatment will incur more of a cost of going against
the default as going against the default in that treatment is likely to generate a feelings of guilt,
11
while going against the default by pledging in the default to keep treatment may actually make the
giver sufficient feelings of a warm glow to compensate for the cost of making a decision against a
default and the physical cost of writing one’s wish to pledge (Andreoni et al., 2017). Therefore, we
expect that n for keepers in phase 1 of the pledge treatment will be higher than n for pledgers in
phase 1 in the keep treatment. Therefore, differences in the attrition rate will be more pronounced
across treatment for keepers than for pledgers.
Our third hypothesis is that, in order to avoid cognitive dissonance (Festinger, 1962), people
may adapt their attitudes to align with their chosen option (Cooper & Fazio, 1984). Indeed, changes
in attitude-relevant behaviour can lead to changes in behaviour, as pointed out in Wood (2000), and
people commonly tend to infer their attitudes from their own prior behaviour (Bem, 1972; Olson
& Stone, 2005). Pledging in the first phase and keeping in the second phase would thus lead to
a cognitive dissonance. Another way to express this is that the default in phase 1 may become
internalized by participants. Since participants may infer their attitude towards the charity from
their nudge-induced behaviour, they may self-justify their act (pledging) by updating their own
self-concept into “I’m a good person”, “I’m a person who gives to charity”, which might evoke a
positive feeling. In order to be able to evoke this positive feeling again, and to be consistent with
their own updated self-view, people are then more eager to repeat behaviour displayed previously.9
Another reason participants who are nudged to pledge may keep on pledging is that they may
find out they are happy to have done so even if they would not have pledged without a nudge (Anik
et al., 2011). They would thus wish to repeat the experience.
Behaviour and attitude towards or against the charity and the nudging institution may there-
fore be shaped by pledges in the first phase. We hypothesize that participants who pledged in
the first phase are likely to develop better attitudes to the charities—as measured with attitude
to charities (DV3)—and will be more likely to pledge in phase 2. Conversely, keepers are likely
to develop worse attitudes to the charities and not to pledge in phase 2. Since participants who
were nudged to pledge in the first phase are more likely to pledge in the first phase, we express
hypothesis 3 as follows:
Hypothesis 3. (Pledges in phase 2): Average attitude to charities (a) and pledges (b) will be higher
in phase 2 in the pledge treatment than in the keep treatment.
In other terms, our hypothesis is that α, the willingness to pledge, increases after a pledge is
made. Higher frequency of pledges in phase 1 of the pledge treatments should thus lead to higher
average α in phase 2. Furthermore, since the condition for pledging in phase 2 is that α > m
—there are no defaults in that phase — then higher α in phase 2 leads to higher frequency of
pledges in the second phase of the pledge treatments than in the keep treatments.
We will control pledges in phase 2 with pledges in phase 1, as some subjects might have wished
to donate only half of their remuneration. For those subjects, a nudge to pledge in phase 1 results in
them being more likely to express their pledge in that phase, but does not affect the total pledged.
This would lead to lower pledges in phase 2 than in phase 1 in the pledge treatment.
Our fourth hypothesis further explores the level of commitment to the nudge-induced behaviour
by extending hypothesis 2 to the behaviour in phase 3, when participants collect the money and
donate the money they pledged.
9As Freedman & Fraser (1966) say: “Once he has agreed to a request, his attitude may change, he may become, in hisown eyes, the kind of person who does this sort of thing...” (p.73).
12
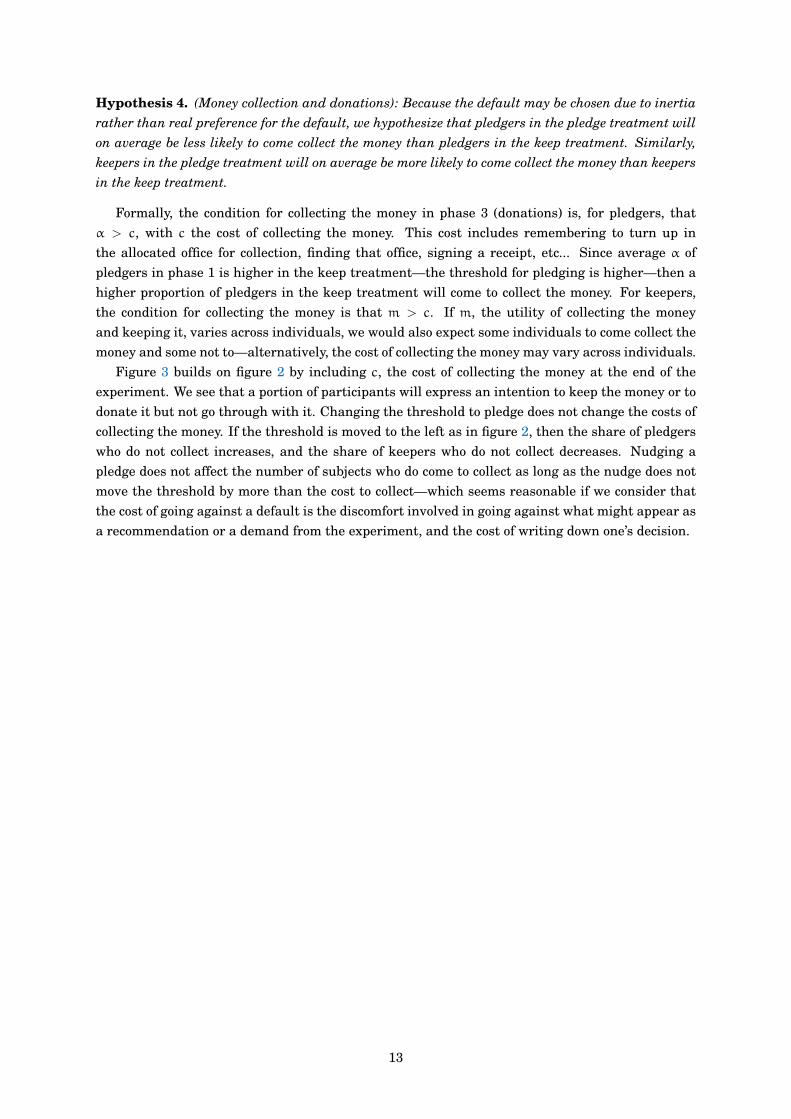
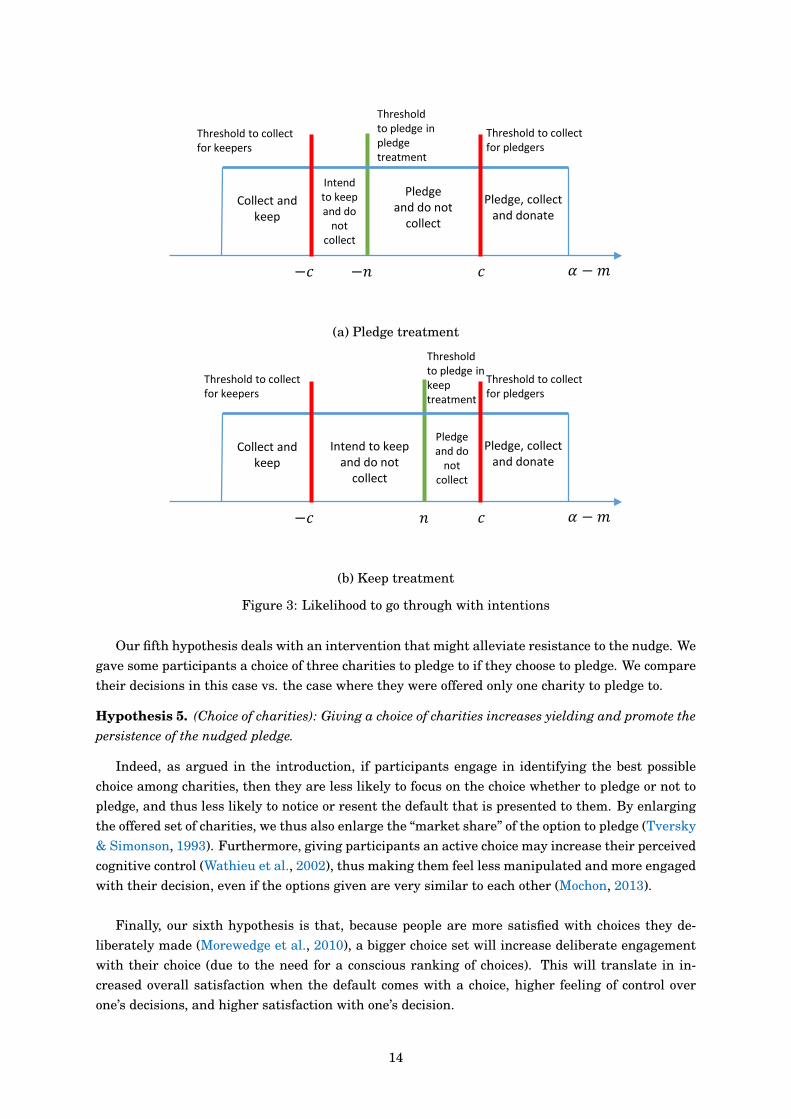
Hypothesis 4. (Money collection and donations): Because the default may be chosen due to inertia
rather than real preference for the default, we hypothesize that pledgers in the pledge treatment will
on average be less likely to come collect the money than pledgers in the keep treatment. Similarly,
keepers in the pledge treatment will on average be more likely to come collect the money than keepers
in the keep treatment.
Formally, the condition for collecting the money in phase 3 (donations) is, for pledgers, that
α > c, with c the cost of collecting the money. This cost includes remembering to turn up in
the allocated office for collection, finding that office, signing a receipt, etc... Since average α of
pledgers in phase 1 is higher in the keep treatment—the threshold for pledging is higher—then a
higher proportion of pledgers in the keep treatment will come to collect the money. For keepers,
the condition for collecting the money is that m > c. If m, the utility of collecting the money
and keeping it, varies across individuals, we would also expect some individuals to come collect the
money and some not to—alternatively, the cost of collecting the money may vary across individuals.
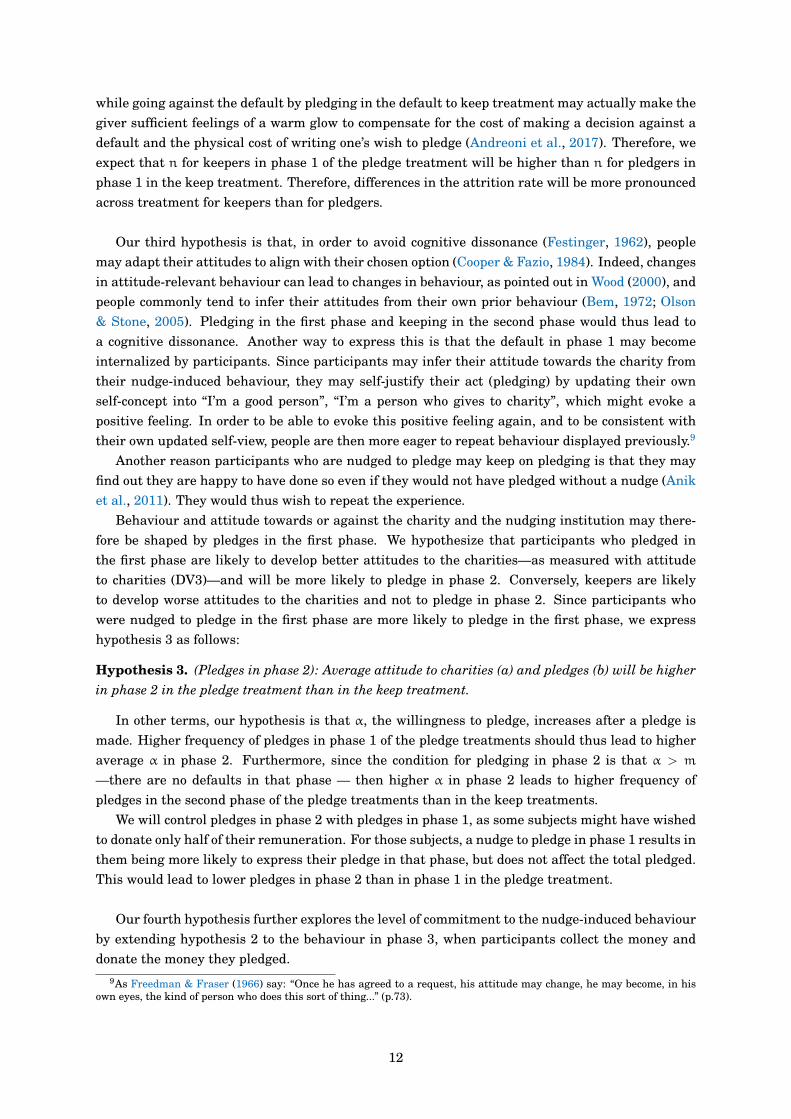
Figure 3 builds on figure 2 by including c, the cost of collecting the money at the end of the
experiment. We see that a portion of participants will express an intention to keep the money or to
donate it but not go through with it. Changing the threshold to pledge does not change the costs of
collecting the money. If the threshold is moved to the left as in figure 2, then the share of pledgers
who do not collect increases, and the share of keepers who do not collect decreases. Nudging a
pledge does not affect the number of subjects who do come to collect as long as the nudge does not
move the threshold by more than the cost to collect—which seems reasonable if we consider that
the cost of going against a default is the discomfort involved in going against what might appear as
a recommendation or a demand from the experiment, and the cost of writing down one’s decision.
13
� −Collect and
keep
Pledge, collect
and donate
Threshold
to pledge in
pledge
treatment
Pledge
and do not
collect
Intend
to keep
and do
not
collect
Threshold to collect
for pledgers
Threshold to collect
for keepers
−� �−(a) Pledge treatment
� −Collect and
keep
Pledge, collect
and donate
Threshold
to pledge in
keep
treatment
Pledge
and do
not
collect
Intend to keep
and do not
collect
Threshold to collect
for pledgers
Threshold to collect
for keepers
−� �(b) Keep treatment
Figure 3: Likelihood to go through with intentions
Our fifth hypothesis deals with an intervention that might alleviate resistance to the nudge. We
gave some participants a choice of three charities to pledge to if they choose to pledge. We compare
their decisions in this case vs. the case where they were offered only one charity to pledge to.
Hypothesis 5. (Choice of charities): Giving a choice of charities increases yielding and promote the
persistence of the nudged pledge.
Indeed, as argued in the introduction, if participants engage in identifying the best possible
choice among charities, then they are less likely to focus on the choice whether to pledge or not to
pledge, and thus less likely to notice or resent the default that is presented to them. By enlarging
the offered set of charities, we thus also enlarge the “market share” of the option to pledge (Tversky
& Simonson, 1993). Furthermore, giving participants an active choice may increase their perceived
cognitive control (Wathieu et al., 2002), thus making them feel less manipulated and more engaged
with their decision, even if the options given are very similar to each other (Mochon, 2013).
Finally, our sixth hypothesis is that, because people are more satisfied with choices they de-
liberately made (Morewedge et al., 2010), a bigger choice set will increase deliberate engagement
with their choice (due to the need for a conscious ranking of choices). This will translate in in-
creased overall satisfaction when the default comes with a choice, higher feeling of control over
one’s decisions, and higher satisfaction with one’s decision.
14
Hypothesis 6. (Attitude to the nudge): Participants who were given a choice of charity will have
higher average satisfaction with the drive for money donations (DV4).
3 Results
The results are presented following the chronology of the experiment and the order of hypotheses.
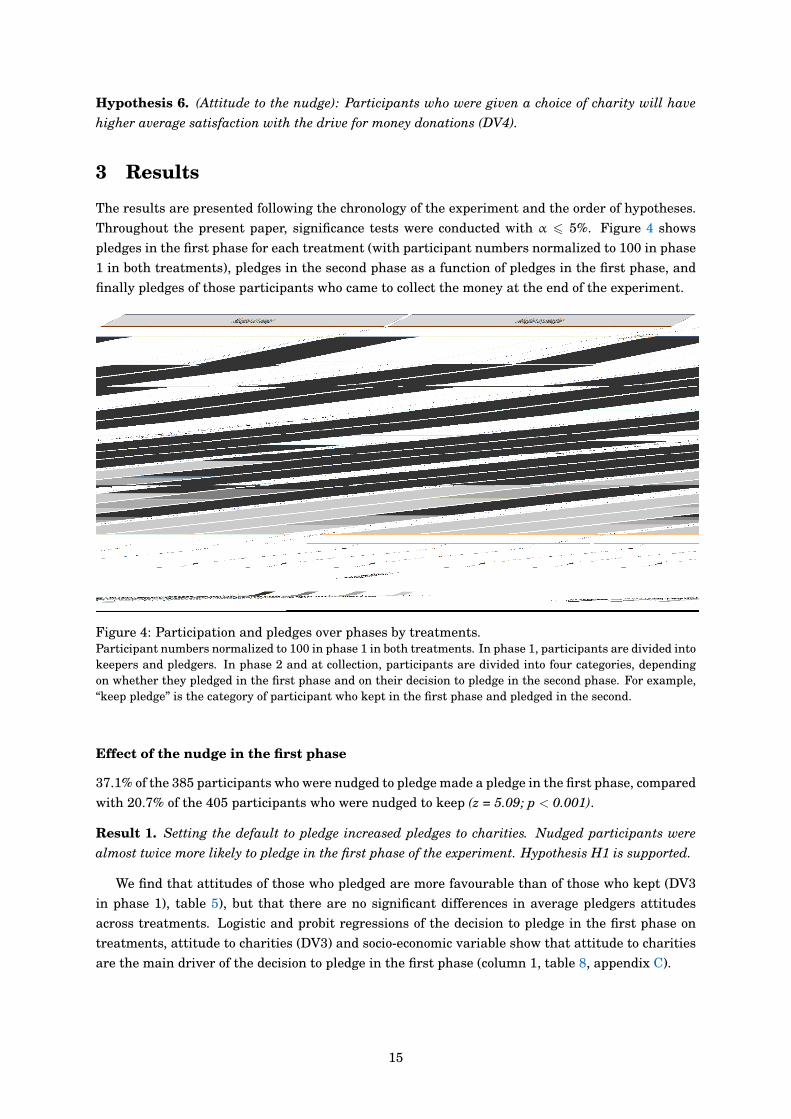
Throughout the present paper, significance tests were conducted with α 6 5%. Figure 4 shows
pledges in the first phase for each treatment (with participant numbers normalized to 100 in phase
1 in both treatments), pledges in the second phase as a function of pledges in the first phase, and
finally pledges of those participants who came to collect the money at the end of the experiment.
Figure 4: Participation and pledges over phases by treatments.Participant numbers normalized to 100 in phase 1 in both treatments. In phase 1, participants are divided into
keepers and pledgers. In phase 2 and at collection, participants are divided into four categories, depending
on whether they pledged in the first phase and on their decision to pledge in the second phase. For example,
“keep pledge” is the category of participant who kept in the first phase and pledged in the second.
Effect of the nudge in the first phase
37.1% of the 385 participants who were nudged to pledge made a pledge in the first phase, compared
with 20.7% of the 405 participants who were nudged to keep (z = 5.09; p < 0.001).
Result 1. Setting the default to pledge increased pledges to charities. Nudged participants were
almost twice more likely to pledge in the first phase of the experiment. Hypothesis H1 is supported.
We find that attitudes of those who pledged are more favourable than of those who kept (DV3
in phase 1), table 5), but that there are no significant differences in average pledgers attitudes
across treatments. Logistic and probit regressions of the decision to pledge in the first phase on
treatments, attitude to charities (DV3) and socio-economic variable show that attitude to charities
are the main driver of the decision to pledge in the first phase (column 1, table 8, appendix C).
15
Effect of the nudge on attrition from the first to the second phase
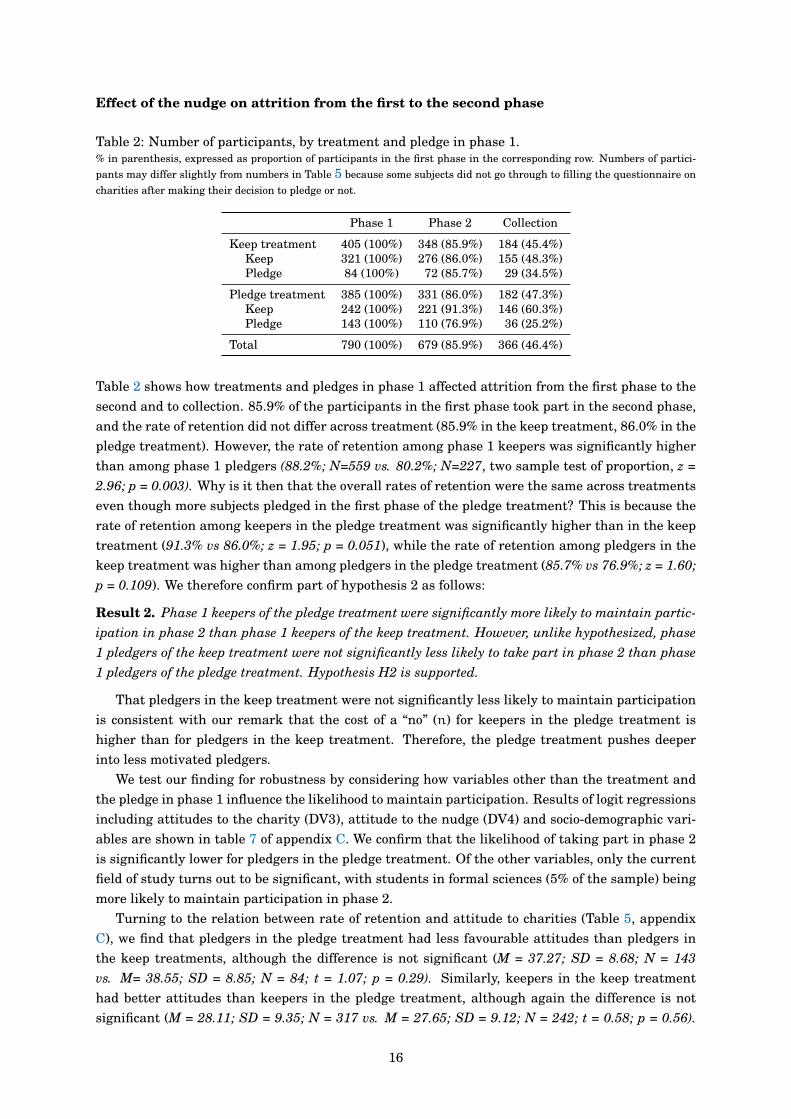
Table 2: Number of participants, by treatment and pledge in phase 1.% in parenthesis, expressed as proportion of participants in the first phase in the corresponding row. Numbers of partici-
pants may differ slightly from numbers in Table 5 because some subjects did not go through to filling the questionnaire on
charities after making their decision to pledge or not.
Phase 1 Phase 2 Collection
Keep treatment 405 (100%) 348 (85.9%) 184 (45.4%)Keep 321 (100%) 276 (86.0%) 155 (48.3%)Pledge 84 (100%) 72 (85.7%) 29 (34.5%)
Pledge treatment 385 (100%) 331 (86.0%) 182 (47.3%)Keep 242 (100%) 221 (91.3%) 146 (60.3%)Pledge 143 (100%) 110 (76.9%) 36 (25.2%)
Total 790 (100%) 679 (85.9%) 366 (46.4%)
Table 2 shows how treatments and pledges in phase 1 affected attrition from the first phase to the
second and to collection. 85.9% of the participants in the first phase took part in the second phase,
and the rate of retention did not differ across treatment (85.9% in the keep treatment, 86.0% in the
pledge treatment). However, the rate of retention among phase 1 keepers was significantly higher
than among phase 1 pledgers (88.2%; N=559 vs. 80.2%; N=227, two sample test of proportion, z =
2.96; p = 0.003). Why is it then that the overall rates of retention were the same across treatments
even though more subjects pledged in the first phase of the pledge treatment? This is because the
rate of retention among keepers in the pledge treatment was significantly higher than in the keep
treatment (91.3% vs 86.0%; z = 1.95; p = 0.051), while the rate of retention among pledgers in the
keep treatment was higher than among pledgers in the pledge treatment (85.7% vs 76.9%; z = 1.60;
p = 0.109). We therefore confirm part of hypothesis 2 as follows:
Result 2. Phase 1 keepers of the pledge treatment were significantly more likely to maintain partic-
ipation in phase 2 than phase 1 keepers of the keep treatment. However, unlike hypothesized, phase
1 pledgers of the keep treatment were not significantly less likely to take part in phase 2 than phase
1 pledgers of the pledge treatment. Hypothesis H2 is supported.
That pledgers in the keep treatment were not significantly less likely to maintain participation
is consistent with our remark that the cost of a “no” (n) for keepers in the pledge treatment is
higher than for pledgers in the keep treatment. Therefore, the pledge treatment pushes deeper
into less motivated pledgers.
We test our finding for robustness by considering how variables other than the treatment and
the pledge in phase 1 influence the likelihood to maintain participation. Results of logit regressions
including attitudes to the charity (DV3), attitude to the nudge (DV4) and socio-demographic vari-
ables are shown in table 7 of appendix C. We confirm that the likelihood of taking part in phase 2
is significantly lower for pledgers in the pledge treatment. Of the other variables, only the current
field of study turns out to be significant, with students in formal sciences (5% of the sample) being
more likely to maintain participation in phase 2.
Turning to the relation between rate of retention and attitude to charities (Table 5, appendix
C), we find that pledgers in the pledge treatment had less favourable attitudes than pledgers in
the keep treatments, although the difference is not significant (M = 37.27; SD = 8.68; N = 143
vs. M= 38.55; SD = 8.85; N = 84; t = 1.07; p = 0.29). Similarly, keepers in the keep treatment
had better attitudes than keepers in the pledge treatment, although again the difference is not
significant (M = 28.11; SD = 9.35; N = 317 vs. M = 27.65; SD = 9.12; N = 242; t = 0.58; p = 0.56).
16
Combined, those two difference explains why, while pledgers had significantly better attitudes to
charities than keepers (M = 37.74; SD = 8.74; N = 227 vs. M = 27.91; SD = 9.24; N = 559; t = 13.72;
p < 0.001), and while more people pledged in the pledge treatments, average attitude to charities
in the pledge treatment was not significantly better than in the keep treatment (M = 31.22; SD =
10.08; N = 385 vs. M = 30.29; SD = 10.17; N = 401; t = 1.29; p = 0.20).
Change in attitudes
We now consider changes in attitudes (DV3) from the first to the second phase. Table 5 of appendix
C shows DV3 in phase 2 (last column) and attitudes as measured in phase 1 for the same sample
(third column). We find that pledgers’ attitudes decreased in a significant way from the first to
the second phase in both treatments (paired t-test), while keepers’ attitudes stayed the same from
the first to the second phase. However, the magnitude of those changes does not depend on the
treatment and can be attributed to a reversion to the mean.
Result 3. Attitudes of participants who were nudged to pledge in the first phase did not improve
or deteriorate noticeably more or less than attitudes of participants who were nudged to keep in the
first phase. Hypothesis H3a is not supported.
Persistence in nudged behaviour
22.1% of the 331 participants who were nudged to pledge in the first phase and participated in the
second phase pledged in that second phase, compared with 21.8% of the 348 participants who were
nudge to keep in the first phase (z = 0.07; p = .95).
Result 4. Participants in the pledge treatment were neither more nor less likely to pledge in the
second phase. Hypothesis H3b is not supported.
Given that there were many more phase 1 pledgers in the pledge treatment, this result means
that pledging was much more likely to persist in the keep treatment. Indeed, we find that persis-
tence in keeping was 92% in the keep treatment—meaning that 92% of keepers in the first phase
kept in the second phase—while it was 99% in the pledge treatments (z = 3.23; p < 0.001). Con-
versely, persistence in pledging was 76.4% in the keep treatment while it was only 63.6% in the
pledge treatment (z = 1.81; p = 0.07).
Consistency in pledging is consistent with attitudes to charities of phase 1 pledgers in the pledge
treatment. Table 6 in appendix C shows that consistent pledgers had the most favourable atti-
tudes to charities, followed by pledgers-keepers, keepers-pledgers and consistent keepers. How-
ever, phase 1 pledgers had less favourable attitudes to charities in the pledge treatment, which
may explain why so few of them went on pledging in phase 2 (70 in 110 vs. 55 in 72 in the keep
treatment).
Overall, a comparison of statistics in the first phase with the second phase is consistent with
the view that nudges did not change attitudes to charities but rather acted only as a momentary
obstacle to following one’s inclination. Confirming this interpretation, we find that attitudes to
charities were more positive in our control treatment, where we did not ask for any pledges than
average attitude to charities in the other treatments (M = 32.07; SD = 8.69; N = 202 vs. M = 30.75;
SD = 10.13; N = 786; t = 1.70; p = 0.09). We can relate this later result to the “ask-avoidance”
evidenced in Adena & Huck (2016), whereby asking for donations may lead subjects to self-justify
not donating by lowering their esteem for the charity being collected for.
17
Commitment towards pledged behaviour
We further measure the level of commitment of our participants to their pledges by requiring all
of them to personally come collect their remuneration for taking part in our two waves of surveys,
whether they stated that they intended to donate the money to a charity or not. As mentioned
on page 8, participants had a good recall of their pledges, and they did go through in their large
majority with their pledges. We can therefore rely on pledges to compare the level of motivation of
our participants depending on the direction of the nudge.
Table 2 shows how treatments and pledges in phase 1 affect attrition from the first phase to
collection. As with attrition from the first to the second phase, we find that the rate of retention
among phase 1 keepers in the pledge treatment was significantly higher than in the keep treatment
(60.3% vs. 48.3%; z = 2.84; p = 0.005), while the rate of retention among pledgers in the keep
treatment was higher, but not significantly so, than among pledgers in the pledge treatment (34.5%
vs. 25.2%; z = 1.50; p = 0.133). We test those results for robustness with logit regressions including
attitudes to the charity (DV3), attitude to the nudge (DV4) and socio-demographic variables (Table
7, appendix C). Those regressions confirm that there was a significant difference in the difference
between the rate of retention of pledgers and keepers in the pledge treatment compared with the
keep treatment. In other words, nudging pledges selected for keepers who were more likely to keep
and pledgers who were less likely to pledge.
Result 5. Phase 1 pledgers in the keep treatment were not significantly more likely to collect the
money at the end of the experiment. However, phase 1 keepers in the pledge treatment were signifi-
cantly more likely to collect the money. Hypothesis 4 is partially supported.
Overall, we thus found that there was a higher rate of attrition in pledgers, and lower rate
of attrition in keepers, in the pledge treatment, and that pledgers in the pledge treatment were
disproportionately more likely not to pledge again in phase 2. This explains why the pledge treat-
ment did not increase the amount pledged by collecting participants (Table 4, appendix C). 112C
was pledged out of 732C distributed in the pledge treatment, while 110C was pledged out of 736C
distributed in the keep treatment (two-sample test of proportion: z = 0.19; p = 0.95).
This result must be interpreted carefully in terms of its consequences on actual donations.
Indeed, our design does not allow us to determine who donated what in our experiment (we guar-
anteed anonymity). However, a combination of good recollection by participants of their pledges,
lower likelihood to collect the money by pledgers, and good overall fit between pledges by collecting
participants and actual donations (Table 4), makes us think that money collected from partici-
pants in the pledge treatments was neither higher or lower than in the keep treatment. Nudges
were therefore ineffective in terms of increasing money donated among participants who came to
collect the money.
Effect of giving alternatives on the consistency of pledges
We found that giving a bigger choice set resulted in pledging subjects having a better attitude to
the charity they pledged to (DV3, three charities: M = 40.73; SD = 8.24; N = 113, one charity:
M = 34.78; SD = 8.24; N = 114; t = 5.43; p < 0.001). This is not surprising since subjects will
generally pledge to the charities they have the best opinion of, so that the first statistic is the
average of the best of three alternatives while the second statistic is simply the average attitude to
a given charity. This better attitude to the pledged charity does not however translate into better
acceptance of the nudge and into a higher likelihood for the elicited behaviour to survive. Among
those participants who participated in both phases, we find that persistence in pledging was higher
18
in the choice treatments, but not significantly so (74.2% of pledgers in the first phase pledged in
the second phase vs. 63.4% in no-choice treatments, z = 1.56; p = 0.12). Similarly, giving a choice
reduced the drop in the proportion of participants pledging from the first to the second phase (drop
from 26.9% to 20.8% in the no-choice treatments, drop from 26.7% to 23.1% in choice treatments),
but again the difference is not significant. We can therefore state that:
Result 6. Giving a choice in how to respond to a nudge to pledge did not make participants signif-
icantly more likely to stick with pledging behaviour from the first to the second phase. Hypothesis 5
is not supported.
We interpret this finding to mean that although people have preferences over charities, the
most important factor in our experiment is their attitude with regard to donations. Participants
may consider “giving to a charity” as an undifferentiated concept, that is, it does not depend on the
charity given to, even in our case where charities differ so much in their activities.10
Effect of giving alternatives on satisfaction with the drive for money donations
We find that satisfaction with the drive for money donations was the same whether there was a
choice of charities or not. With no choice of charities, DV4(1) was 23.4 if the nudge was to keep vs.
23.1 if the nudge was to give, and if there was a choice of charities, then DV4(1) was 23.5 if the
nudge was to keep vs. 23.9 if the nudge was to give. Differences are not significant either in the
second period.
Because DV4 has a relatively low Cronbach’s α and therefore may measure different aspects
of satisfaction with the drive, we run a multivariate regression model, whereby several dependent
variables are jointly regressed on the same independent variables. This allows us to measure
the impact of nudges and choice on answers to individual questions in the DV4 questionnaire
(Appendix A.2). We find that treatments with choice made participants less likely to wish for
a wider choice of charities to contribute to (Question 6), and more likely to be happy with their
decision (Question 7). Pledge treatments made subjects more likely to think the Max Planck Society
wanted to support the work of charities (Question 1), made them trust it more with giving the
money to the charities (Question 2), and more likely to feel pressured to pledge (Question 5). This
last effect is driven by treatments without choice however, and is not present in treatments with
choice. We can therefore state that:
Result 7. Giving a choice of charities did not impact overall satisfaction with the drive for money
donations, but responded to a desire by participants for more choice and alleviated the feeling of
being pressured into pledging. Hypothesis 6 is partially supported.
4 Conclusion
The findings reported here offer new and potentially important insight into the way people react to
nudges. Our data shows a strong impact of default nudges on individual pledging behaviour, but
neither do higher pledges in the short-term predict higher pledges later on, nor do they translate
into noticeably higher actual giving. Why so?
In our study participants who were nudged to pledge money to a charity were almost twice
more likely to do so than participants nudged to keep it. This finding supports earlier experiments
showing the impact of defaults on decision making (e.g. Johnson & Goldstein, 2004; Pichert &
10We thank Robert Sugden for this suggestion.
19
Katsikopoulos, 2008). However, yielding to a nudge did not lead to improvements in attitudes to
charity. A comforting finding for policy makers is that neither did not yielding lead to a harden-
ing in the attitudes of participants. Participants who resisted the nudge to donate did not express
more negative perceptions of the charities than participants who deliberately chose to abstain from
donation. We believe this is because the nudged behaviour did not generate significant cognitive
dissonance to be compensated for by changes in attitudes, as nudges are most likely to have influ-
enced only the behaviour of those participants who were close to indifference between pledging or
not (as evidenced by our attitude measures).
Since nudges work only at the margin, on people close to indifference, it is not surprising that we
were unable to find a long-lasting effect of the nudge. When asking participants for an active deci-
sion concerning donation after a two-week period, pledges by subjects who were previously nudged
to donate were not more frequent than pledges by those previously nudged to keep. Because atti-
tudes are rather enduring (Greenwald, 1968), any influence a simple nudge had on behaviour was
only transitory. Nudges seem to have merely lowered the threshold over which a certain behaviour
(pledging) was displayed, and only when original inclinations against the nudged behaviour were
not strong.
The question that has to be asked at this point is whether increases in pledging brought about
by the nudge resulted in increased donations. We find that those people who actually came to collect
the money behaved largely in accordance with their pledged behaviour. However, total donations
from the sample of subjects who were nudged to pledge were no higher than from the sample who
were not. This is because participants who opted not to pledge even when nudged to pledge were
particularly motivated to keep the money and thus more likely collect the money. Nudging a pledge
thus selected for more motivated participants among those who resisted the nudge. In the same
way, nudging to keep the money selected for more motivated pledgers. This shows that even though
the attitudes of keepers and of pledgers were not impacted by nudges, nudges did result in changes
in the proportion of keepers coming to collect the money, and in the proportion of pledgers coming
to donate it. The effect we evidence here is therefore a selection effect, and is not to be confused
with an effect on attitudes, which we controlled for by eliciting our participants’ attitudes towards
charities.
Contrary to our belief, giving people a bigger set of options to choose from did not result in a
higher likelihood to pledge. A reason for this might be that participants did not have clear prefer-
ences between charities (as evidenced by our attitude measures), but rather preferences between
donating and not donating. We found however that giving people a choice of charities did increase
satisfaction with decisions made and made participants feel less pressured to pledge. Therefore,
we believe that promoting deliberate engagement with nudged behaviour after yielding to a nudge
can improve perceptions by engaging people into consciously ranking different options to choose
the most adequate one. This enhances participants’ feeling of agency and control. This effect of
increasing the range of option when nudging participants is worth further study.
Given these considerations, we can suggest to policy makers that altering the decision context
can guide decisions towards a preferred outcome, but only in the subset of the population that
does not hold strong preferences against it. Getting people to yield to a nudge towards a certain
behaviour selects for participants who are less committed to perform that behaviour than people
who deliberately choose to do so. Nudging people selects for a more committed subset of people
who resist the nudge. Furthermore, nudges do not seem to alter attitudes and behaviour towards
the nudged behaviour, which goes against guaranteeing the persistence of the effect of nudges over
time. Future research could extend our results by formally characterizing ways to transform a one-
time action into permanent behaviour. The goal would be to find ways to bridge the gap between
20
the unconsciously guided (nudged) action and a conscious change in value. This could be done by
highlighting the benefits the nudged behaviour brought to those who yielded to it. Overall, our
results support the notion that default nudges are effective for specific and limited alterations of
behaviour, but are not enough for the transformational changes in values and attitudes that are
needed for long-term success. Only a more detailed understanding of the nature of the relationship
between nudges, attitudes and actual behaviour might provide the kind of insights necessary to
improve the effectiveness of such policy interventions.
References
Adena, M., & Huck, S. (2016). Online fundraising, self-deception, and the long-term impact of ask
avoidance. Working Paper SP II 2016-306, WZB.
Adena, M., & Mesters, F. (2017). A short scale for measuring trust in a charity. Companion paper
to WZB Working Paper SP II 2017–302.
Allcott, H., & Rogers, T. (2014). The short-run and long-run effects of behavioral interventions:
Experimental evidence from energy conservation. American Economic Review, 104(10), 3003–
37.
Altmann, S., Armin, F., Heidhues, P., & Jayaraman, R. (2014). Defaults and donations: Evidence
from a field experiment. Working Paper 5118, CESifo.
Altmann, S., & Traxler, C. (2014). Nudges at the dentist. European Economic Review, 72, 19–38.
Anderson, C. J. (2003). The psychology of doing nothing: Forms of decision avoidance result from
reason and emotion. Psychological Bulletin, 129(1), 139–167.
Andreoni, J., & Payne, A. A. (2013). Charitable giving. Handbook of public economics, 5, 1–50.
Andreoni, J., Rao, J. M., & Trachtman, H. (2017). Avoiding the ask: A field experiment on altruism,
empathy, and charitable giving. Journal of Political Economy, 125(3), 625–653.
Andreoni, J., & Serra-Garcia, M. (2016). Time-inconsistent charitable giving. Working Paper
22824, National Bureau of Economic Research.
Anik, L., Aknin, L. B., Norton, M. I., & Dunn, E. W. (2011). Feeling good about giving: The benefits
(and costs) of self-interested charitable behavior. In D. Oppenheimer, & C. Olivola (Eds.) The
Science of Giving: Experimental Approaches to the Study of Charity, (pp. 1–28). New York, NY:
Psychology Press.
Bem, D. J. (1972). Self-perception theory. Advances in Experimental Social Psychology, 6, 1–62.
Bucher, T., Collins, C., Rollo, M. E., McCaffrey, T. A., Vlieger, N. D., Bend, D. V. d., Truby, H., &
Perez-Cueto, F. J. A. (2016). Nudging consumers towards healthier choices: a systematic review
of positional influences on food choice. British Journal of Nutrition, 115(12), 2252–2263.
Cheung, C. K., & Chan, C. M. (2000). Social-cognitive factors of donating money to charity, with
special attention to an international relief organization. Evaluation and Program Planning,
23(2), 241–253.
21
Choi, J. J., Laibson, D., Madrian, B. C., & Metrick, A. (2006). Saving for retirement on the path of
least resistance. In E. McCaffrey, & J. Slemrod (Eds.) Behavioral Public Finance: Toward a New
Agenda, (pp. 304–352). New York, NY: Russell Sage Foundation.
Cooper, J., & Fazio, R. (1984). A new look at dissonance theory. In Advances In Experimental Social
Psychology, vol. 17, (pp. 229–266). Orlando, Florida: Academic Press.
de Haan, T., & Linde, J. (2017). ‘Good nudge lullaby’: Choice architecture and default bias rein-
forcement. The Economic Journal. Online in advance of print.
DellaVigna, S., & Malmendier, U. (2006). Paying not to go to the gym. American Economic Review,
96(3), 694–719.
Dhar, R., Nowlis, S. M., & Sherman, S. J. (2000). Trying hard or hardly trying: An analysis of
context effects in choice. Journal of Consumer Psychology, 9(4), 189–200.
Dolinski, D., & Nawrat, R. (1998). ‘Fear-then-relief ’ procedure for producing compliance: Beware
when the danger is over. Journal of Experimental Social Psychology, 34(1), 27–50.
Felsen, G., Castelo, N., & Reiner, P. B. (2013). Decisional enhancement and autonomy: Public
attitudes towards overt and covert nudges. Judgment and Decision Making, 8, 202–213.
Festinger, L. (1962). A Theory of Cognitive Dissonance. Stanford, CA: Stanford University Press.
Freedman, J. L., & Fraser, S. C. (1966). Compliance without pressure: The foot-in-the-door tech-
nique. Journal of Personality and Social Psychology, 4(2), 195–202.
Greenwald, A. G. (1968). Cognitive learning, cognitive response to persuasion, and attitude change.
In A. G. Greenwald, T. C. Brock, & T. M. Ostrom (Eds.) Psychological Foundations of Attitudes,
chap. 6, (pp. 147–170). New York, NY: Academic Press.
Greiner, B. (2015). Subject pool recruitment procedures: Organizing experiments with ORSEE.
Journal of the Economic Science Association, 1(1), 114–125.
Hansen, P. G., & Jespersen, A. M. (2013). Nudge and the manipulation of choice: A framework
for the responsible use of the nudge approach to behaviour change in public policy. European
Journal of Risk Regulation, 4(1), 3–28.
Hogan, T. P. (2013). Psychological Testing: A Practical Introduction. Hoboken, NJ: Wiley, 3 edition
ed.
Johnson, J., & Goldstein, G. (2004). Defaults and donation decisions. Transplantation, 78(12),
1713–1716.
Kataria, M., Levati, M. V., & Uhl, M. (2014). Paternalism with hindsight: Do proteges react
consequentialistically to paternalism? Social Choice and Welfare, 43(3), 731–746.
Lietz, P. (2008). Questionnaire design in attitude and opinion research: Current state of an art.
FOR 655 Working Paper 13/2008, Jacobs-University Bremen.
Madrian, B. C., & Shea, D. F. (2001). The power of suggestion: Inertia in 401(k) participation and
savings behavior. The Quarterly Journal of Economics, 116(4), 1149–1187.
Marteau, T., Ogiilvi, D., Roland, M., Suhrcke, M., & Kelly, M. (2011). Judging nudging: Can
nudging improve population health? British Medical Journal, 342(228), 263–265.
22
McKenzie, C., Liersch, M., & Finkelstein, S. (2006). Recommendations implicit in policy defaults.
Psychological Science, 17, 414–420.
Mochon, D. (2013). Single-Option Aversion. Journal of Consumer Research, 40(3), 555–566.
Momsen, K., & Stoerk, T. (2014). From intention to action: Can nudges help consumers to choose
renewable energy? Energy Policy, 74, 376–382.
Morewedge, C., Gray, K., & Wegner, D. M. (2010). Perish the forethought: premeditation engenders
misperceptions of personal control. In R. Hassin, K. Ochsner, & Y. Trope (Eds.) Self-control in
Society, Mind and Brain, chap. 14, (pp. 260–278). New York, NY: Oxford University Press.
Olson, J., & Stone, J. (2005). The influence of behavior on attitudes. In D. Albarracin, B. T. Johnson,
& M. P. Zanna (Eds.) The Handbook of Attitudes, (pp. 223–271). Mahwah, NJ: Lawrence Erlbaum
Associates.
Pedersen, S. K., Koch, A. K., & Nafziger, J. (2014). Who wants paternalism? Bulletin of Economic
Research, 66(S1), S147–S166.
Pichert, D., & Katsikopoulos, K. (2008). Green defaults: Information presentation and proenviron-
mental behaviour. Journal of Environmental Psychology, 28, 63–73.
Radley, A., & Kennedy, M. (1995). Charitable giving by individuals: A study of attitudes and
practice. Human Relations, 48(6), 685–709.
Samuelson, W., & Zeckhauser, R. (1988). Status quo bias in decision making. Journal of Risk and
Uncertainty, 1(1), 7–59.
Schmitz, C. (2015). LimeSurvey: An open source survey tool. http://www.limesurvey.org.
Schneider, W., & Shiffrin, R. M. (1977). Controlled and automatic human information processing:
I. Detection, search, and attention. Psychological Review, 84(1), 1–66.
Schulz, J., Thiemann, P., & Thoeni, C. (2015). Defaults in charitable giving. Working Paper 2015-
06, The Centre for Decision Research and Experimental Economics, School of Economics, Uni-
versity of Nottingham.
Schulz, J. F., Fischbacher, U., Thoni, C., & Utikal, V. (2014). Affect and fairness: Dictator games
under cognitive load. Journal of Economic Psychology, 41, 77–87.
Schwartz, B. (2005). The Paradox of Choice: Why More Is Less. New York, NY: Harper Perennial.
Thaler, R. H., & Sunstein, C. R. (2009). Nudge: Improving Decisions About Health, Wealth, and
Happiness. New York, NY: Penguin Books.
Tversky, A., & Simonson, I. (1993). Context-dependent preferences. Management Science, 39(10),
1179–1189.
Wathieu, L., Brenner, L., Carmon, Z., Chattopadhyay, A., Wertenbroch, K., Drolet, A., Gourville,
J., Muthukrishnan, A. V., Novemsky, N., Ratner, R. K., & Wu, G. (2002). Consumer Control and
Empowerment: A Primer. Marketing Letters, 13(3), 297–305.
Webb, T. L., & Sheeran, P. (2006). Does changing behavioral intentions engender behavior change?
a meta-analysis of the experimental evidence. Psychological Bulletin, 132(2), 249–268.
23
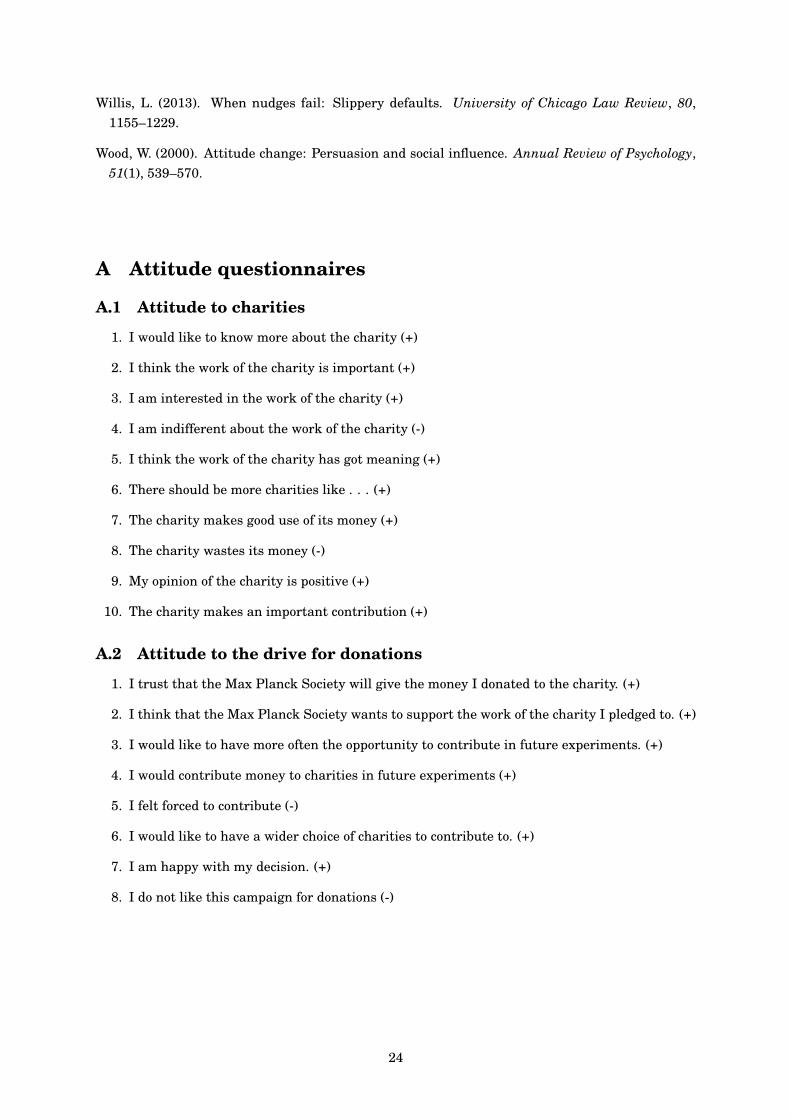
Willis, L. (2013). When nudges fail: Slippery defaults. University of Chicago Law Review, 80,
1155–1229.
Wood, W. (2000). Attitude change: Persuasion and social influence. Annual Review of Psychology,
51(1), 539–570.
A Attitude questionnaires
A.1 Attitude to charities
1. I would like to know more about the charity (+)
2. I think the work of the charity is important (+)
3. I am interested in the work of the charity (+)
4. I am indifferent about the work of the charity (-)
5. I think the work of the charity has got meaning (+)
6. There should be more charities like . . . (+)
7. The charity makes good use of its money (+)
8. The charity wastes its money (-)
9. My opinion of the charity is positive (+)
10. The charity makes an important contribution (+)
A.2 Attitude to the drive for donations
1. I trust that the Max Planck Society will give the money I donated to the charity. (+)
2. I think that the Max Planck Society wants to support the work of the charity I pledged to. (+)
3. I would like to have more often the opportunity to contribute in future experiments. (+)
4. I would contribute money to charities in future experiments (+)
5. I felt forced to contribute (-)
6. I would like to have a wider choice of charities to contribute to. (+)
7. I am happy with my decision. (+)
8. I do not like this campaign for donations (-)
24
B Questionnaires
B.1 Questionnaire for phase 1:
You are taking part in an experiment that is financed by the MPI for Economics. As stated in your
invitation mail, this experiment consists of two phases. The first phase is starting now. We will
contact you in two weeks for the second phase. Click on “continue” to start phase 1.
Q1. Are you ready to take part in the second part of the experiment in two weeks? (You will be
allowed to go on with the experiment only if you click on “Yes”)
Section A: Personal information
Phase 1 starts with a questionnaire. Please answer the following questions truthfully. Click on
“continue” to go on to the next question. Please remember that your answers will be anonymized
for the purpose of our analysis of the data and that your answers can therefore not be linked back
to you.
1. What is your gender? (Male, Female)
2. How old are you?
3. What is your nationality?
4. What is your highest qualification? (Abitur (High School), two-years University degree, Bach-
elor, Master, Diplom (=Master), PhD, Other)
5. Did your parents complete their secondary education? (1. None of my parents completed
secondary education; 2. Only one of my parents completed secondary education; 3. Both
parents completed secondary education)
6. Please tell us your current status (Student (Full or part-time), Worker (Full or part-time),
Unemployed, Retired)
7. In case you are studying, what are you studying? (Humanities, Social sciences, Natural sci-
ences, Formal sciences, other applied sciences, I am not studying)
8. Where did you live most of your life? (Big city with more than 1 million people/ Big city with
more than 100.000 people/ City with more than 10.000 people/ A village/ Countryside).
9. What are the main sources of your income? (work (full time), work (part time), parents,
scholarship, loan, other)
10. How much money do you spend in total over a month? (including food, clothing, rent, heating,
water, education, entertainment, etc... ) (1. less than 500C 2. 501C - 800C 3. 801C - 1200C
4. 1201C - 2000C 5. More than 2000C)
Section B: Self-assessment
In the next few questions, we are asking you to assess yourself and your behaviour. Please note
that there are neither right nor wrong answers. Take your time and think about each statement
carefully.
1. How risk-taking are you in general? (Please give a number between 0 and 10. Zero for
avoiding as much risk as possible and 10 for being very risk-loving).
25
2. Do you believe that two-people with the same qualifications should be paid equally, even when
one person is more productive than the other? (Yes/ No/ Not Sure).
3. What do you think of the following statement? (4-point scale from “totally agree” to “do not
agree at all”).
(a) . . . In general, people can be trusted.
(b) . . . Nowadays, we cannot trust on people so easily.
(c) . . . When you are dealing with stranger, it is better to be careful before you put your trust
into that person.
4. Do you believe that most people. . .
(a) . . . would take advantage of you when possible?
(b) . . . would try to be fair to you?
5. Would you say that people most of the time. . .
(a) . . . strive to be helpful to others?
(b) . . . strive only to fulfill their own interest?
Section C: Subjective experience
How well do the following statements describe your personality? On a scale from 1 to 5, 1 means
that you disagree strongly and 5 means that you agree strongly.
1. I see myself as someone who is reserved
2. I see myself as someone who is generally trusting
3. I see myself as someone who tends to be lazy
4. I see myself as someone who is relaxed, handles stress well
5. I see myself as someone who has few artistic interests
6. I see myself as someone who is outgoing, sociable
7. I see myself as someone who tends to find fault with others
8. I see myself as someone who does a thorough job
9. I see myself as someone who gets nervous easily
10. I see myself as someone who has an active imagination
Section D: Cognitive Reflection Test and other questions
Many thanks for answering our questionnaire. We would like you now to think about a few prob-
lems.
1. A bat and a ball cost $1.10 in total. The bat costs $1.00 more than the ball. How much does
the ball cost?
2. If it takes 5 machines 5 minutes to make 5 widgets, how long would it take 100 machines to
make 100 widgets?
26
3. In a lake, there is a patch of lily pads. Every day, the patch doubles in size. If it takes 48 days
for the patch to cover the entire lake, how long would it take for the patch to cover half of the
lake?
4. You have the choice between three products, A, B and C. You know that A is better than B but
not how C compares with A or B. Which of A, B or C do you choose?
5. One week ago, a colleague asked you for one more week to finish a project with you. He now
tells you he will need yet another week to finish, so the project will not be delivered in time.
What do you do?
(a) I wait one more week for my colleague to finish.
(b) I finish the project on my own so as to be in time.
B.2 Questionnaire for Phase 2
You are taking part in an experiment that is financed by the MPI for Economics. As stated in your
invitation email, this experiment consists of two phases. The second phase is starting now. Click
on “continue” to start phase 2.
Section A: Personal information
Same as section A of the first phase.
Section B: Self-assessment
1. I am ... (rather impatient — rather patient)
2. I tend to ... (to be directing others — to be directed by others)
3. I’m ... thinking about my inner problems. (seldom — especially often)
4. Others are ... with my work performance in general. (very satisfied — somewhat dissatisfied)
5. I trust others. (a great deal — very little)
6. I show ... of my needs for love. (a great deal — very little)
7. I ... tight connections to other human beings. (avoid — seek)
8. I can deal . . . with money compared to other people. (rather well — rather poorly)
9. I am . . . depressed. (rarely — often)
10. I have . . . self-confidence. (a lot of — very little)
11. I find it ... to be popular with others. (difficult — easy)
12. I ... have disputes with other people. (often — very rarely)
13. I feel . . . to other people ... (disconnected — close)
14. I give ... importance to my appearance. (little — a lot of)
15. It is ... for me to work closely with others. (difficult – rather easy)
16. I am ... critical of myself. (rarely – always)
27
17. I am ... compared to other (especially docile — particularly stubborn)
18. I am ... in defending my interests (rather poor — rather good)
19. People generally think of me as (a strong person — a weak person)
20. I find it ... to be attractive to others. (very difficult — very easy)
21. I find it ... to stick with what I am doing. (rather easy — rather difficult)
Section C: Subjective experiences
Same as section C of Phase 1
Section D: Cognitive reflection tests and other questions
Many thanks for answering our questionnaire. We would like you now to think about a few prob-
lems.
1. If it takes 20 minutes to cook a goose’s egg, then how many minutes does it take to cook three
geese’s eggs?
2. Linda is 31 years old, single, outspoken, and very bright. She majored in philosophy. As a
student, she was deeply concerned with issues of discrimination and social justice, and also
participated in anti-nuclear demonstrations. Which is more probable?
(a) Linda is a bank teller.
(b) Linda is a bank teller and is active in the feminist movement.
3. You have to choose between two applicants for a job at your company. That person will be
working with you for one year on a project. Person A is a 26 year old male with a Master
while Person B is a 22 year old woman with a Bachelor. Both are fully qualified for the job.
Which person do you choose to hire?
4. There are 9 black balls and one red ball in box A. A machine can draw balls from box A one
after the other at random and put them in box B. You will receive 1 euro for every ball in box
B unless one of those balls is red, in which case you get nothing. You must choose how many
balls the machine should take from box A and put in box B. How many balls would you ask
the machine to take from box A and put in box B?
28
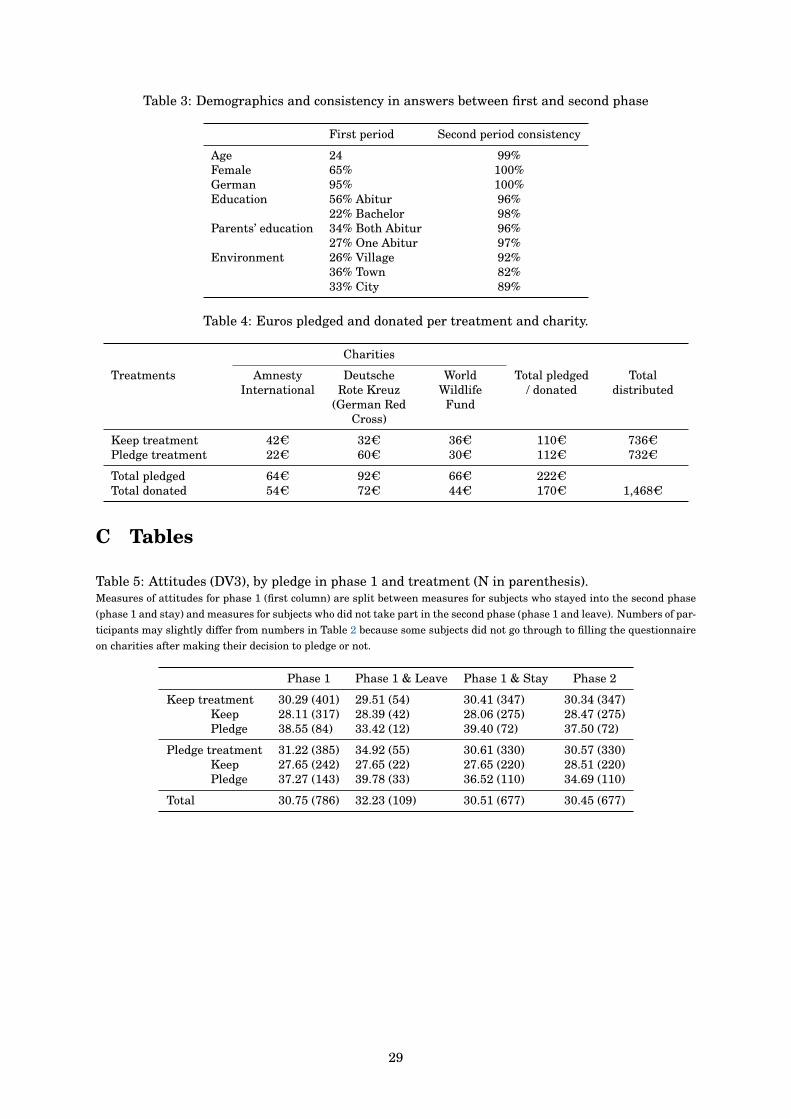
Table 3: Demographics and consistency in answers between first and second phase
First period Second period consistency
Age 24 99%Female 65% 100%German 95% 100%Education 56% Abitur 96%
22% Bachelor 98%Parents’ education 34% Both Abitur 96%
27% One Abitur 97%Environment 26% Village 92%
36% Town 82%33% City 89%
Table 4: Euros pledged and donated per treatment and charity.
Charities
Treatments AmnestyInternational
DeutscheRote Kreuz
(German RedCross)
WorldWildlife
Fund
Total pledged/ donated
Totaldistributed
Keep treatment 42C 32C 36C 110C 736CPledge treatment 22C 60C 30C 112C 732C
Total pledged 64C 92C 66C 222CTotal donated 54C 72C 44C 170C 1,468C
C Tables
Table 5: Attitudes (DV3), by pledge in phase 1 and treatment (N in parenthesis).Measures of attitudes for phase 1 (first column) are split between measures for subjects who stayed into the second phase
(phase 1 and stay) and measures for subjects who did not take part in the second phase (phase 1 and leave). Numbers of par-
ticipants may slightly differ from numbers in Table 2 because some subjects did not go through to filling the questionnaire
on charities after making their decision to pledge or not.
Phase 1 Phase 1 & Leave Phase 1 & Stay Phase 2
Keep treatment 30.29 (401) 29.51 (54) 30.41 (347) 30.34 (347)Keep 28.11 (317) 28.39 (42) 28.06 (275) 28.47 (275)Pledge 38.55 (84) 33.42 (12) 39.40 (72) 37.50 (72)
Pledge treatment 31.22 (385) 34.92 (55) 30.61 (330) 30.57 (330)Keep 27.65 (242) 27.65 (22) 27.65 (220) 28.51 (220)Pledge 37.27 (143) 39.78 (33) 36.52 (110) 34.69 (110)
Total 30.75 (786) 32.23 (109) 30.51 (677) 30.45 (677)
29
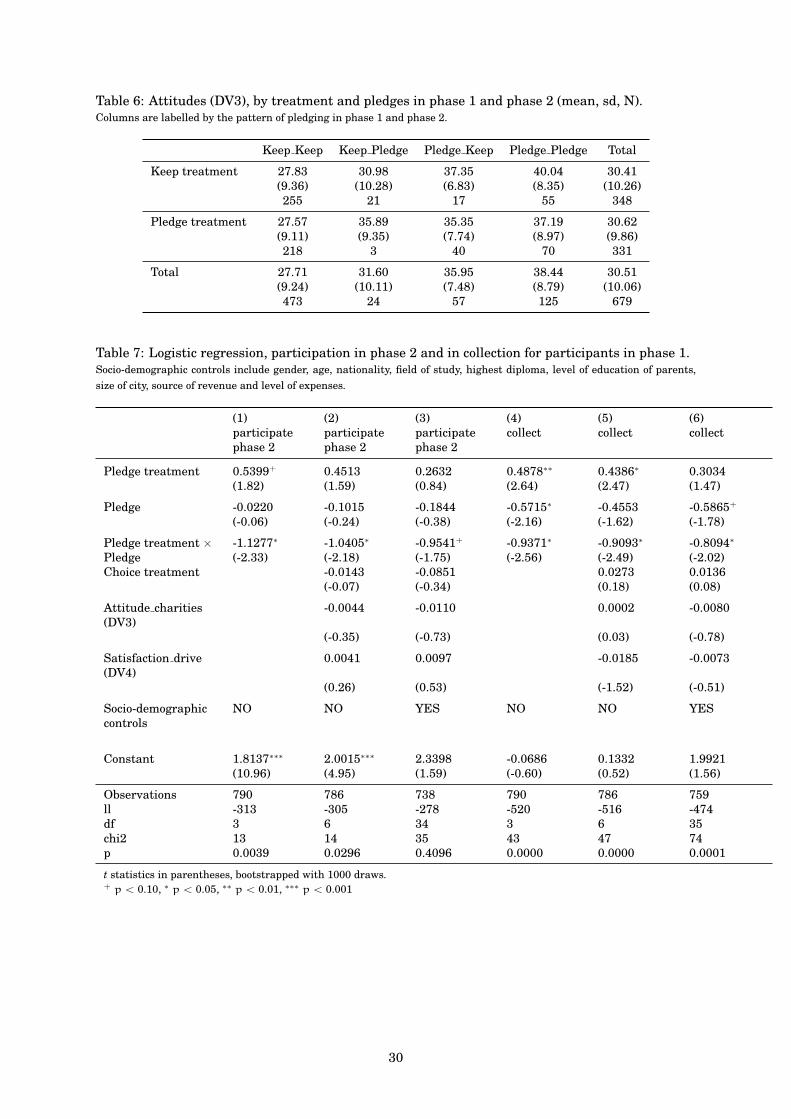
Table 6: Attitudes (DV3), by treatment and pledges in phase 1 and phase 2 (mean, sd, N).Columns are labelled by the pattern of pledging in phase 1 and phase 2.
Keep Keep Keep Pledge Pledge Keep Pledge Pledge Total
Keep treatment 27.83 30.98 37.35 40.04 30.41(9.36) (10.28) (6.83) (8.35) (10.26)255 21 17 55 348
Pledge treatment 27.57 35.89 35.35 37.19 30.62(9.11) (9.35) (7.74) (8.97) (9.86)218 3 40 70 331
Total 27.71 31.60 35.95 38.44 30.51(9.24) (10.11) (7.48) (8.79) (10.06)473 24 57 125 679
Table 7: Logistic regression, participation in phase 2 and in collection for participants in phase 1.Socio-demographic controls include gender, age, nationality, field of study, highest diploma, level of education of parents,
size of city, source of revenue and level of expenses.
(1) (2) (3) (4) (5) (6)participatephase 2
participatephase 2
participatephase 2
collect collect collect
Pledge treatment 0.5399+ 0.4513 0.2632 0.4878∗∗ 0.4386∗ 0.3034(1.82) (1.59) (0.84) (2.64) (2.47) (1.47)
Pledge -0.0220 -0.1015 -0.1844 -0.5715∗ -0.4553 -0.5865+
(-0.06) (-0.24) (-0.38) (-2.16) (-1.62) (-1.78)
Pledge treatment ×Pledge
-1.1277∗ -1.0405∗ -0.9541+ -0.9371∗ -0.9093∗ -0.8094∗
(-2.33) (-2.18) (-1.75) (-2.56) (-2.49) (-2.02)Choice treatment -0.0143 -0.0851 0.0273 0.0136
(-0.07) (-0.34) (0.18) (0.08)
Attitude charities(DV3)
-0.0044 -0.0110 0.0002 -0.0080
(-0.35) (-0.73) (0.03) (-0.78)
Satisfaction drive(DV4)
0.0041 0.0097 -0.0185 -0.0073
(0.26) (0.53) (-1.52) (-0.51)
Socio-demographiccontrols
NO NO YES NO NO YES
Constant 1.8137∗∗∗ 2.0015∗∗∗ 2.3398 -0.0686 0.1332 1.9921(10.96) (4.95) (1.59) (-0.60) (0.52) (1.56)
Observations 790 786 738 790 786 759ll -313 -305 -278 -520 -516 -474df 3 6 34 3 6 35chi2 13 14 35 43 47 74p 0.0039 0.0296 0.4096 0.0000 0.0000 0.0001
t statistics in parentheses, bootstrapped with 1000 draws.+ p < 0.10, ∗ p < 0.05, ∗∗ p < 0.01, ∗∗∗ p < 0.001
30
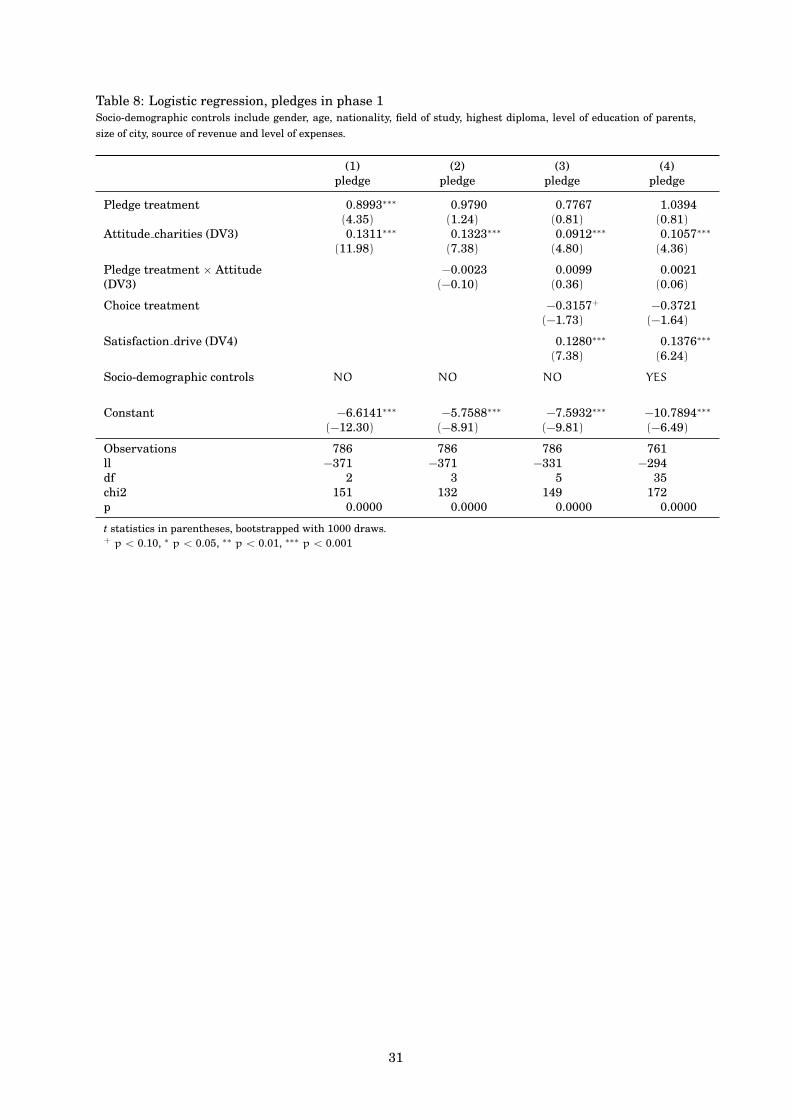
Table 8: Logistic regression, pledges in phase 1Socio-demographic controls include gender, age, nationality, field of study, highest diploma, level of education of parents,
size of city, source of revenue and level of expenses.
(1) (2) (3) (4)pledge pledge pledge pledge
Pledge treatment 0.8993∗∗∗ 0.9790 0.7767 1.0394(4.35) (1.24) (0.81) (0.81)
Attitude charities (DV3) 0.1311∗∗∗ 0.1323∗∗∗ 0.0912∗∗∗ 0.1057∗∗∗
(11.98) (7.38) (4.80) (4.36)
Pledge treatment × Attitude(DV3)
−0.0023 0.0099 0.0021(−0.10) (0.36) (0.06)
Choice treatment −0.3157+ −0.3721(−1.73) (−1.64)
Satisfaction drive (DV4) 0.1280∗∗∗ 0.1376∗∗∗
(7.38) (6.24)
Socio-demographic controls NO NO NO YES
Constant −6.6141∗∗∗ −5.7588∗∗∗ −7.5932∗∗∗ −10.7894∗∗∗
(−12.30) (−8.91) (−9.81) (−6.49)
Observations 786 786 786 761ll −371 −371 −331 −294df 2 3 5 35chi2 151 132 149 172p 0.0000 0.0000 0.0000 0.0000
t statistics in parentheses, bootstrapped with 1000 draws.+ p < 0.10, ∗ p < 0.05, ∗∗ p < 0.01, ∗∗∗ p < 0.001
31


![Ethical Guidelines for Nudging in Information Security ... · practice. Nudging has been applied in a variety of contexts (e.g. health [2], smoking [3] and obesity [4]). Digital nudging](https://static.fdocuments.us/doc/165x107/5f8b61e51157ad021841dfeb/ethical-guidelines-for-nudging-in-information-security-practice-nudging-has.jpg)